Quantifying Contributions of Climate Change and Local Human Activities to Runoff Decline in the Second Songhua River Basin


1
Key Laboratory of Groundwater Resources and Environment, Jilin Provincial Key Laboratory of Water Resources and Environment, Jilin University, Changchun 130021, China
2
State Key Laboratory of Hydrology-Water Resources and Hydraulic Engineering, Nanjing Hydraulic Research Institute, Nanjing 210029, China
3
Research Center for Climate Change, Ministry of Water Resources, Nanjing 210029, China
*
Author to whom correspondence should be addressed.
Water 2020, 12(10), 2659; https://doi.org/10.3390/w12102659
Submission received: 29 July 2020
/
Revised: 15 September 2020
/
Accepted: 15 September 2020
/
Published: 23 September 2020
(This article belongs to the Section Hydrology)
Abstract
:In the past several decades, climate change and human activities have influenced hydrological processes, and potentially caused more frequent and extensive flood and drought risks. Therefore, identification and quantification of the driving factors of runoff variation have become a hot research area. This paper used the trend analysis method to show that runoff had a significant downward trend during the past 60 years in the Second Songhua River Basin (SSRB) of Northeast China. The upper, middle, and lower streams of five hydrological stations were selected to analyze the breakpoint of the annual runoff in the past 60 years, and the breakpoints were used to divide the entire study period into two sub-periods (1956–1974 and 1975–2015). Using the water–energy coupling balance method based on Choudhury–Yang equation, the climatic and catchment landscape elasticity coefficient of the annual runoff change was estimated, and attribution analysis of the runoff change was carried out for the Fengman Reservoir and Fuyu stations in SSRB. The change in potential evapotranspiration has a weak effect on the runoff, and change in precipitation and catchment landscape were the leading factors affecting runoff. Impacts of climate change and land cover change were accountable for the runoff decrease by 80% and 11% (Fengman), 17% and 206% (Fuyu) on average, respectively; runoff was more sensitive to climate change in Fengman, and was more sensitive to catchment landscape change in Fuyu. In Fengman, the population was small, owing to the comparatively inhospitable natural conditions, and so human activities were low. However, in Fuyu, human activities were more intensive, and so had more impact on runoff for the Lower Second Songhua River compared to the Upper Second Songhua River.
1. Introduction
1.1. Attribution Analysis of Runoff Changes
Human development and progress are facing serious challenges in addressing three major problems: Population expansion, resource shortages, and environmental degradation [1]. All three issues are closely related to water resources, and the issue of water resources in China has been growing since the 1980s [2,3]. Research shows that the measured runoff at the main control stations has significantly decreased in Chinese rivers [4]. Climate change (precipitation and potential evaporation) and human activities (land cover, reservoir operations, and withdraw water) are the major drivers altering hydrological processes, which potentially cause more frequent and extensive flood and drought risks [5]. The risks have been impacting the economy, society, and the environment for decades [6]. Any changes within the climate system and the impacts of human activities at each link will be reflected in runoff. Thus, the identification and quantification of the driving factors of runoff variation have become a hot research area. A quantitative evaluation of the response of runoff to climate change and human activities is not only a scientific issue in the field of environmental change research, but also a problem faced by hydrological scientists.
In the separation of contributions from runoff influencing factors, accurately assessing the contribution of different factors to runoff changes is difficult in research. The main methods to quantitatively analyze the contribution of climate change and the catchment landscape to runoff include statistical analysis and hydrological models [7]. Hydrological models have become an important tool in hydrologic research, and have been widely applied to many locations worldwide. Critical to success is the selection of the appropriate hydrologic model based on the natural geographical conditions of a basin, and the calibration of the model parameters using hydrological data collected for areas not affected by humans [8]. Thereafter, the runoff in periods affected by human activity is predicted by the hydrological model, and the deviation between predicted and measured values shows the influence of catchment landscape conditions [9]. However, the uncertainty associated with hydrological models is just one of the problems associated with their use [10]. First, the model parameters are difficult to quantify because of the high uncertainty caused by the impact of human activities. Second, it is difficult to validate a model due to the lack of measured data. The randomness of results is relatively large and underrepresented. Furthermore, several studies [7,11,12] have shown that due to the uncertainty of model structure and parameter calibration, different modeling methods may have different results.
The main statistical method is the Budyko hypothesis; this has been used to analyze the change of runoff to climate change. Wang and Hejazi [13] quantified the relationship between climate and direct human impacts on annual runoff in 413 US catchments based on the Budyko hypothesis. In their study, the impact of human activities was simply estimated by subtracting climate impact from the total runoff change. Some scholars have introduced precipitation and temperature into the climate elasticity coefficient [14,15,16], and established a two-parameter climate elasticity model including precipitation and temperature [17]. Roderick and Farquhar [18] derived an analytical expression for the effects on runoff of small perturbations in precipitation, potential evaporation, and a parameter representing the catchment properties using the Choudhury–Yang equation [3,19]. The use of elasticity is preferable to a simple rate of change, as it elegantly captures the impact of a given change on the normal state of a system. Because the water–energy balance equation expresses the non-linear interaction between climate and hydrology, the elastic coefficient can be used as an index to describe the sensitivity of runoff to climate, which refers to the percentage change in runoff caused by climate change (precipitation and potential evapotranspiration). The greater the absolute value of the elastic coefficient, the greater the impact of the corresponding meteorological characteristics on runoff. Among the above methods, the process-based approaches are more complicated with high uncertainty in their parameters compared with other simple models. Empirical approaches use simple linear relationships derived from long-term historical data, but generally lack physical meanings. Conceptual models built on the principle of catchment water–energy balance are potentially useful for investigating the catchment hydrological response to environmental.
1.2. Previous Studies in Second Songhua River Basin
The Second Songhua River Basin (SSRB) is the largest river in Jilin Province, covering the old industrial base in Northeast China, and is an important commodity base in China. Many previous studies have shown a decreasing trend in runoff under the combined influence of human activities and climate change in the SSRB [20,21,22,23]. For example, Li [21] concluded that human activities played a major role in the reduction of runoff. Cao [24] used single-factor linear regression, single-factor hydrothermal coupling, and multi-factor hydrothermal coupling and found that the contribution of climate change and human activities on runoff change are 60.77–66.05% and 38.23%, respectively. Different models/methods have been used to get different conclusions. Therefore, it is necessary to adopt a unified analysis method and a unified data series to systematically analyze the main control factors of the annual runoff reduction in SSRB. Previous studies mainly used the Budyko hypothesis equation to analyze the runoff changes related to climate change; the impact of human activities was only estimated from the total runoff change by subtracting the climate impact. However, these studies [21,24] did not evaluate the impact of land use/cover changes.
1.3. The Objectives of This Paper
The present study focuses on attribution analysis on the change of natural water resources available in SSRB. It aims to attribute the natural runoff change to climate variability and land use/cover change using the catchment water–energy balance equation (i.e., Choudhury–Yang equation) in order to avoid infrastructure influence on streamflow and obtain a better understanding of change in natural water availability. Finally, a reasonable water resource management strategy is proposed.
2. Description of the Study Area
2.1. Study Area
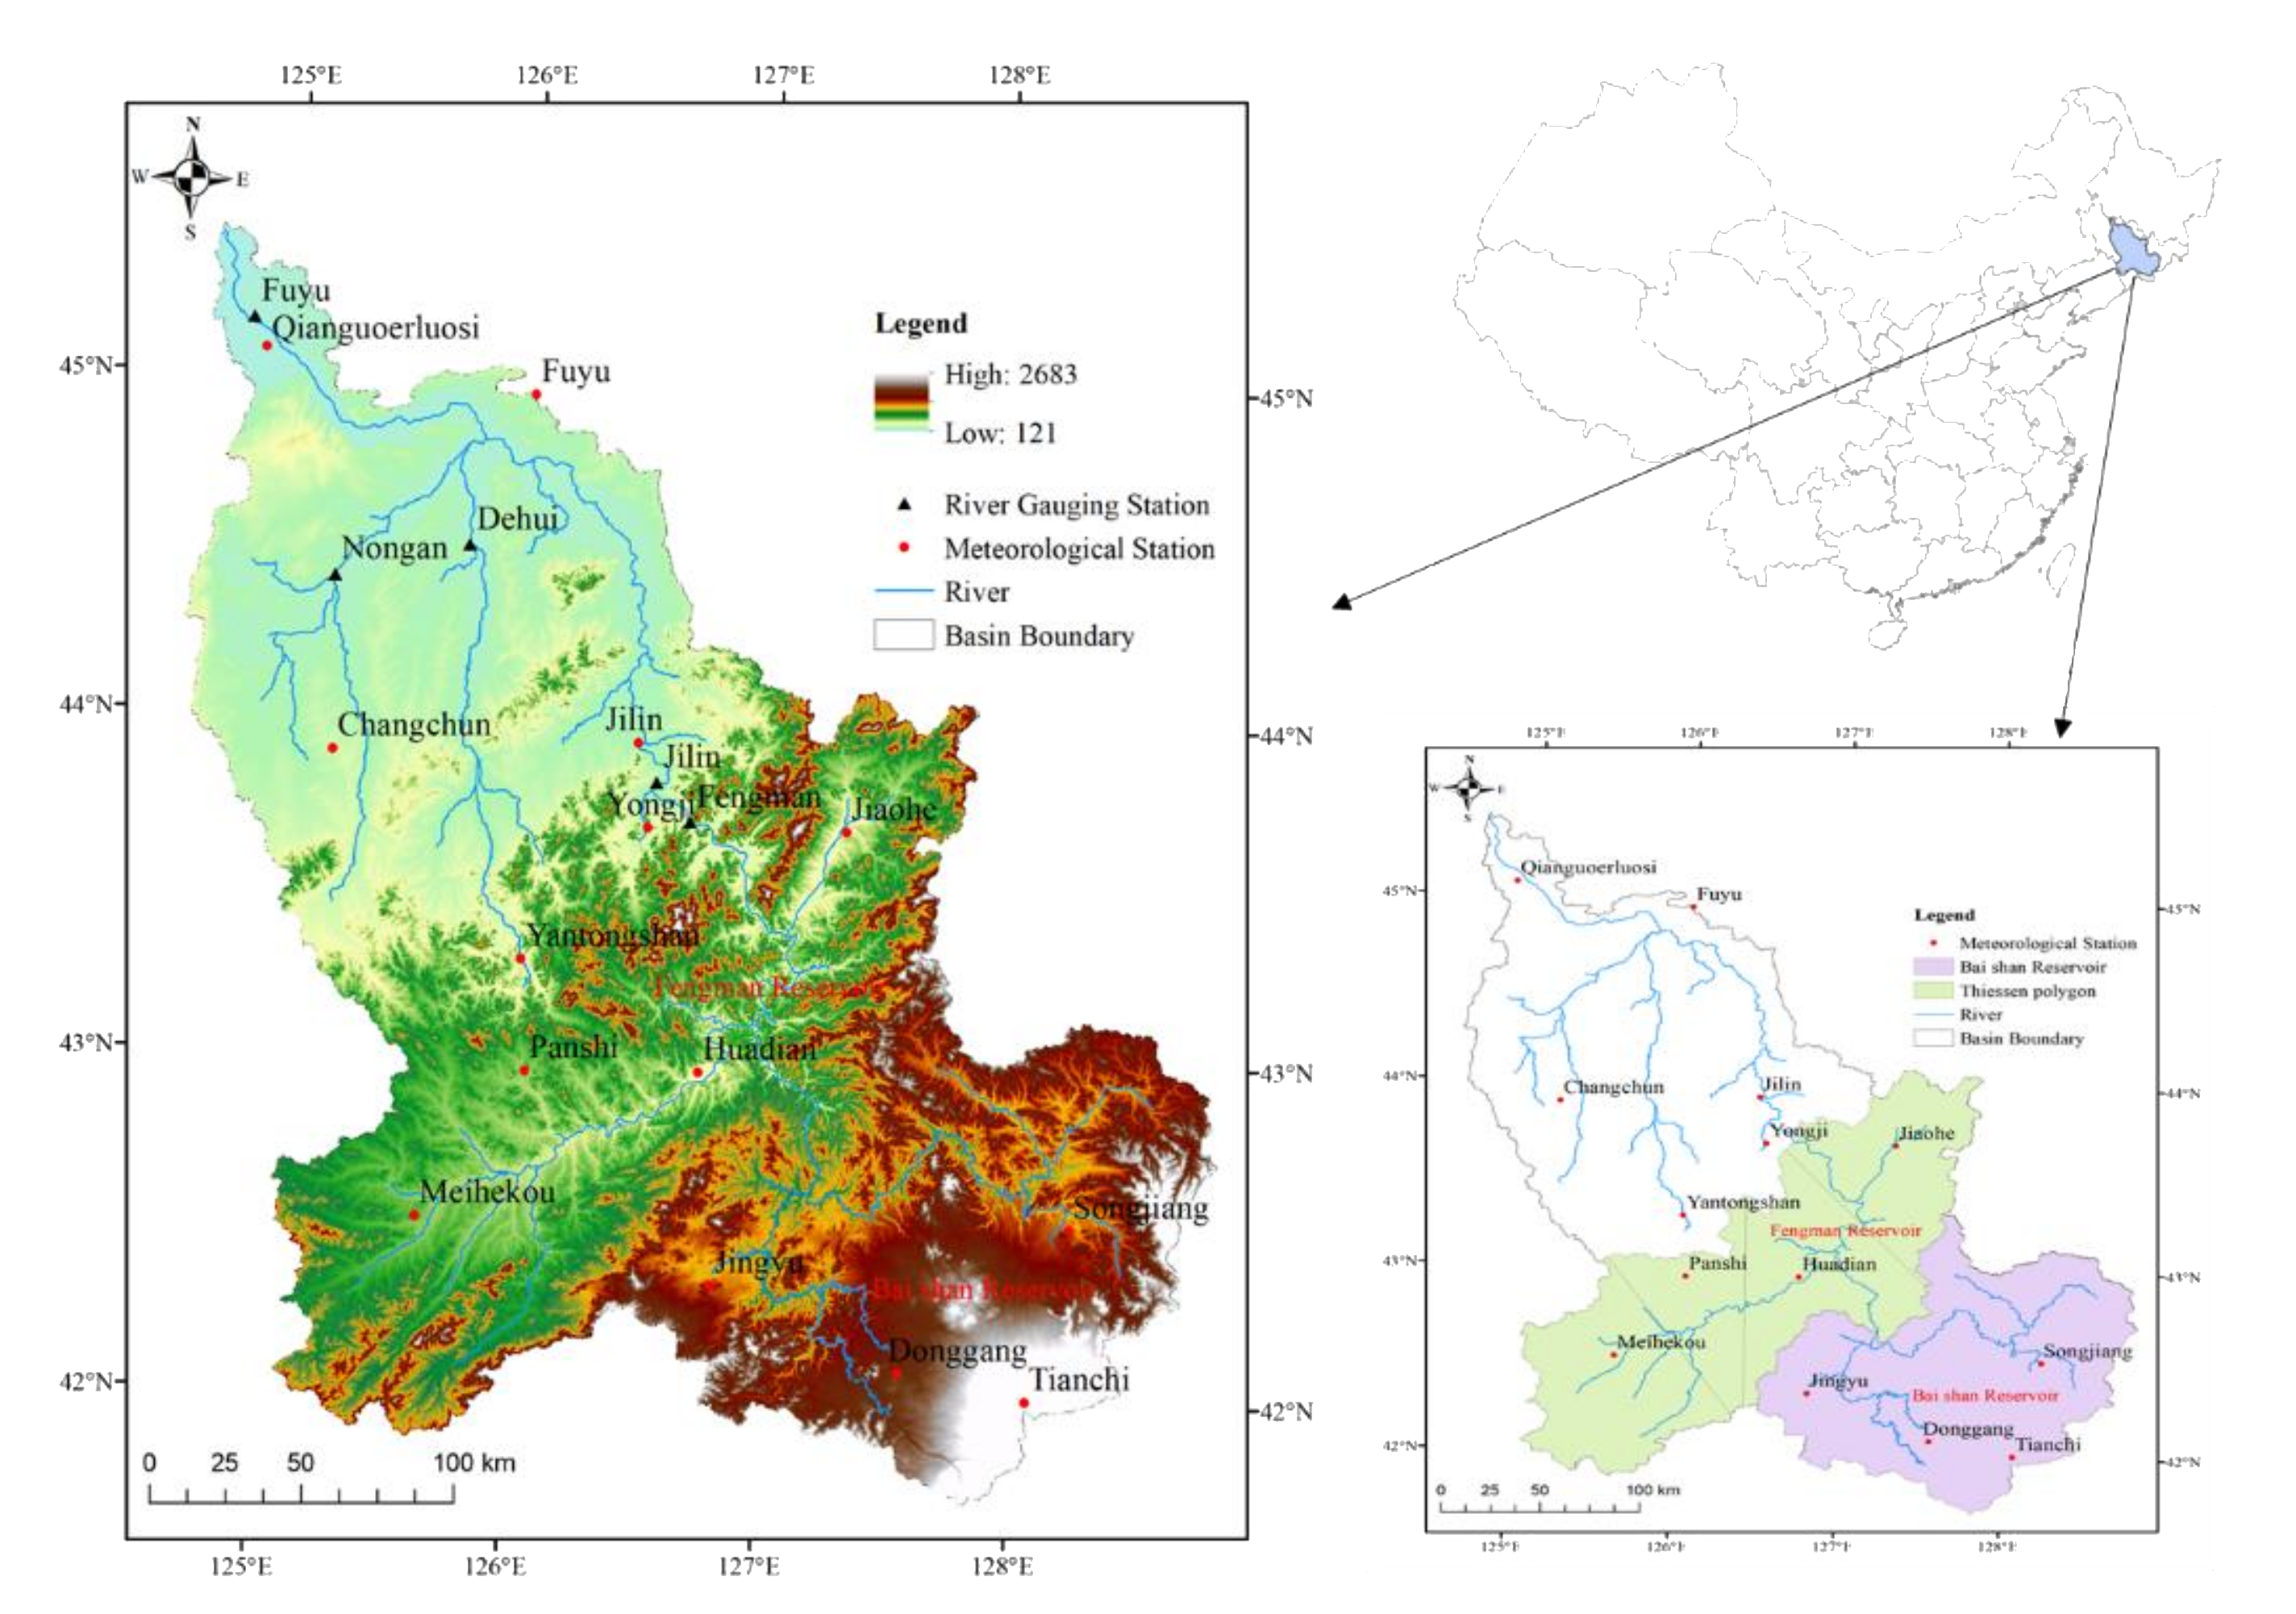
The SSRB (124°36′–128°50′ E and 41°44′–45°24′ N) originates from two locations near the main peak of the Changbai Mountains in Northeast China. It drains a catchment area of about 78,182 km2, with an annual mean discharge of 14.8 km3. The precipitation is mainly concentrated during June to September with an annual total of about 668 mm. Monthly average temperature fluctuates from −19 in January to 22 °C in July, with the annual average about 2.5 °C [25]. The total length of the Second Songhua River is 958 km flowing from southeast to northwest. The river channel in the upstream region passes through narrow valleys. The width of the river is less than 100 m, and the slope is very steep; therefore, the flow is swift and there are many rapids and shoals. Approaching the Lower Fengman Reservoir, the Second Songhua River flows through hilly plains where the channel slope decreases, and the river widens to 300–400 m. After it merges into the Yinma River, the Second Songhua River enters a plain where the river channel becomes even wider (1000–2000 m) and the channel slope is flatter. The Second Songhua River merges with the Songhua River, which is in the Sancha River Basin, as shown in Figure 1.
2.2. Data
Daily precipitation records and other meteorological data were collected, including daily mean temperature, wind speed, sunshine duration, vapor pressure, and relative humidity, from the National Meteorological Information Center of the China Meteorological Administration (CMA) (http://data.cma.cn/). Based on the meteorological data, potential evapotranspiration was estimated using the Penman–Monteith equation recommended by the Food and Agriculture Organization of the United Nations (FAO). Precipitation and potential evapotranspiration are a point of measurement data; because Fengman is a reservoir, the Thiessen polygon method was used to calculate the average precipitation and potential evapotranspiration in Fengman reservoir. Annual runoff data of five hydrological stations (Dehui, Nongan, Jilin, Fengman, and Fuyu) were measured by the Songliao Water Resources Commission of the Ministry of Water Resources (http://www.slwr.gov.cn/); the natural runoff was obtained by reverting the measured runoff (Figure 2). Data over the period 1956 to 2005 were obtained. Annual temporal and spatial data of land use (Figure 3 and Figure 4), population (Figure 5) and GDP (Figure 6) were obtained from Resource and Environment Data Cloud Platform (http://www.resdc.cn/).
3. Methodology
This study firstly estimated the elasticity of runoff through the Choudhury–Yang equation based on the climate and landscape conditions of the study area; secondly, through using statistical methods to analyze the trend of runoff, detecting the mutation points of annual runoff, and dividing the time series into two periods; and thirdly, with attribution analysis of runoff changes in SSRB. Tests for the detection of significant trends in climatologic time series can be classified as parametric and non-parametric methods. Parametric trend tests require data to be independent and normally distributed, while non-parametric trend tests require only that the data are independent. In this study, three non-parametric methods (Sen’s slope estimator [26], the Mann–Kendall test [27,28], and Spearman’s rank correlation [29]) were used to detect trends in meteorological variables.
3.1. Sen’s Slope Estimator
Sen [26] developed a non-parametric procedure for estimating the slope of a trend in the sample of N pairs of data. For the time series , the calculation equation for Sen’s trend slope is:
where and are the data values at times and (>), respectively, and is the number of time periods. The variable indicates the average rate of change and thus the trend of the time series. When , the sequence is increasing; when , there is no trend; and when , the sequence displays a decreasing trend. A hypothesis test is obtained by calculating the 95% confidence interval for Sen’s slope; if the upper and lower bounds of the interval do not include 0, the trend is statistically significant at the chosen level of confidence.
3.2. Mann–Kendall Test
The Mann–Kendall test [27,28] has been widely used for the trend analysis and mutation point tests of hydrologic time series. The following statistical variable can be defined:
where is the variance of the statistic ; is the number of data points, ; is the number of tied groups; and denotes the number of ties of extent i. A tied group is a set of sample data having the same value.
Trends are tested at a specific significance level. When , the hypothesis is accepted, i.e., the trend is not significant. Otherwise, the hypothesis is accepted; that is, indicates a significant upward trend in the sequence, and indicates a significant downward trend in the sequence. Typically, a 5% significance level () is used, analogous to a confidence interval of 95%.
obeys the standard normal distribution, which is a statistical sequence according to the order of the time series . The Mann–Kendall test can be used to analyze the mutation point. In this test, the above process is repeated to calculate a new statistic by evaluating the reverse of the time series , i.e., ., such that and . If or , the time series shows an increasing trend; otherwise, the time series shows a decreasing trend. When either or exceeds a pre-selected critical value, the rising trend is significant, and the range of the critical value determines the time when the mutation occurs. If the intersection of plotted curves for and occurs in the critical line, the intersection point corresponds to the start time of the mutation.
3.3. Spearman’s Rank Correlation
The null hypothesis () in the Spearman rank correlation test [29] assumes that all the samples in the time series are independent and identically distributed; the alternative hypothesis () assumes that the data series exhibits an increasing or decreasing trend. In the Spearman non-parametric test method, the statistic D and the standardized test statistic are defined by Equations (4) and (5), respectively:
where is the observed value; is the rank of the observation value in the time series, that is, the cardinal number corresponding to the rank order of each observation; is the length of the time series; and refers to the trend of the time series.
When , the null hypothesis is rejected and there is a significant trend in the time series data; otherwise, the null hypothesis is accepted, and no trend in the time series exists. If , the time series shows an increasing trend with time; otherwise, the time series shows a decreasing trend. The value can be found using a t-distribution table. For example, when = 0.1, = 1.299.
3.4. Pettitt Mutation Point Test
The Pettitt mutation point test [30] method assumes that the random hydrological sequence Y has a mutation in time t. The time series with t as the dividing point has two halves: and .
Taking , the mutation point statistic is calculated using the following Equation:
If the corresponding time for meets the criterion , the null hypothesis is rejected, indicating the presence of a mutation point at time ; otherwise, the null hypothesis is accepted, indicating that no mutation point is present in the series.
The significance level of a mutation point is defined.
Thus, for a significance level of 5%, if , a significant mutation point exists.
3.5. Climate and Catchment Landscape Elasticity of Runoff
Under certain climate and catchment landscape conditions, the long-term catchment water balance equation is expressed as:
where R is mean annual runoff, P is the mean annual precipitation, E is the mean annual actual evaporation.
According to Equation (11), . The elasticity coefficient indicates the proportion of runoff (R) change caused by changes in climatic factors (precipitation and potential evaporation) and catchment landscape (parameter ) per unit percentage. The total differential of R can be expressed as:
The precipitation elasticity of runoff can be expressed as . Similarly, the potential evaporation elasticity of runoff can be expressed as , and the catchment landscape elasticity of runoff can be expressed as . According to Equation (10), we can get the following form:
in which the precipitation, potential evaporation, and catchment landscape elasticities of runoff are given as:
3.6. Attribution Analysis of Runoff Changes
The upper, middle, and lower streams of five hydrological stations were selected to analyze the breakpoint of the annual runoff in the past 60 years, and the breakpoints were used to divide the entire study period into two sub-periods (1956–1974 and 1975–2015). The study period is divided into two sub-periods. The multi-year average runoff depth in period 1 (1956–1974) is recorded as R1, and the multi-year average runoff depth in period 2 (1975–2015) is recorded as R2. The change in annual runoff from period 1 to period 2 can be used for the annual average runoff depth of the two periods before and after and can be written as:
The change in runoff depth () can be attributed to the impact of changes in climate and catchment landscape. This paper further refines the impact of climate changes in precipitation () and potential evapotranspiration (). The change in runoff caused by the change of the catchment landscape is expressed by the change in runoff () caused by the change in parameter n, because n reflects the characteristics of the catchment landscape, which is include topography, soil type, and vegetation cover. Since the topography and soil of the watershed will not change significantly in a short time, it can be considered that the change of n mainly comes from the change of land use and vegetation cover.
where is the change in runoff due to climate change, is the change in runoff due to the change of land use and vegetation cover.
According to the climatic elastic coefficients ( and ) and catchment landscape coefficients () of runoff, the changes in runoff caused by precipitation, potential evapotranspiration, and changes in catchment landscape (parameter n) can be estimated respectively. The formula is as follows:
Where , and , , , and represent change in mean annual precipitation, potential evaporation, and catchment landscape condition from period 1 to 2.
The relative contributions to runoff change by precipitation, potential evaporation, and catchment landscape condition are calculated as:
where , , and are contribution of change in precipitation, potential evaporation, and catchment landscape condition, respectively.
4. Results
4.1. Climate and Catchment Landscape Elasticity of Runoff
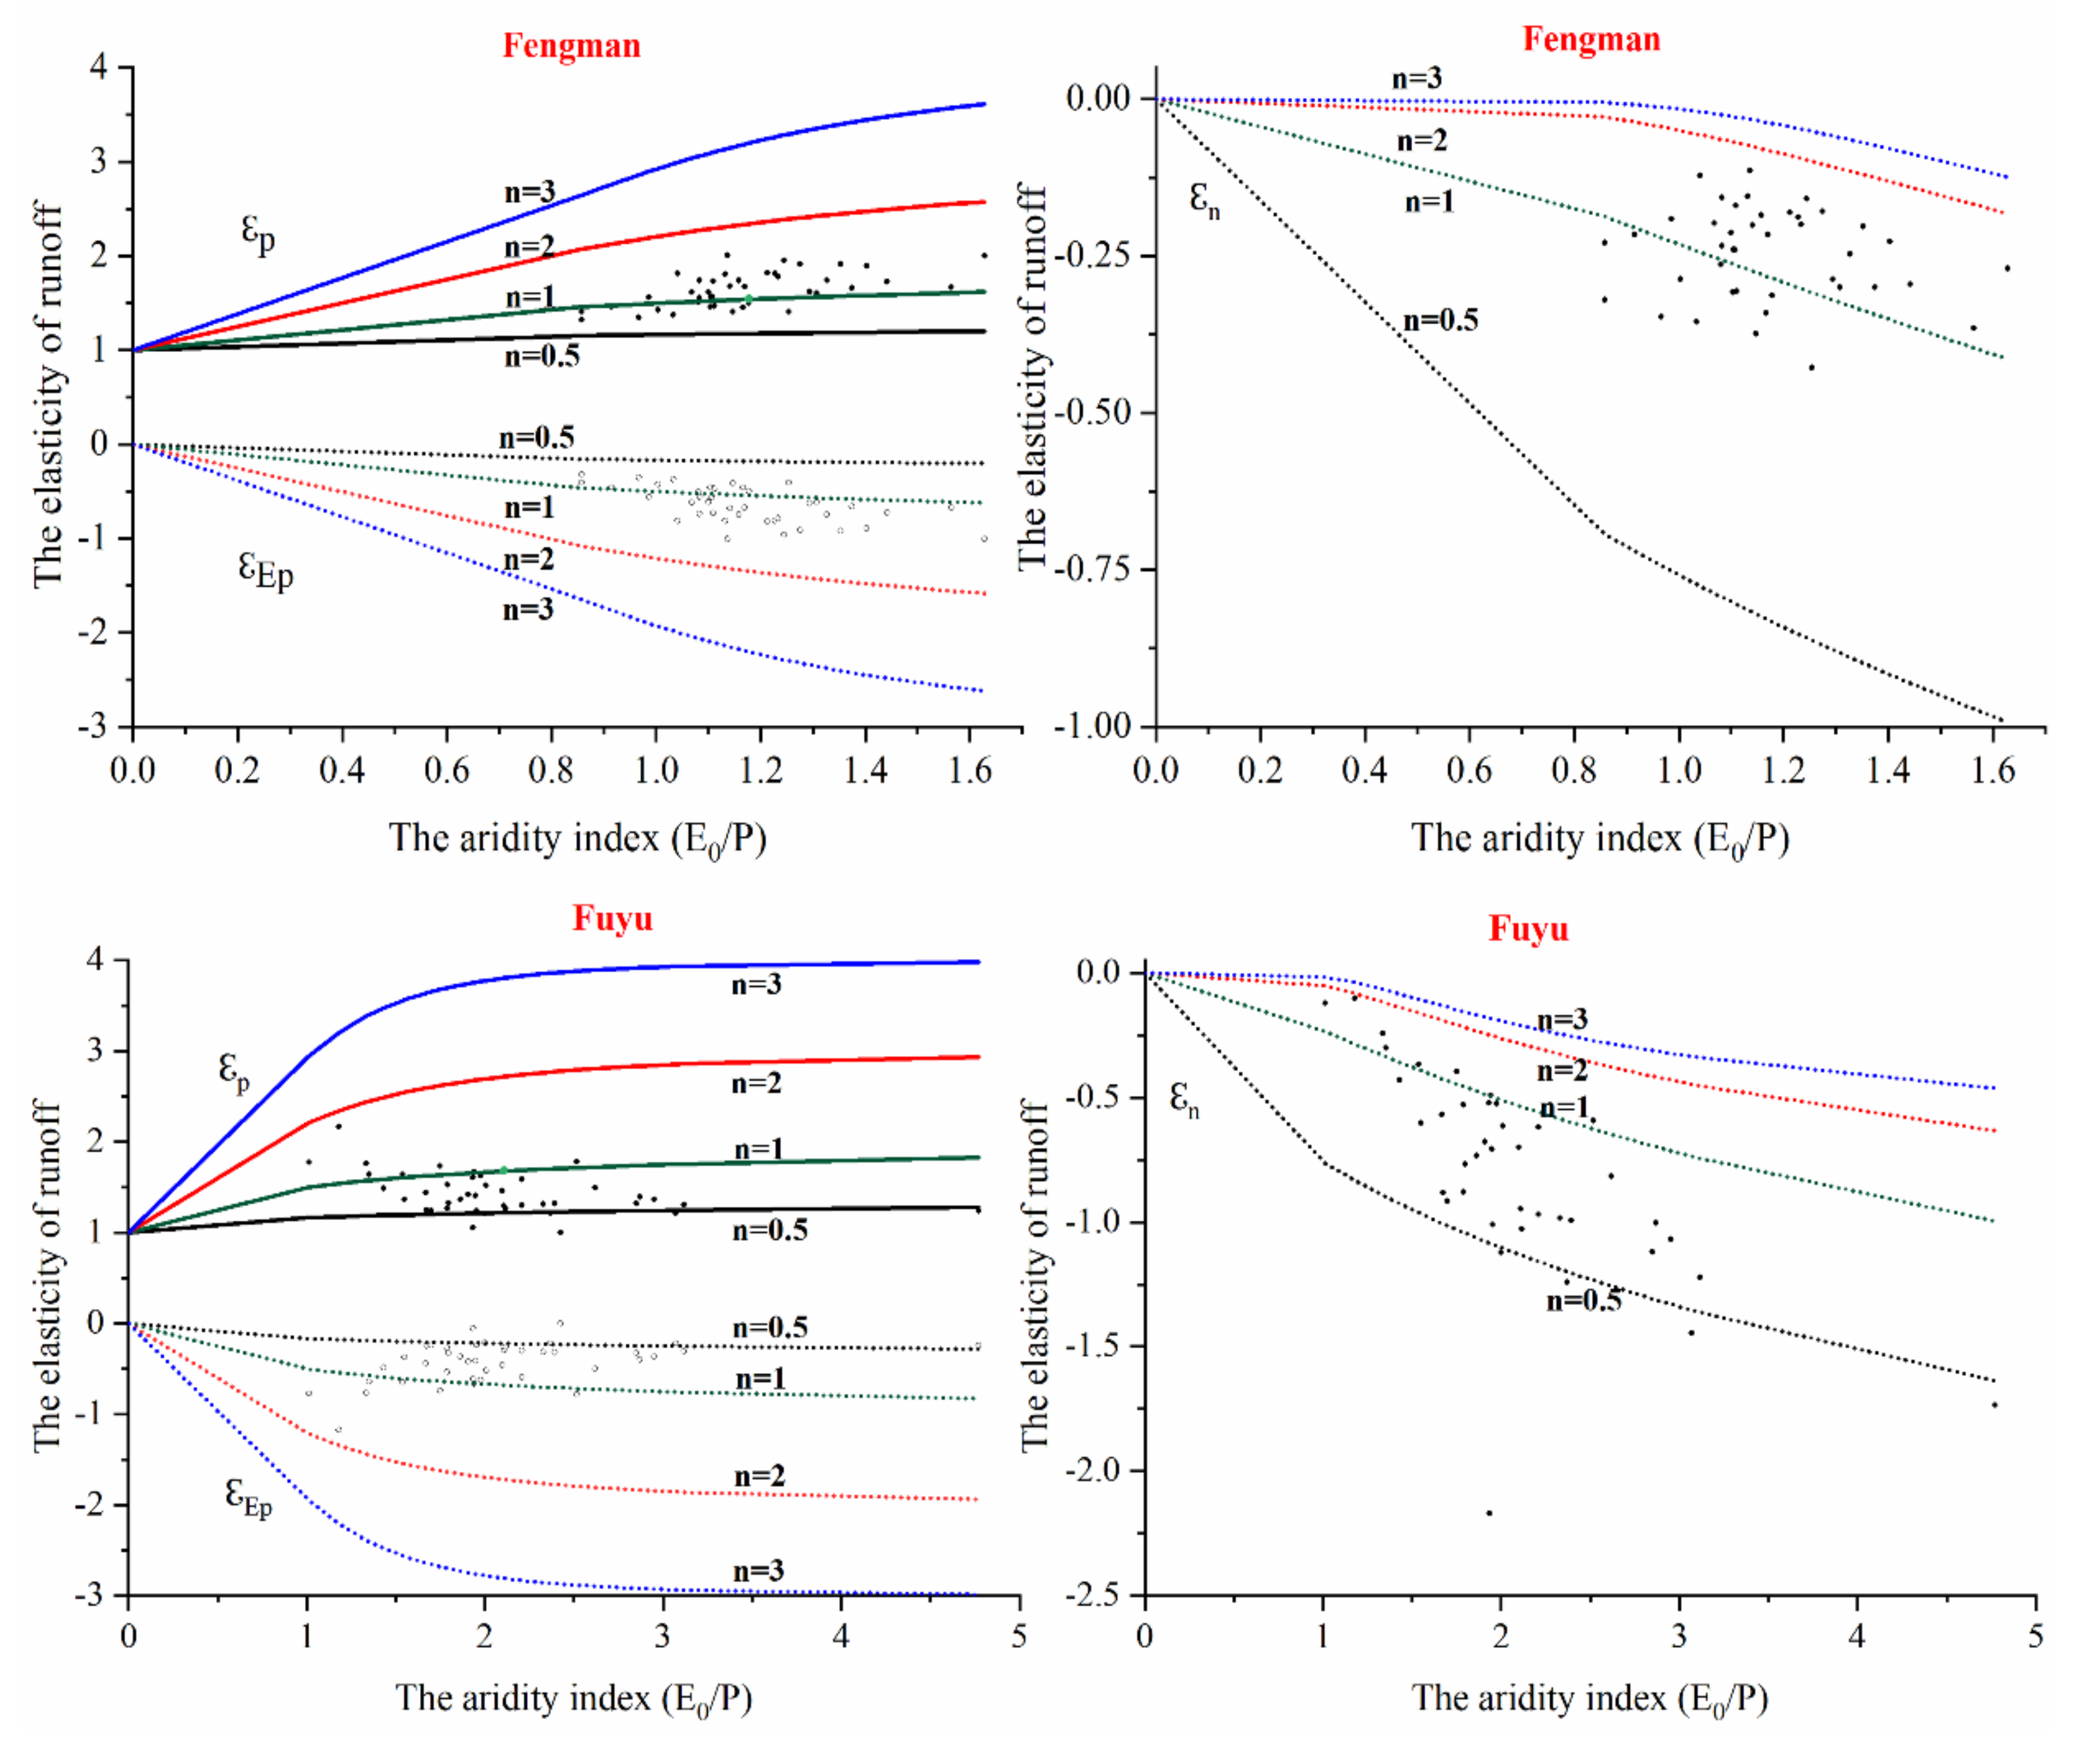
The Fengman and Fuyu stations on the main stream of the SSRB were selected for analyzing the impact of human activities on runoff in the SSRB. According to Penman’s [31] definition, the ratio of possible evapotranspiration (PE) to precipitation (P) is dryness (K), and the calculation formula is as follows: K = PE/P; so, aridity index, E0/P. Figure 7 shows the relationship between the elasticity of runoff variation with climate condition and catchment landscape parameter () at different aridity index, E0/P, values for Fengman and Fuyu. The line represents the theoretical value of elastic coefficient under different catchment landscape conditions (indicated by the parameter ), the “point” in the Figure 7 represents the runoff elastic coefficient, including precipitation, potential evaporation, and catchment landscape parameter (), and its value is based on the meteorological data for 1956–2015. The absolute value of the elastic coefficient of a watershed reflects the sensitivity of the runoff of the watershed to this factor. Under the same catchment landscape conditions (parameter ), although the absolute values of the climate and the catchment landscape elasticity coefficient both increase with the increase in the drought index, when the drought index reached a certain value, the climate elasticity coefficient changes slightly, while the absolute value of the catchment landscape elasticity coefficient maintained a significant increasing trend (Figure 7). In different climatic regions, the watershed runoff had obvious differences in sensitivity to climate change and catchment landscape changes: In humid regions, runoff was insensitive to climate and catchment landscape changes; in drier climates, runoff was sensitive to both climate and catchment landscape changes.
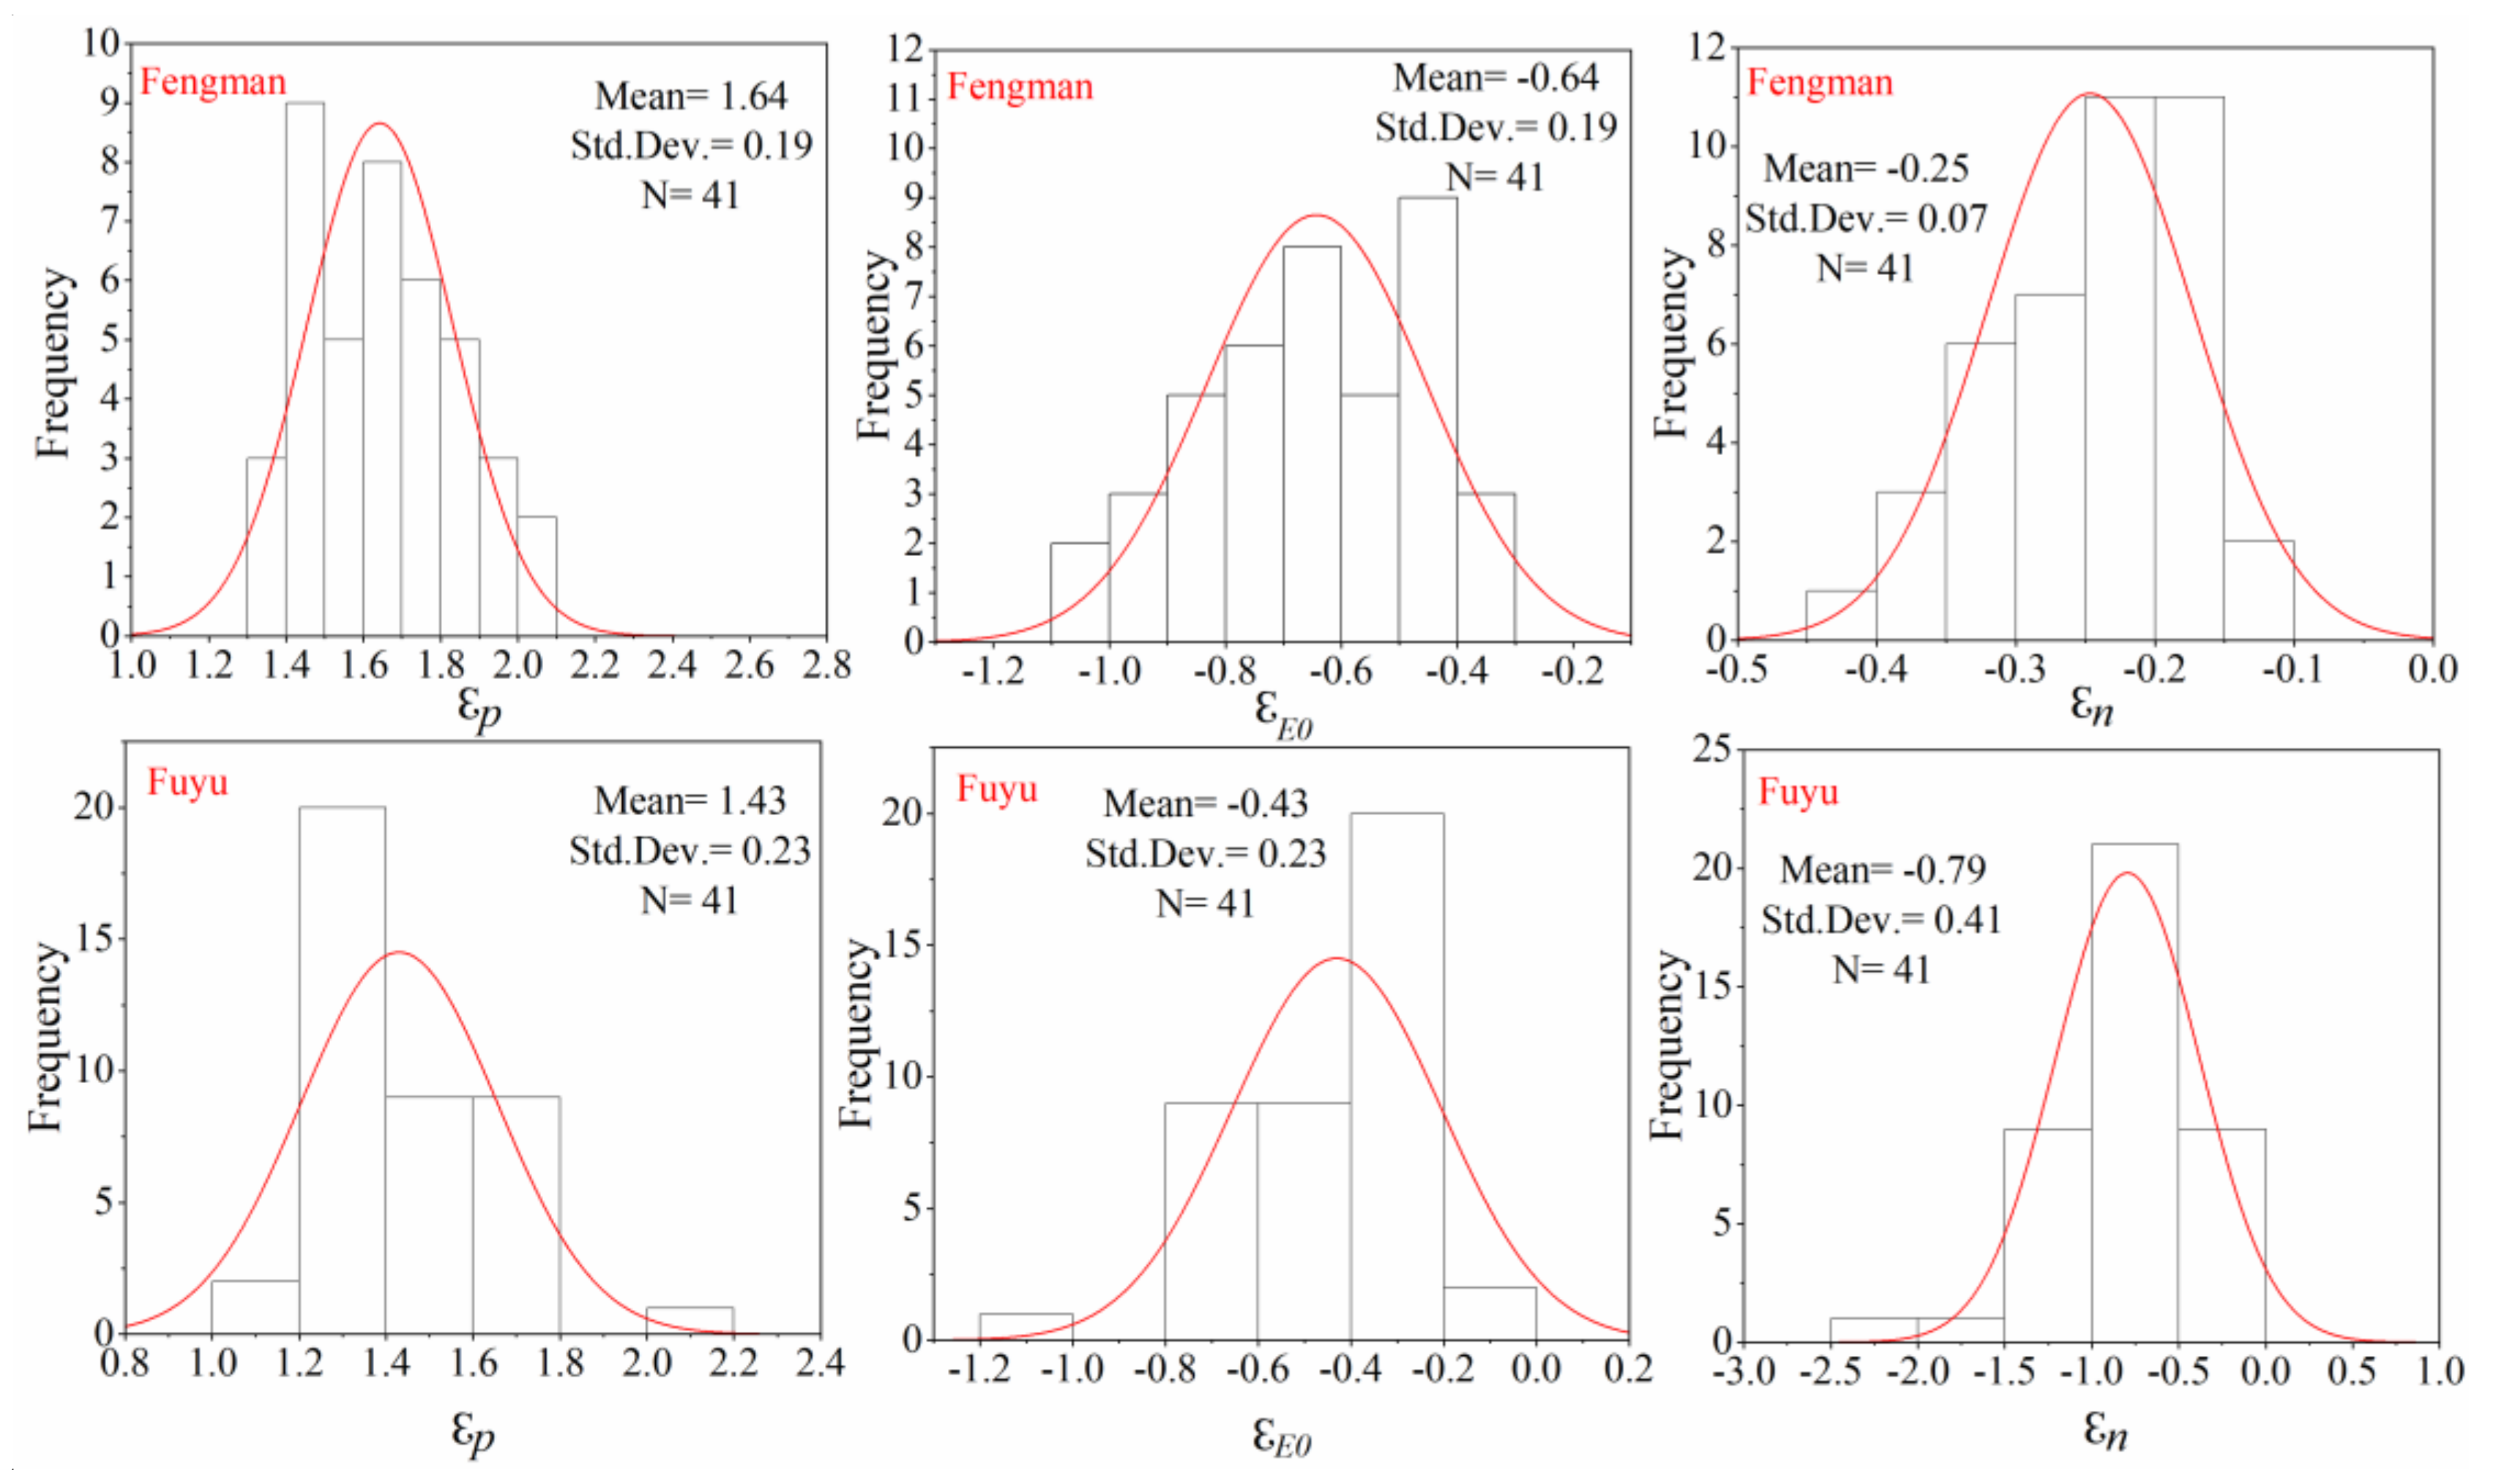
The elasticity coefficients of , , and were calculated in Figure 8. In the Fengman Reservoir, most values were in the range of 1.4–2.0, with a mean value of 1.64; was between −1 and −0.4, with a mean of −0.64; and was between −0.4 and −0.15, with a mean of −0.25. In the Fuyu Station, most values ranged within 1.2–1.8, with a mean of 1.43; was distributed between −1 and −0.4, with a mean of −0.43; and was between −1.5 and 0.0, with a mean of −0.79. At Fengman Reservoir, the average value of the elasticity coefficient indicated that a 10% increase in precipitation would cause a 16.4% increase in runoff; in contrast, 10% increase in potential evapotranspiration would result in a 6.4% reduction in runoff, and 10% change in n would result in a 2.5% reduction in runoff. At Fuyu, a 10% increase in precipitation would cause a 14.3% increase in runoff; in contrast, a 10% increase in potential evapotranspiration would result in a 4.3% reduction in runoff, and 10% change in n value would result in a 7.9% reduction in runoff. Additionally, was significantly greater than . Therefore, the runoff in the watershed was more sensitive to precipitation.
4.2. Statistical Trends and Change Point of Annual Runoff
The Sen slope-estimation method was applied to judge the true slope of the runoff time series. The advantage of this method is that it is not affected by the lack of data or data error; furthermore, the principle is simple, and the technique is easy to use [26]. Both the Mann–Kendall and Spearman methods are widely used to analyze the characteristics of trends in time series [27,28,29]. These methods cannot only test trend change in a time series, but can also illustrate the extent of the trend change and can well describe the trend features of a time series. The Mann–Kendall method can be used as a trend test, but can also be used to determine an approximation of the mutation point in a time series. However, the Pettitt method is not only able to determine the time of the occurrence of the mutation point, but also can give the significance of the mutation point [30]. Thus, the Pettitt method is superior to the Mann–Kendall method for detecting mutation points and was selected for examining the watershed meteorological and hydrological elements [32].
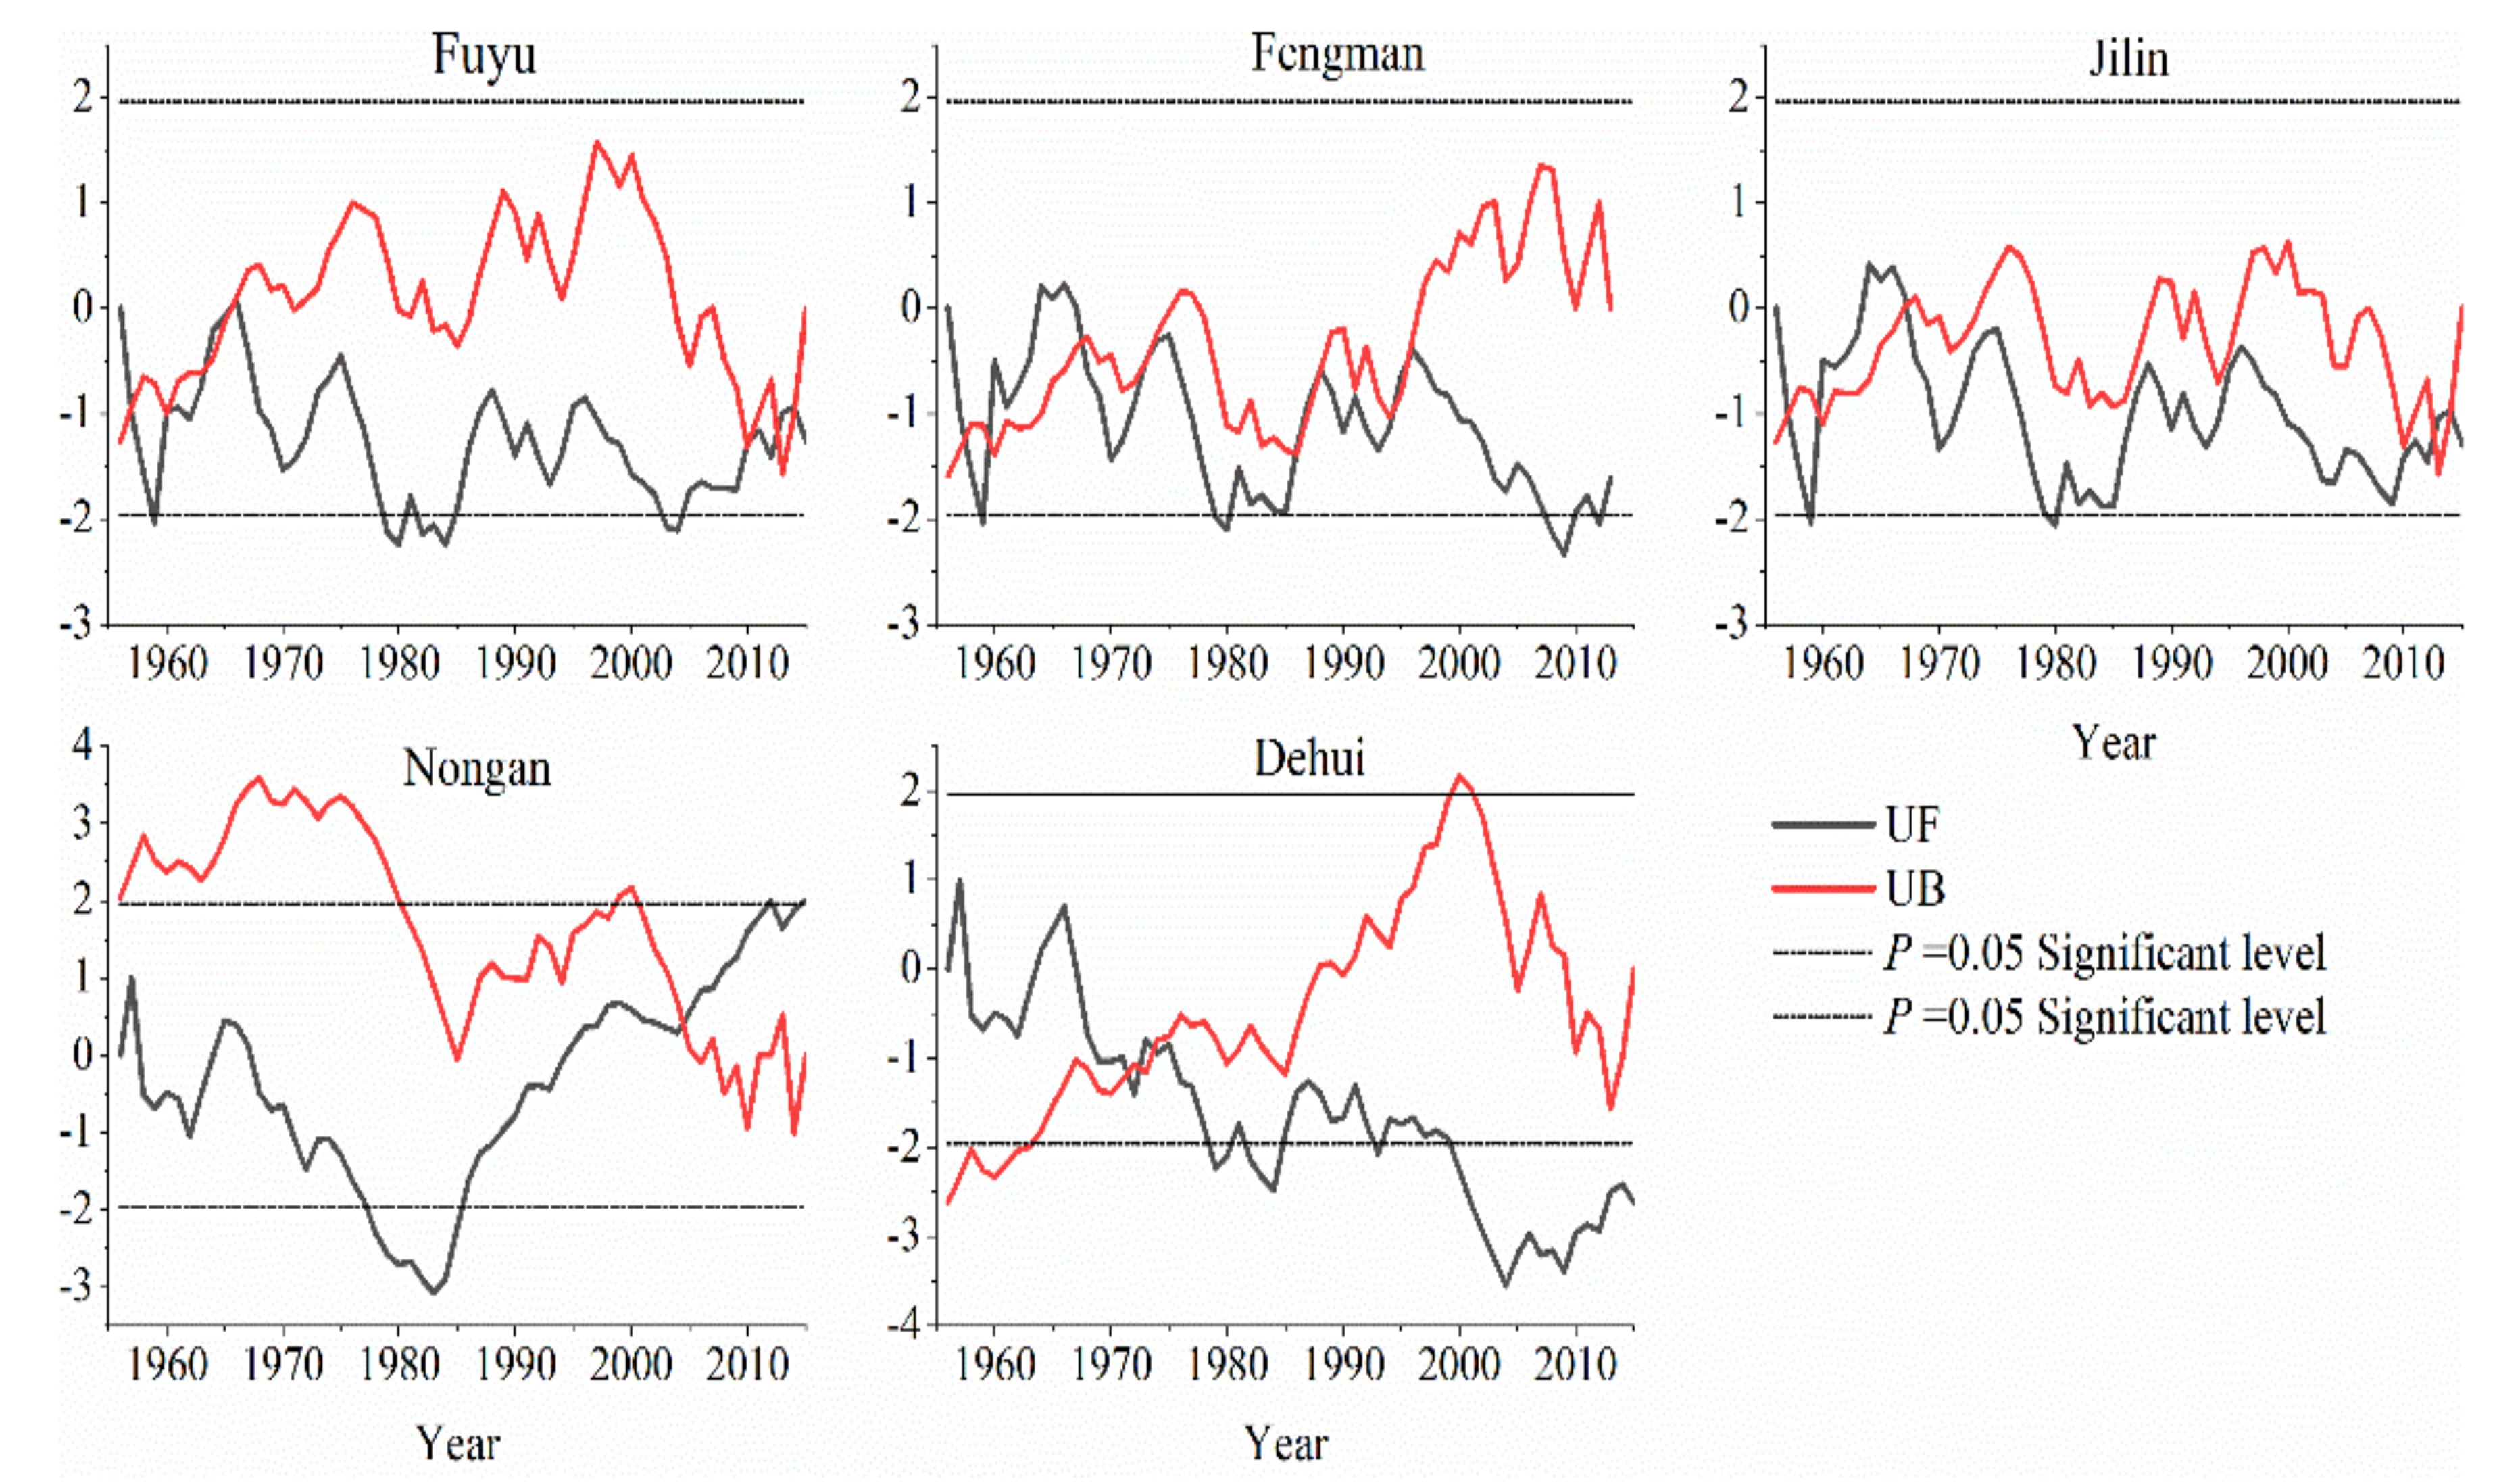
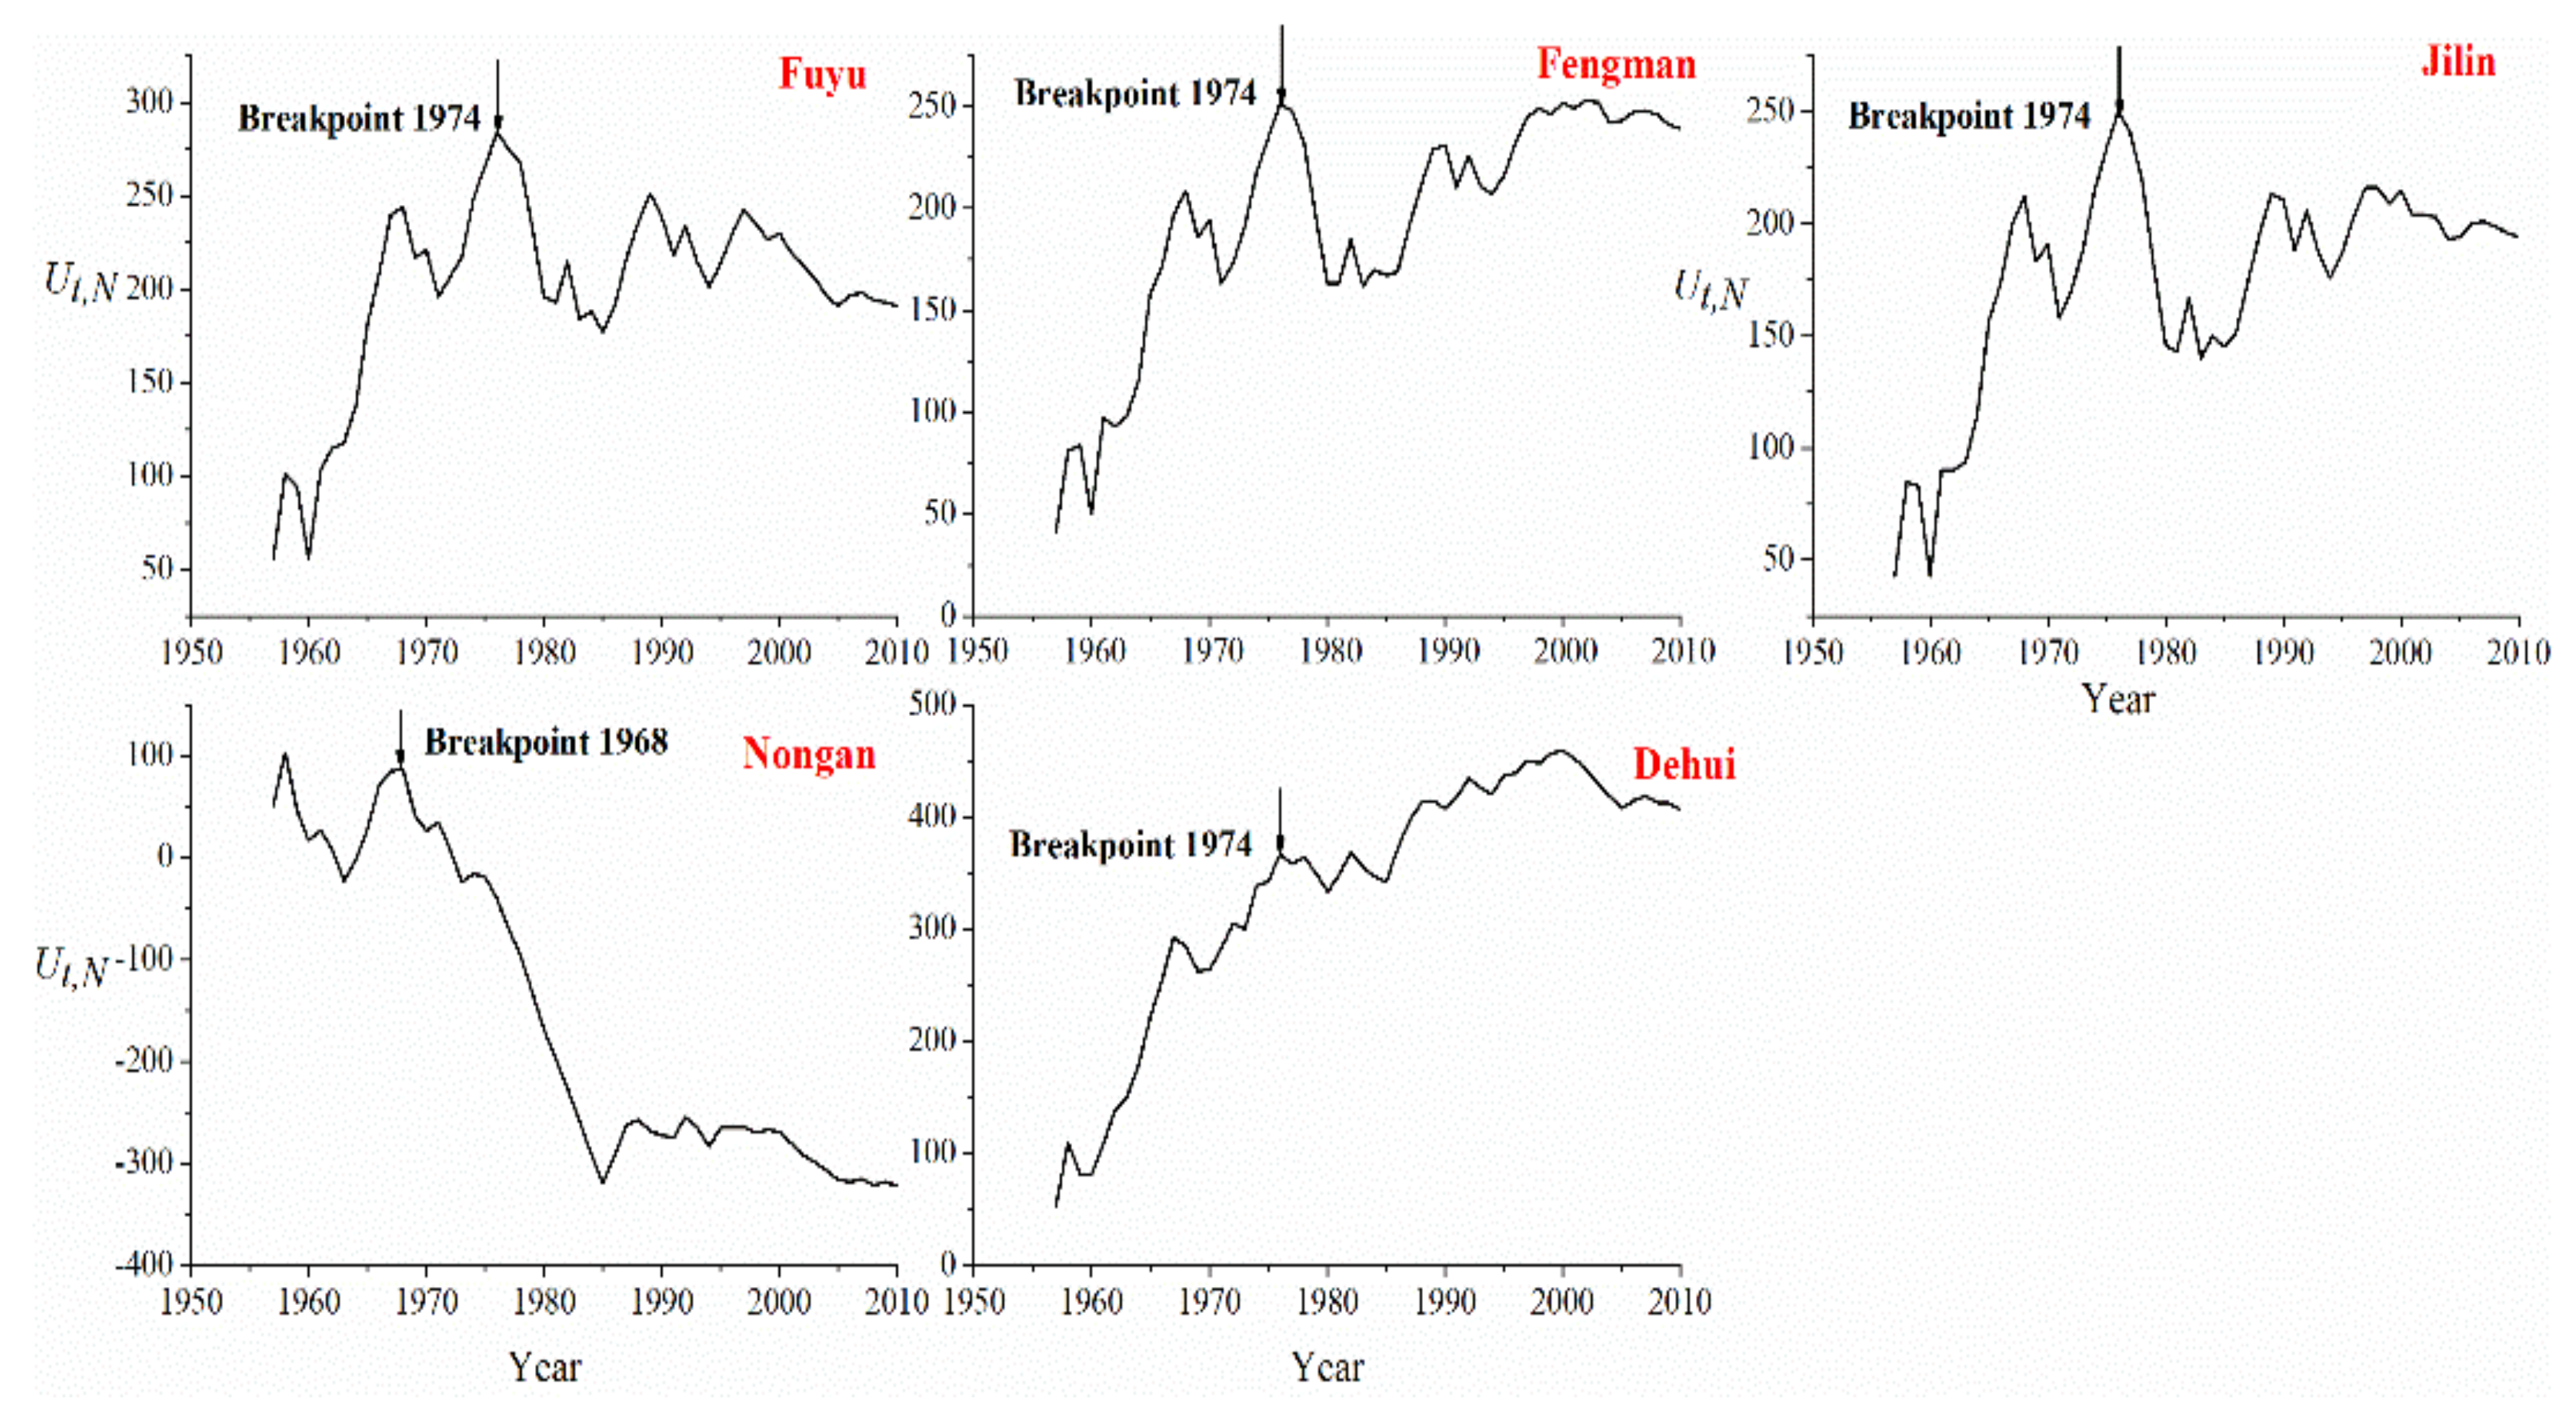
The Second Songhua River has tributaries, Yinma River and Yitong River. Dehui is the hydrological station of Yinma River, Nong’an is the hydrological station of Yitong River, and Jilin, Fengman, and Fuyu are on the main stream of SSRB. When analyzing the trend of runoff, five stations are used. Since Fengman and Fuyu are the upstream and downstream stations of the second Songhua River, these two stations were selected when analyzing climate change and human activities. The specific location is shown in Figure 1. Table 1 shows that the annual runoff for 1956–2015, showing decreasing trends for Fuyu, Fengman, Jilin, and Dehui which were significant at the 5% level; the Z and ZSR values of total runoff have been consistently lower than −1.96 for Fuyu, Fengman, and Jilin stations. Figure 9 shows that breakpoint occurred in 1966, 1967, 1971, 1974, 1986, 1994, 2004, and 2010. Because the UF and UB curves have multiple intersection points, this article combined Pettitt’s test statistical method to detect the change points. Figure 10 and Table 2 show that the process line of the annual runoff statistic, , for 1956–2015 showed an upward trend, reaching a peak and a turning point in 1974, and then exhibiting a downward trend during 1975 to 2015. The maximum value of was in 1974; therefore, the extremely significant (p < 0.05) breakpoint of the series was in 1974. The conclusion was approximately the same regardless of the analytical technique used to examine the time series: Runoff in the Second Songhua River decreased even though none of the detected trends were statistically significant. Analysis of runoff data from the hydrologic station partitioning, except for Nong’an Station in the SSRB, showed that a change in runoff occurred in 1974, after which there was a downward trend.
4.3. Contributions of Human Activities and Climate Change to Runoff Change
The climatic conditions and catchment landscape parameter of the two periods of 1956–1974 and 1975–2015 are shown in Table 3, where p is the average annual precipitation, E0 is the average annual potential evaporation, R is the average annual runoff, n is the catchment landscape parameter, and ΔR is defined as the runoff difference between the mean values in the two time periods of 1956–1974 and 1975–2015, such that ΔR = R2 − R1. Using the Budyko hypothesis, the difference in runoff between the two time periods and the contribution of climate change and catchment landscape change to runoff were obtained. The contribution rates of precipitation and potential evaporation were 76% and 4% in Fengman and 37% and −20% in Fuyu (Table 4), respectively, on average. Including precipitation and potential evaporation, the contribution rate of climate change was: . The contribution rates of climate change and land cover change were 80% and 20% in Fengman, and 17% and 83% in Fuyu (Table 4), respectively, on average.
5. Discussion
5.1. Rationality of the Attribution Analysis
The research in this paper shows that climate change had a greater impact on runoff reduction at Fengman, but land use change at Fuyu had a greater impact, consistent with previous research (Li et al., 2014) [21]. Table 5 lists the results of previous studies that attribute runoff changes to climate change and human activities in the SSRB. Comparing the results of our study (Table 4) with the results of previous studies (Table 5), our estimate of the main driving force for the reduction of runoff in the SSRB is consistent with that Li [21]. Only the contribution of human activities to runoff changes differed. However, our estimation of the main driving force for the reduction of runoff in the SSRB was contrary to the view of Cao [24], whose research showed that climate change is the main driving force. We attribute these differences to different hydrometeorological stations, research periods, and analysis methods. Compared with the Budyko hypothesis used by Li [21], this paper use water–energy coupling balance method based on the Choudhury–Yang equation, the climatic and catchment landscape elasticity coefficient of the annual runoff change were estimated. The results obtained by another similar method were also consistent, showing that the research in this paper is reasonable.
5.2. Impacts of Human Activities on Runoff
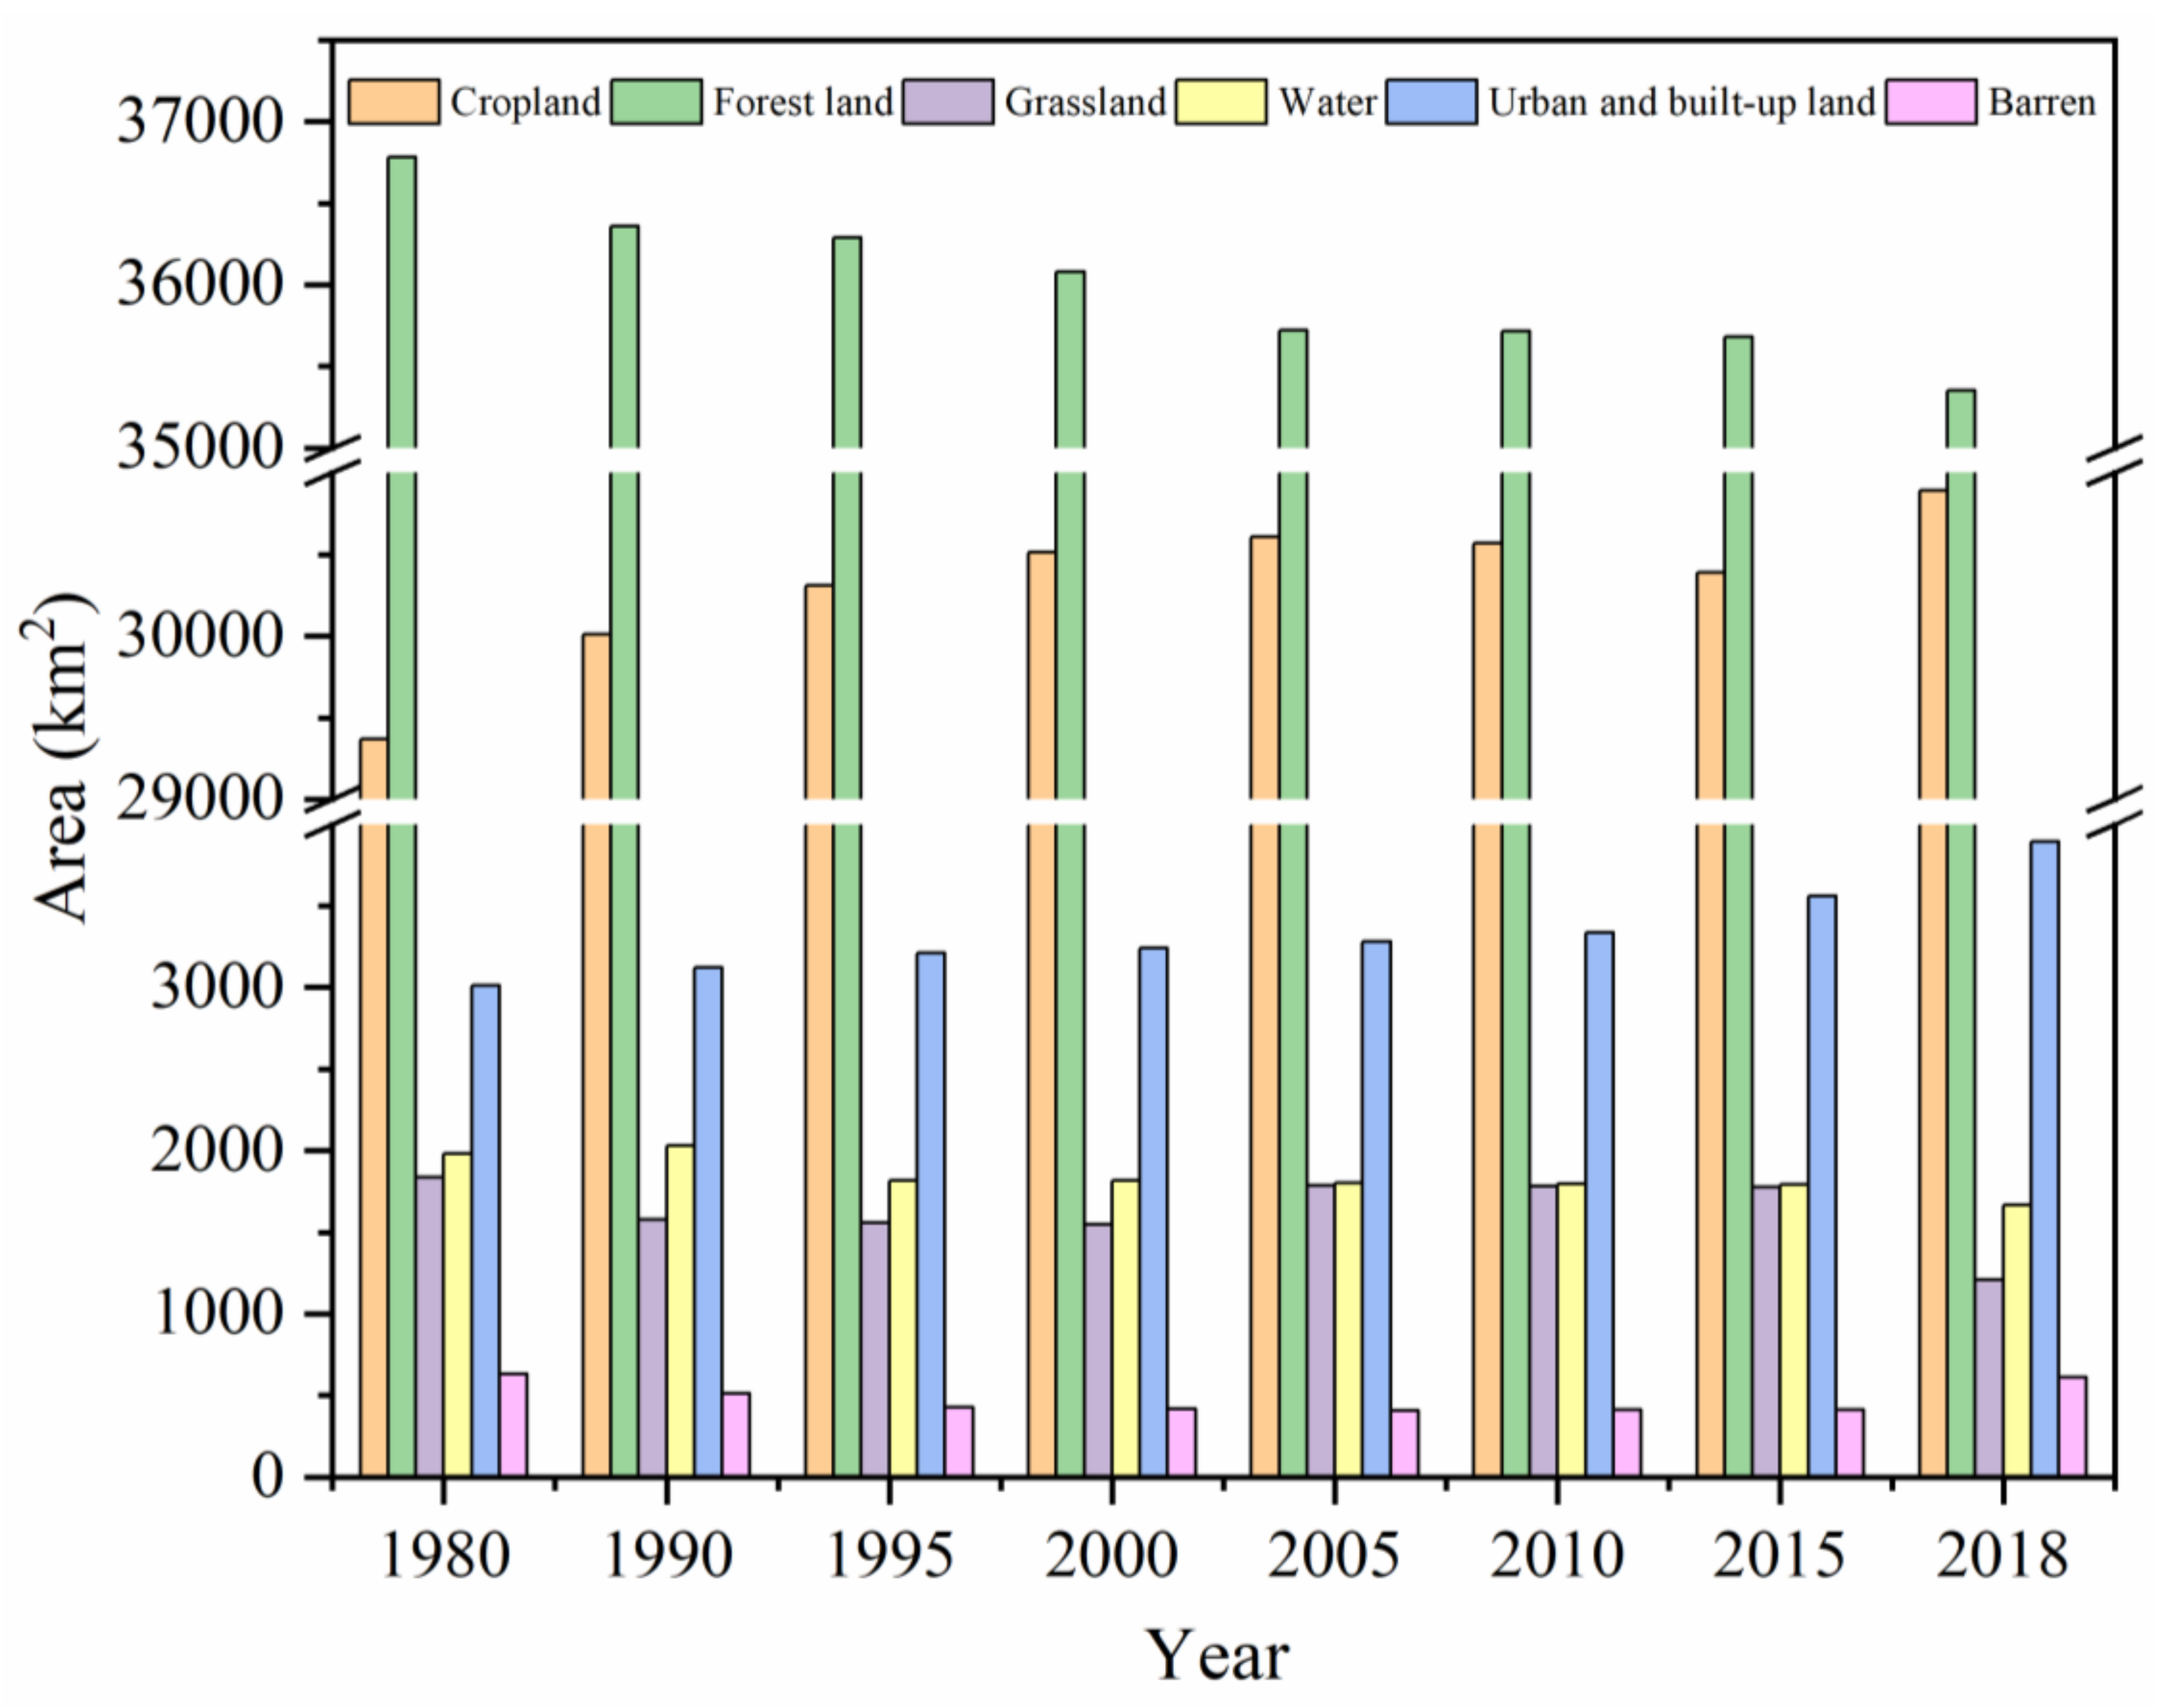
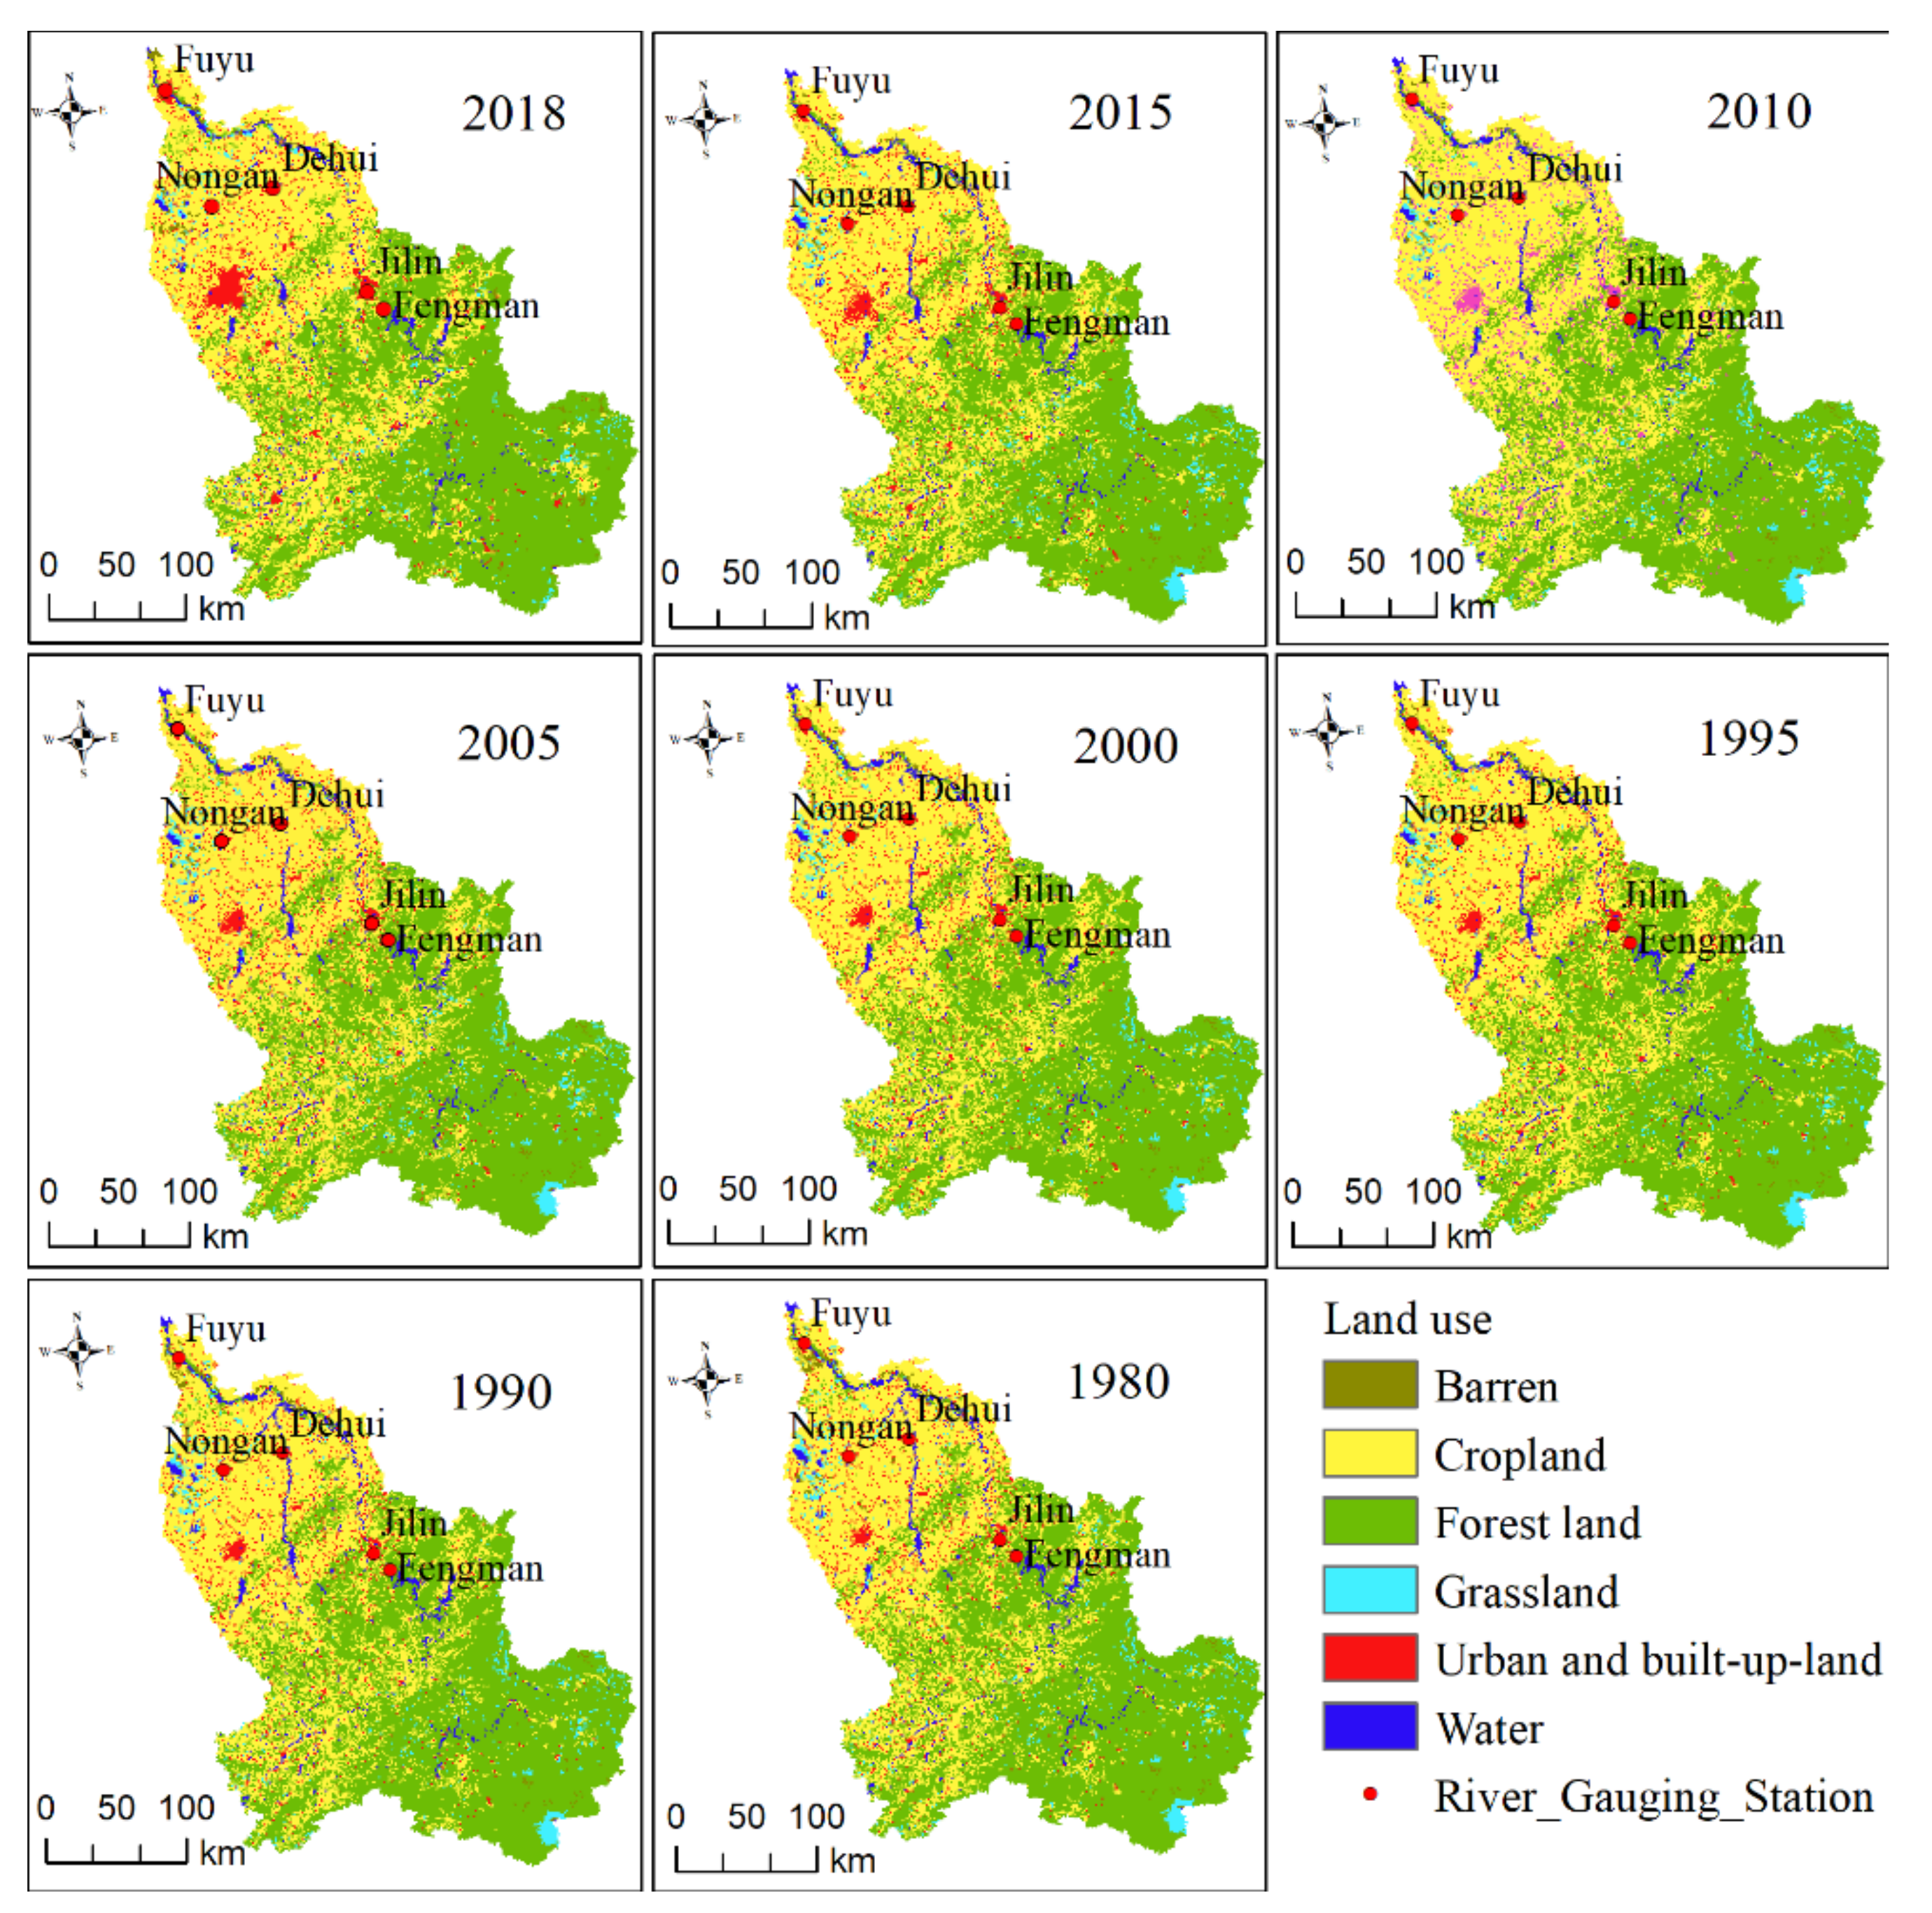
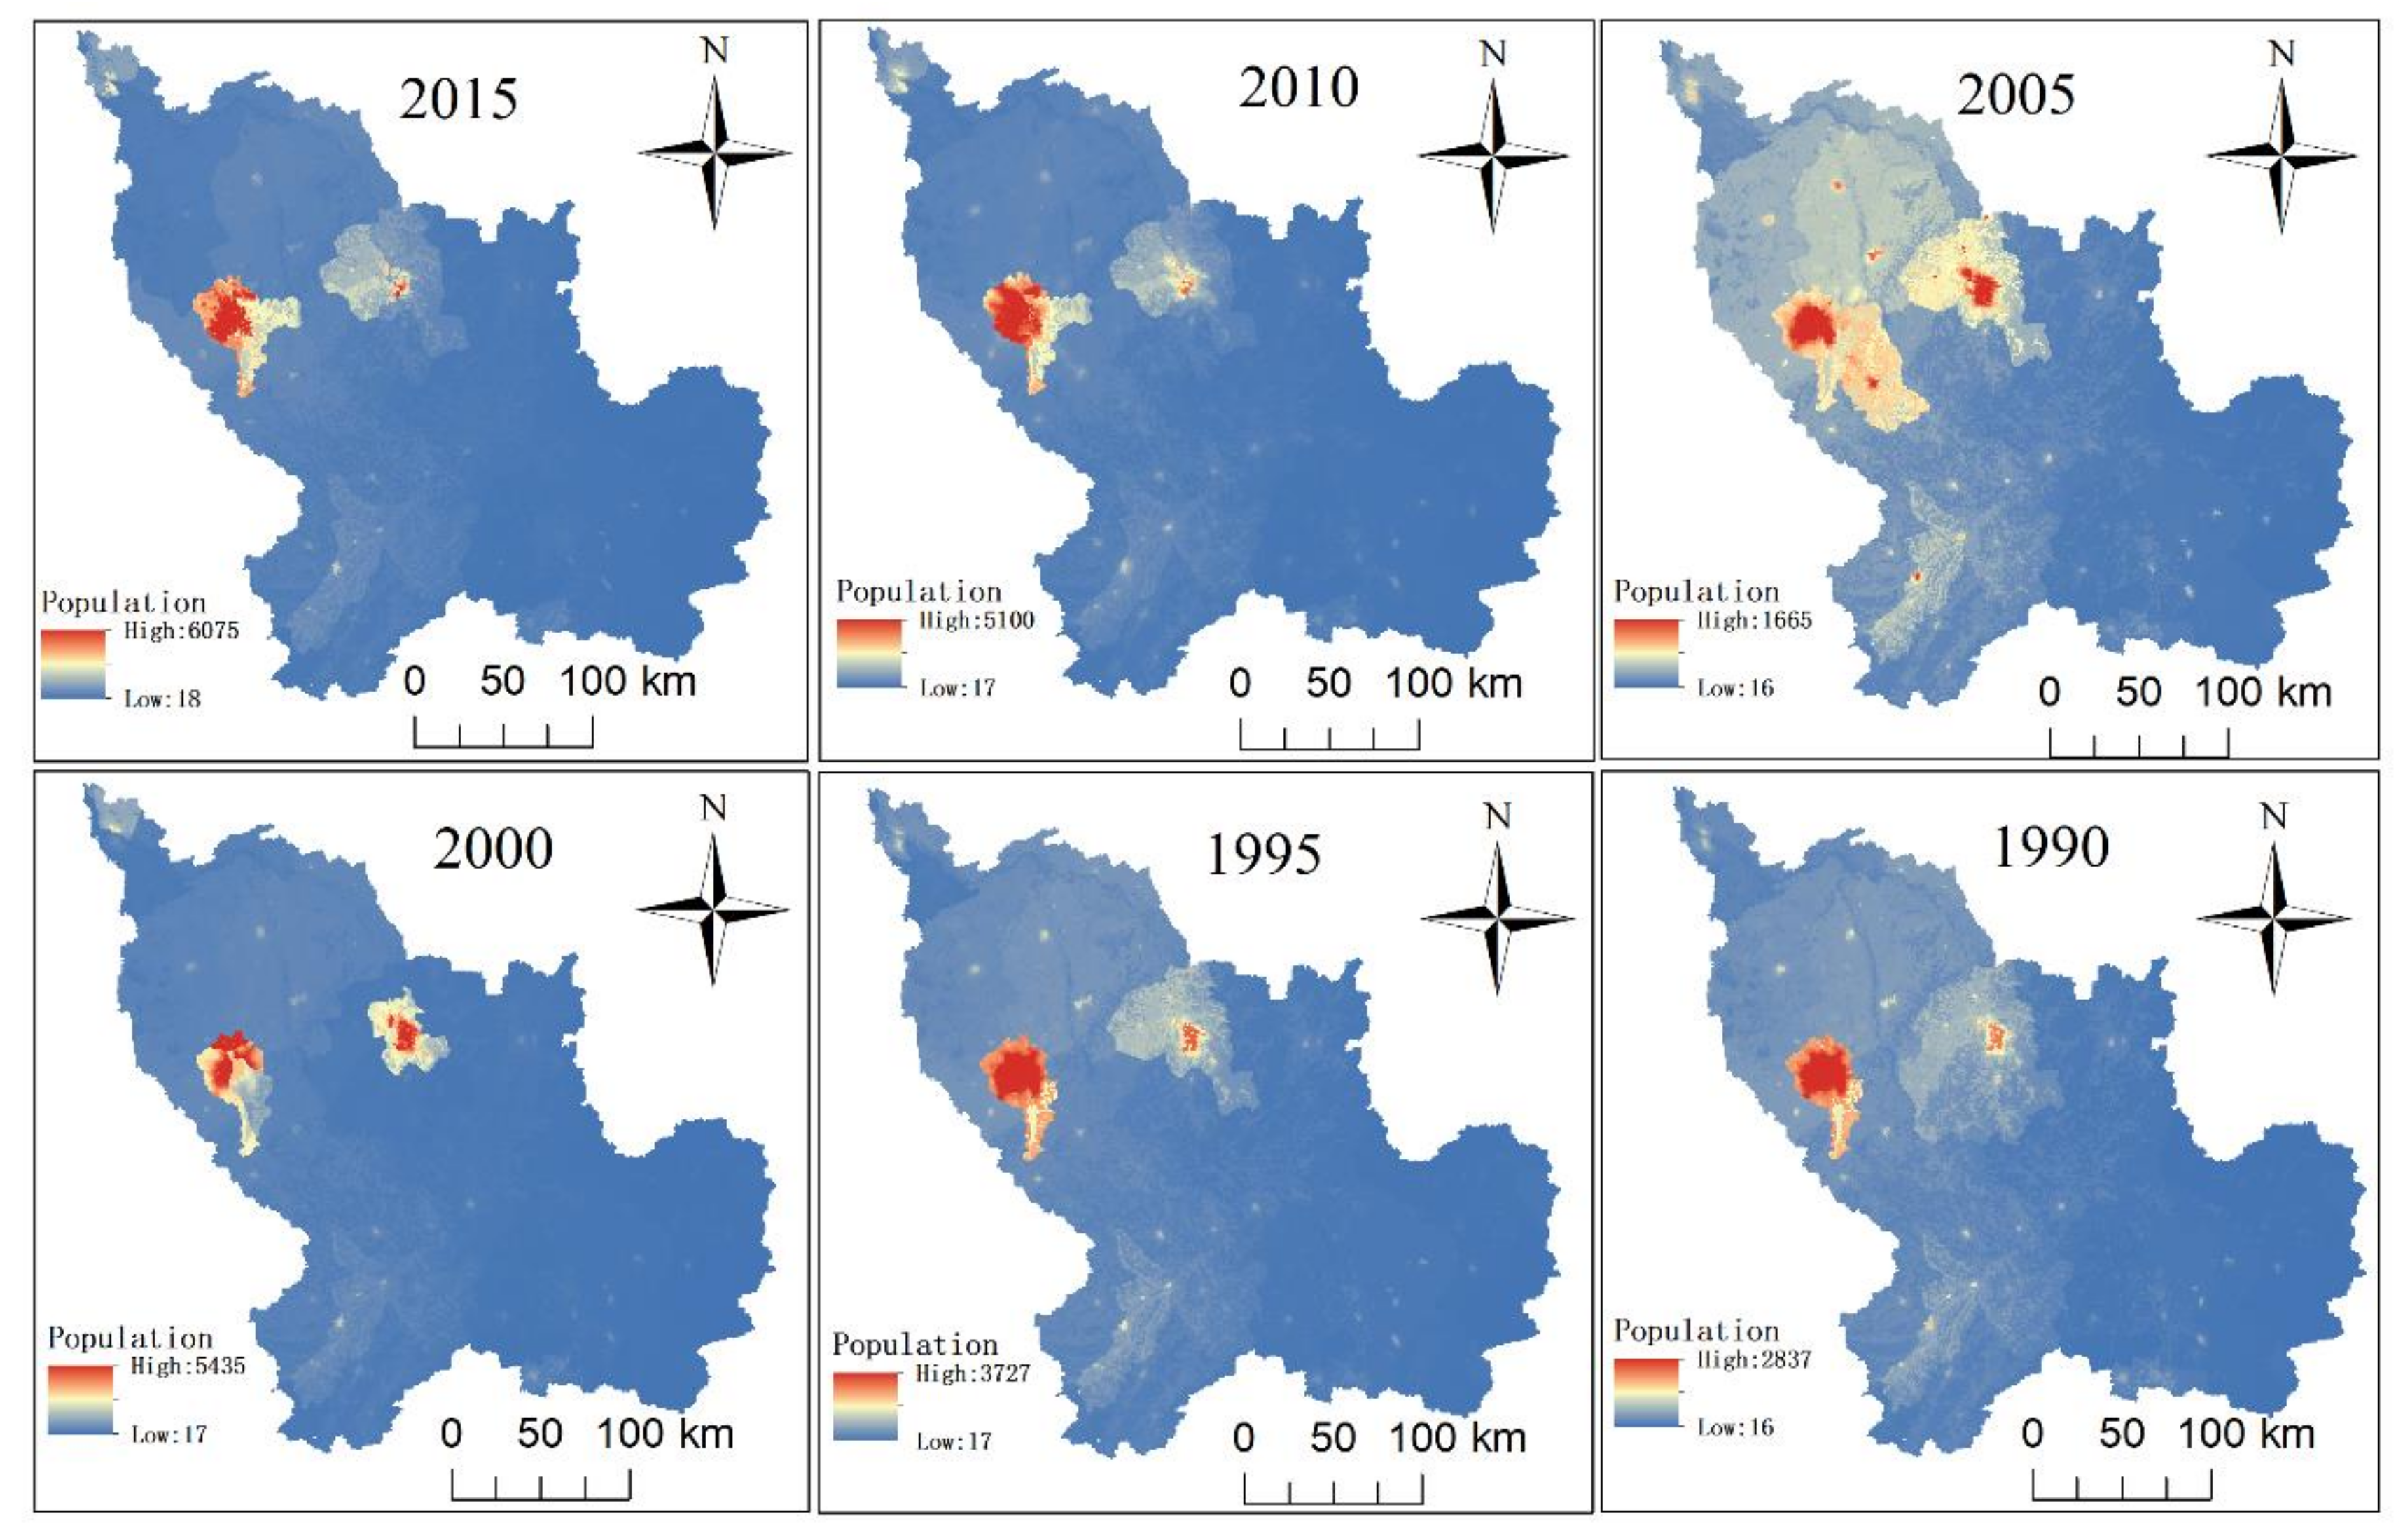
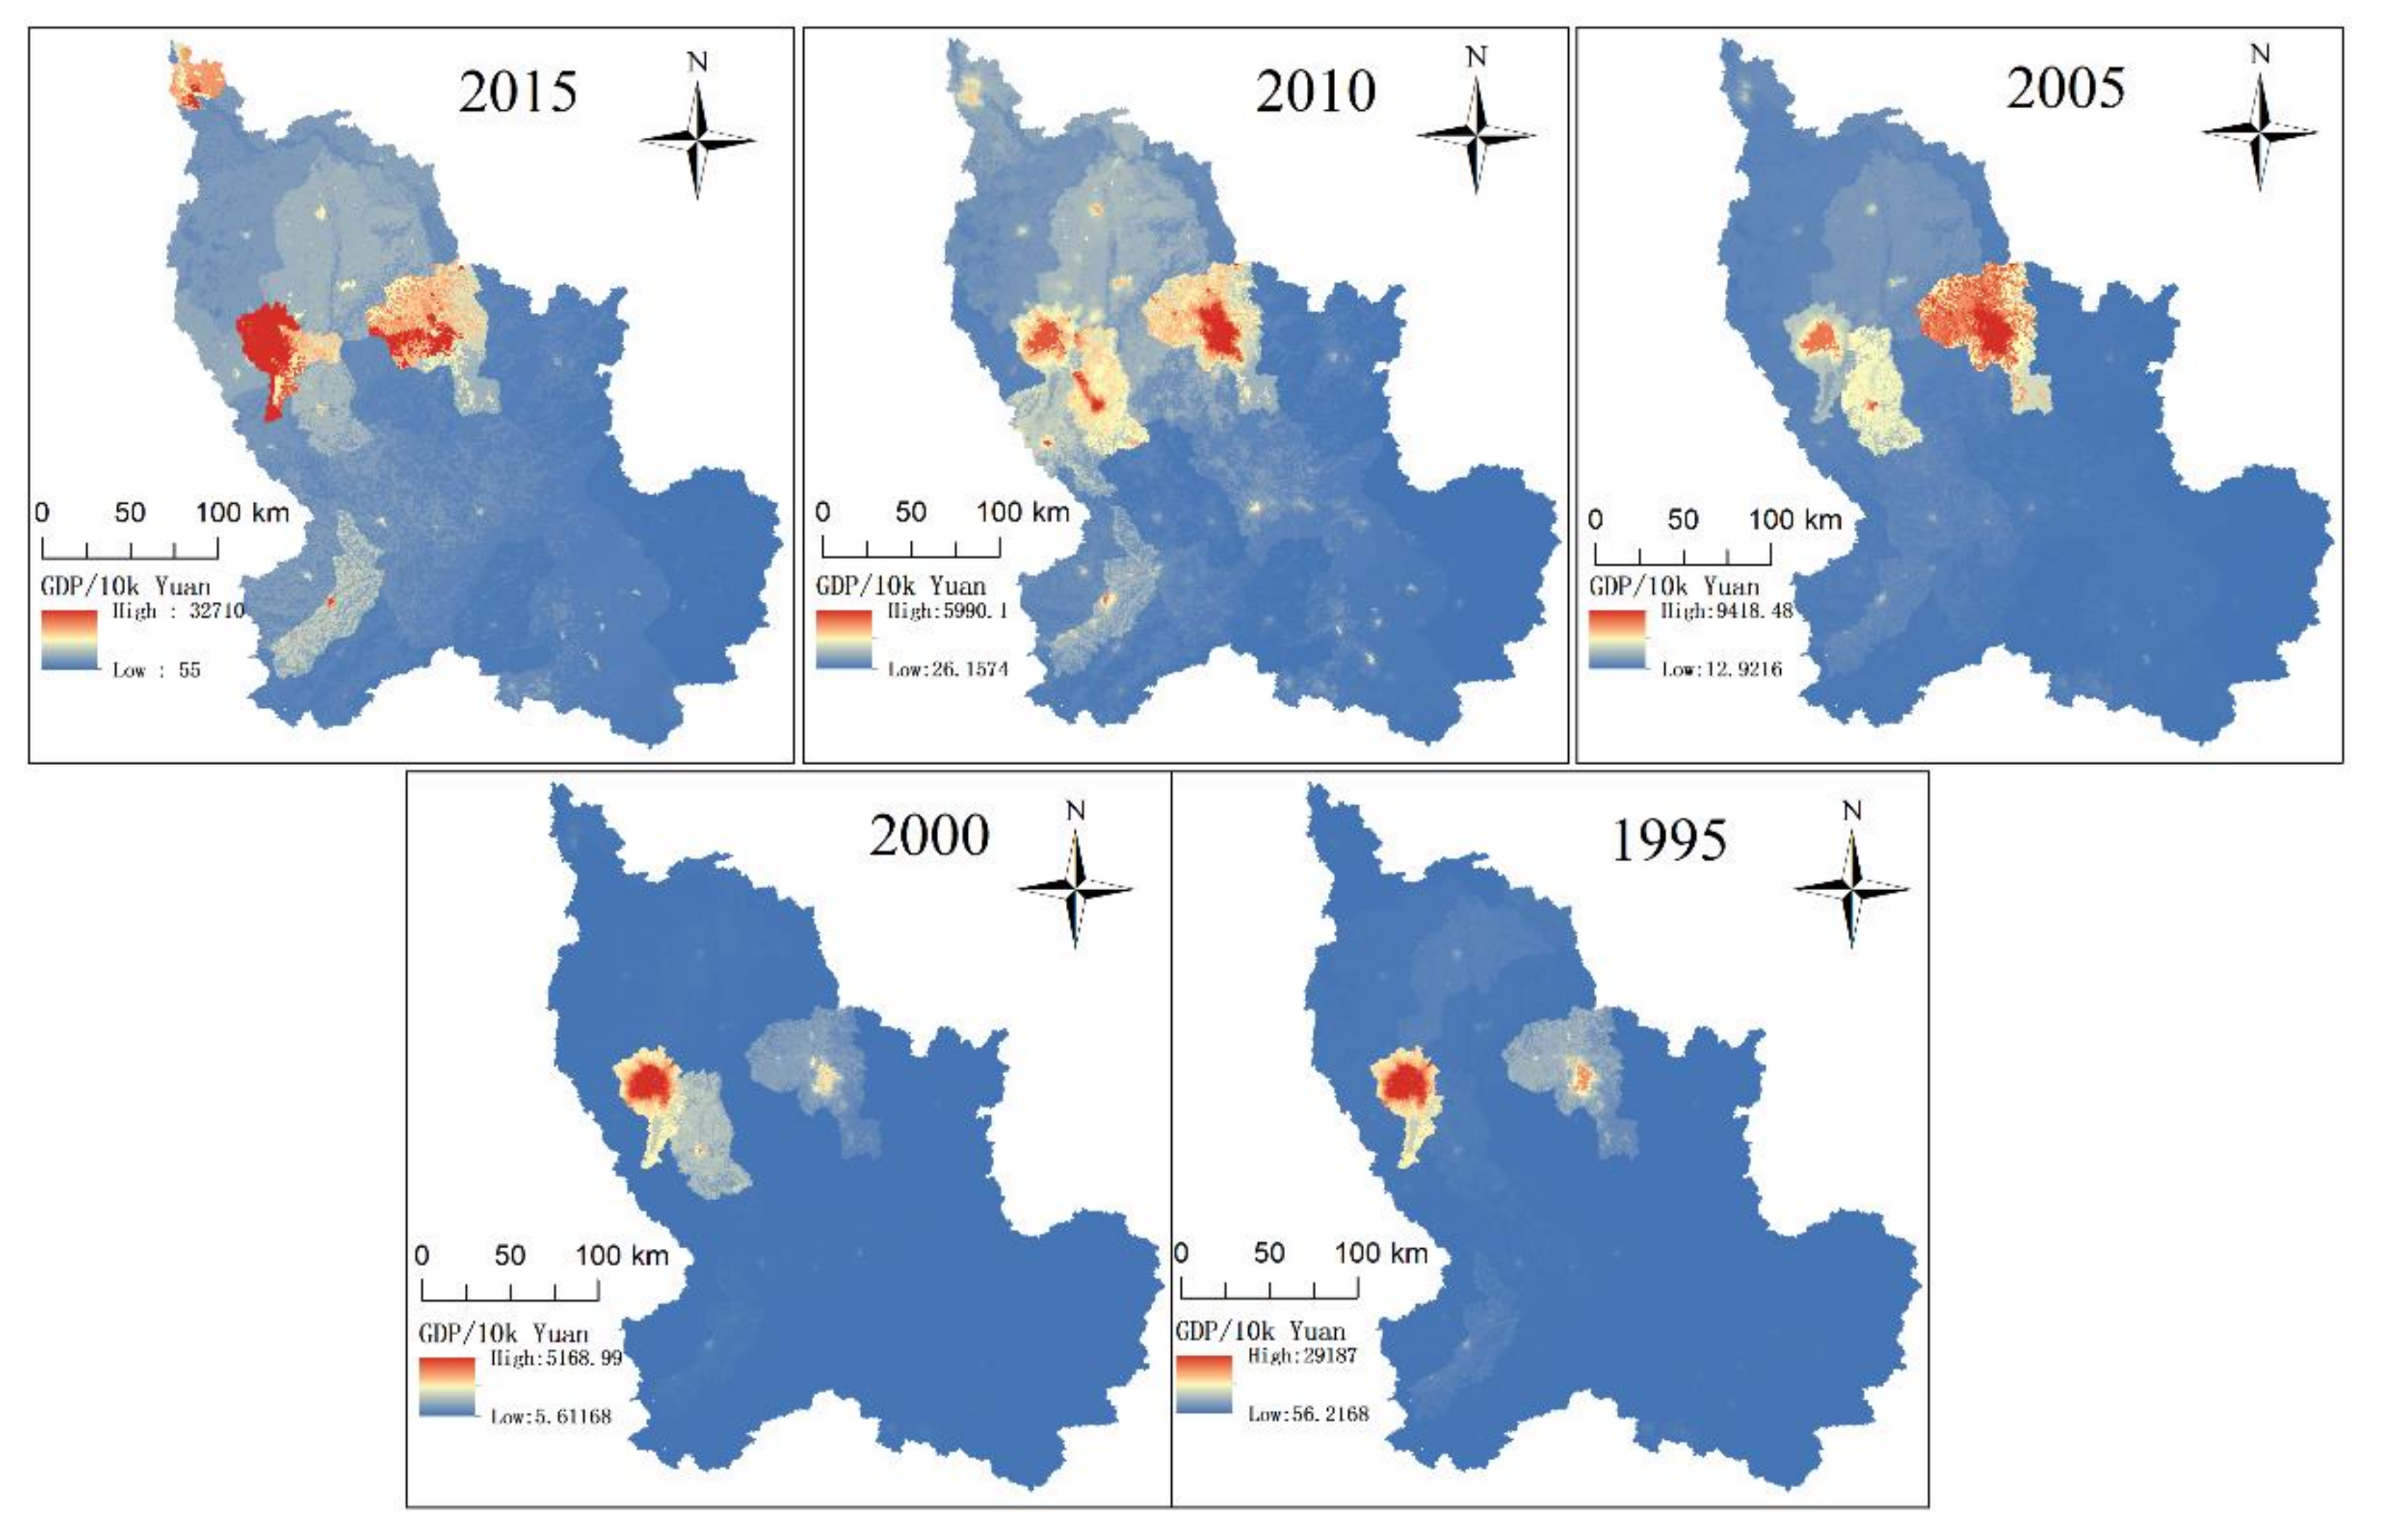
Since the 1980s, land use and land cover in the SSRB have undergone major changes (Figure 3). There has been an increase in area of urban and built-up land, with a 29.3% increase in 2018 compared to 1980, and their distributions corresponded to the regions with a higher population density and GDP (Figure 5 and Figure 6). The increase in urban and built-up land area and the increase in domestic and industrial water demand exacerbated the mismatch between water supply and demand. In addition, the low water efficiency in the study area caused an increase in domestic and industrial water demand, and the flow rate dropped sharply. The area of cropland in 2018 increased by 5.1% in the SSRB compared with 1980 (Figure 3). In this study, the average cropland area of SSRB was 30,333.4 km2 for 1980–2018, accounting for 41% of the catchment area 73,615.4 km2, and is related to agricultural water intake. The agricultural water use increased during 1970–2015 (Figure 2), and the forest area in 2018 was 3.9% less than in 1980 (Figure 3). Although land use changes (such as forest and grassland reduction) are not obvious (Figure 3 and Table 2), the degree of coverage has reduced (Figure 4).
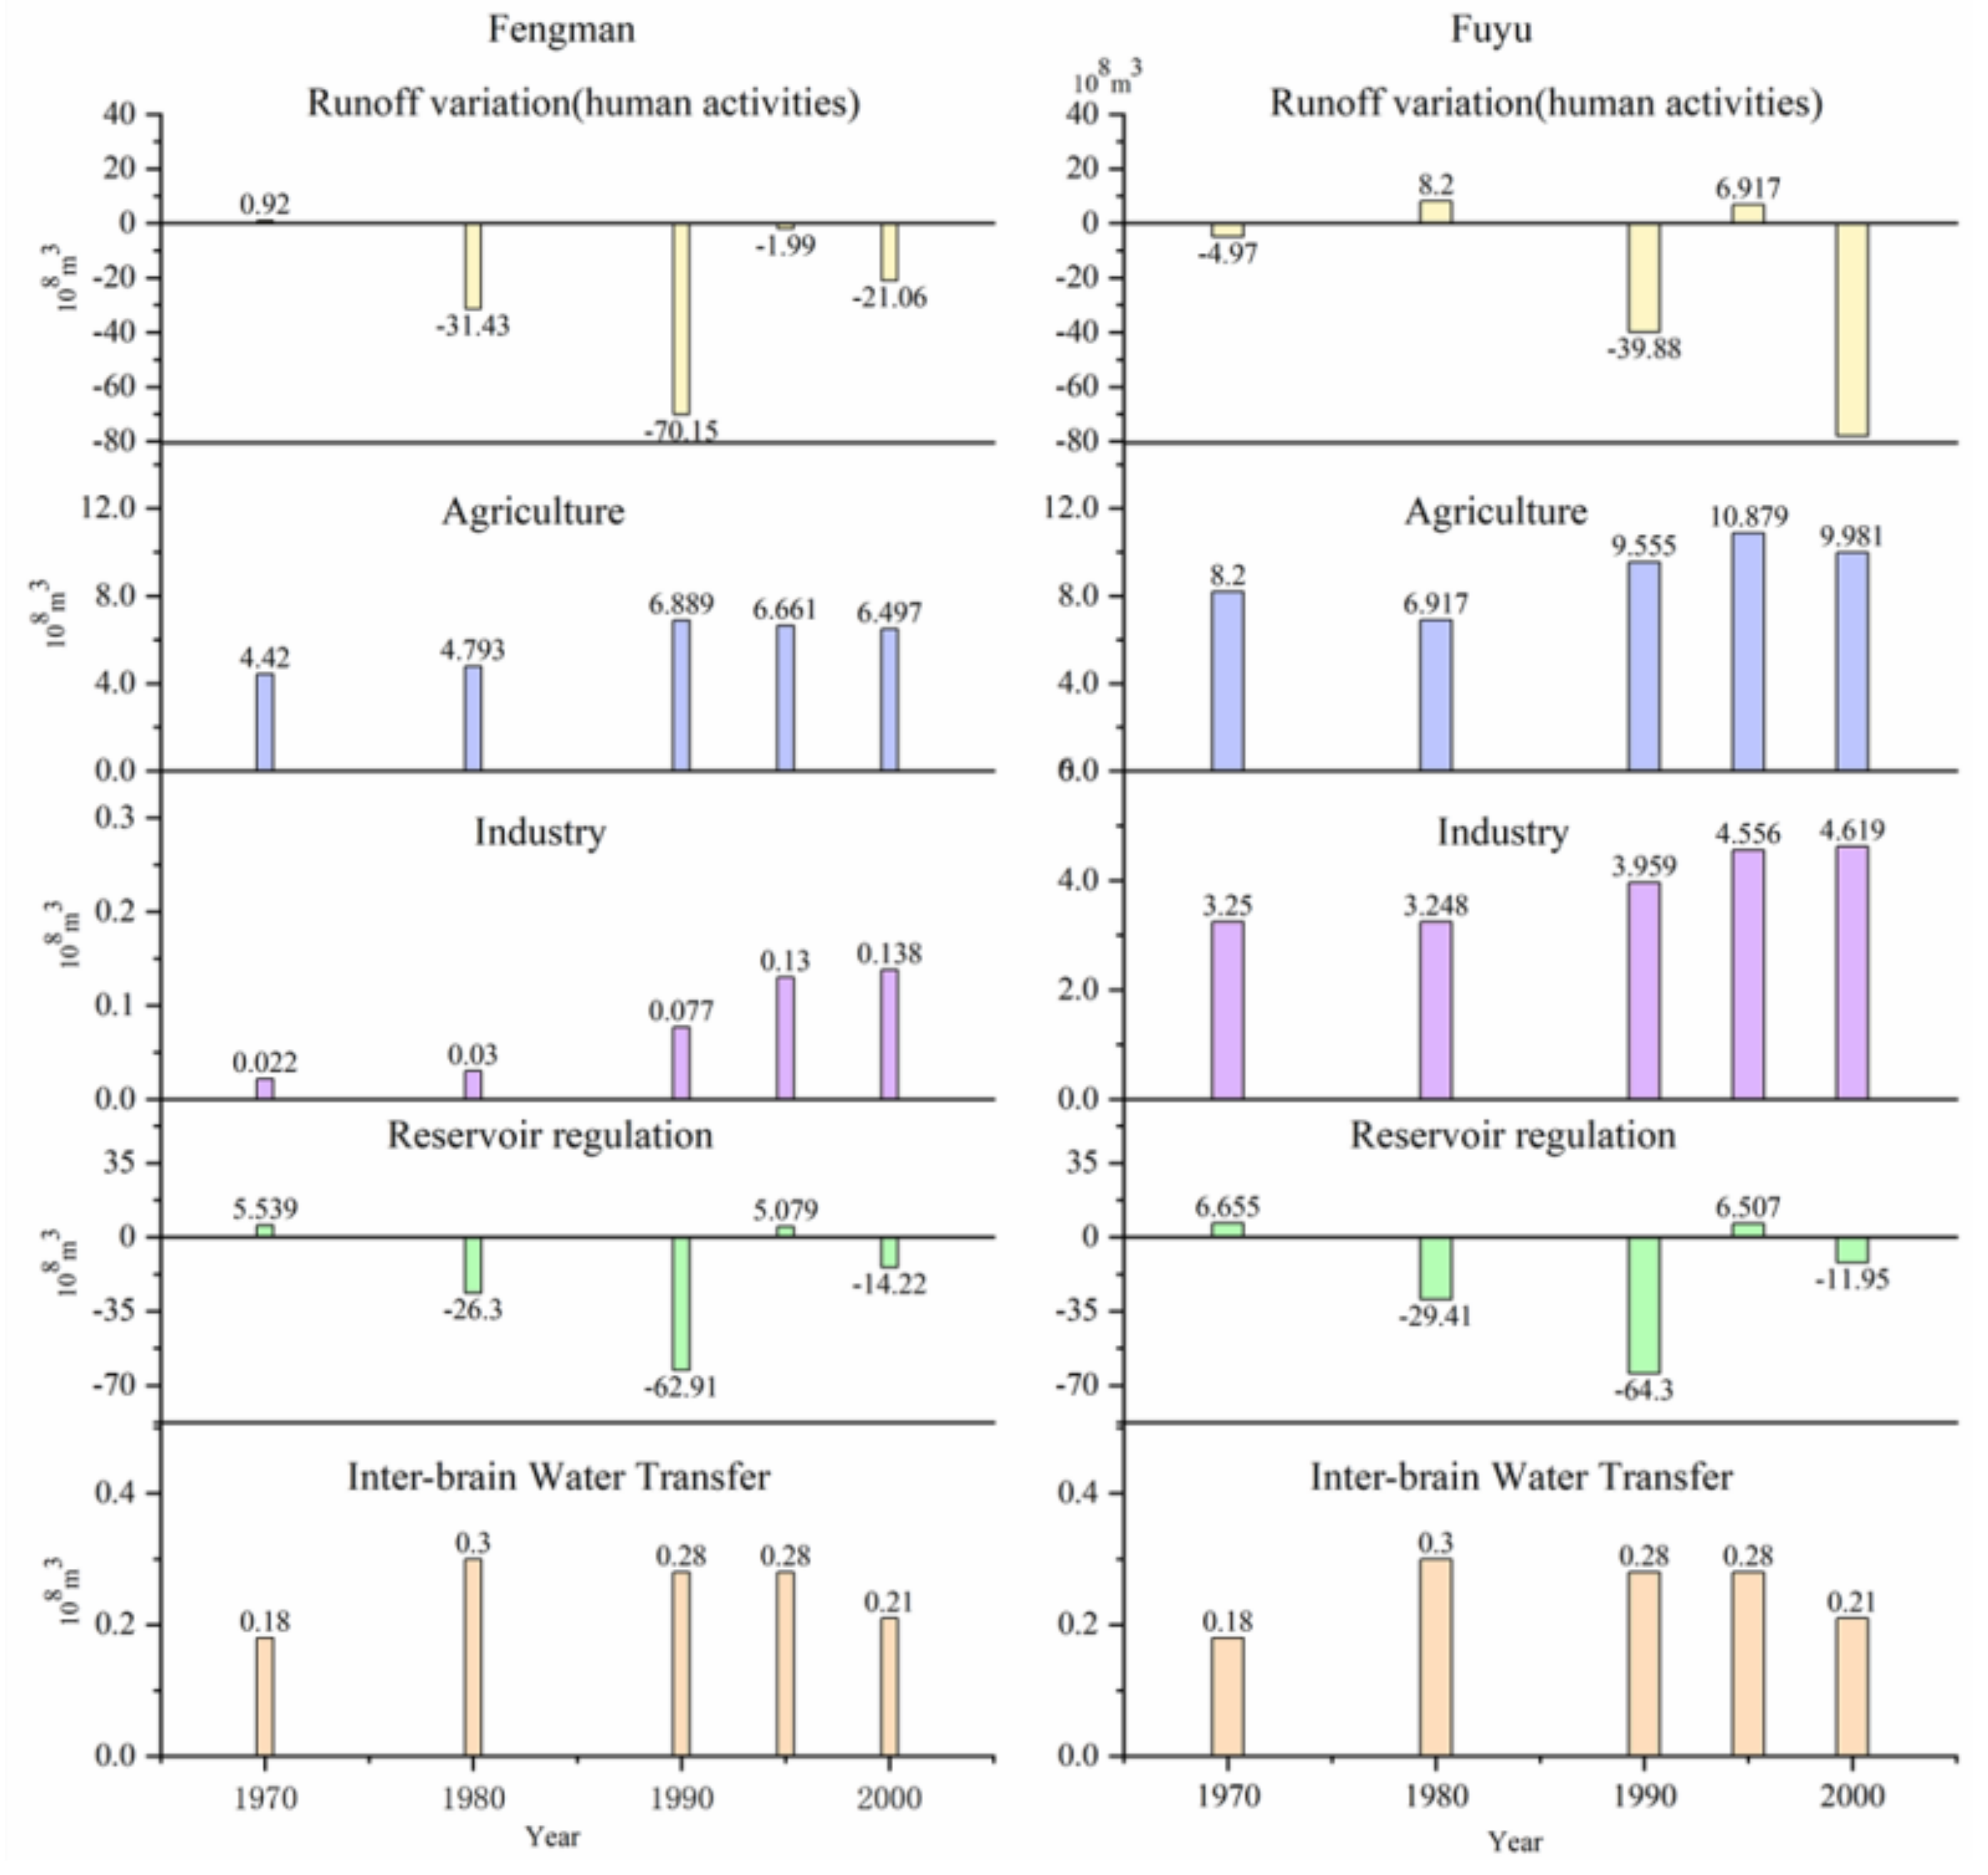
This research shows that climate change has had a greater impact on runoff reduction at Fengman, while land use change at Fuyu Station has had a greater impact. However, in addition to the impact of land use change and climate change, reservoir regulation, increasing water consumption (in agriculture and industry), and inter-basin water transfer also have a great impact on runoff. Many hydraulic projects (e.g., construction of the Fengman Reservoir) were implemented during the study period to meet the industrial, domestic, and agricultural water demands in the SSRB. Among these influencing factors, reservoir regulation had the greatest impact on runoff, accounting for the largest percentage of change, followed in decreasing order of impact by agricultural water, industrial water, and inter-basin water transfer (Figure 2). Increased demand for water for agriculture, industry, and households has led to overexploitation of surface water and groundwater: Pumping water from surface water will directly reduce water flow.
Fengman and Fuyu are located in the upstream and downstream of the Second Songhua River, respectively. The human activities at the sites of Fengman and Fuyu are shown in Figure 2. The results showed that the impact of water withdrawal from agriculture and industry at Fuyu was greater than at Fengman, notably industrial water consumption was much greater. The Lower Second Songhua River is a residential area (Figure 3), and the population is relatively large and GDP relatively high (Figure 5 and Figure 6). Sun [33] showed that population density is related to higher impacts of human activities on runoff. Due to the lack of long-term water consumption data, the population map and GDP map of the study area (Figure 5 and Figure 6) were evaluated to determine how they drive the human impact on runoff. Population expansion and GDP increase were closely related to water resources; the runoff pattern was markedly changed by the pumping of water from the river, changing of the channel shape, building of hydraulic structures, return of water from sewage disposal works, and so on [34]. The population density and GDP were concentrated in the urban and built-up land (Figure 5 and Figure 6). Consistent with the results in Table 5, human activities had the greatest impact on urban land and built-up land. In Fengman, due to relatively poor natural conditions, the population was small. Therefore, human activities contributed to 20% (Table 3) of the runoff reduction in the SSRB. However, in Fuyu, human activities were more intensive, and human activities contributed to 83% (Table 4) of the runoff reduction in the SSRB. Thus, the impact of human activities on the runoff was greater for the Lower Second Songhua River compared to the Upper Second Songhua River.
5.3. Adaptive Strategies and Options
The Northeast China Plain is one of the main grain-growing regions in China. Due to the high latitude and black soil ecological system, the crop growth in there is vulnerable to climate change, which makes it important to evaluate the influences of climate change on water resources. Affected by a series of factors such as meteorological changes and human activities, the spatial and temporal patterns of the water cycle in the Second Songhua River Basin have undergone significant changes. Quantifying contributions of climate change and local human activities to runoff decline can enhance our understanding of changes in runoff into the Second Songhua River Basin. The adaptive management of water resources should be considered on different spatial scales to achieve the harmony of resources, ecology, and social economy. It is particularly important to propose strategies for adaptive management of water resources in a changing environment and to maintain the sustainable development and utilization of water resources.
This paper proposed some adaptive measures: According to future climate resource redistribution and the new pattern of agricultural meteorological disasters, crop variety layout should be improved, and improved variety with high photosynthesis ability and wide adaptability should be selected for promotion in this basin. Irrigation and water conservancy construction, water-saving agriculture systems, and farmland shelterbelts are beneficial for the improvement of agricultural ability to adapt to climate change. In regard to the comprehensive response of agriculture to climate change, artificial weather control ability and emergency response capacity should be strengthened in this region in the future. To make policy and decision-making in a more targeted manner, an analysis of the amount of water needed is necessary. In order to actively confront the impact of climate change on agricultural production in the future, research on the prediction of water resources should receive widespread attention. The country should also participate in the response of climate change, including the adjustment of agricultural construction of water conservancy facilities and the establishment of an agricultural catastrophe risk fund [22].
5.4. Uncertainty of the Attribution Analysis
When assessing the impact of climate change on runoff, there is some uncertainty in the analysis method. For example, the change points obtained by different methods differed. When using these methods, a problem was encountered: How to use different methods to analyze the consistency of the calculation results? Compared with previous studies, the main driving factors for reducing runoff were the same, but the value of the contribution rate differed. This was mainly due to the uncertainty in choosing different sites, time series, and analysis methods. In addition, the framework used to quantify the impact on runoff was based on the assumption that climate change and human activities are independent [12]. The model used in this paper considers non-linear interaction among climate, landscape, and hydrology, and the elasticity thus derived is different from that regressed in the climate elasticity model. The change in parameter n contains both climate-induced and human-induced land use/cover variations. Attributing the land use/cover change to human activities will overestimate the impact of local human activities on runoff change. Moreover, without consideration of the spatial and temporal distribution of precipitation on runoff in the model, it is possible to have another type of error in the attribution analysis [35]. However, even during the baseline period, these two factors will interact. Despite the uncertainties and limitations, our research still helps to understand the elasticity of runoff to climate change and human activities in SSRB, where water is essential for grain production and wetland ecosystems. In addition, in future research, more work will be done on the estimation of these uncertainties to improve the quantitative results.
6. Conclusions
This paper proposed an attribution method based on the Choudhury–Yang equation to quantify the contribution of climate change and land use to runoff changes in the SSRB, using statistical methods to analyze the trend in runoff, detect the change points in annual runoff, and divide the time series into two periods. Through the Choudhury–Yang equation, the difference in runoff between the two time periods and the contribution of climate change and catchment landscape change to runoff were obtained. The conclusions were as follows:
- The annual runoff during 1956–2015 showed a significant downward trend in the SSRB in Northeast China, and the annual runoff from 1974 showed a sharp change;
- In different climatic regions, the watershed runoff had obvious differences in sensitivity to climate change and catchment landscape changes: In humid regions, runoff was insensitive to climate and catchment landscape changes; in drier climates, runoff was sensitive to both climate and catchment landscape changes;
- Land use was the most important factor affecting the runoff change during the past 50 years in the SSRB. However, in addition to the impact of land use, reservoir regulation, increasing water consumption (in agriculture and industry), and inter-basin water transfer also had a great impact on measured runoff;
- The effect of precipitation on runoff change was more significant than that of potential evaporation. Due to the poor natural conditions and small population of Fengman, there was relatively little human activity. The human activities in the Lower Second Songhua River are more intensive, and so had more impact on runoff compared to the Upper Second Songhua River.
Author Contributions
Writing—original draft preparation, B.S.; writing—review and editing, B.S., Y.W., W.X. and L.H. All authors have read and agreed to the published version of the manuscript.
Funding
This research was funded by “Efficient Development and Utilization of Water Resources” (2017YFC0406005), Funds for Key R&D Projects of Jilin Provincial Science and Technology Department (20200403070SF).
Acknowledgments
We would like to thank Guangchun Shan for his help in revising the format of the article.
Conflicts of Interest
The authors declare no conflict of interest.
References
- Zhang, K.-M.; Wen, Z.-G. Review and challenges of policies of environmental protection and sustainable development in China. J. Environ. Manag. 2008, 88, 1249–1261. [Google Scholar] [CrossRef] [PubMed]
- Changming, L.; Jingjie, Y.; Kendy, E. Groundwater exploitation and its impact on the environment in the North China Plain. Water Int. 2001, 26, 265–272. [Google Scholar] [CrossRef]
- Yang, H.; Zhang, Z.; Shi, M. The Impact of China’s Economic Growth on its Water Resources. In Rebalancing Sustaining Growth in China; Australian National University E Press: Canberra, Australia, 2012; p. 309. [Google Scholar]
- Zhang, J.; Wang, G.; Jin, J.; He, R.; Liu, C. Evolution and variation characteristics of the recorded runoff for the major rivers in China during 1956–2018. Adv. Water Sci. 2020, 31, 153–161. [Google Scholar]
- Jehanzaib, M.; Shah, S.A.; Yoo, J.; Kim, T.W. Investigating the impacts of climate change and human activities on hydrological drought using non-stationary approaches. J. Hydrol. 2020, 588, 125052. [Google Scholar] [CrossRef]
- O’Brien, K.L.; Leichenko, R.M. Double exposure: Assessing the impacts of climate change within the context of economic globalization. Glob. Environ. Change 2000, 10, 221–232. [Google Scholar] [CrossRef]
- Hu, S.; Liu, C.; Zheng, H.; Wang, Z.; Yu, J. Assessing the impacts of climate variability and human activities on streamflow in the water source area of Baiyangdian Lake. J. Geogr. Sci. 2012, 22, 895–905. [Google Scholar] [CrossRef]
- Refsgaard, J.C. Parameterisation, calibration and validation of distributed hydrological models. J. Hydrol. 1997, 198, 69–97. [Google Scholar] [CrossRef]
- Li, Q.; Yu, X.; Xin, Z.; Sun, Y. Modeling the effects of climate change and human activities on the hydrological processes in a semiarid watershed of loess plateau. J. Hydrol. Eng. 2013, 18, 401–412. [Google Scholar] [CrossRef]
- Beven, K. Prophecy, reality and uncertainty in distributed hydrological modelling. Adv. Water Resour. 1993, 16, 41–51. [Google Scholar] [CrossRef]
- Xianbang, W.; Kangning, H.; Ying, L.; Hui, W. Estimation of the effects of climate change and human activities on runoff in different time scales in the Beichuan River Basin, China. Hum. Ecol. Risk Assess. 2020, 26, 103–119. [Google Scholar] [CrossRef]
- Zheng, H.; Zhang, L.; Zhu, R.; Liu, C.; Sato, Y.; Fukushima, Y. Responses of streamflow to climate and land surface change in the headwaters of the Yellow River Basin. Water Resour. Res. 2009, 45. [Google Scholar] [CrossRef]
- Wang, D.; Hejazi, M. Quantifying the relative contribution of the climate and direct human impacts on mean annual streamflow in the contiguous United States. Water Resour. Res. 2011, 47. [Google Scholar] [CrossRef] [Green Version]
- Sankarasubramanian, A.; Vogel, R.M.; Limbrunner, J.F. Climate elasticity of streamflow in the United States. Water Resour. Res. 2001, 37, 1771–1781. [Google Scholar] [CrossRef]
- Fu, G.; Charles, S.P.; Chiew, F.H. A two-parameter climate elasticity of streamflow index to assess climate change effects on annual streamflow. Water Resour. Res. 2007, 43. [Google Scholar] [CrossRef]
- Vano, J.A.; Das, T.; Lettenmaier, D.P. Hydrologic sensitivities of Colorado River runoff to changes in precipitation and temperature. J. Hydrometeorol. 2012, 13, 932–949. [Google Scholar] [CrossRef] [Green Version]
- Li, H.Y.; Xue, L.J.; Wang, S.J.; Feng, L. Estimation of evapotranspiration in Nenjiang River Basin Based on the theory of water heat coupling equilibrium. J. North China Univ. Resour. (Nat. Sci. Ed.) 2016, 37, 47–53. [Google Scholar]
- Roderick, M.L.; Farquhar, G.D. A simple framework for relating variations in runoff to variations in climatic conditions and catchment properties. Water Resour. Res. 2011, 47. [Google Scholar] [CrossRef]
- Choudhury, B. Evaluation of an empirical equation for annual evaporation using field observations and results from a biophysical model. J. Hydrol. 1999, 216, 99–110. [Google Scholar] [CrossRef]
- Fu, Q.; Li, L.; Li, M.; Li, T.; Liu, D.; Cui, S. A simulation-based linear fractional programming model for adaptable water allocation planning in the main stream of the Songhua River Basin, China. Water 2018, 10, 627. [Google Scholar] [CrossRef] [Green Version]
- Li, F.; Zhang, G.; Xu, Y.J. Separating the impacts of climate variation and human activities on runoff in the Songhua River Basin, Northeast China. Water 2014, 6, 3320–3338. [Google Scholar] [CrossRef] [Green Version]
- Yu, J.S.; Yao, X.L.; Sun, W.C.; Li, Z.J. The impacts of climate change on water resources in the Second Songhua River Basin, China. IOP Conf. Ser. Earth Environ. Sci. 2016, 41, 012032. [Google Scholar] [CrossRef]
- Zheng, L.-Y.; Yu, H.-B.; Wang, Q.-S. Application of multivariate statistical techniques in assessment of surface water quality in Second Songhua River basin, China. J. Cent. South Univ. 2016, 23, 1040–1051. [Google Scholar] [CrossRef]
- Cao, X.L. Impact of Climate Change on Eco Hydrological Process of the Second Songhua River Basin. Ph.D. Thesis, Dalian University of technology, Dalian, China, 2017. [Google Scholar]
- Zhong, K.; Zheng, F.; Zhang, X.; Qin, C.; Xu, X.; Lalic, B.; Ćupina, B. Dynamic changes in snowfall extremes in the Songhua River Basin, Northeastern China. Int. J. Clim. 2020. [Google Scholar] [CrossRef]
- Sen, P.K. Estimates of the regression coefficient based on Kendall’s tau. J. Am. Stat. Assoc. 1968, 63, 1379–1389. [Google Scholar] [CrossRef]
- Mann, H.B. Nonparametric tests against trend. Econom. J. Econom. Soc. 1945, 13, 245–259. [Google Scholar] [CrossRef]
- Kendall, M.G. Rank Correlation Methods; Griffin: London, UK, 1975. [Google Scholar]
- Sneyers, R. On the Statistical Analysis of Series of Observations; World Meteorological Organization: Geneva, Switzerland, 1990. [Google Scholar]
- Pettitt, A. A non-parametric approach to the change-point problem. J. R. Stat. Soc. Ser. C 1979, 28, 126–135. [Google Scholar] [CrossRef]
- Penman, H.L. Natural evaporation from open water, bare soil and grass. Proc. R. Soc. London. Ser. A Math. Phys. Sci. 1948, 193, 120–145. [Google Scholar]
- SatishKumar, K.; Rathnam, E.V. Comparison of six trend detection methods and forecasting for monthly groundwater levels—A case study. ISH J. Hydraul. Eng. 2020, 1–10. [Google Scholar] [CrossRef]
- Sun, Y.; Tian, F.; Yang, L.; Hu, H. Exploring the spatial variability of contributions from climate variation and change in catchment properties to streamflow decrease in a mesoscale basin by three different methods. J. Hydrol. 2014, 508, 170–180. [Google Scholar] [CrossRef]
- Zhou, Y.; Lai, C.; Wang, Z.; Chen, X.; Zeng, Z.; Chen, J.; Bai, X. Quantitative evaluation of the impact of climate change and human activity on runoff change in the Dongjiang River Basin, China. Water 2018, 10, 571. [Google Scholar] [CrossRef] [Green Version]
- Xu, X.; Yang, D.; Yang, H.; Lei, H. Attribution analysis based on the Budyko hypothesis for detecting the dominant cause of runoff decline in Haihe basin. J. Hydrol. 2014, 510, 530–540. [Google Scholar] [CrossRef]
Figure 1.
The river network and representative hydrological stations in the Second Songhua River Basin (SSRB).
Figure 1.
The river network and representative hydrological stations in the Second Songhua River Basin (SSRB).

Figure 2.
Comparison the impact of water intake on the measured runoff change in Fengman and Fuyu stations.
Figure 2.
Comparison the impact of water intake on the measured runoff change in Fengman and Fuyu stations.

Figure 3.
Land use categories for the study area in 1980–2018.

Figure 4.
Spatial distribution of land use in the study area in 1980–2018.

Figure 5.
Spatial distribution of population in SSRB.

Figure 6.
Spatial distribution of GDP in SSRB.

Figure 7.
Relationship between the elasticity of runoff variation with climate condition and catchment landscape parameter (n) in different aridity index, E0/P, values at the Fengman and Fuyu stations.
Figure 7.
Relationship between the elasticity of runoff variation with climate condition and catchment landscape parameter (n) in different aridity index, E0/P, values at the Fengman and Fuyu stations.

Figure 8.
Frequency analysis of , and in the Fengman and Fuyu stations.

Figure 9.
Results of the Mann–Kendall (M–K) mutation point test in partitions of the SSRB.

Figure 10.
Results of the Pettitt mutation point test for partitions in the SSRB.


Table 1.
Trend test results of annual runoff in in SSRB.
| Partition | Mann–Kendall | Spearman | Sen’s Slope Procedure | |||
|---|---|---|---|---|---|---|
| Z | Significance | ZSR | Significance | Ss | Ss | |
| Yitong River | −1.28 | N.T. | −1.2113 | N.T. | −0.41 | downtrend |
| Yinma River | −1.36 | N.T. | −1.4252 | N.T. | −0.80 | downtrend |
| Fengman–Hadashan | −1.00 | N.T. | −1.0796 | N.T. | −0.82 | downtrend |
| Hadashan–Sanchahe | −1.39 | N.T. | −1.5709 | N.T. | −0.03 | downtrend |
N.T. = non-significant; Ss = Sen’s estimator of slope; Z = normalized Mann–Kendall (M–K) statistic value; ZSR = Spearman’s test statistic value.
Table 2.
Trend test results of the Pettitt breakpoint test in SSRB.
| Partition | Breakpoint | Umax | p | Trend Significance |
|---|---|---|---|---|
| Yitong river | 1974 | 146 | 0.5067 | N.T. |
| Yinma river | 1966 | 151 | 0.4605 | N.T. |
| Fengman–Hadashan | 1977 | 149 | 0.4786 | N.T. |
| Hadashan–Sanchahe | 1974 | 151 | 0.4605 | N.T. |
Table 3.
Hydroclimatic characteristics for the Fengman Reservoir and Fuyu Station in SSRB.
| Gauge Station | Data Period | Long-Term Mean Value | Climate Elasticity | ||||||
|---|---|---|---|---|---|---|---|---|---|
| Annual P (mm) | Annual E0 (mm) | Annual R (mm) | E0/P | n | εp | εE0 | εn | ||
| Fengman | 1956–1974 | 734 | 826 | 325 | 1.14 | 1.11 | 1.62 | 0.62 | 0.243 |
| 1975–2015 | 712 | 830 | 305 | 1.19 | 1.14 | 1.66 | 0.65 | 0.248 | |
| Fuyu | 1956–1974 | 510 | 956 | 252 | 2.06 | 0.69 | 1.38 | 0.37 | 0.841 |
| 1975–2015 | 470 | 903 | 226 | 2.11 | 0.78 | 1.46 | 0.46 | 1.250 | |
Table 4.
Attribution analysis for the Fengman Reservoir and Fuyu Station in SSRB.
| Gauge Station | Data Period | Change from Period 1 to Period 2 (mm) | Induced Runoff Change (mm) | Contribution to Runoff Change (%) | ||||||||
|---|---|---|---|---|---|---|---|---|---|---|---|---|
| ΔP | ΔE0 | ΔR | Δn | ΔRP | ΔRE0 | ΔRl | ηP | ηEp | ηc | ηn | ||
| Fengman | 1956–1974 | −22 | 4 | −20 | 0.03 | −14 | −0.79 | −2.11 | 76 | 4 | 80 | 20 |
| 1975–2015 | ||||||||||||
| Fuyu | 1956–1974 | −13 | −47 | −26 | 0.09 | −9.6 | 5.2 | −53.6 | 37 | −20 | 17 | 83 |
| 1975–2015 | ||||||||||||
Table 5.
Previous attribution studies on runoff change in SSRB.
| Study Area | Study Period | Method/Model | Contribution by | Source | |
|---|---|---|---|---|---|
| Human Activities (%) | Climate Variability (%) | ||||
| Fuyu | 1956–2010 | (1) Single-factor linear regression; (2) Single-factor hydrothermal coupling; (3) Multi-factor hydrothermal coupling | 38.23 | 60.77–66.05 | (Cao et al., 2017 [24]) |
| USSRB | 1975–1989 | Budyko hypothesis | 35 | 65 | (Li et al., 2014 [21]) |
| 1990–1999 | 57 | 42 | |||
| 2000–2009 | 66 | 34 | |||
| LSSRB | 1975–1989 | 73 | 27 | ||
| 1990–1999 | 94 | 6 | |||
| 2000–2009 | 62 | 38 | |||
USSRB is the upper of SSRB; LSSRB is the lower of SSRB.
© 2020 by the authors. Licensee MDPI, Basel, Switzerland. This article is an open access article distributed under the terms and conditions of the Creative Commons Attribution (CC BY) license (http://creativecommons.org/licenses/by/4.0/).
Share and Cite
MDPI and ACS Style
Shanshan, B.; Wei, Y.; Xiaojun, W.; Hongyan, L. Quantifying Contributions of Climate Change and Local Human Activities to Runoff Decline in the Second Songhua River Basin. Water 2020, 12, 2659. https://doi.org/10.3390/w12102659
AMA Style
Shanshan B, Wei Y, Xiaojun W, Hongyan L. Quantifying Contributions of Climate Change and Local Human Activities to Runoff Decline in the Second Songhua River Basin. Water. 2020; 12(10):2659. https://doi.org/10.3390/w12102659
Chicago/Turabian StyleShanshan, Bao, Yang Wei, Wang Xiaojun, and Li Hongyan. 2020. "Quantifying Contributions of Climate Change and Local Human Activities to Runoff Decline in the Second Songhua River Basin" Water 12, no. 10: 2659. https://doi.org/10.3390/w12102659
Note that from the first issue of 2016, this journal uses article numbers instead of page numbers. See further details here.