Incorporating Uncertainty of the System Behavior in Flood Risk Assessment—Sava River Case Study


Faculty of Civil Engineering, Architecture and Geodesy, University of Split, 21000 Split, Croatia
*
Author to whom correspondence should be addressed.
Water 2020, 12(10), 2676; https://doi.org/10.3390/w12102676
Submission received: 25 July 2020
/
Revised: 18 September 2020
/
Accepted: 21 September 2020
/
Published: 24 September 2020
(This article belongs to the Special Issue River Water Management and Water Quality)
Abstract
:This paper proposes a framework for evaluation of the sources of uncertainty that can disrupt the flood emergency response process. During the flood response, flood emergency managers usually choose between several decision options under limited available lead-time, but they are often compelled with different sources of uncertainty. These sources can significantly affect the quality of decisions related to adequate response and rapid recovery of the affected system. The proposed framework considers efficient identification, integration, and quantification of system uncertainties related to the flood risk. Uncertainty analysis is performed from a decision-maker’s perspective and focused on the time period near and during the flood event. The major scope of proposed framework is to recognize and characterize sources of uncertainty which can potentially appear within the behavior of the observed system. Using a Bayesian network approach, a model is developed capable for quantification of different sources uncertainty in respect to their particular type. The proposed approach is validated on the Sava River case study, in the area of the city of Slavonski Brod, following the destructive 2014 flood event. The results indicate that, despite improvements of structural measures, the weir failure can still cause flooding of the approximately 1 km2 of otherwise safe area, resulting in the increased flood risk.
1. Introduction
When dealing with floods, decision-makers have to cope with different sources of uncertainty, which can significantly affect the quality of decisions related to adequate response and rapid recovery of the affected system. This challenge particularly applies to the period near the incoming flood event, when flood emergency managers are compelled to choose between limited decision options under limited available lead-time. Choosing between those options is often challenging due to uncertainty that appears in different contexts and domains, reflecting the complexity of the endangered system’s behavior and natural phenomena.
In many recent flooding events in EU countries, we have witnessed how flood emergency response can be disrupted by a sudden event, preventing disaster managers in implementation of emergency response measures. The flood event on the Sava River in 2014, which affected Croatia as well as other neighboring countries, demonstrated the necessity for further research related to flood risk and associated uncertainty. This particular event was an example of the situation when multiple system failures occurred during the flooding. During the event, several defense structures collapsed and along with other failures, causing situations remarkably unexpected by emergency managers.
The risk assessment approach is commonly used to estimate the potential adverse flooding effects [1,2,3], and is usually performed during the preparedness phase of the risk management cycle. Many authors emphasized the presence of uncertainty within different phases of the risk assessment procedure. Hutter et al. [4] analyzed the uncertainty in preparing long-term flood risk management strategies, while Neuhold et al. [5] focused on the effect of uncertainty on hydrodynamics and sediment transport including their impact on flood risk. Common application of uncertainty analysis can be found in flood damage assessment [6,7,8], where uncertainty is analyzed in context of inundation mapping, land use, or damage models. Apel et al. [9,10] observed the effect of uncertainty on hydrological analysis, including the effect of dike (levee) failure as well. Van Der Most and Wehrung [11] demonstrated that uncertainty related to possibility of dike failures should be included in the flood risk assessment.
Uncertainty appears not only during the risk assessment, but is also found in the observed system’s behavior. Due to their complexity, flooded river systems are subject to changes which do not coincide with the assumptions in the risk estimation [12,13]. Plate [14] explained the possibility of residual risk application; the risk that remains unmanaged due to failure of a flood protection system. Dikes, for example, will more likely fail by structural weakness rather than overtopping, causing unexpected risk from flooding not included in the risk assessment [15,16]. On the other hand, the uncertainty related to the human behavior significantly affects implementation of risk management measures, especially during the flood response actions [13,17,18].
The effective flood risk management considers implementation of measures for reducing flood risk within the managed system under the influence of uncertainty [19,20]. Due to the complexity of the flooded systems it is often difficult to clearly understand the impact of uncertainty on risk. According to Höllermann and Evers [21], uncertainty and risk are closely connected, and the identification of uncertainty helps to assess suitable risk management strategies. Uncertainty will appear whether we consider it or not, it has no meaning in itself but acquires meaning when a decision maker establishes a “knowledge relationship” between uncertainty and the system that is being managed [22,23]. This implies that the information about uncertainty becomes substantial once its particular effects and impacts on the risk are determined.
Still, some researchers and practitioners have not considered uncertainty analysis as a part of flood risk assessment process [1,24,25]. By avoiding uncertainty analysis decision makers could make decisions based on overly cautious expectations, or they could ignore potential extreme events [26]. In other words, during planning and implementation of flood response measures, there is a possibility of risk misperception in a decision-maker’s judgement due to the lack of knowledge about the analyzed system. As a consequence, the latter can lead to underestimation or even overestimation of a potential flood impact, causing increase of undesired consequences on one side, or excessive emergency response costs on the other [27].
Some researchers focus on examining causes of uncertainty, or thoroughly examine effects of some particular uncertainties on risk [4,5,6,7,8,9,10]. Although information obtained from these analyses are valuable, they often present an obstacle for decision makers who find these analyses insufficient or incomprehensible [28]. Decision-makers’ requirements are oriented towards a wide spectrum of uncertainty, underlining the need for an exhaustive and straightforward approach, which will include extensive range of uncertainty and provide clear and useful information about impact of uncertainty on the risk. A useful example is the research of Hall and Solomatine [29], where they developed a framework for uncertainty analysis in flood risk management decisions, focusing on changes in flooding systems caused by extensive range of uncertainty over a long-term period of time. However, during flood emergency response the decision-making scope is different, and the time period for implementation of measures is significantly shortened.
Flood emergency responders need to take discrete choices between actions for mitigation of potential loss and damage, which are often based on yes/no decisions and usually under a deadline [30,31,32]. Uncertainty analysis must be suited to their specific decision-making context, containing the required practicability, and fulfilling the demands for exhaustive but understandable information focusing more on the effects of uncertainty rather than just causes. This was a motivation to develop an approach for uncertainty analysis suited for a more practical application, which can also be used for examining the effects of the uncertainty of the system behavior.
In this research, we propose a robust methodological framework for uncertainty analysis related to flood risk considering a decision-maker’s perspective, with the temporal component prior and during a flood event. The proposed approach has been designed for comprehensive identification, integration, and quantification of uncertainty related to the flood risk. It enables decision makers and practitioners to analyze the effect of wide range of uncertainty on risk. Following the steps of the proposed framework, the robustness and applicability of the developed approach were demonstrated on the Sava River case study, in the area of the city of Slavonski Brod in Croatia.
2. Materials and Methods
2.1. Case Study Area
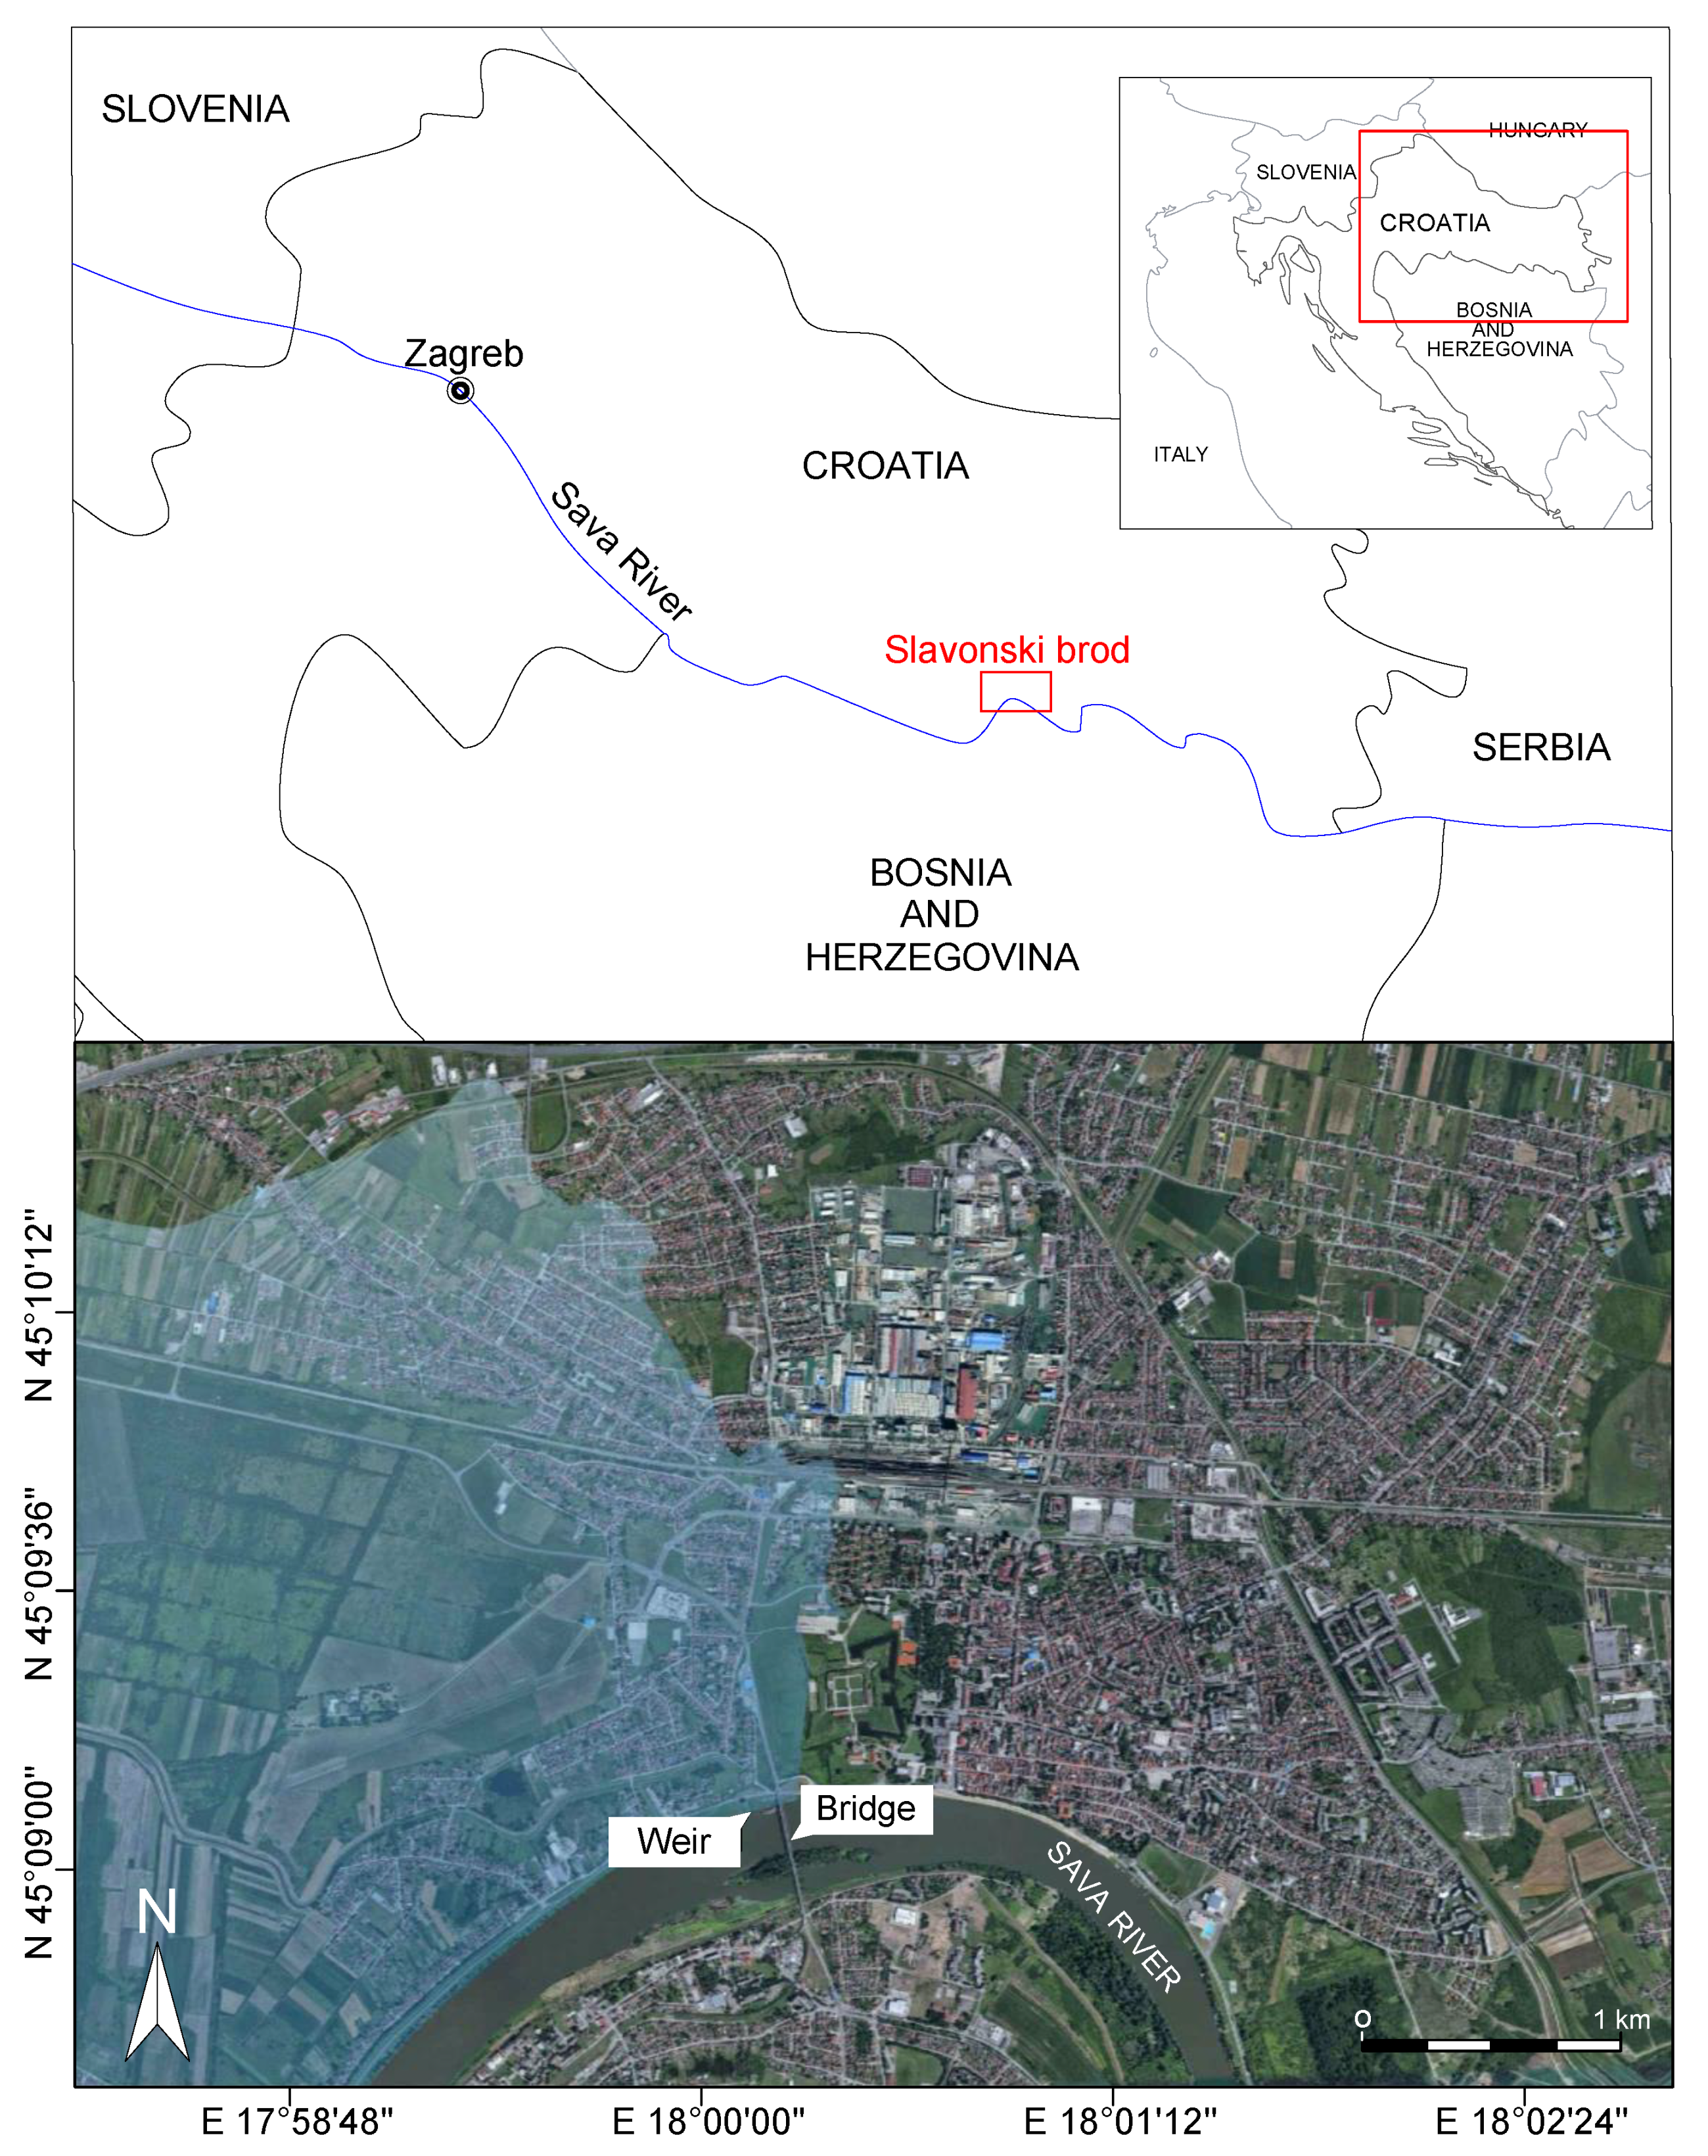
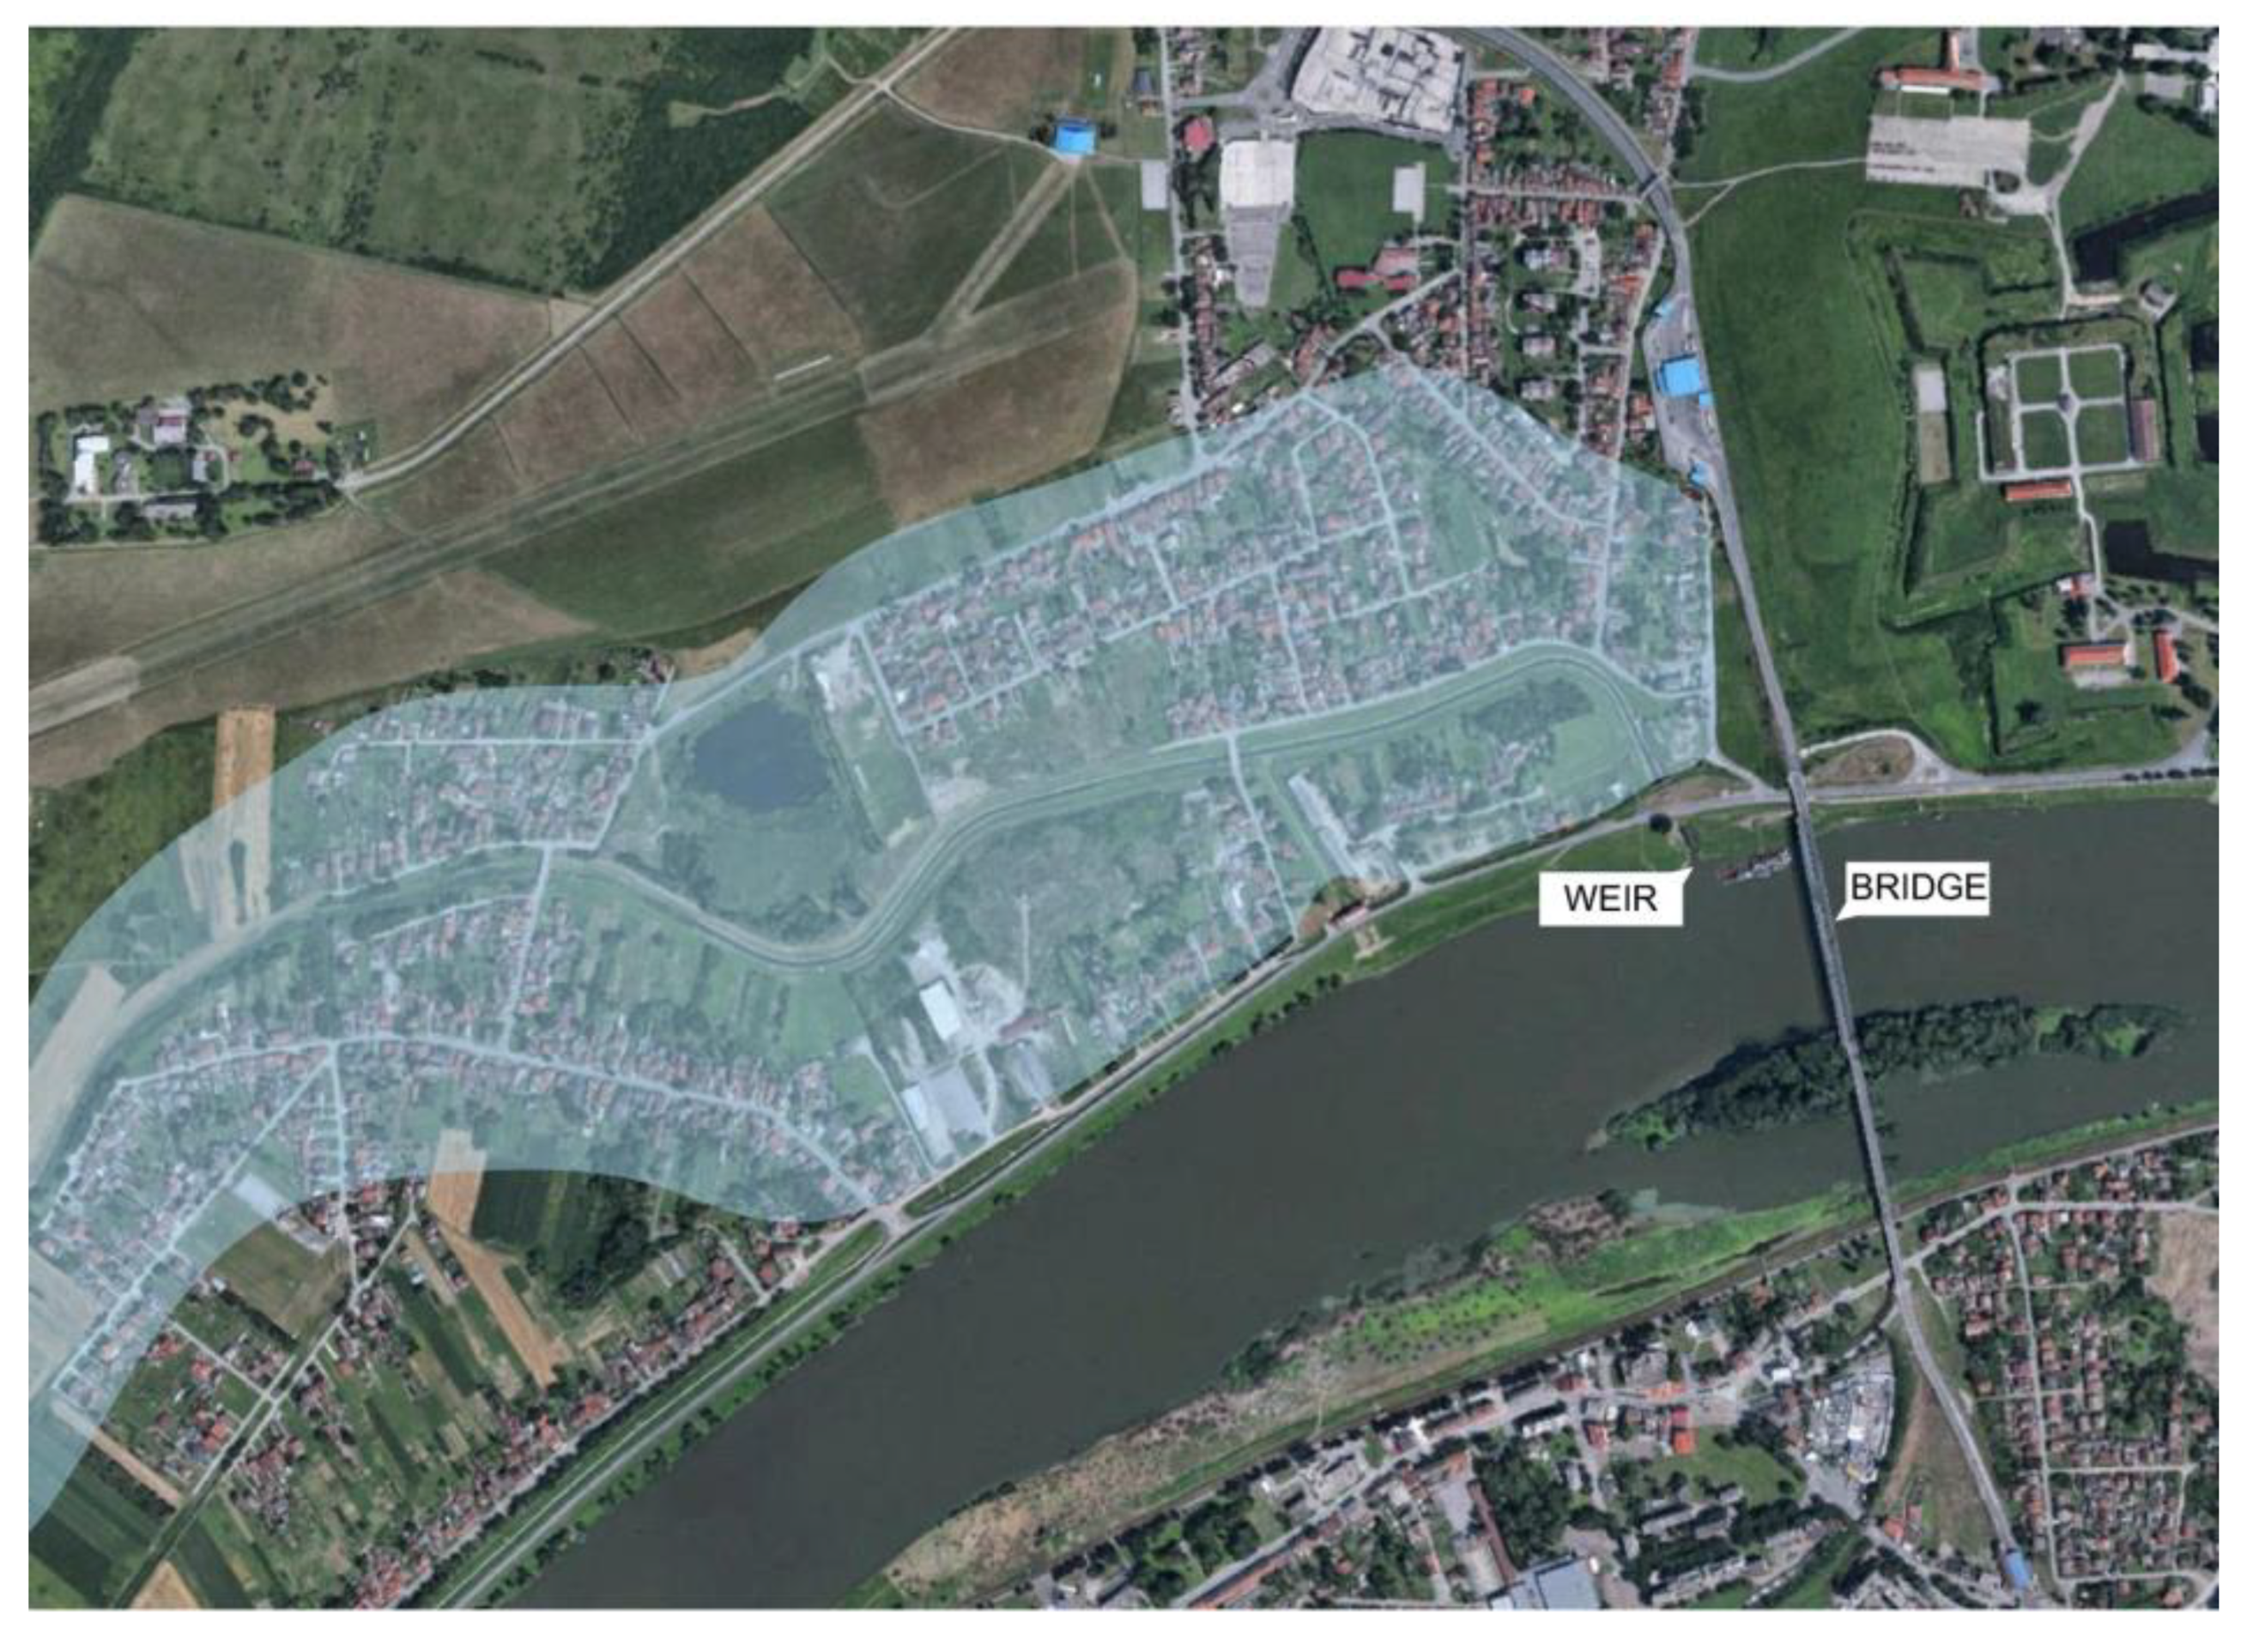
A case study area is the Sava River, a typical lowland river representing the longest river in Croatia. It flows through Slovenia, Croatia, Bosnia and Herzegovina, and discharges in the Danube River in Serbia (Figure 1). In May 2014, the catastrophic flood event occurred along the Sava River, overtopping hinterlands in Croatia, Bosnia and Herzegovina, and Serbia. This flooding event was the motivation to consider the city of Slavonski Brod (Figure 1), located on the Sava river left bank with approximately 60,000 inhabitants, for the case study analysis.
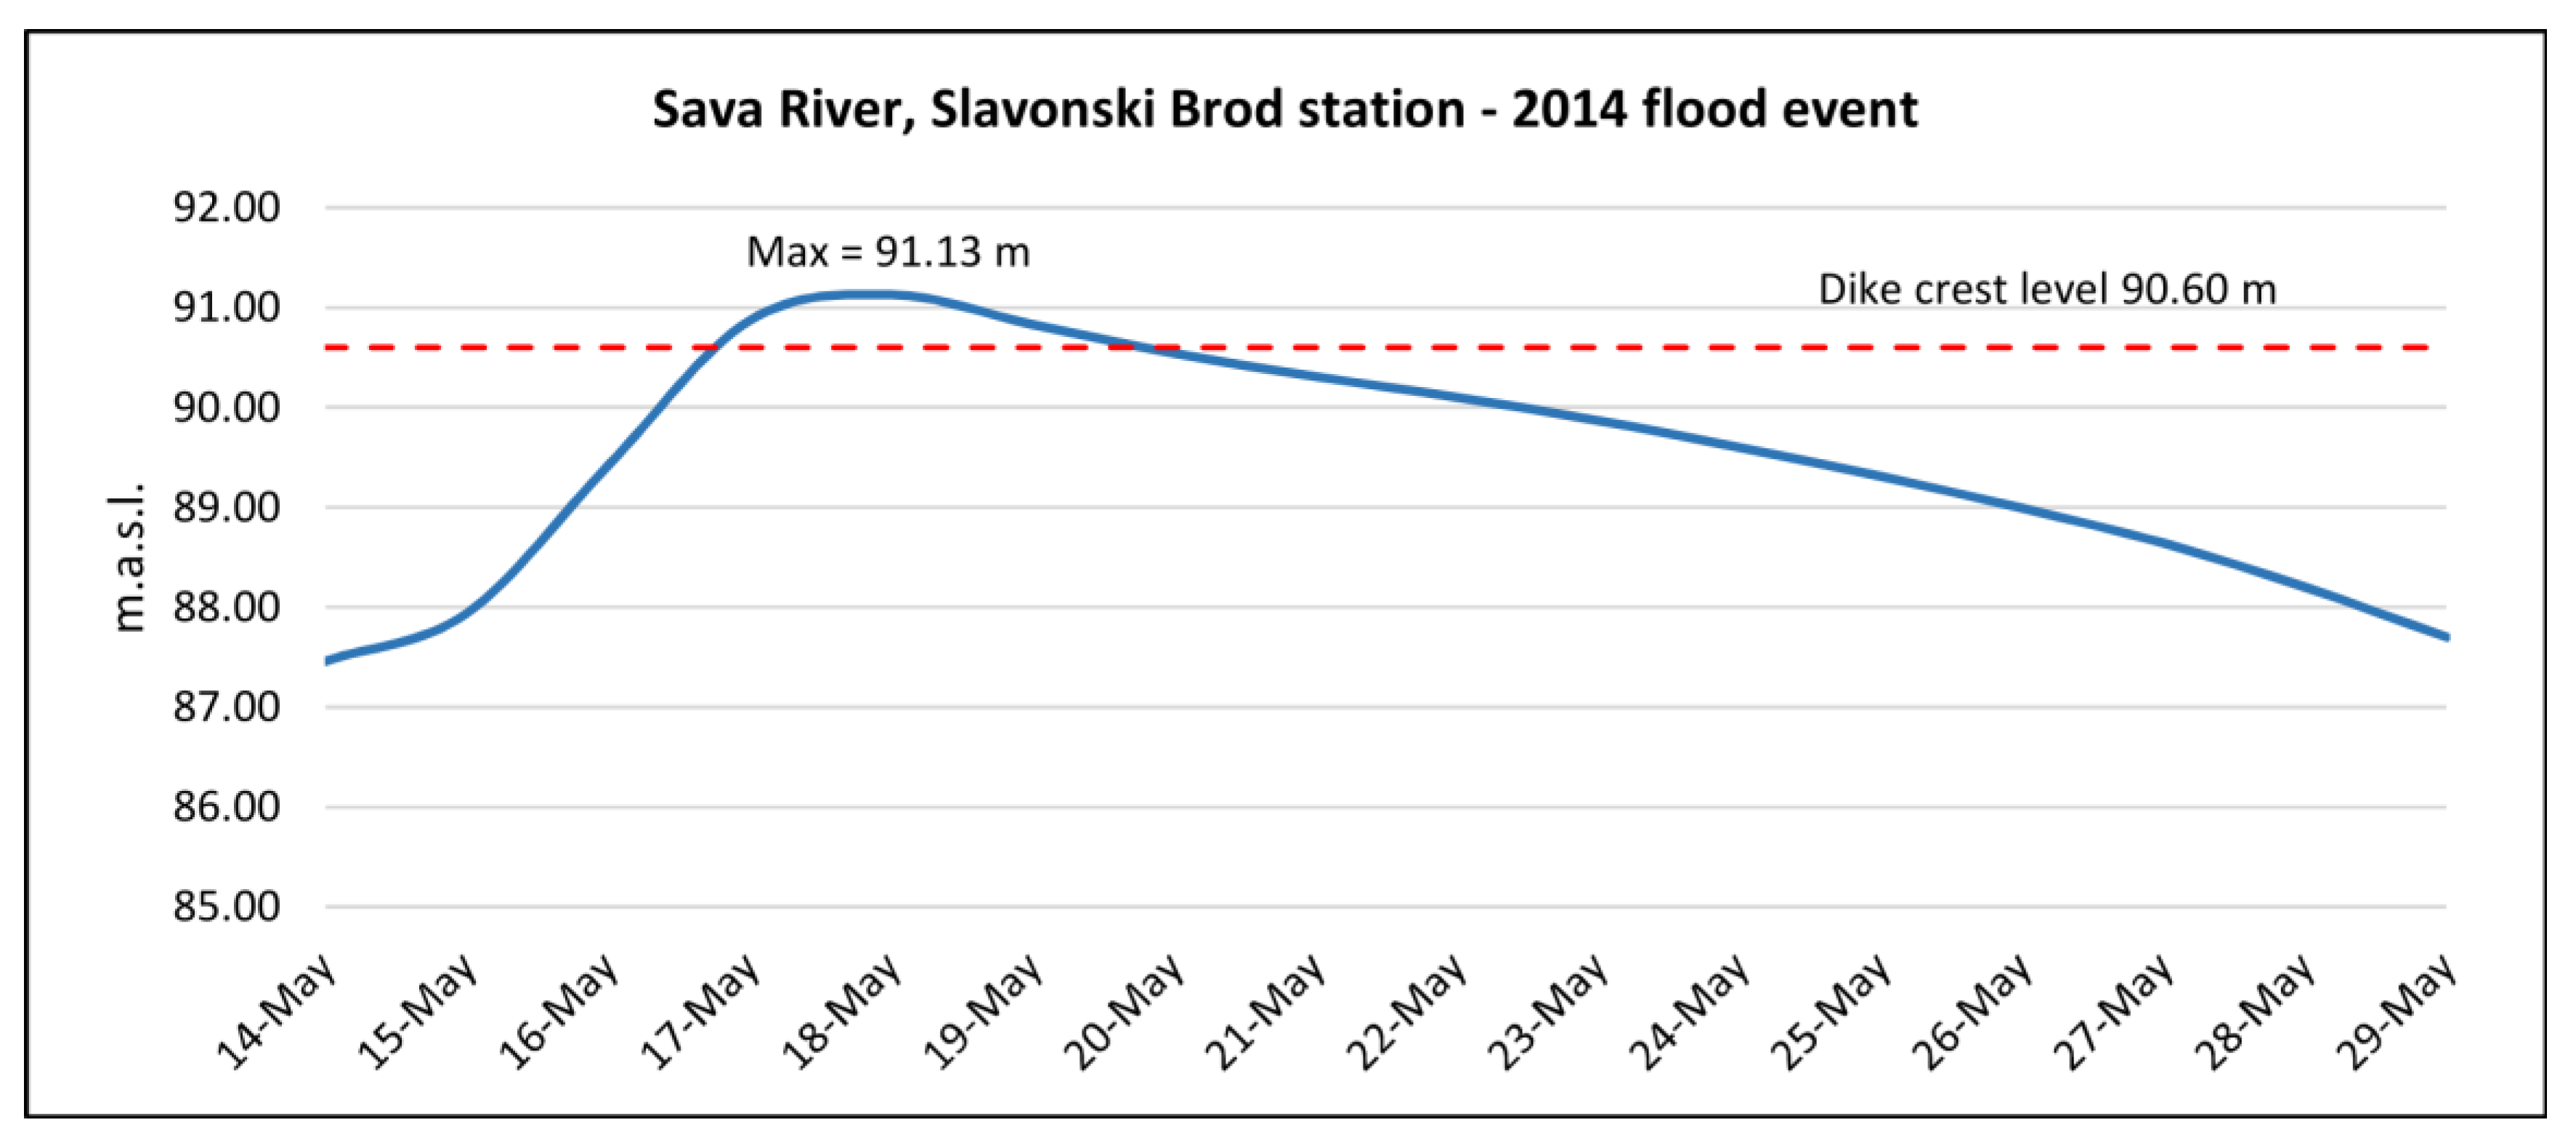
The city and the surrounding area are frequently threatened by flooding, and during the 2014 flood event most of the city was evacuated. During this flood event, the highest discharge/stage value ever was recorded on the gauging station Slavonski Brod, and estimated flooded area for 2014 flood event is shown in Figure 1. Hydrological data for the 2014 flood event showing the stage data measured at gauging station Slavonski Brod is shown in Figure 2. The maximum stage value of 91.13 m above sea level (m.a.s.l) has been recorded (18 May) and the stage value exceeded the dike crest level (90.60 m.a.s.l.) for more than 3 days.
The flood event on the Sava River in 2014 emphasized the threat coming from the uncertain behavior of flood protection, exposing the weaknesses of the system that might be caused by multiple structural failures. According to Sava Commission Report [33], during the event, almost simultaneous breaching of two dikes at two locations near Slavonski Brod occurred, and despite flood defense was promptly proclaimed, estimated volume of 80 million m3 of water flooded the hinterland. Estimated monetary damage from the 2014 flood on the Sava River was, only in Croatia, more than 300 million Euro, with more than 500 million Euro in total considering all affected countries [33]. Although many lessons have been learned from the 2014 flood event, there still exists a significant threat of flooding, despite building additional structural measures.
2.2. Framework for Uncertainty Analysis
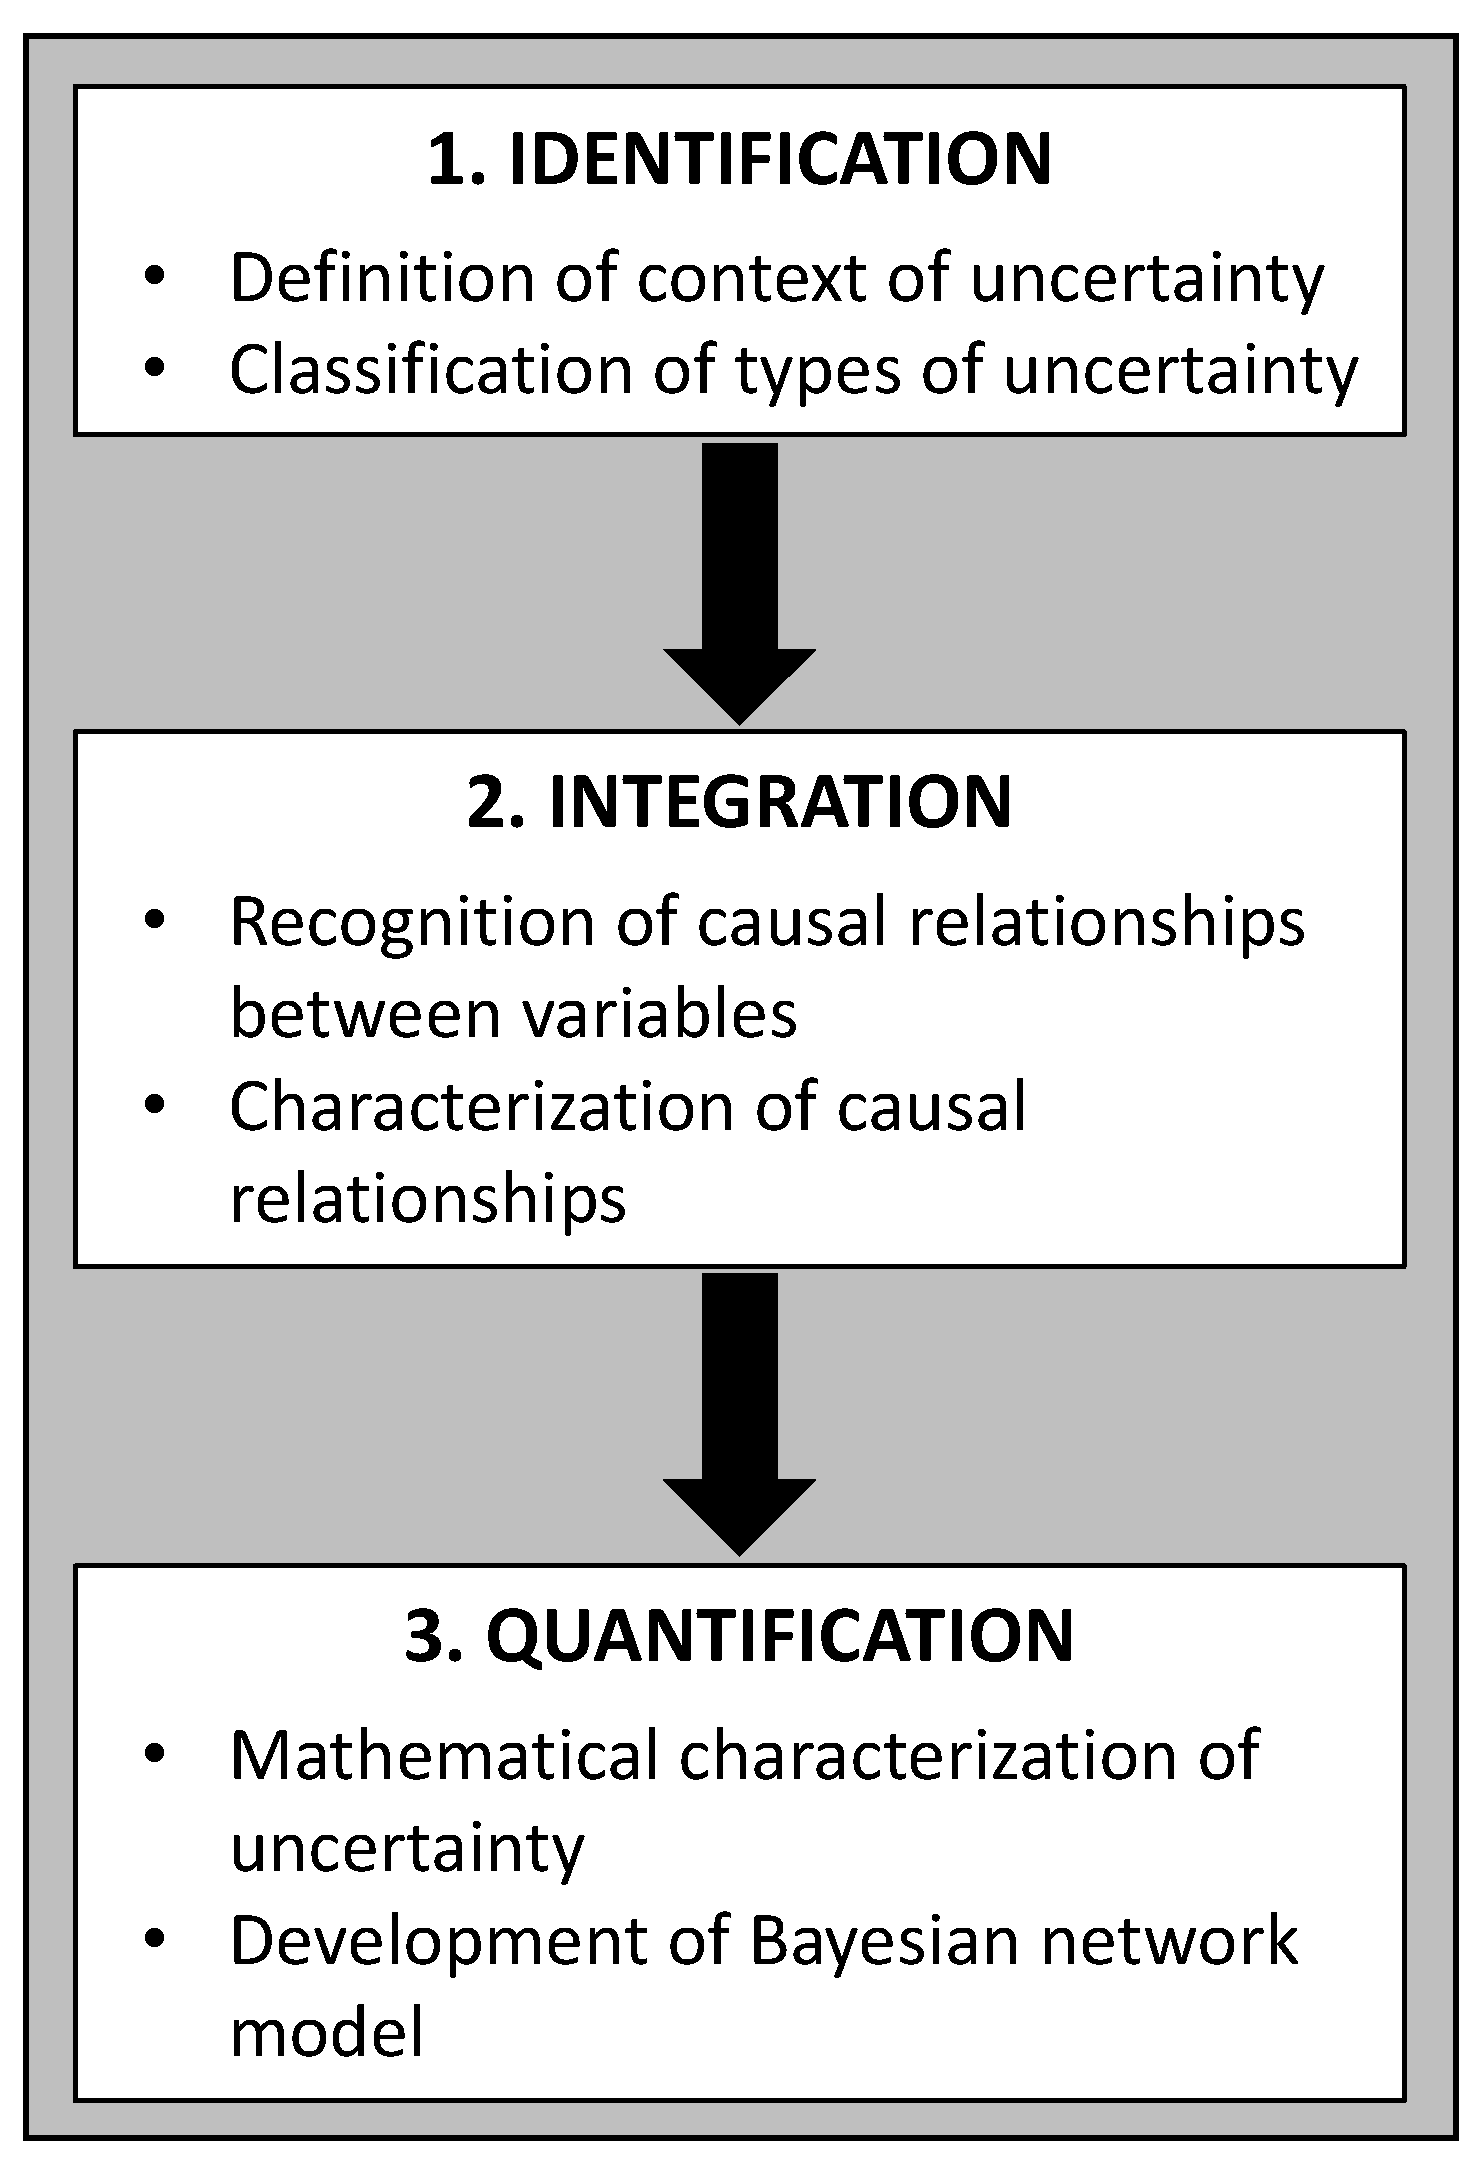
A framework for uncertainty analysis is introduced in order to support understanding and logical reasoning of the basic processes related to the uncertainty analysis. It is designed to support the decision-making process through effective and straightforward uncertainty analysis in the context of flood risk and considering a decision maker’s perspective. Due to complexity of processes related to uncertainty analysis, the elements of “system approach” are applied to structure the steps of the proposed framework. This is particularly related to the identification of system’s elements, definition of system’s structure by the recognition of mutual interactions, and quantification of the elements’ influence on the system outputs. As a result, a three-step framework for a comprehensive identification, integration, and quantification of uncertainty is proposed (Figure 3).
The first step of the framework considers identification of sources of uncertainty regarding their particular type and specific context within the analyzed system. The second step of the framework is related to the integration of uncertainty, which considers establishing relationships between identified sources of uncertainty. This is performed by using a developed generic model with variables representing the identified sources of uncertainty. The integration process considers additional characterization of mutual relationships between model variables through defining causal dependencies in a form of semantic expressions. The final step of the framework is the quantification of uncertainty, where all variables are assigned with the corresponding mathematical functions, which afterwards give a structure of the Bayesian network used for the overall quantification of uncertainty in the flood risk assessment.
2.2.1. Identification of Uncertainty
The identification of uncertainty considers recognition and characterization of uncertainty within the analyzed system. During last decades, numerous approaches were introduced by different authors for the general characterization of uncertainty (Table 1).
The complexity of uncertainty and variety of characterization indicate that there could be a severe obstacle in the practical application. This was a motivation to develop an approach oriented towards decision-makers’ practical requirements which facilitates the identification and characterization of uncertainty.
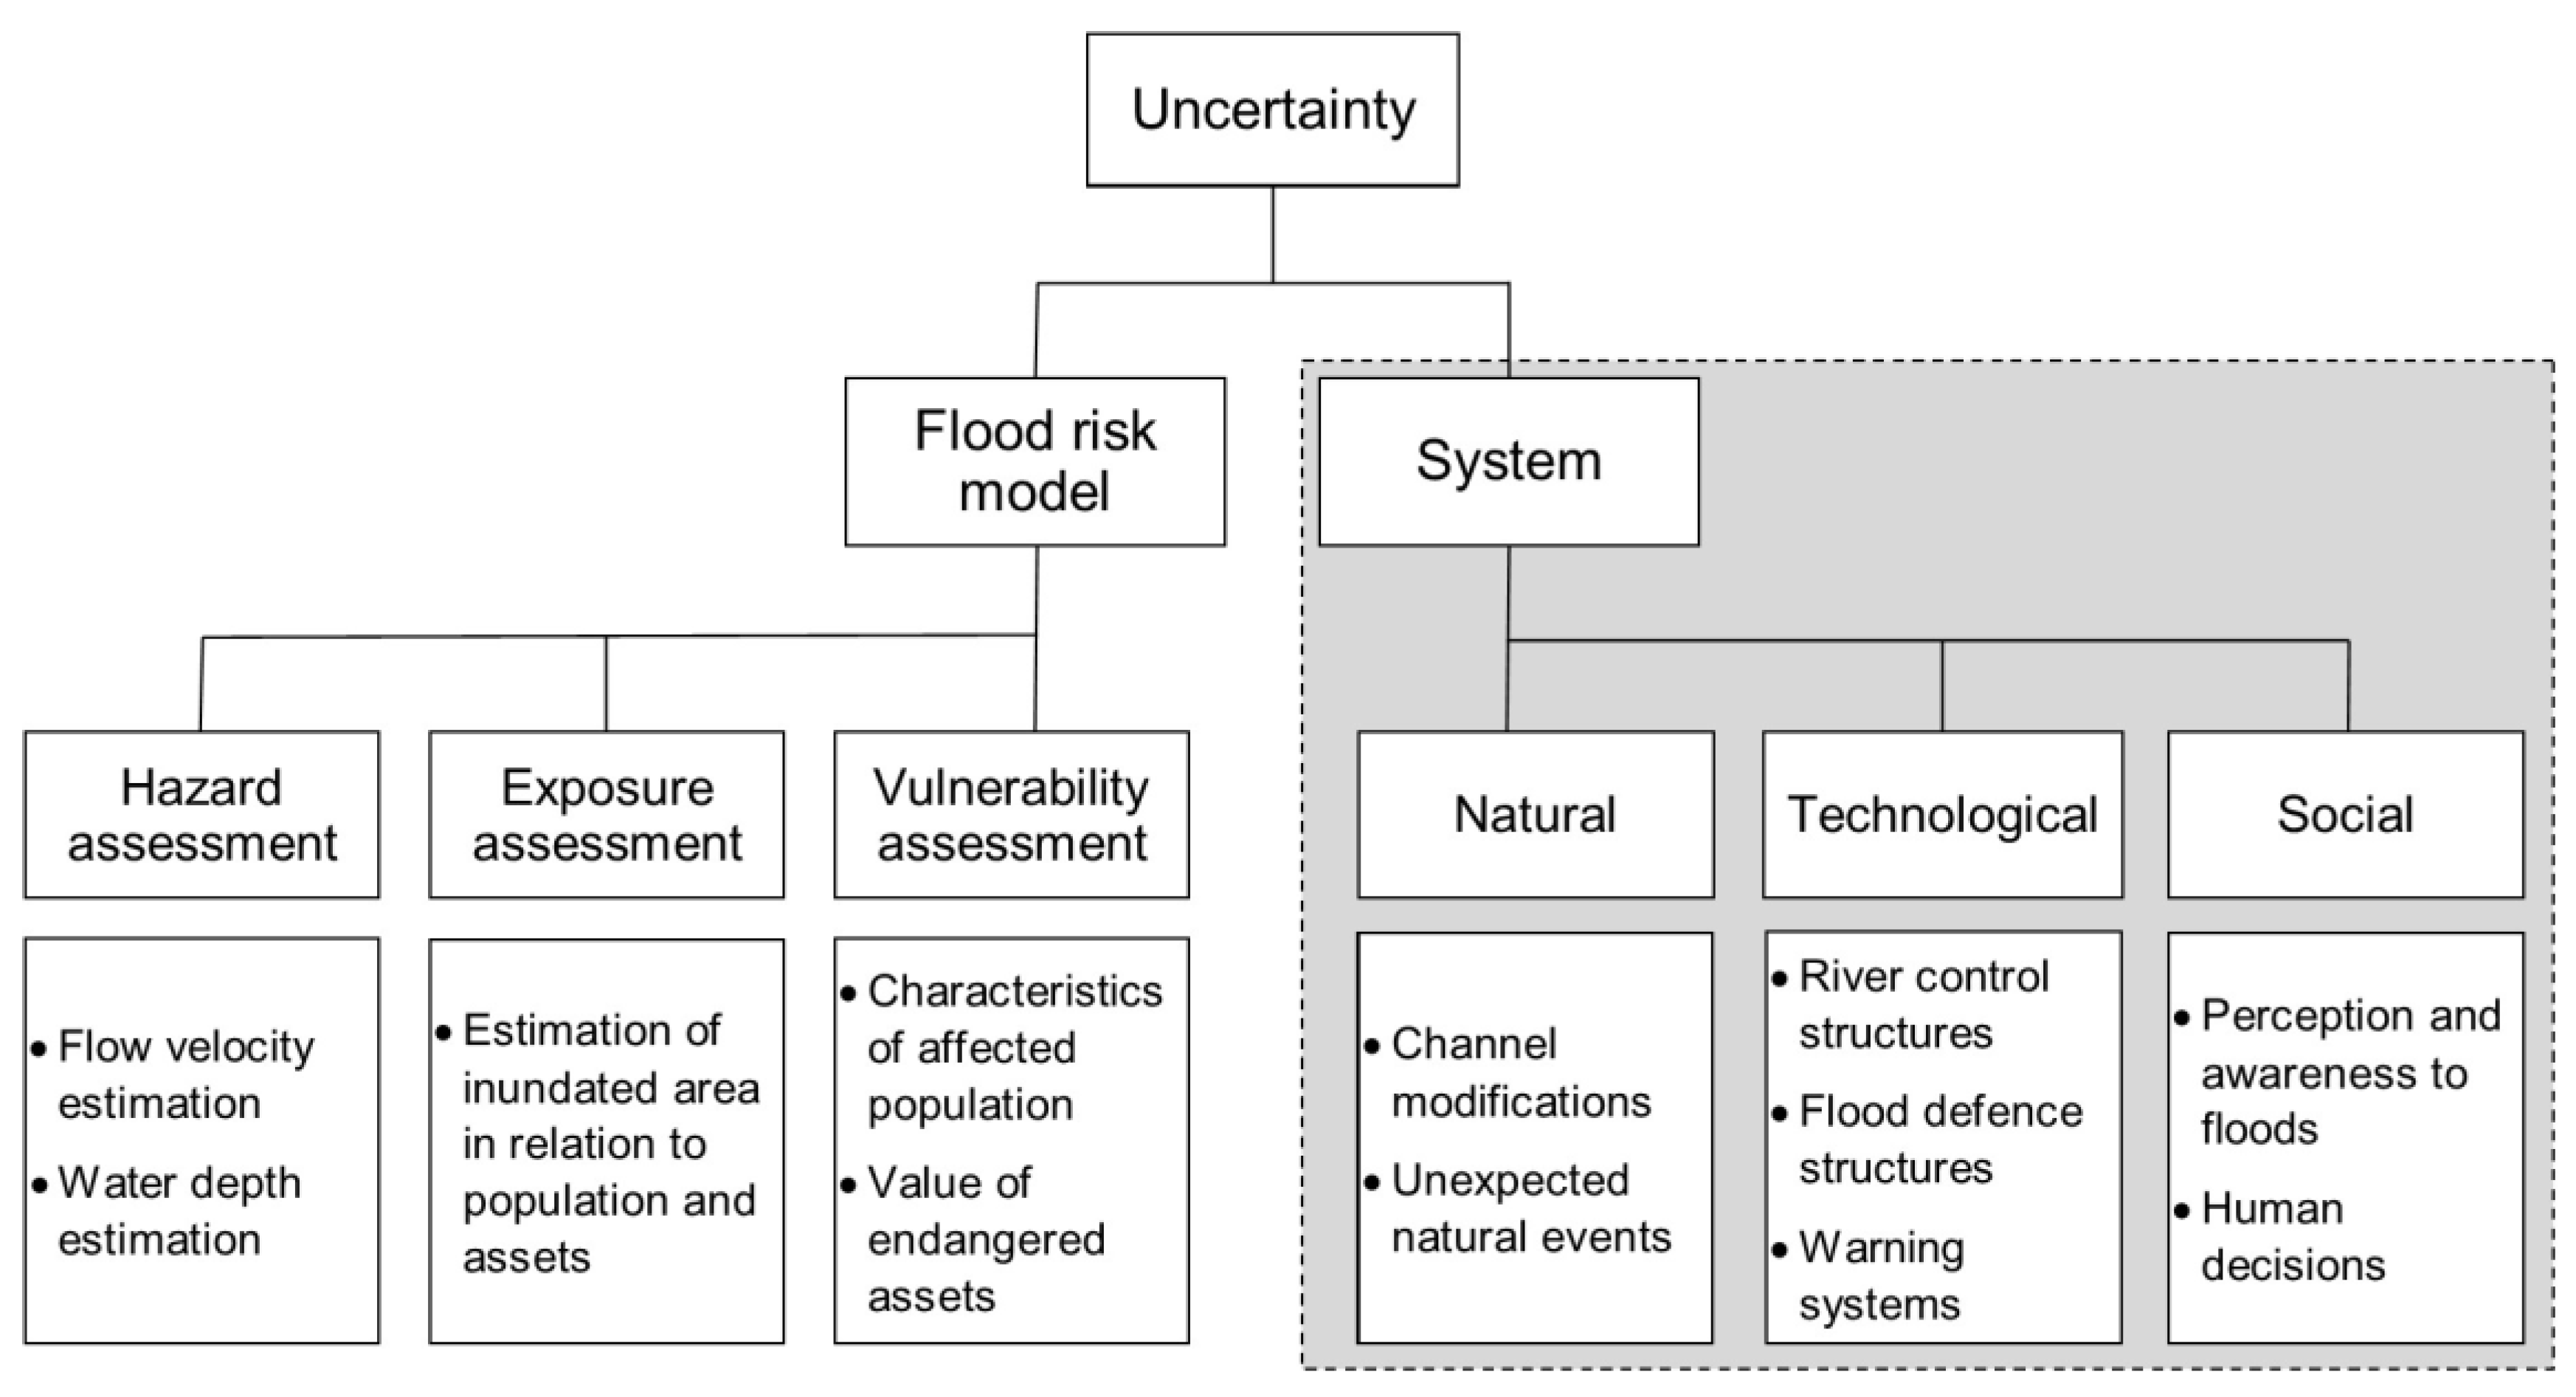
The identification process, in the first part, is related to evaluation of the domains where uncertainty could potentially stem from. A general classification of domains and corresponding subdomains, proposed to assist the recognition of the particular context, is presented in Figure 4. The proposed classification is a hierarchy having two major domains where uncertainty appears: uncertainty in the flood risk model and uncertainty in the system.
A common approach for flood risk assessment is the evaluation of the flood risk model factors; hazard, exposure, and vulnerability [42,43,44], characterized by the corresponding physical and/or modelled parameters.
Flood hazard is commonly defined with two parameters: velocity and/or depth of water on the flooded area. The values of these parameters are obtained from the flood model, and they are subject to uncertainty due to computational errors, input or digital terrain model uncertainty, resulting in possible variability of flood model results.
Uncertainty in exposure assessment is also related to flood model results. Due to uncertain flood model outputs, the inundation coverage is variable, meaning that the number of people and assets exposed to flood can be uncertain. In addition, estimation of exposure can be variable due to lack of knowledge about the fluctuation of people within a flooded area.
Uncertainty related to the estimation of the vulnerability comes from the lack of knowledge about characteristics of an endangered area, which can cause a significant difference in estimating expected damage and loss. In case of vulnerability of people, the uncertainty comes from a lack of knowledge about the endangered population, such as share of children and elderly people, or number of disabled people. On the other hand, uncertainty about vulnerability of the assets is caused by the lack of knowledge about the general condition, resistance capacity, or monetary and cultural value of the property.
The second major class of uncertainty is framed in Figure 4. Based on the reviewed literature [11,12,13,14,15,16,17,18], we noticed that there are some additional domains where uncertainty appears, which are also important and may be included in the risk assessment process. Therefore, we propose an extension of the classification of uncertainty related to flood risk by including uncertainty of the system behavior, which is a step forward in comprehensive uncertainty identification. Proposed classification follows the study of Brugnach et al. [45], where it is stated that all sources of uncertainty can be considered in natural, technological, and social context, each presenting an additional subclass in Figure 4.
The first subclass represents the sources of uncertainty coming from natural events and processes. It considers natural changes in a river system as well as other environmental and natural phenomena around a riverbed, thus having a potential impact on the flood risk. These changes are related to natural variation of the river channel due to influence of, for instance, high sediment level or steep vegetation. Additionally, there is a possibility of unexpected natural events, such as ice jams, which may cause unexpected overflow of the river.
Technological uncertainty, as the second subclass, is related to the possible failure of infrastructure, such as river control objects, flood defense structures, or flood warning systems. Flood defense structures, such as dikes, fail by collapsing due to different hydraulic conditions exceeding their structural capacity. Likewise, floodgates and weirs, which represent effective flood defense objects, may collapse due to mechanical failure or a human error. Each of these events may cause flooding of areas that are not expected to be flooded, unexpectedly exposing people and assets to a danger. Failure of warning systems, on the other hand, results in absence of flood warning, exposing people to flooding by causing obstacles during evacuation.
The third subclass represents social and human related uncertainty, which considers social and individual behavior before and during the flood event. Human reactions during disasters are significant factor in reducing severe consequences and fatal losses, so it is important to include human aspect in the flood risk analysis as well. During flood disasters, a chaotic behavior within the affected population is often present, which is related to behavioral variability, different levels of awareness and perceptions of threat, as well as a panic among people. This reflects on human decisions during flood, potentially manifesting as low evacuation rate [46] or human errors caused by people operating floodgates or barriers [47].
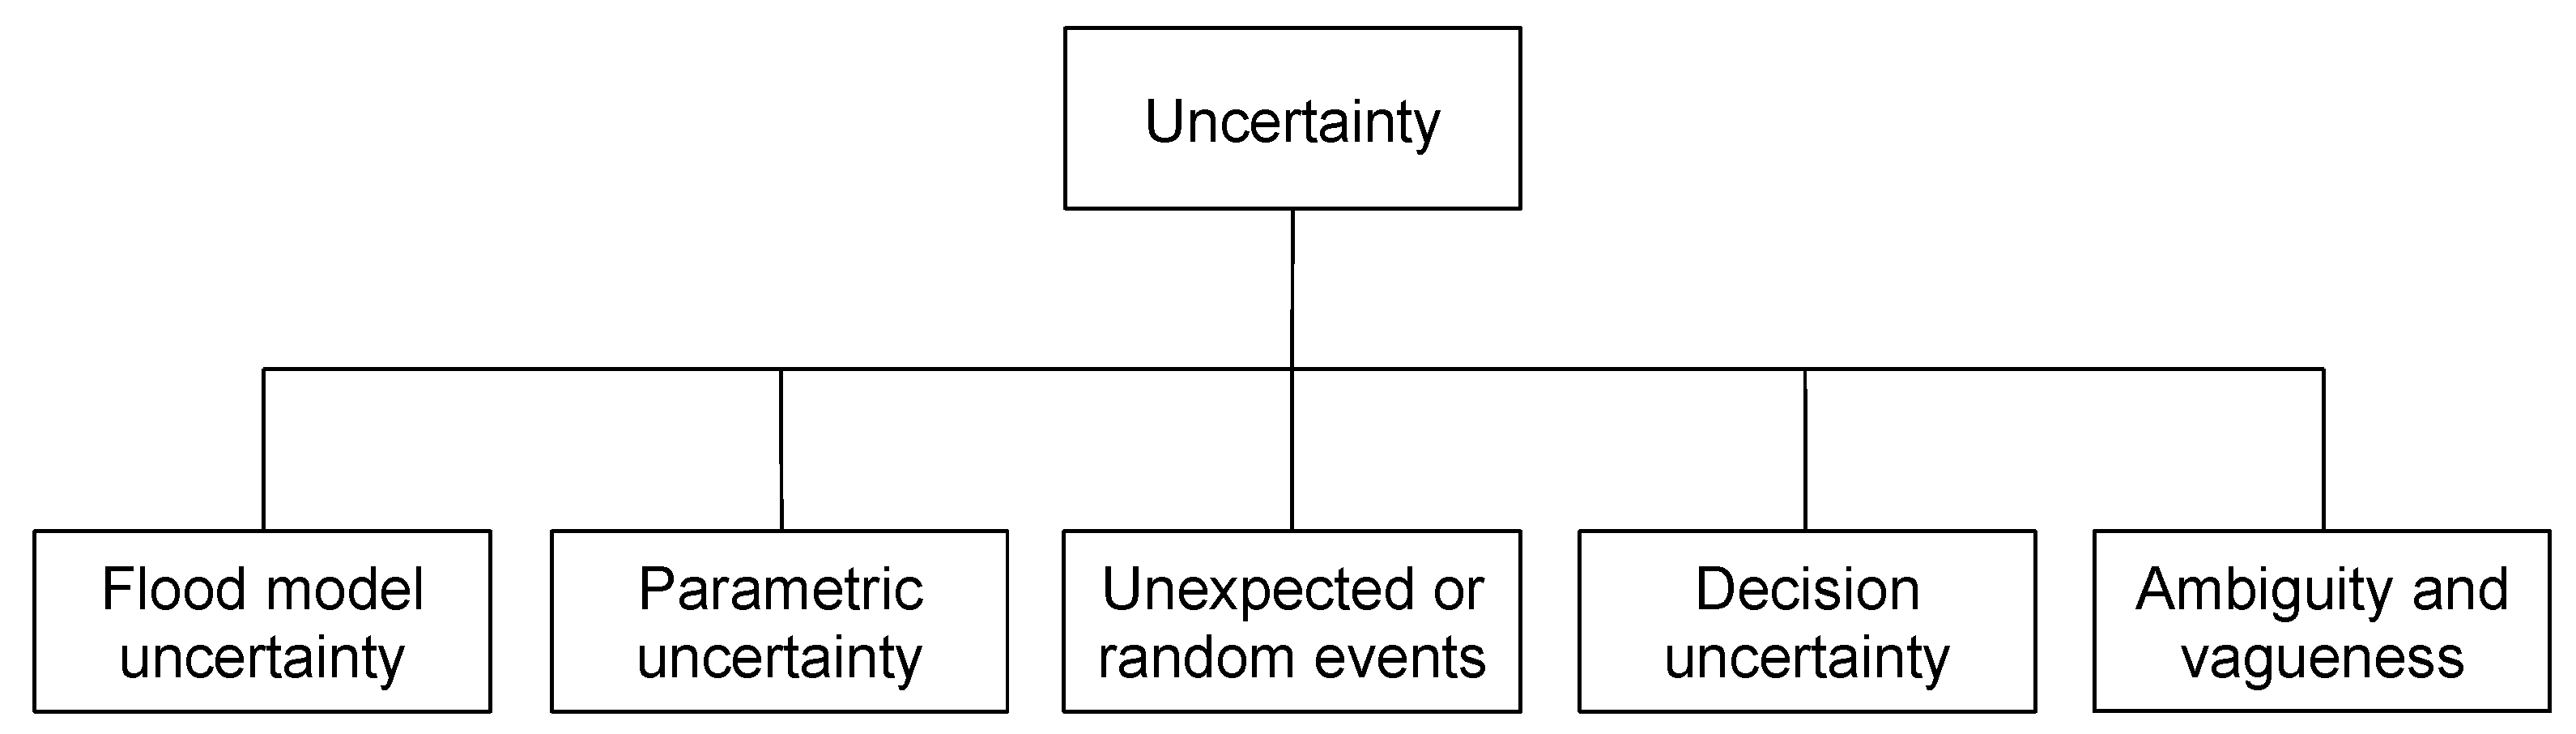
The second part of the identification process is the classification of uncertainty (Figure 3), which is proposed for additional characterization due to different types of uncertainty that exist in relation to the flood risk. The proposed classification consists of five major classes (Figure 5), which are used to characterize the particular causes of the recognised uncertainty.
The first type of uncertainty is related to flood models. Uncertain input, as well as technical or structural uncertainty, cause variability of flood model outputs represented as uncertain estimation of a flooded area as well as hydraulic properties of a flood.
The next type of uncertainty is associated with parametric uncertainty, which is present due to measurement errors, uncertain observations, subjective estimation, or lack of knowledge about some estimated parameter.
Another type of uncertainty is related to unexpected or random events, resulting from unpredictable behavior of the system. This type of uncertainty appears due to natural or technological variability, usually characterized as sudden situations or failures with an element of surprise that cause significant disturbance in the system.
The decision uncertainty comes from unpredictability and variability of human behavior. Human decisions are influenced by fear and panic before and during flooding, which can impact, for instance, the evacuation efficiency. Likewise, it can affect decisions made by persons responsible for operating flood control structures.
The last type of uncertainty is the ambiguity and vagueness. Ambiguity is related to situations when data or information is inaccurate or imprecise. The information is given with a possible range rather than crisp value, and it can be obtained from observations or expert judgement [48]. On the other hand, vagueness is related to different interpretation of information. This can be caused by different perceptions between decision makers, where each of them can classify some information differently [49]. This may lead to inconsistency in communication during the estimation of the threat from flooding, consequently resulting with conflicting decisions.
2.2.2. Integration of the Identified Sources of Uncertainty
The second step of the proposed framework (Figure 3) is the integration of uncertainty, which considers recognition of the functional relationships between identified sources of uncertainty and their relations to the risk. This process presents the key element for understanding of uncertainty in the context of flood risk, which is essential in acquiring knowledge about the managed system.
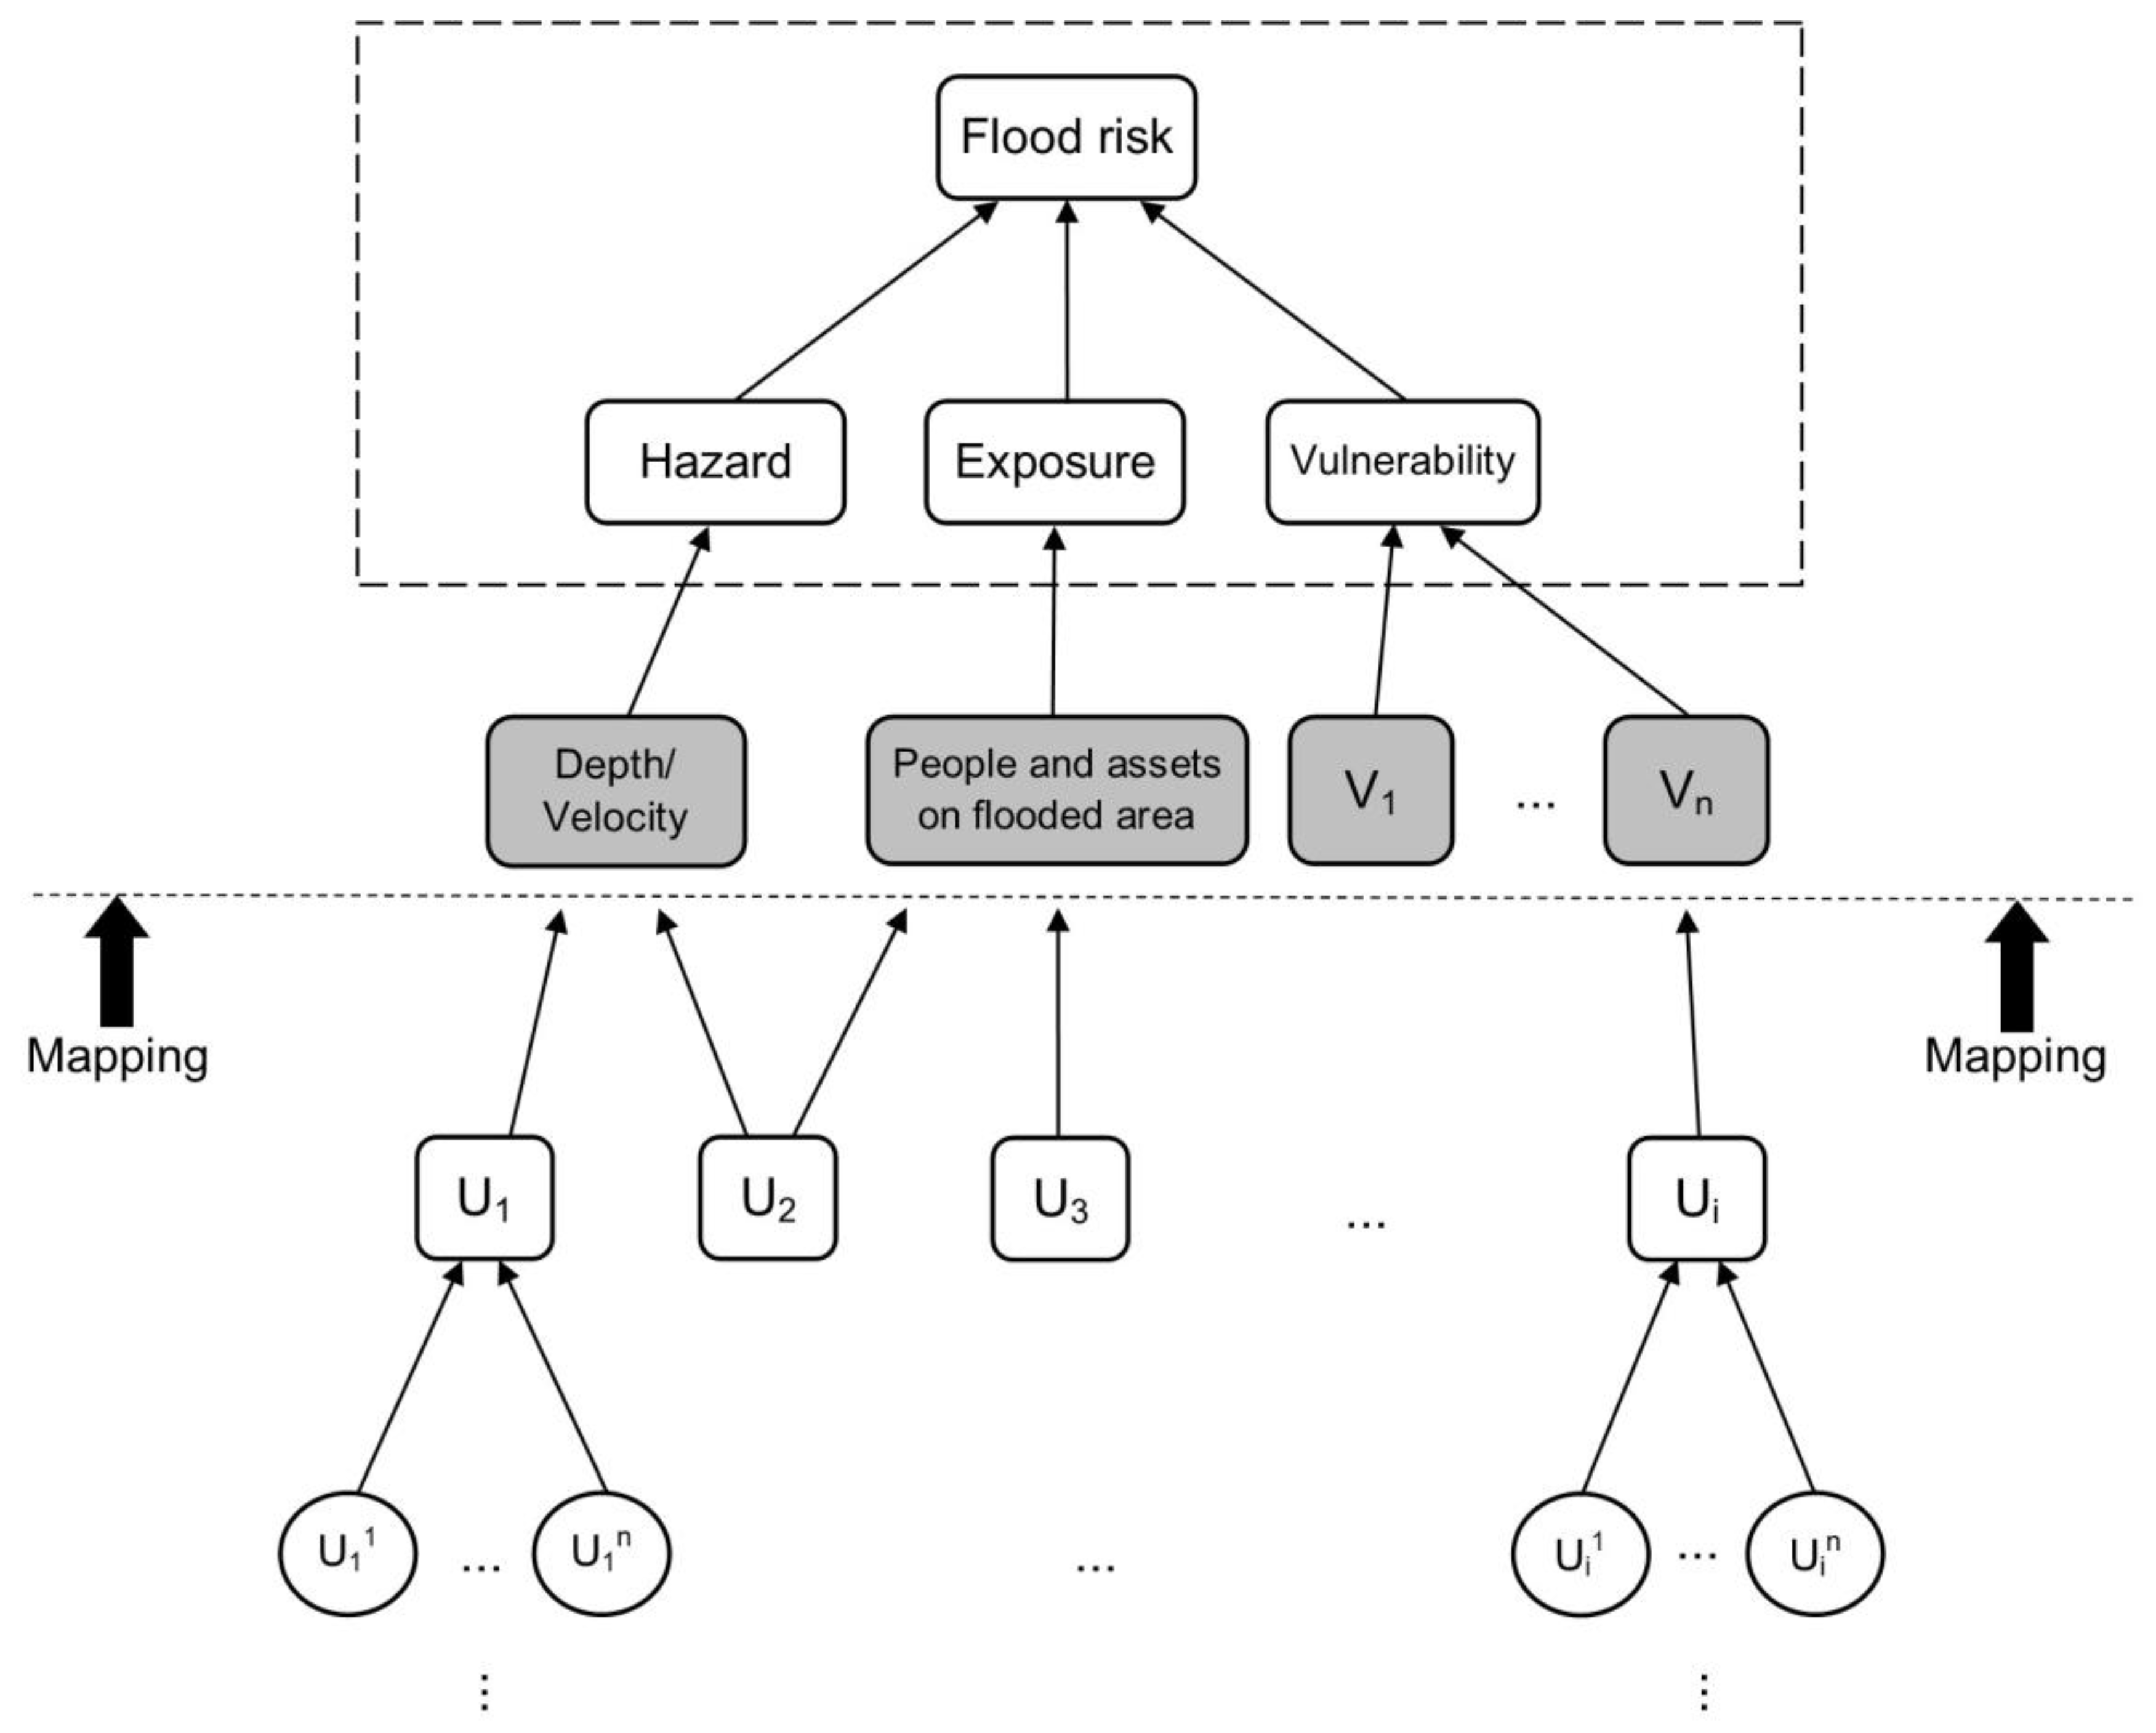
The first part of the integration process is the recognition of mutual relationships between identified sources of uncertainty. We propose a generic model (Figure 6) with a capability for efficient integration of different kinds of uncertainties, where variables of the generic model represent the sources of uncertainty illustrated in the Section 2.2.1. Generic model is structured as a directed acyclic graph in the form of a causal network, consisting of nodes representing variables, and arrows indicating existence of causal relations between the variables.
The graph is acyclic considering that the integration is a straightforward process in the generic model with no loops within the system, thus no part of the process starts and ends at the same node. The graph representation is used because of its robustness to adapt to changing conditions, the ability to represent reasoning within a real system, and the possibility to modify the system’s presentation by adding or removing variables without disturbing the basic concept.
The generic model is structured as a hierarchy in order to reduce the degree of complexity in perception about the system that is being modelled. The structure of the model starts with risk model factors, which are framed on the top of Figure 6, and they are connected with matching parameters used for particular evaluation of risk model factors.
The flood hazard variable is expressed with two possible uncertain parameters (dark grey); the flow velocity and/or the water depth. The exposure is defined with another fixed variable of the generic model, people and assets on the flooded area (dark grey), representing uncertain proportions of the flood on the endangered area in relation to people and property. The vulnerability is a third risk model factor, determined with a set of variables (V1, …, Vn), each representing the particular vulnerability (dark grey) of endangered assets, property, or people, which are under influence of uncertainty as well.
In the next level of the generic model a set of variables U1, …, Ui represent identified sources of uncertainty in the observed system. This set of variables is selected and structured by mapping on the uncertain parameters of the flood risk model factors. Furthermore, the generic model may contain additional set of subvariables U11, …, Uin in the next hierarchical level (Figure 6), indicating that each system uncertainty source may contain multiple causes leading to its occurrence. For example, if we consider U1 to be a weir failure, as one of the system uncertainties, the U11 and U12 may represent the mechanical and human failure, respectively.
The second part of the integration process is related to additional characterization of causal relationships between the variables of the model. Dependencies between variables of a generic model, presented in Figure 5, are defined with arcs and arrows without any particular specifications. However, these dependencies are not the same, so the first-order logic is used for the further definition of the causal relationships between variables. By establishing relational dependencies between the variables, a causal model is upgraded with semantic expressions (quantifiers) used for additional description of the system’s relations.
Any complex system can be structured with a set of independent and dependent variables, with either simple or complex relationships. This indicates that the existence of one variable implies existence of another, indicating a direct cause–effect relationship. In that case, one variable directly causes another, meaning that some variables require a parental or trigger variable to occur. Equation (1) states that for every variable B exists a variable A, such as that A causes B, expressing their fully dependent relationship.
(ⱯA) (ƎB) (Variable (A, B)) ⇒ cause (A, B)
On the other hand, some variables contain their own initial property or value, which can be related to some other characteristics or processes. In that case, one variable has no direct influence on existence of another one, but it can change its value or property, making their relationship partially dependent. Equation (2) states that for variable B exists variable A, such that A changes B. The requirement for this type of relation is prior existence of variable B, so the occurrence of variable A may cause, for instance, either increase or decrease of initial value of variable B.
(ⱯA) (ƎB) (Variable (A, B)) ⇒ change (A, B)
In this particular application, there are no variables that are caused and changed simultaneously by another. The stated quantifiers are mutually exclusive, which means that if one of them is true, the other one is false, creating an exhaustive set of predicates for the particular universe of discourse. This is shown in Equation (3), where it states that E is the set of relations (cause, change), so there are no results in the following case:
﹁ Ǝ E (cause (A, B)) ∧ (change (A, B))
2.2.3. Quantification of Uncertainty
The final step of the proposed framework is the quantification of uncertainty, where the overall quantification of recognized uncertainties is performed. In the first part, this process considers mathematical characterization of uncertainty, where each type of uncertainty is represented with a corresponding function. In the second part, a Bayesian network model is developed for an overall quantification, which is performed by including the probabilistic variables in the model and substituting the qualitative causal relationships with the corresponding probabilistic functions between them.
All variables of the Bayesian networks are formally represented as probabilistic ones, expressing a degree of knowledge or belief about occurrence of some variable. Unlike other formal probabilistic methods Bayesian network combines variables that are expressed not only with probabilistic functions, but also with other quantitative, semiquantitative, or even qualitative expressions.
Due to different types of uncertainty, explained in Section 2.2.1., there exist certain particularities in their mathematical characterization. In Table 2, we summarize the proposed mathematical characterization of each type of uncertainty.
The flood model uncertainty causes the variability of the model results, which are commonly evaluated through the sensitivity analysis.
Parametric uncertainty is characterized with the variability of some parameter values, and considering its particular characteristics, probability distribution is used for describing this type of uncertainty. The probability distribution describes the parameter with the mean and variance as location and scale parameters, respectively. It can be discrete or continuous, depending on the requirements and available data.
Unexpected or random events, due to their nature of appearance which mostly considers the element of surprise in the observed system, are represented with two possible states: occurring and not occurring, which corresponds to a Boolean random variable. Additionally, some of these events might have a discrete probability distribution usually labelled with a corresponding chance of occurrence.
Similarly, decision uncertainty representing individual human decision is characterized with two possible states as well (yes or no). Furthermore, decisions made by the endangered population can be described with a range of possible decisions associated with the corresponding probabilistic value.
Uncertainty resulting from ambiguity and vagueness is represented using a fuzzy set theory, an approach originally introduced by Zadeh [50], where variables are represented as fuzzy sets with corresponding membership functions. Fuzzy set approach has the ability to efficiently represent imprecise, imperfect, or vague information, and it is suitable for representing imprecision and other states where it is unable to exactly differentiate the involved events in the situation [51,52,53,54].
Ambiguity is characterized with an inaccurate or imprecise information, resulting with a range of possible values instead of a crisp value. The range of possible values is described with a membership function, where each possible value within the range is assigned with its membership value between 0 and 1, representing the degree of membership and defining the grade or strength of its belonging to a certain set. Vagueness is characterized with a fuzzy set defined with membership functions containing vague boundaries. These vague boundaries describe the different interpretation during the definition of a certain class to which information belongs to, showing that it can belong to either one or more classes at the same time.
The second part of the quantification is the development of a Bayesian network model used for overall quantification of impact of uncertainty on risk. This approach is characterized with the ability for efficient integration of different classes of information [55]. It is widely used in problems related to water management and disaster management as well as for general quantification of uncertainty, risk assessment, or as a decision support tool [56,57,58,59,60].
Bayesian network is a probabilistic model used for the representation of a joint probability distribution over a set of variables, where causal relationships between the variables are replaced with conditional probabilistic dependencies. The general expression for defining the joint probability is equal to:
where P(X1 … Xn) is the joint probability distribution over a set of variables, Xi are the variables, and parents(Xi) is the set of variables directed to Xi.
Since all variables are represented with the corresponding mathematical techniques in the previous section, the further step in developing Bayesian network model is the definition of probabilistic relationships between the variables. These probabilistic relationships replace the semantic causal relationship explained in Section 2.2.2.
A causal relationship that corresponds to expression causes (1), considers that variables A and B are fully dependent, meaning that the probability of a dependent variable B fully corresponds to probability of variable A. The second causal relationship, changes (2), considers that the dependent value B contains some initial or prior probability, so the posterior probability of the variable B given variable A is estimated based on the Bayes’ theorem.
A causal relationship that corresponds to expression causes (1), considers that variables A and B are fully dependent, meaning that the probability of a dependent variable B fully corresponds to probability of variable A. The second causal relationship, changes (2), considers that the dependent value B contains some initial or prior probability, so the posterior probability of the variable B given variable A is estimated based on the Bayes’ theorem:
where P(B|A) is a posterior probability of B given that A has occurred, P(A|B) describes the likelihood of variable A occurring given that variable B has occurred, P(B) is a prior probability of variable B, and P(A) is called the normalizing factor, often computed using the law of total probability.
Uncertainty resulting from ambiguity and vagueness is characterized with a fuzzy set theory as defined in Section 2.2.1, and in order to be quantified in a Bayesian network model, a fuzzy variable should be transferred to probabilistic state. According to Kandel [61], the relationship between fuzzy set and probability can be described as a belief of some element xi belonging to a certain fuzzy set A. However, in case of one membership function describing a range of values belonging to a certain fuzzy set, the transformation to probability can be performed by the process of defuzzification, which is used to estimate crisp values of element xi for a certain degree of membership. In the case of multiple membership functions used to define some fuzzy set A, the stated belief can be described as the chance that a value of xi belongs to the particular membership function within the fuzzy set. In our case, the transformation from fuzzy variable to a probabilistic one is performed based on general normalization procedure proposed by Maskey [62]:
where pA(xi) is a probability function, µA(xi) is a membership value of variable xi for a particular membership function considered, which is divided by the sum of n membership values considered for variable xi. This methodology is characterized with a practicability for efficient transformation of fuzzy values to probabilistic ones, suitable for rapid integration in a Bayesian network model.
Finally, once all particular components are defined, the Bayesian network model can be developed following the steps presented in Figure 7. The development of Bayesian network model is based on the bottom-top approach and consists of five major steps:
- (a)
- In the first step the prior values of parameters that are related to flood risk model factors (dark grey, fixed variables in Figure 6) are estimated for a chosen flood event. This is performed by using the results of flood models, available data, and/or expert judgement;
- (b)
- In the second step, the set of variables marked as U1 … Ui in Figure 5 is included, representing sources of uncertainty in the managed system. This considers assigning the appropriate mathematical function to each variable, based on the experts’ judgements, modelling results, and/or historical data and events;
- (c)
- The following step considers estimation of conditional probabilities between variables Ui and parameters related to flood risk model factors (marked dark grey in Figure 5);
- (d)
- Once the conditional probabilities are estimated, the further step is estimation of the posterior values of parameters related to flood risk model factors, quantifying the impact of variables Ui on these particular parameters;
- (e)
- In the final step, the posterior results from the previous step are propagated to flood risk factors (dark grey variables in Figure 5), obtaining the flood risk value and completing the analysis.
3. Framework Validation and Results
The validation procedure was conducted with a final goal to identify and quantify additional sources of uncertainty and their potential impact on the future flood risk assessments, particularly considering the endangered population. The presented analysis and results are demonstrated for the Croatian side on the Sava River left bank since the river is a state border between Croatia and Bosnia and Herzegovina.
The validation procedure follows the steps of the framework presented in the Section 2.2., where the first step considers identification sources of uncertainty (Section 3.1), followed by integration of identified sources (Section 3.2). Finally, the last step considers quantification of uncertainty in relation to flood risk for the Slavonski Brod area (Section 3.3).
3.1. Identification of Sources of Uncertainty for the Slavonski Brod Area
The first step of the validation considers identification of sources of uncertainty for the Slavonski Brod area. The primary goal was to identify additional sources of uncertainty, which may affect the future flood risk assessment. Following the proposed framework, the identified sources of uncertainty for the particular area of Slavonski Brod are summarized in Table 3 along with the definition of particular context and classification of each specific type.
The first part of the identification process considers analysis of uncertainty related to assessment of flood risk model factors. The first identified potential source of uncertainty is related to the estimation of the water depth distribution over the flooded area. The water depth is characterized as the main cause of flood hazard due to particular characteristics of the lowland Sava River, which exhibits slow increase of water level and discharge. The overall use of flood models has its benefits in modelling potential flood events in relation to an endangered area. However, due to uncertain input, such as digital terrain modelling and other parameters accumulated in a flood modelling concept, the uncertain estimation of water depth caused by a flood directly impacts on the flood hazard assessment.
The second source of uncertainty is the estimation of quantity of people exposed to flooding. Estimation of exposure to flooding is generally performed by combining two separated aspects: the estimation of flood extent and the population density on the flooded area. The estimation of flood extent is uncertain due to abovementioned issues of flood model uncertainty, and the population density can be uncertain due to, for instance, possible daily migrations among population. Finally, the third source of uncertainty is the assessment of population sensitivity to flooding. Population sensitivity is mostly related to population age; children and elderly are considered mostly sensitive to flooding. Although data about overall population age in Slavonski Brod is available, due to possible daily migrations the age structure of the exposed population could be different. In addition, the presence of any disabled people within exposed population will significantly increase the sensitivity and overall flood vulnerability.
The second part of the identification process is related to uncertainty of the system behavior. The first source of uncertainty in the system relates to possibility of ice jam. During winter periods due to low temperatures, an ice layer is often created on the Sava river surface, as documented in detail in [63]. Such layer of ice can jam onto the pillars of the bridge located in the center of Slavonski Brod (see Figure 1), causing the river level rise and generating backflow with possible overflow on the hinterland.
Another source of uncertainty is the possibility of weir failure located on the left bank (see Figure 1). This weir is used for separating Sava River and the lateral (secondary) channel. During the high levels of water in the riverbed this channel is usually closed, protecting the surrounding area from flooding. However, there is always a possibility of mechanical failure or human operational error failing to close the flood barrier.
The last source of uncertainty considered in this case study area is related to the evacuation efficiency. The evacuation efficiency depends on the flood awareness of the endangered population considering on-time warning as well as previous evacuation experience. Due to behavioral variability there is a possibility that the evacuation decision will be uncertain, to the level that some people could refuse to evacuate (according to Sava Commission Report on the 2014 flood, during that event there were numerous examples of people refusing to leave their homes). However, this source of uncertainty could be characterized not only as decision uncertainty, but also as ambiguity. This is due to the fact that there might be different perceptions about the efficiency of evacuation between decision makers, judging from the estimated evacuation rate. This could cause different perceptions about the level of endangerment to the population, and consequently reflect on their emergency management decisions.
3.2. Integration of the Identified Sources of Uncertainty
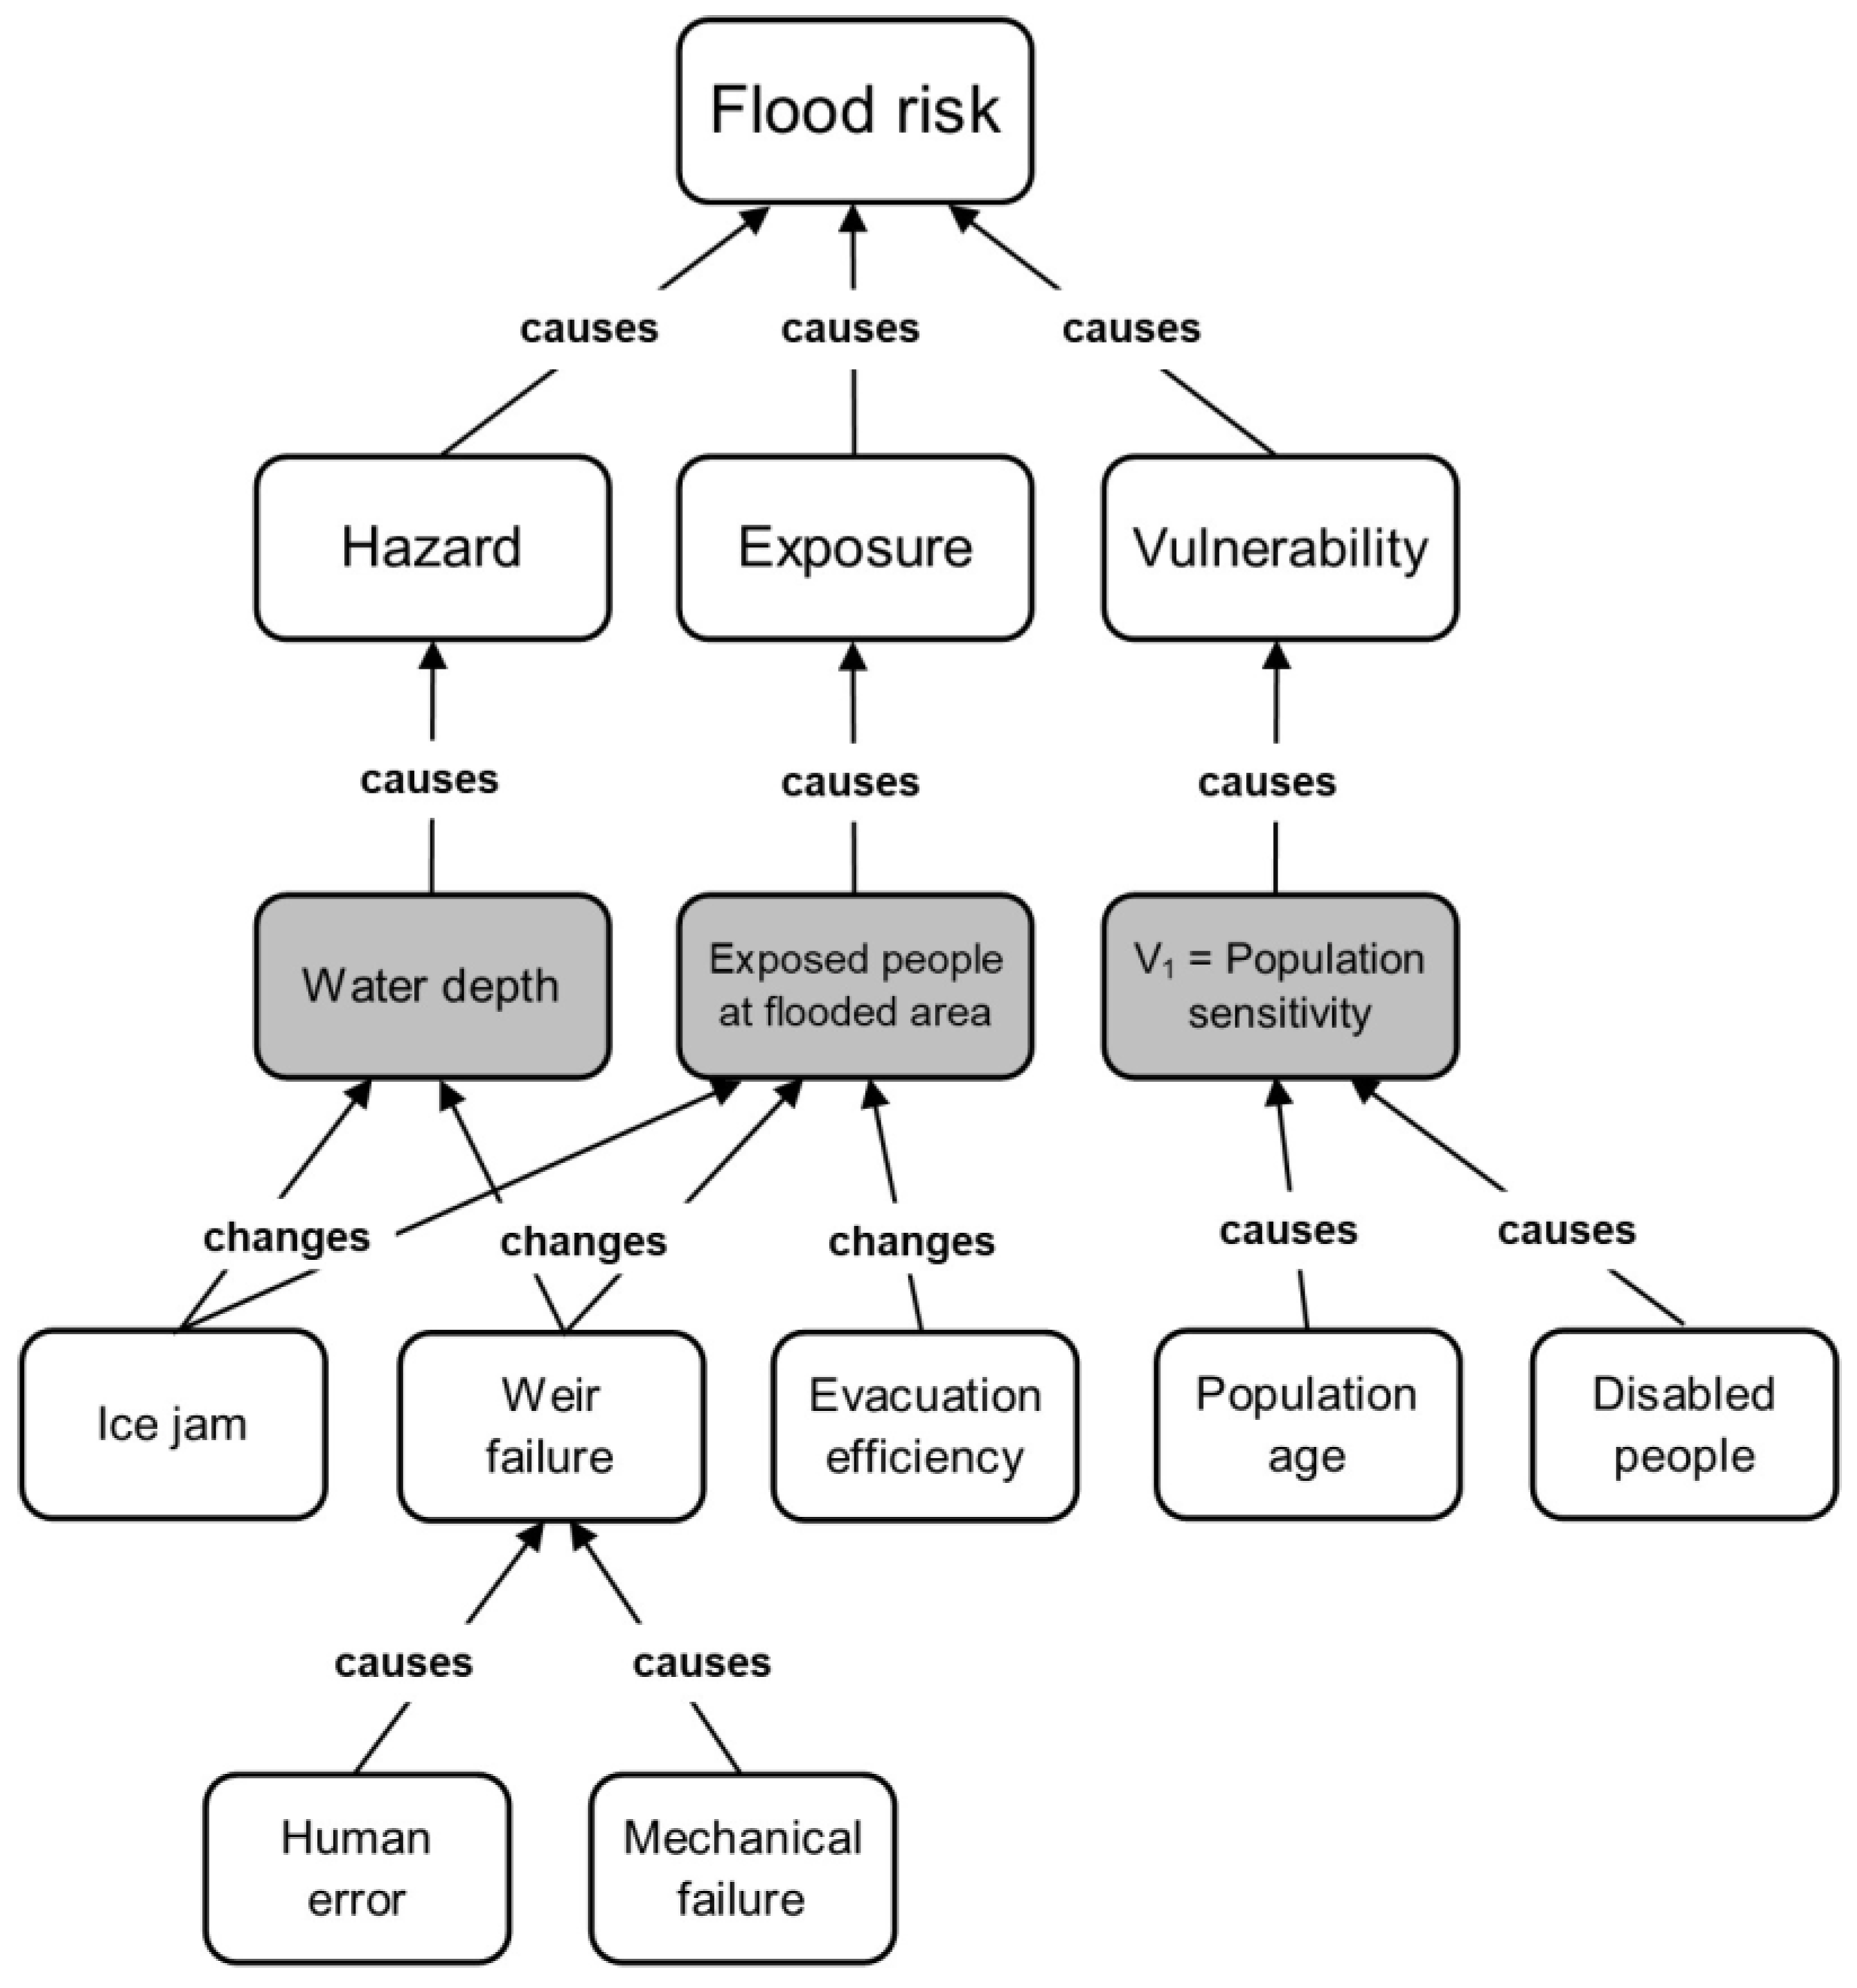
The next step of the proposed framework validation procedure is the integration of identified sources of uncertainty. This considers recognition of mutual relationships between sources of uncertainty for the Slavonski Brod area. The process of integration is based on the generic model presented in Figure 6, which is adapted for the particular scope of the analysis considering the flood risk assessment in relation to the endangered population.
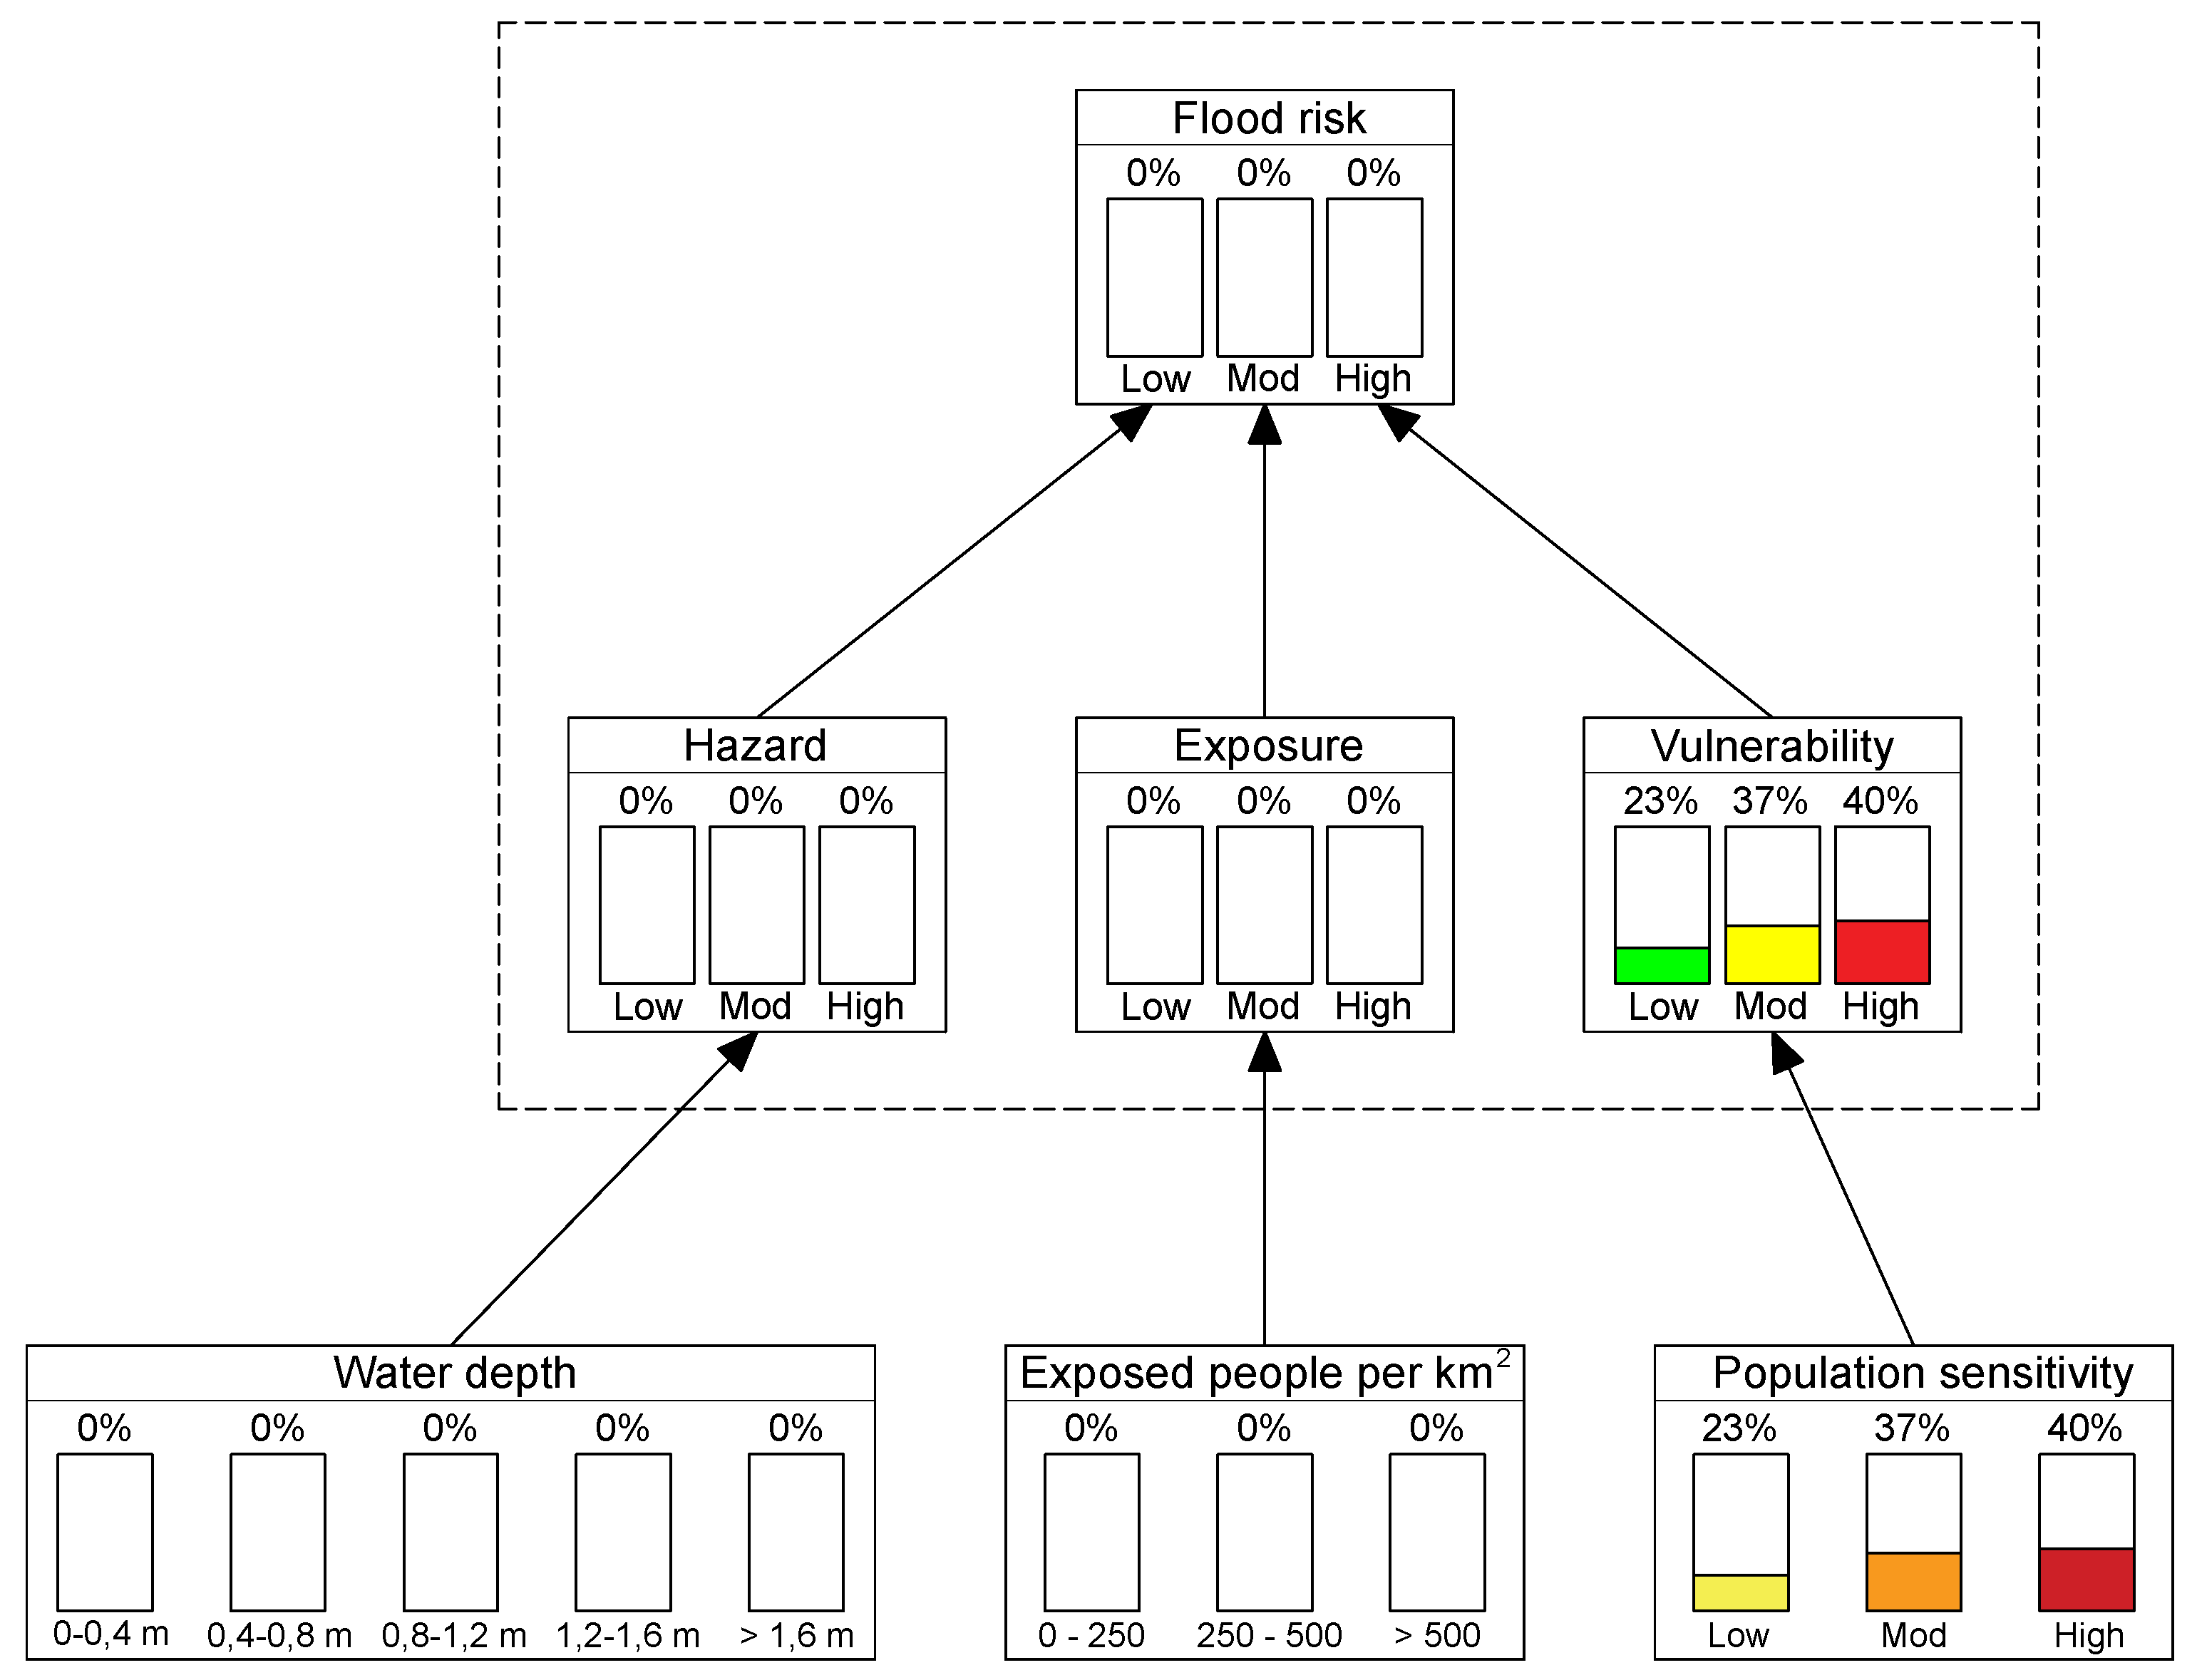
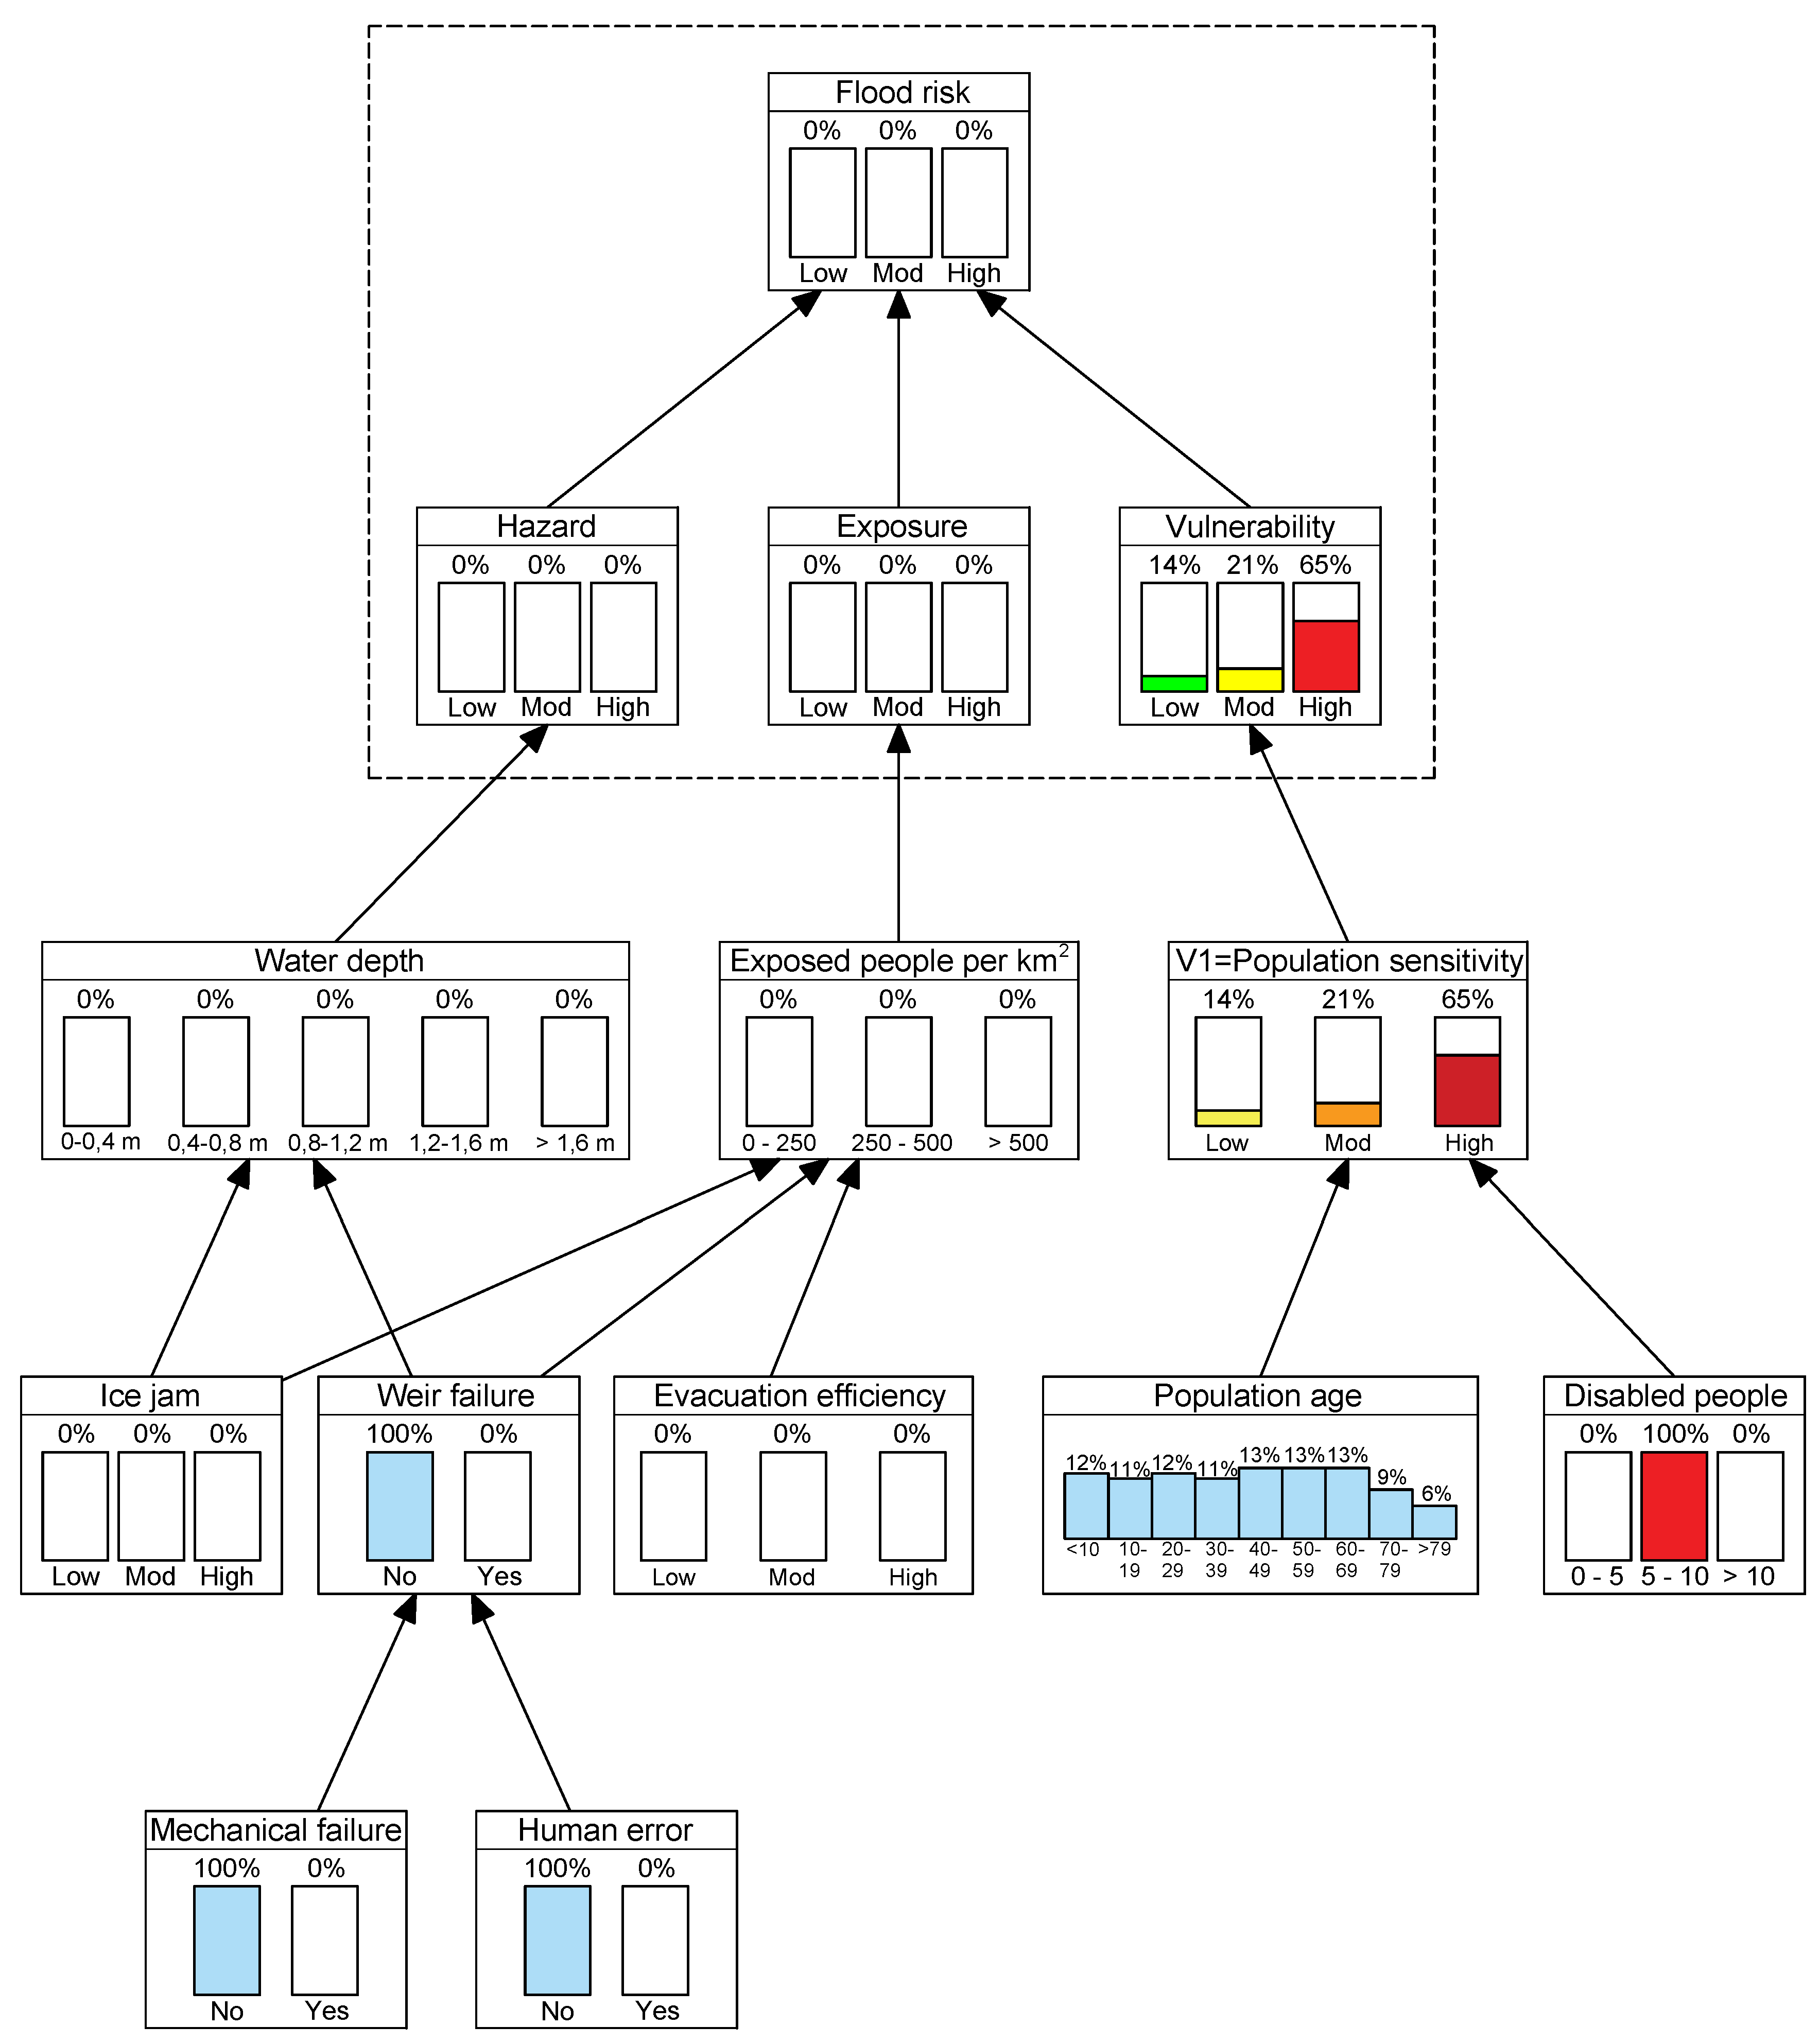
The vulnerability factor is determined with a single variable V1, which is related to the population sensitivity. The remaining risk factors (hazard and exposure) were defined by their fixed parameters; water depth and number of the exposed people (Figure 8). Flood risk model factors (dark grey) contain their uncertainty as previously defined.
However, the scope of the process of integration is the inclusion of recognized additional sources of uncertainty in the system in the causal model. This is performed through definition of mutual relationships between these sources and parameters related to flood risk model factors (dark grey), as well as the definition of causal relationships between variables (according to Section 2.2.3). The flood risk model from Figure 8 is expanded with new variables, representing sources of uncertainty in the system, along with semantic expressions added in order to enhance the reasoning process about the influence of each source of uncertainty on risk (Figure 9).
Figure 9 shows how an ice jam event influences the water depth on the inundated area as well as the number of exposed people through the increase of flooded area. The latter is due to the fact that the effective cross-sectional flow area in the river could be narrowed, creating backflow flooding in the river upstream locations.
Events such as weir failure, caused by mechanical or human error, could flood the “safe” area through the lateral channel extending the flooded area and exposed population. The Evacuation efficiency is an additional significant factor during the flood emergency response, directly affecting the number of exposed people to flooding. Population sensitivity is considered to be caused not only by population age, but also with presence of disabled people at the flooded area. Disabled people are more likely to perish during flood due to, for example, their inability to evacuate on their own.
3.3. Quantification of Uncertainty in the Flood Risk Assessment for the Slavonski Brod Area
The final step in the validation procedure is the quantification of the risk model using a Bayesian network approach. In this step each variable of the causal model (Figure 9) is characterized with a corresponding mathematical function and quantified within the Bayesian network model.
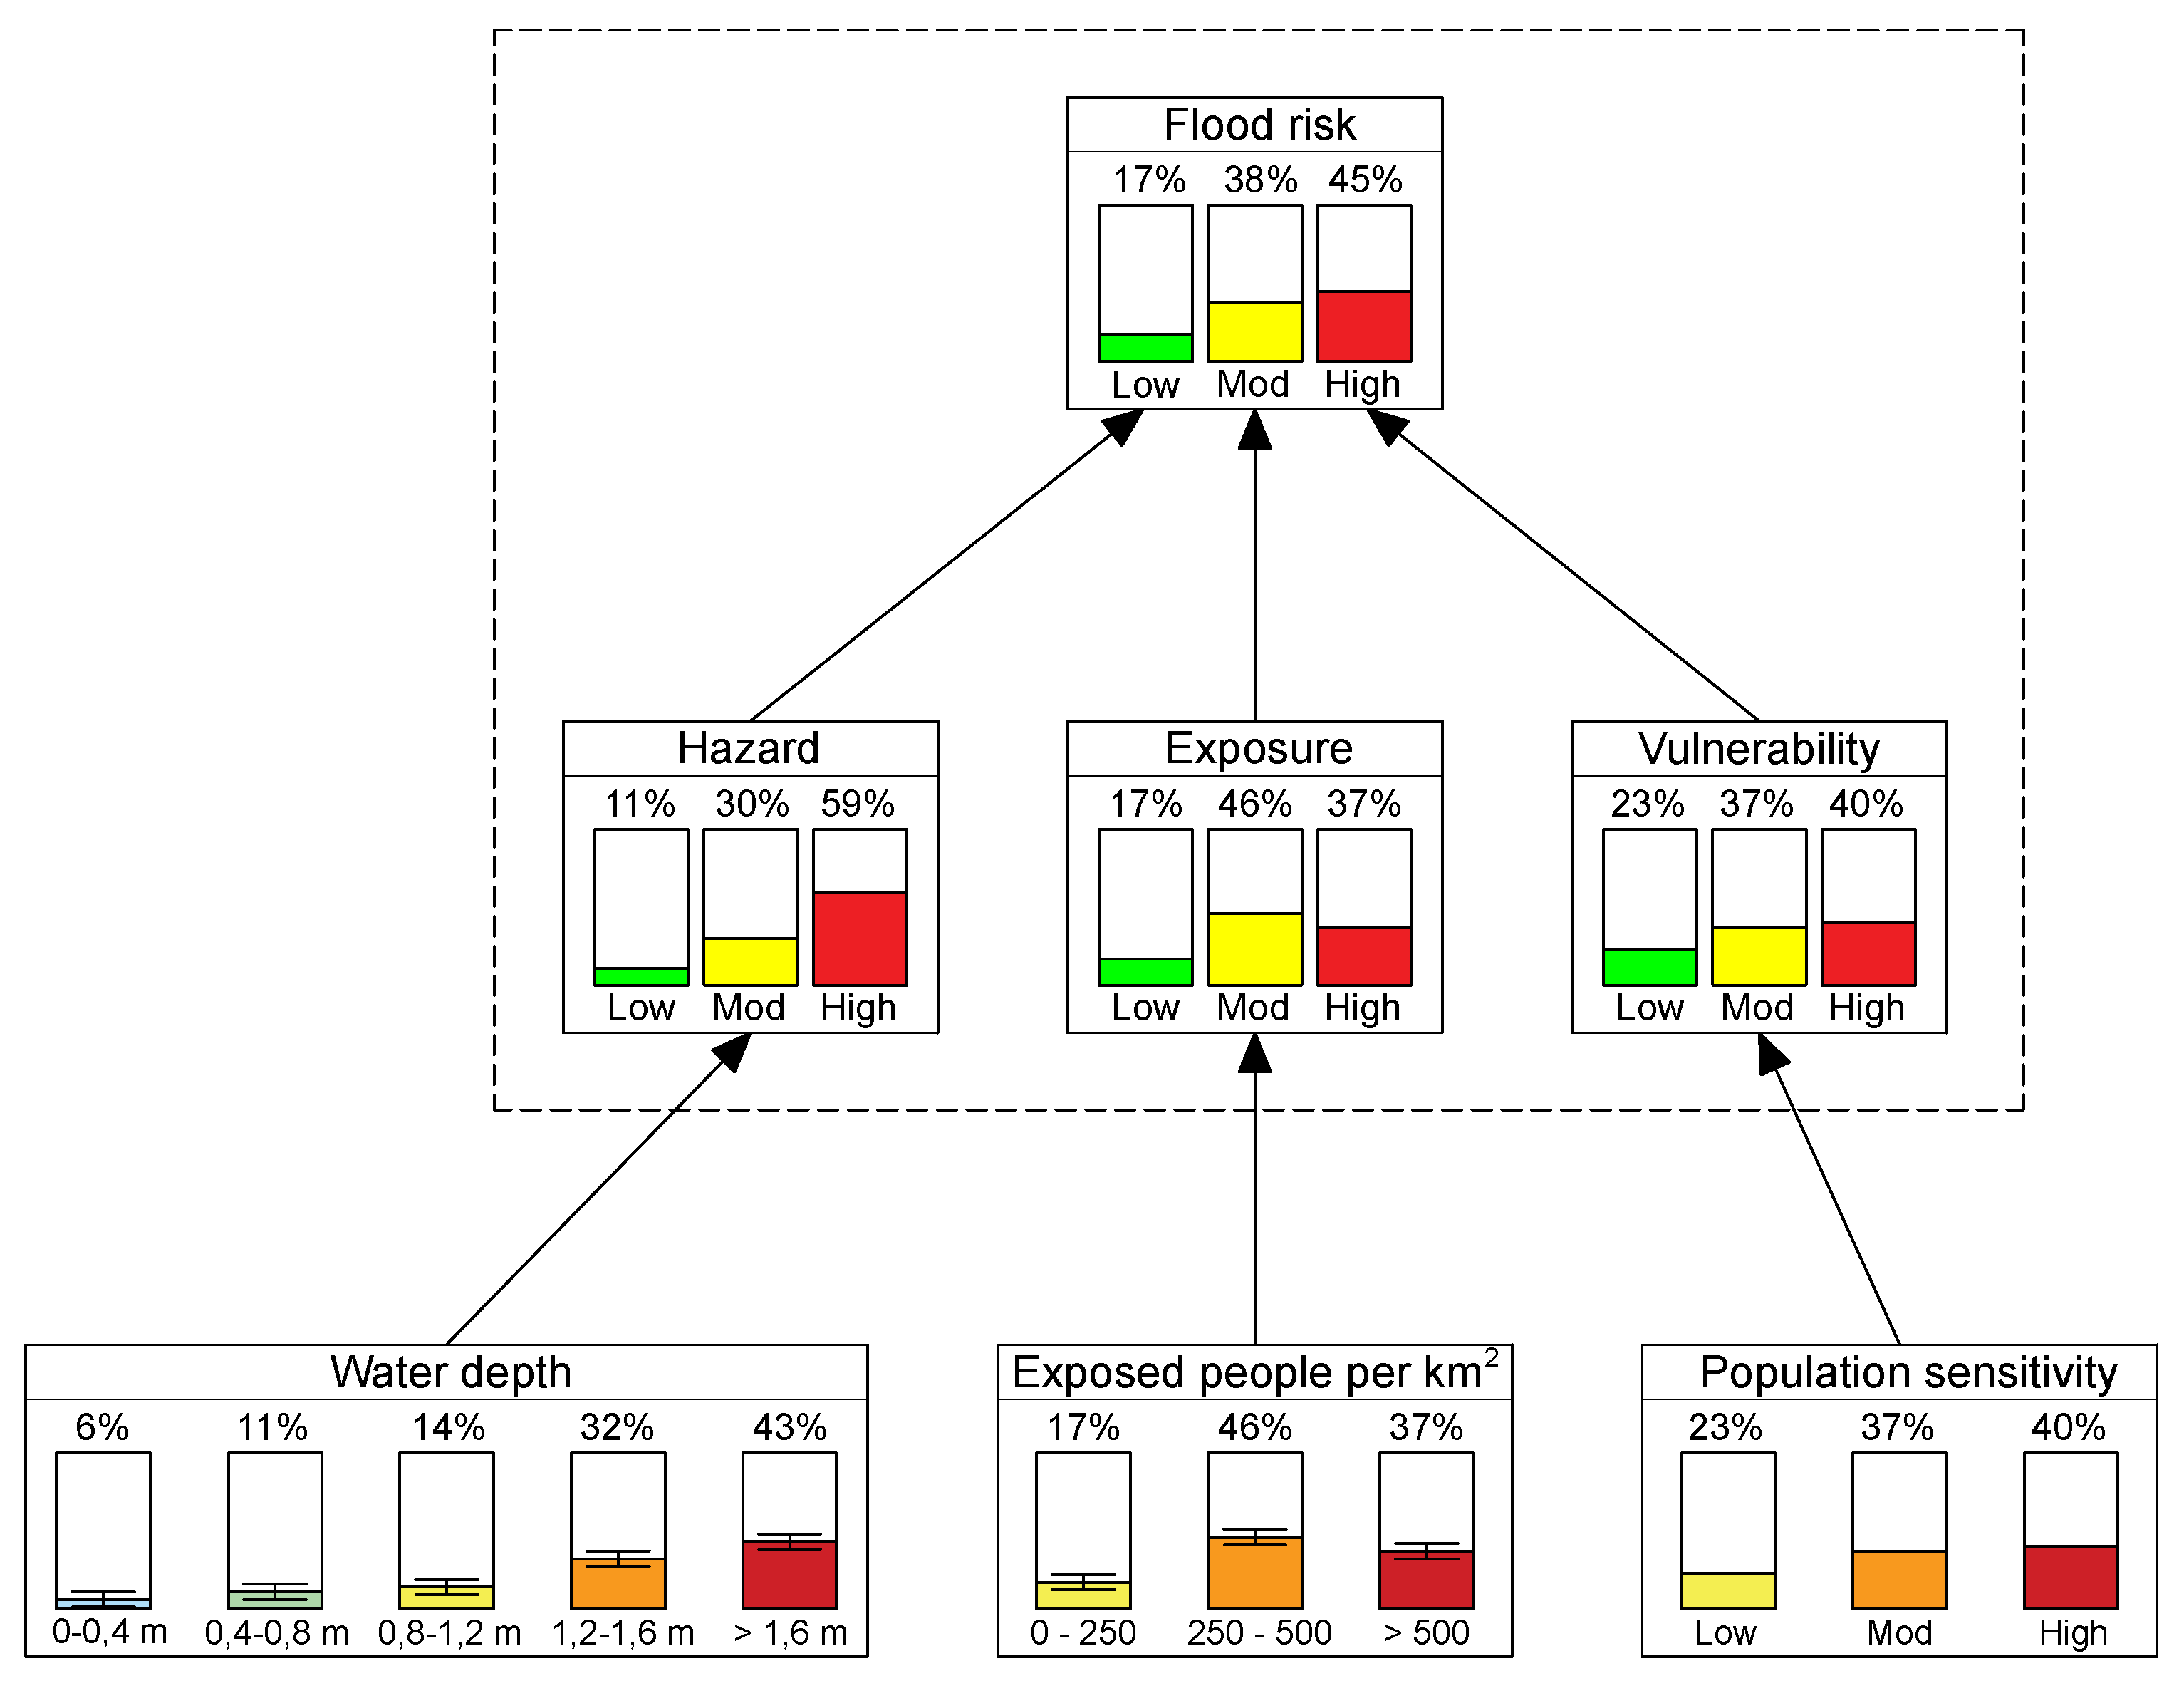
The initial stage is to determine the values of the flood risk model factors. We chose the available data collected for the flood event in 2014 to demonstrate what would be the estimation of the flood risk model value (Figure 10) without considering any of the possible system uncertainties.
The maximum stage value of the 2014 flood event was used as an input for flood modelling. According to the results of the flood model used, the water depth variable was defined with five possible classes. Each class represents the particular range of water depth distribution over the flooded area. The hazard variable is represented with three possible outcomes (low, moderate, high) in relation to water depth values. The water depth 0–0.5 (m) indicates low hazard, 0.5–1 (m) moderate, and water depth larger than 1 (m) indicates the high hazard for people. Flood model outputs are adapted to the requirements of the flood hazard variable, resulting with 11% of low hazard, 30% of moderate, and 59% of high hazard on the flooded area.
Exposure factor is determined based on the number of people exposed per square kilometer. Up to 250 people per square kilometer was considered as a low exposure, from 250 to 500 moderate, and more than 500 people per square kilometer was considered as a high exposure. The data about population density was obtained from the Slavonski Brod urban planning documents [64], showing that 17% of the flooded area has a population density up to 250 people per km2, 46% from 250 to 500 people per km2, and 37% of the area contains more than 500 people per km2.
The population sensitivity is determined based on the endangered population age where children and elderly are considered as highly sensitive. The data about population age for Slavonski Brod, obtained from Croatian Bureau of Statistics [65], showed that 23% of the population is between 20 and 40 years old (low sensitivity), 37% is between 10 and 20, and 40 and 60 years old, respectively (moderate sensitivity), and 40% of the population is below 10 and over 60 years old (high sensitivity). Since only the population sensitivity is in the scope of our analysis, the vulnerability value is equivalent to the value of population sensitivity.
The final flood risk value is estimated with three states (low, moderate, and high) by combining the estimated values for hazard, exposure, and vulnerability. It reflects the common decision-makers requirements in Croatia, since each state of risk corresponds to the complementary risk management measures.
After the 2014 flood event, a set of additional structural measures was implemented to increase the level of safety for the Slavonski Brod area. The riverbank crest level was newly designed to withstand the water level 1.20 m higher than the maximum recorded stage value. Therefore, using the same flood model parameters, the flood risk becomes zero (no hazard or exposure) for the same flood magnitude of the 2014 flood event (Figure 11).
However, this can create a serious misperception about the threat of future flooding among the population in the study area since no potential system uncertainties are included in the basic flood risk model. To demonstrate the possible impact on the flood risk, even after the update of structural measures, we proceed with the inclusion of system variables introduced in Table 3.
Thus, following the steps presented in Figure 7, additional variables are introduced to represent sources of uncertainty in the system and extending the basic flood risk model to the general structure as presented in Figure 9. Variables represented by probabilistic functions can be directly included into the Bayesian network model by defining conditional probabilities between related variables.
The ice jam variable was characterized by three possible states (low, moderate, high) corresponding to the level of obstruction due to possible clogging on the bridge pillars. Each state of the ice jam considers a certain degree of narrowing of the effective cross-sectional flow area, causing potential overflow upstream from the bridge.
The weir failure is characterized with a Boolean variable (yes/no), either from mechanical or human failure, indicating the possibility of a flooding scenario on the area protected by the weir.
The population age is represented with a probability distribution reflecting the available data. However, the location and scale parameters of the probability distribution can vary due to change of the population age structure in the flooded area due to possible migrations. Disabled people variable is included as a factor causing population sensitivity. The number of disabled people is obtained from Croatian Bureau of Statistics [65], and it is defined in the flood risk model with a range of values; 0–5, 5–10, and more than 10 in the endangered area.
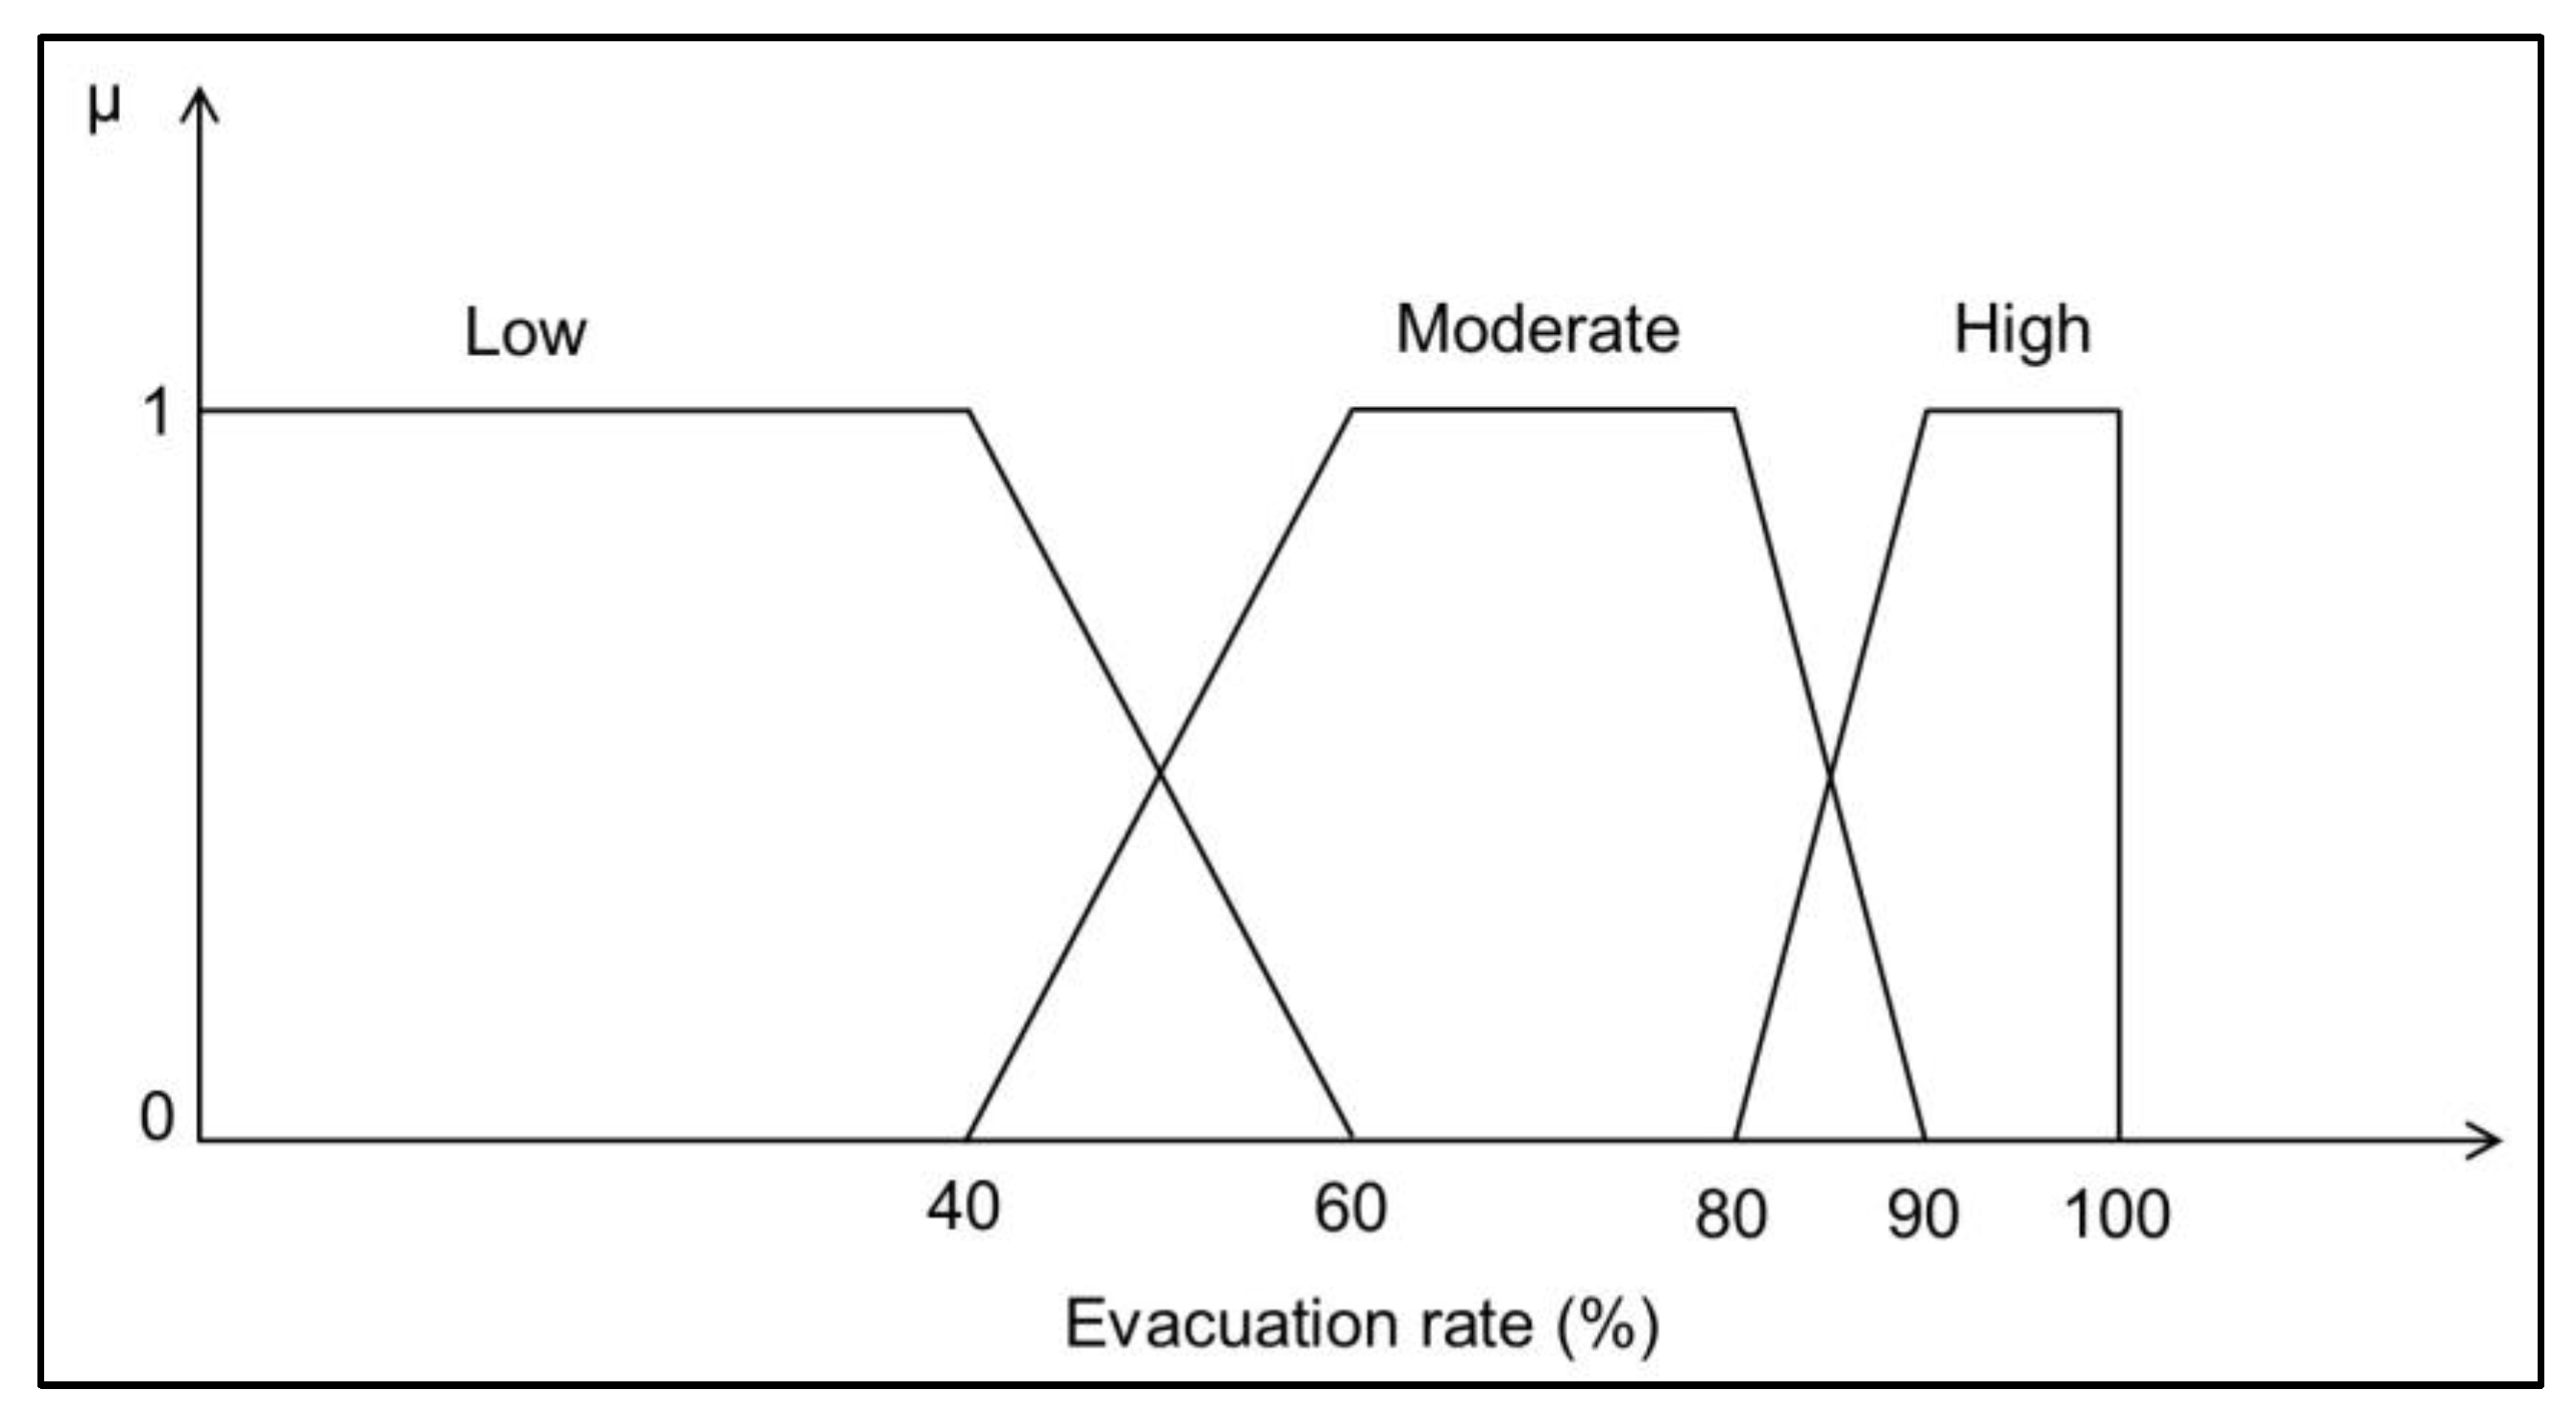
The variable ‘Evacuation efficiency’ is expressed with the evacuation rate x, which can be calculated as the ratio between number of people being evacuated and total number of people present at some area. Being the only variable that corresponds to “ambiguity and vagueness” type of uncertainty, it is defined as a fuzzy set with three different states: low, moderate, and high evacuation rate. The boundaries between these states are vague due to the fact that some values of evacuation rate can be defined as both “low” and “moderate” or “moderate” and “high”. The classification of evacuation rate states is obtained from experts’ and practitioners’ judgements. The corresponding membership functions for “evacuation rate” in this example are mathematically expressed as:
and graphically shown in Figure 12.
In order to obtain the values of variable Evacuation efficiency within the Bayesian network model, the transformation procedure (6) from fuzzy value to the probabilistic one has to be performed.
Figure 13 shows the final form of the Bayesian network model for the Slavonski Brod area, however, now extended and updated with all system variables with their corresponding functions. The final risk value is still zero since the system variables like ice jam and weir failure (either due to the mechanical or human error) are turned off. The only difference between flood risk model outputs in Figure 11 and Figure 13 appears in the population sensitivity, since additional variables are added in the model related to the population age and disabled population.
As it can be seen, the value of flood risk remains zero since no flooding was observed. Values of the population sensitivity and corresponding vulnerability changed due to data added to the model. Once the final Bayesian network model has been updated and set up, the analysis of impact of particular sources of uncertainty on risk can be conducted. These analyses can be performed in a form of particular scenarios or by updating values or knowledge about a certain variable.
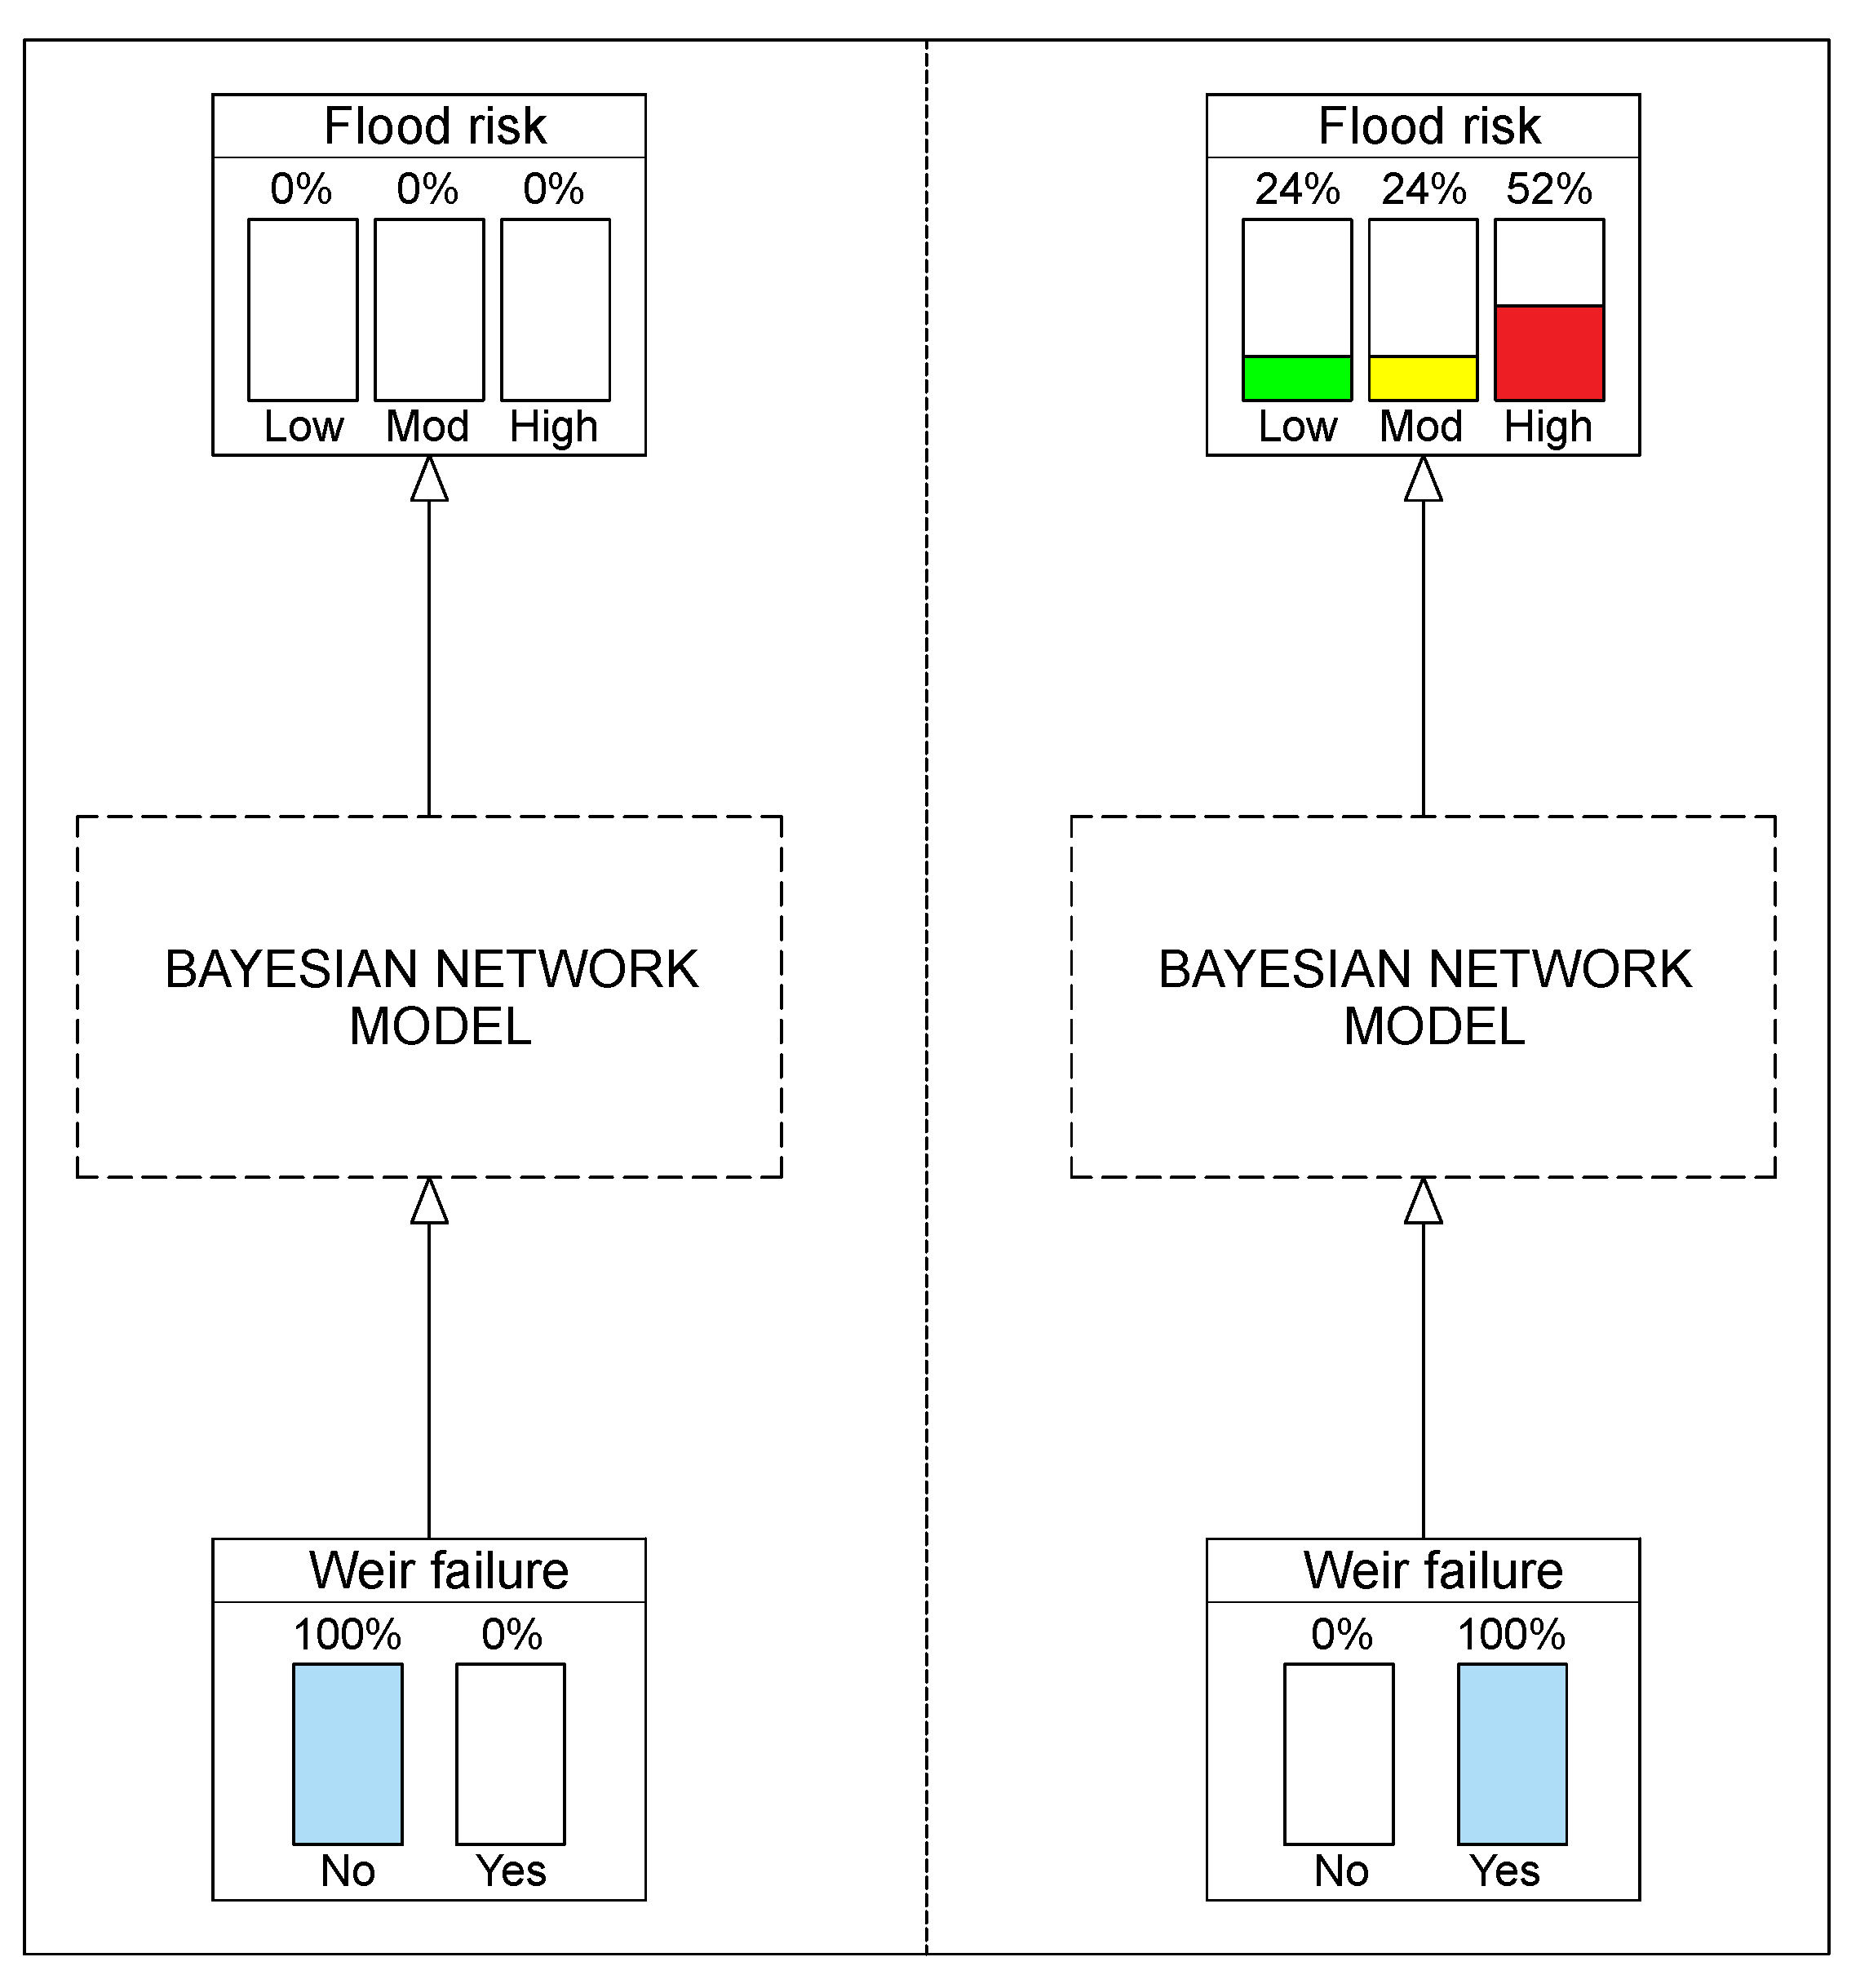
The potential impact on the flood risk value can be quantified if some of the system variables are turned on, allowing the users to analyze the potential impact on the selected flood risk states (low, moderate, and high). In Figure 14, the calculation of flood risk values for the particular scenario of weir failure is updated. The weir failure is causing the backflow in the lateral channel resulting in the increased water depth and exposed population. The weir failure event is further propagated to the hazard and exposure in a Bayesian network model (represented with a dashed box in Figure 14) resulting in the flood risk values for the study area. The estimated flooded area in the Slavonski Brod is presented in Figure 15.
The weir failure scenario is considered at the maximum stage level, and the flooded area (Figure 15) corresponds to the amount of water discharging through the weir for approximately 1 h. As a result, 47% of the flooded area is exposed to high hazard (water depth > 1 m), 21% to moderate hazard (0.5–1 m), and 32% of the area is under low hazard (<0.5 m). As for the exposure component, 26% of the flooded area has low population density (<250 per km2), 30% moderate (250–500 per km2), and 44% high population density (>500 per km2). The vulnerability component remained the same as from Figure 13. The final flood risk, due to the weir failure, is equal to 24% low, 24% moderate, and 52% high states.
Furthermore, different system uncertainties happening simultaneously within the extended Bayesian network model can be combined by adding, for example, the evacuation efficiency variable in combination with a weir failure. To include evacuation efficiency, the transformation procedure (6) is applied in order to obtain the probabilistic values. For the case of weir failure, it was estimated that the evacuation rate in the study area could be 82% (estimated percentage based on previous flood events), which corresponds to the membership functions’ values of µMOD = 0.50, and µHIGH = 0.25 (Figure 14). Following (6) the probability that evacuation rate of 82% belongs to the “moderate evacuation” fuzzy set state is equal to:
and the probability for the “high evacuation” fuzzy set state is equal to:
In Figure 16, the flood risk value due to the weir failure in combination with evacuation efficiency variable is presented. The hazard value remained the same, but exposure and vulnerability changed. On the left side of Figure 16, the flood risk value is equal to the previous value in Figure 14 with no evacuation considered. However, the impact on the flood risk value with estimated 82% of evacuation efficiency is presented on the right side of Figure 16. It is worth noting that the high flood risk state is reduced by more than half due to the fact that the area with population density above 500 people per km2 was reduced to approximately 10%. Furthermore, disabled people are considered to be evacuated first, so the overall population sensitivity was significantly reduced. In other words, by including some evacuation activity in the potentially flooded area we can move the flood risk value more towards the low and moderate flood risk state as compared to the no evacuation measures. This could be a very important assessment for emergency decision makers in selecting the risk management measures and their relation to the actual cost of the evacuation process.
4. Discussion
This paper presented the three-step framework for inclusion of system uncertainty in the flood risk assessment, which was performed from a decision-maker’s perspective and focused to the time period prior and during the flood event. The presented framework was validated on the Sava River and the particular area of city Slavonski Brod using the data from the 2014 flood event.
The general importance of uncertainty analysis in the flood risk assessment has been widely accepted in the context of flood risk management decisions [19,20,21] and its efficiency is based on the flood risk assessment outputs. The presence of uncertainty within the flood risk assessment is widely recognized within each phase of the assessment process [4,5,6,7,8,9,10]. Furthermore, flooded river systems could be subject to sudden changes due to the system uncertainty caused, for instance, by a structural failure [11,12,13] or it could be human related [17,18]. However, those studies emphasize the presence of uncertainty without considering a broader perspective where the uncertainty could potentially appear. Given the fact that uncertainty appears in different forms and events, the presented framework considers a wide range of potential domains and particular characteristics. By taking into account their particular characteristics, recognized uncertainties are efficiently incorporated in the flood risk assessment procedure using a Bayesian network model. The outputs of the proposed framework are oriented towards the decision-maker’s requirements through the information about the value of risk.
The results are provided in terms of three selected risk stages (high, moderate, and low) and clearly indicate how different system uncertainties may change and/or shift the risk values between three risk stages. The presented framework can provide very important information for the emergency decision makers, since the development of the flood contingency plans considers an analysis of different scenarios [66].
To demonstrate the framework’s applicability, we used the flood event on the Sava River in 2014 at the location of Slavonski Brod. The specific case study was selected to demonstrate the actual impact on the flood risk coming from additional system uncertainties. We selected the weir failure and evacuation efficiency as two new sources of system uncertainties that could be present in the future flood risk management of the selected domain. The actual presence of the weir at the location Slavonski Brod and its operational problems reported during the 2014 flood event was a clear motivation for its inclusion in the analysis. The weir failure alone showed that, regardless of increasing the riverbank crest level, there is still a possibility of flood risk presence on the otherwise safe area.
It is interesting to note that by combining the evacuation efficiency variable, as a nonstructural measure reflecting variability in human behavior, with the weir failure, the high flood risk values are substantially decreased. This information could be of great value to the flood risk managers in emphasizing the importance of the nonstructural measures in future flood events for the selected area.
In order to apply this framework to other locations, the data considering specific characteristics of the managed area, together with specific system uncertainties that could be present, is required. In the presented study the framework is validated through the assessment of flood risk to people. For its application to other vulnerable classes, the additional data reflecting their particular vulnerabilities and associated uncertainties is needed.
One of the future research endeavors could be also related to finding the way how to convert the presented flood risk values, associated with a specific system uncertainty, to the common risk maps, which are more appealing to different potential end users.
5. Concluding Remarks
In this paper, the three-step framework was presented for efficient inclusion of uncertainty of the system behavior in flood risk assessment. The inclusion of the uncertainty in the possible weir operation failure and the evacuation efficiency, caused by variability in human behavior, indicate a significant impact on the flood risk value. The main findings of the framework validation on the Sava river case are summarized as follows:
- The proposed approach for the Sava River case study in Croatia shows that additional sources of uncertainty representing the system behavior could appear in the managed area for future flood events.
- Considering the scenario of infrastructure failure of the present weir alone, the Sava river would flood approximately 1 km2 of the safe area, resulting in 52% of high risk, 24% of moderate risk, and 24% of low risk on the flooded area.
- By combining the evacuation efficiency, as a nonstructural measure, with the weir failure event, the results indicate that for an estimated evacuation rate of 82%, the flood risk is shifted towards the low risk stage, decreasing the high flood risk value from 52% to 24%.
By analyzing potential scenarios for the inclusion of system uncertainties in the flood risk management, the level of preparedness for future flood events can be increased. Implementing these analyses in flood risk contingency plans, the emergency response process can be improved, particularly by promptly initiating the nonstructural measures adapted to each particular scenario or event.
Author Contributions
Conceptualization, T.K., S.K. and R.A.; methodology, T.K. and S.K.; investigation, T.K.; visualization, T.K.; writing—original draft preparation, T.K.; writing—review and editing, S.K. and R.A.; funding acquisition, S.K. All authors have read and agreed to the published version of the manuscript.
Funding
The work of doctoral student Toni Kekez has been fully supported by the Croatian Science Foundation (Grant number DOK-2014-06-6635).
Acknowledgments
This research was partially supported under the project STIM-REI, Contract Number: KK.01.1.1.01.0003, a project funded by the European Union through the European Regional Development Fund—the Operational Programme Competitiveness and Cohesion 2014–2020 (KK.01.1.1.01).
Conflicts of Interest
The authors declare no conflict of interest.
References
- Pistrika, A.; Tsakiris, G. Flood risk assessment: A methodological framework. In Proceedings of the EWRA Symposium “Water Resources Management: New Approaches and Technologies”, Chania, Greece, 13–22 June 2007. [Google Scholar]
- Jonkman, S.N.; Vrijling, J.K.; Vrouwenvelder, A.C.W.M. Methods for the estimation of loss of life due to floods: A literature review and a proposal for a new method. Nat. Hazards 2008, 46, 353–389. [Google Scholar] [CrossRef] [Green Version]
- Merz, B.; Hall, J.; Disse, M.; Schumann, A. Fluvial flood risk management in a changing world. Nat. Hazards Earth Syst. Sci. 2010, 10, 509–527. [Google Scholar] [CrossRef] [Green Version]
- Hutter, G.; Schanze, J. Learning how to deal with uncertainty of flood risk in long-term planning. Int. J. River Basin Manag. 2008, 6, 175–184. [Google Scholar] [CrossRef]
- Neuhold, C.; Stanzel, P.; Nachtnebel, H.P. Incorporating river morphological changes to flood risk assessment: Uncertainties, methodology and application. Nat. Hazards Earth Syst. Sci. 2009, 9, 789–799. [Google Scholar] [CrossRef]
- De Moel, H.; Aerts, J.C.J.H. Effect of uncertainty in land use, damage models and inundation depth on flood damage estimates. Nat. Hazards 2011, 58, 407–425. [Google Scholar] [CrossRef] [Green Version]
- Beven, K.; Lamb, R.; Leedal, D.; Hunter, N. Communicating uncertainty in flood inundation mapping: A case study. Int. J. River Basin Manag. 2015, 13, 285–295. [Google Scholar] [CrossRef]
- Wagenaar, D.J.; de Bruijn, K.M.; Bouwer, L.M.; de Moel, H. Uncertainty in flood damage estimates and its potential effect on investment decisions. Nat. Hazards Earth Syst. Sci. 2016, 16, 1–14. [Google Scholar] [CrossRef] [Green Version]
- Apel, H.; Thieken, A.H.; Merz, B.; Blöschl, G. Flood risk assessment and associated uncertainty. Nat. Hazards Earth Syst. Sci. 2004, 4, 295–308. [Google Scholar] [CrossRef]
- Apel, H.; Merz, B.; Thieken, A.H. Quantification of uncertainties in flood risk assessments. Int. J. River Basin Manag. 2008, 6, 149–162. [Google Scholar] [CrossRef] [Green Version]
- Van Der Most, H.; Wehrung, M. Dealing with uncertainty in flood risk assessment of dike rings in The Netherlands. Nat. Hazards 2005, 36, 191–206. [Google Scholar] [CrossRef]
- Hall, J.W.; Meadowcroft, I.C.; Sayers, P.B.; Bramley, M.E. Integrated flood risk management in England and Wales. Nat. Hazards Rev. 2003, 4, 3. [Google Scholar] [CrossRef]
- Merz, B.; Vorogushyn, S.; Lall, U.; Viglione, A.; Blöschl, G. Charting unknown waters—On the role of surprise in flood risk assessment and management. Water Resour. Res. 2015, 51, 6399–6416. [Google Scholar] [CrossRef] [Green Version]
- Plate, E.J. Flood risk and flood management. J. Hydrol. 2002, 267, 2–11. [Google Scholar] [CrossRef]
- Wood, E. An analysis of flood levee reliability. Water Resour. Res. 1977, 13, 665–671. [Google Scholar] [CrossRef] [Green Version]
- Jonkman, S.N.; Kok, M.; Vrijling, J.K. Flood risk assessment in The Netherlands: A case study for dike ring South Holland. Risk Anal. 2008, 28, 1357–1374. [Google Scholar] [CrossRef] [PubMed]
- Brilly, M.; Polic, M. Public perception of flood risks, flood forecasting and mitigation. Nat. Hazards Earth Syst. Sci. 2005, 5, 345–355. [Google Scholar] [CrossRef]
- Simonovic, S.P.; Ahmad, S. Computer-based Model for Flood Evacuation Emergency Planning. Nat. Hazards 2005, 34, 25–51. [Google Scholar] [CrossRef]
- Hall, J.W. Flood Risk Management: Decision Making Under Uncertainty. In Applied Uncertainty Analysis for Flood Risk Management; Beven, K., Hall, J., Eds.; Imperial College Press: London, UK, 2014; pp. 3–24. [Google Scholar]
- Merz, B. Flood Risk Analysis. Oxf. Res. Encycl. Nat. Hazard Sci. 2017. [Google Scholar] [CrossRef]
- Höllermann, B.; Evers, M. Perception and handling of uncertainties in water management—A study of practitioners’ and scientists’ perspectives on uncertainty in their daily decision-making. Environ. Sci. Policy 2017, 71, 9–18. [Google Scholar] [CrossRef]
- Kaplan, S.; Garrick, B.J. On the quantitative definition of risk. Risk Anal. 1981, 1, 11–27. [Google Scholar] [CrossRef]
- Van den Hoek, R.E.; Brugnach, M.; Mulder, J.P.M.; Hoekstra, A.Y. Analysing the cascades of uncertainty in flood defence projects: How ‘‘not knowing enough’’ is related to ‘‘knowing differently’’. Glob. Environ. Chang. 2014, 24, 373–388. [Google Scholar] [CrossRef]
- Spachinger, K.; Dorner, W.; Metzka, R.; Serrhini, K.; Fuchs, S. Flood Risk and Flood Hazard Maps—Visualisation of Hydrological Risks. IOP Conference Series: Earth and Environmental Science, Volume 4. In Proceedings of the 24th Conference of the Danubian Countries on the Hydrological Forecasting and Hydrological Bases of Water Management, Bled, Slovenia, 2–4 June 2008; IOP Conference Series: Earth and Environmental Science. IOP Publishing Ltd.: Bristol, UK, 2008; Volume 4. [Google Scholar] [CrossRef] [Green Version]
- Preliminary Flood Risk Assessment in the Sava River Basin, International Sava River Basin Commission. 2014. Available online: http://www.savacommission.org/dms/docs/dokumenti/documents_publications/publications/other_publications/pfra/preliminary_flood_risk_assessment_in_the_sava_river_basin_20140701.pdf (accessed on 17 June 2020).
- Committee on Decision Making Under Uncertainty, Board on Population Health and Public Health Practice, Institute of Medicine. Environmental Decisions in the Face of Uncertainty; The National Academies Press: Washington, DC, USA, 2013; p. 130. [Google Scholar]
- Kolen, B.; Van Gelder, P.H.A.J.M. Risk-Based Decision-Making for Evacuation in Case of Imminent Threat of Flooding. Water 2018, 10, 1429. [Google Scholar] [CrossRef] [Green Version]
- Faulkner, H.; Parker, D.; Green, C.; Beven, K. Developing a Translational Discourse to Communicate Uncertainty in Flood Risk between Science and the Practitioner. AMBIO 2007, 36, 692–703. [Google Scholar] [CrossRef]
- Hall, J.; Solomatine, D. A framework for uncertainty analysis in flood risk management decisions. Int. J. River Basin Manag. 2008, 6, 85–98. [Google Scholar] [CrossRef] [Green Version]
- Molinari, D.; Ballio, F.; Menoni, S. Modelling the benefits of flood emergency management measures in reducing damages: A case study on Sondrio, Italy. Nat. Hazards Earth Syst. Sci. 2013, 13, 1913–1927. [Google Scholar] [CrossRef]
- Chang, M.; Tseng, Y.; Chen, J. A scenario planning approach for the flood emergency logistics preparation problem under uncertainty. Transp. Res. Part E Logist. Transp. Rev. 2007, 43, 737–754. [Google Scholar] [CrossRef]
- Morss, R.E.; Wilhelmi, O.V.; Downton, M.W.; Gruntfest, E. Flood risk, uncertainty, and scientific information for decision making: Lessons from an Interdisciplinary Project. Bull. Am. Meteorol. Soc. 2005, 86, 1593–1602. [Google Scholar] [CrossRef]
- Floods in May 2014 in the Sava River Basin, Brief Overview of Key Events and Lessons Learned, International Sava River Basin Commission. 2015. Available online: http://www.savacommission.org/dms/docs/dokumenti/documents_publications/publications/other_publications/sava_floods_report.pdf (accessed on 18 June 2020).
- Funtowicz, S.O.; Ravetz, J.R. Science for the Post-Normal Age. Futures 1993, 25, 739–755. [Google Scholar] [CrossRef]
- Ling, C.W. Characterising Uncertainty: A Taxonomy and an Analysis of Extreme Events. Master’s Thesis, School of Engineering and Applied Science, University of Virginia, Charlottesville, VA, USA, 1993. [Google Scholar]
- Simonović, S.P. Risk in sustainable water resources management. In Sustainability of Water Resources under Increasing Uncertainties, Proceedings of Rabat Symposium S1; IAHS Publications: Rabat, Morocco, 1997; Volume 240, pp. 3–17. [Google Scholar]
- Simonović, S.P. Systems Approach to Management of Disasters, Methods and Applications; Wiley: Hoboken, NJ, USA, 2011; pp. 98–100. [Google Scholar]
- Walker, W.E.; Harremoes, P.; Rotmans, J.; van der Sluijs, J.P.; van Asselt, M.B.A.; Janssen, P.; Krayer von Krauss, M.P. Defining Uncertainty A Conceptual Basis for Uncertainty Management in Model-Based Decision Support. Integr. Assess. 2003, 4, 5–17. [Google Scholar] [CrossRef] [Green Version]
- Van Asselt, M.B.A. Perspectives on Uncertainty and Risk: The PRIMA Approach to Decision Support; Springer: New York, NY, USA, 2000; pp. 85–88. [Google Scholar]
- Brugnach, M.; Dewulf, A.; Pahl-Wostl, C.; Taillieu, T. Towards a relational concept of uncertainty: About knowing too little, knowing too differently, and accepting not to know. Ecol. Soc. 2008, 13, 30. [Google Scholar] [CrossRef]
- Baecher, G.B.; Christian, J.T. Natural Variation, Limited Knowledge, and the Nature of Uncertainty in Risk Analysis. In Proceedings of the Risk-Based Decision making in Water Resources IX, Santa Barbara, CA, USA, 15–20 October 2000. [Google Scholar]
- Kron, W. Flood Risk = Hazard × Exposure × Vulnerability. In Proceedings of the 2nd International Conference on Flood Defence, Beijing, China, 10–13 September 2002; Wu, B.S., Wang, Z.Y., Wang, G.Q., Huang, G.H., Fang, H.W., Huang, J.C., Eds.; Science Press: New York, NY, USA, 2002; pp. 82–97. [Google Scholar]
- Kron, W. Flood Risk = Hazard • Values • Vulnerability. Water Int. 2005, 30, 58–68. [Google Scholar] [CrossRef]
- 2009 UNISDR Terminology on Disaster Risk Reduction, International Strategy for Disaster Risk Reduction, United Nations. Available online: https://www.preventionweb.net/files/7817_UNISDRTerminologyEnglish.pdf (accessed on 22 February 2020).
- Brugnach, M.; Dewulf, A.; Pahl-Wostl, C.; Taillieu, T. Towards a relational concept of uncertainty: Incorporating the human dimension. In Proceedings of the International Conference in Adaptive and Integrated Water Management, Basel, Switzerland, 12–15 November 2007; pp. 1–25. [Google Scholar]
- Ren, C.; Yang, C.; Jin, S. Agent-Based Modeling and Simulation on Emergency Evacuation. In Complex Sciences. Complex 2009. Lecture Notes of the Institute for Computer Sciences, Social Informatics and Telecommunications Engineering; Zhou, J., Ed.; Springer: Berlin/Heidelberg, Germany; Volume 5. [CrossRef]
- Merz, B.; Thieken, A.H. Flood risk analysis: Concepts and challenges. Osterr. Wasser Abfallwirtsch. 2004, 56, 27–34. [Google Scholar]
- Rinderknecht, S.L.; Borsuk, M.E.; Reichert, P. Bridging uncertain and ambiguous knowledge with imprecise probabilities. Environ. Model. Softw. 2012, 36, 122–130. [Google Scholar] [CrossRef]
- Akter, T.; Simonović, S.P. Aggregation of fuzzy views of a large number of stakeholders for multi-objective flood management decision-making. J. Environ. Manag. 2005, 77, 133–143. [Google Scholar] [CrossRef]
- Zadeh, L.A. Fuzzy sets. Inf. Control 1965, 8, 338–353. [Google Scholar] [CrossRef] [Green Version]
- Kraft, D.H.; Pasi, G.; Bordogna, G. Vagueness and uncertainty in information retrieval: How can fuzzy sets help. In Proceedings of the 2006 International Workshop on Research Issues in Digital Libraries (IWRIDL’06), Kolkata, India, 12–15 December 2006; Association for Computing Machinery: New York, NY, USA, 2006. [Google Scholar] [CrossRef]
- Arunraj, N.S.; Mandal, S.; Maiti, J. Modeling uncertainty in risk assessment: An integrated approach with fuzzy set theory and Monte Carlo simulation. Accid. Anal. Prev. 2013, 55, 242–255. [Google Scholar] [CrossRef]
- Li, Q. Fuzzy approach to analysis of flood risk based on variable fuzzy sets and improved information diffusion methods. Nat. Hazards Earth Syst. Sci. 2013, 13, 239–249. [Google Scholar] [CrossRef] [Green Version]
- Quevedo, J.R.N. Fuzzy sets. A way to represent ambiguity and subjectivity. Boletín Matemáticas 2017, 24, 57–88. [Google Scholar]
- Humphreys, M.; Jacobs, A. Mixing Methods: A Bayesian Approach. Am. Political Sci. Rev. 2015, 109, 653–673. [Google Scholar] [CrossRef] [Green Version]
- Balbi, S.; Villa, F.; Mojtahed, V.; Hegetschweiler, K.T.; Giupponi, C. A spatial Bayesian network model to assess the benefits of early warning for urban flood risk to people. Nat. Hazards Earth Syst. Sci. 2016, 16, 1323–1337. [Google Scholar] [CrossRef] [Green Version]
- Barton, D.N.; Saloranta, T.; Moe, S.J.; Eggestad, H.O.; Kuikka, S. Bayesian belief networks as a meta-modelling tool in integrated river basin management—Pros and cons in evaluating nutrient abatement decisions under uncertainty in a Norwegian river basin. Ecol. Econ. 2008, 66, 91–104. [Google Scholar] [CrossRef]
- Straub, D. Natural hazards risk assessment using Bayesian networks. In Proceedings of the Ninth International Conference on Structural Safety and Reliability, Rome, Italy, 19–23 June 2005. [Google Scholar]
- Vogel, K.; Riggelsen, C.; Korup, O.; Scherbaum, F. Bayesian network learning for natural hazard analyses. Nat. Hazards Earth Syst. Sci. 2014, 14, 2605–2626. [Google Scholar] [CrossRef] [Green Version]
- Wu, J.; Fang, W.; Hu, Z.; Hong, B. Application of Bayesian Approach to Dynamic Assessment of Flood in Urban Underground Spaces. Water 2018, 10, 1112–1132. [Google Scholar] [CrossRef] [Green Version]
- Kandel, A. Fuzzy Mathematical Techniques with Applications; Addison-Wesley Publishing Company: Reading, MA, USA, 1986; pp. 72–84. [Google Scholar]
- Maskey, S. Modelling Uncertainty in Flood Forecasting Systems. Ph.D. Thesis, Delft University of Technology, Delft, The Netherlands, 24 May 2004. [Google Scholar]
- Čavlović, Z. Obrana od leda na Savi. Hrvat. Vodoprivr. 2012, 198, 54–55. (In Croatian) [Google Scholar]
- Spatial Plans of the City of Slavonski Brod Area. Available online: https://www.slavonski-brod.hr/index.php/vazeci-prostorni-planovi (accessed on 22 April 2020).
- Croatian Bureau of Statistics. Available online: https://www.dzs.hr/default_e.htm (accessed on 14 April 2020).
- Kolen, B.; Helsloot, I. Decision-making and evacuation planning for flood risk management in The Netherlands. Disasters 2014, 38, 610–635. [Google Scholar] [CrossRef]
Figure 1.
Estimated flooded area of city of Slavonski Brod during the flood event in the Sava River in 2014.
Figure 1.
Estimated flooded area of city of Slavonski Brod during the flood event in the Sava River in 2014.

Figure 2.
Stage data measured at gauging station Slavonski Brod during the 2014 flood event.

Figure 3.
Framework for uncertainty analysis.

Figure 4.
Context of uncertainty related to flood risk.

Figure 5.
Classification of uncertainty in flood risk.

Figure 6.
Structure of the generic model used for recognition of relationships between variables.

Figure 7.
A flowchart for development of the Bayesian network model.

Figure 8.
Flood risk model for an endangered population.

Figure 9.
Causal network representing the expanded flood risk model.

Figure 10.
Bayesian network flood risk model applied considering the 2014 flood event.

Figure 11.
Bayesian network flood risk model with structural measures implemented.

Figure 12.
Fuzzy membership functions of the variable “Evacuation efficiency”.

Figure 13.
Updated Bayesian network model for Slavonski Brod.

Figure 14.
Estimated flood risk with no weir failure (left) and due to the weir failure (right).

Figure 15.
Estimated flooded area due to weir failure in Slavonski Brod.

Figure 16.
Estimated flood risk with no evacuation (left) and with evacuation (right).


Table 1.
Different approaches for characterization of uncertainty.
| Funtowicz and Ravetz [34] | Ling [35], Simonovic [36,37] | Walker et al. [38] | Van Asselt [39], Brugnach et al. [40] | Baecher and Christian [41] |
|---|---|---|---|---|
| Inexactness, unreliability, and border with ignorance | Variability and ambiguity | Location, level, and nature of uncertainty | Incomplete knowledge, unpredictability, ambiguity | Inherent randomness, incomplete knowledge |
Table 2.
Mathematical characterization of uncertainty.
| Flood Model Uncertainty | Parametric Uncertainty | Unexpected or Random Events | Decision Uncertainty | Ambiguity and Vagueness |
|---|---|---|---|---|
| Sensitivity analysis | Probability distribution | Boolean variable, probability distribution | Boolean variable, probability distribution | Fuzzy set theory |
Table 3.
Identified sources of uncertainty for the Slavonski Brod area.
| Sources of Uncertainty | Context | Type | |
|---|---|---|---|
| Flood risk model | Water depth distribution Estimation of water depth distribution over an inundated area. | Hazard assessment | Flood model |
| Number of people exposed to flooding Estimation of flood extent proportions in relation to population density on an inundated area. | Exposure assessment | Flood model/parametric | |
| Population sensitivity to floods Assessment of exposed population sensitivity in respect to population age and number of disabled people. | Vulnerability assessment | Parametric | |
| System | Ice jam Appearance of ice on the river surface jamming on the bridge pillars. | Natural | Unexpected or random event |
| Weir failure Possibility of weir closure failure due to mechanical error on the operating mechanism, or due to human operating error. | Technological/social | Unexpected or random event/decision uncertainty | |
| Evacuation efficiency Rate of evacuation of people from endangered area before the incoming flood. | Social | Decision uncertainty/ambiguity | |
© 2020 by the authors. Licensee MDPI, Basel, Switzerland. This article is an open access article distributed under the terms and conditions of the Creative Commons Attribution (CC BY) license (http://creativecommons.org/licenses/by/4.0/).
Share and Cite
MDPI and ACS Style
Kekez, T.; Knezić, S.; Andričević, R. Incorporating Uncertainty of the System Behavior in Flood Risk Assessment—Sava River Case Study. Water 2020, 12, 2676. https://doi.org/10.3390/w12102676
AMA Style
Kekez T, Knezić S, Andričević R. Incorporating Uncertainty of the System Behavior in Flood Risk Assessment—Sava River Case Study. Water. 2020; 12(10):2676. https://doi.org/10.3390/w12102676
Chicago/Turabian StyleKekez, Toni, Snježana Knezić, and Roko Andričević. 2020. "Incorporating Uncertainty of the System Behavior in Flood Risk Assessment—Sava River Case Study" Water 12, no. 10: 2676. https://doi.org/10.3390/w12102676
Note that from the first issue of 2016, this journal uses article numbers instead of page numbers. See further details here.