Impact of the Monthly Variability of the Trent River on the Hydrodynamical Conditions of the Bay of Quinte, Ontario: A Case Study 2016–2019


Physics and Space Science, Royal Military College of Canada, Kingston, ON K7K 7B4, Canada
Water 2020, 12(10), 2683; https://doi.org/10.3390/w12102683
Submission received: 3 August 2020
/
Revised: 14 September 2020
/
Accepted: 24 September 2020
/
Published: 25 September 2020
(This article belongs to the Section Hydrology)
Abstract
:The spatial and temporal (monthly) variability of river discharge has a significant effect on circulation and transport pathways within shallow embayments whose dynamics are largely controlled by wind and riverine inputs. This study illustrates the effects of the monthly variation in Trent River discharge on simulated particle transport and settling destination in the Bay of Quinte, Lake Ontario for the years 2016–2019. Observations of Lagrangian surface drifter data were used to derive Trent River discharge forcing for a three-dimensional hydrodynamic numerical model of the Bay of Quinte. Peak monthly flushing was up to three times as much as the lowest monthly flushing in any year, with the Trent River responsible for up to 95% of the flushing in low runoff years. Particle transport simulations showed that particles could be trapped along shorelines, which extended residence times, and Trent River releases suggest that researchers should look for delayed peaks in Total Phosphorous (TP) load measurements in observations between Trenton and Belleville as particles move downstream. Particles with constant settling velocities originating from the Trent River did not move downstream past Big Bay, and particles from the Napanee River were the primary source for Longreach.
1. Introduction
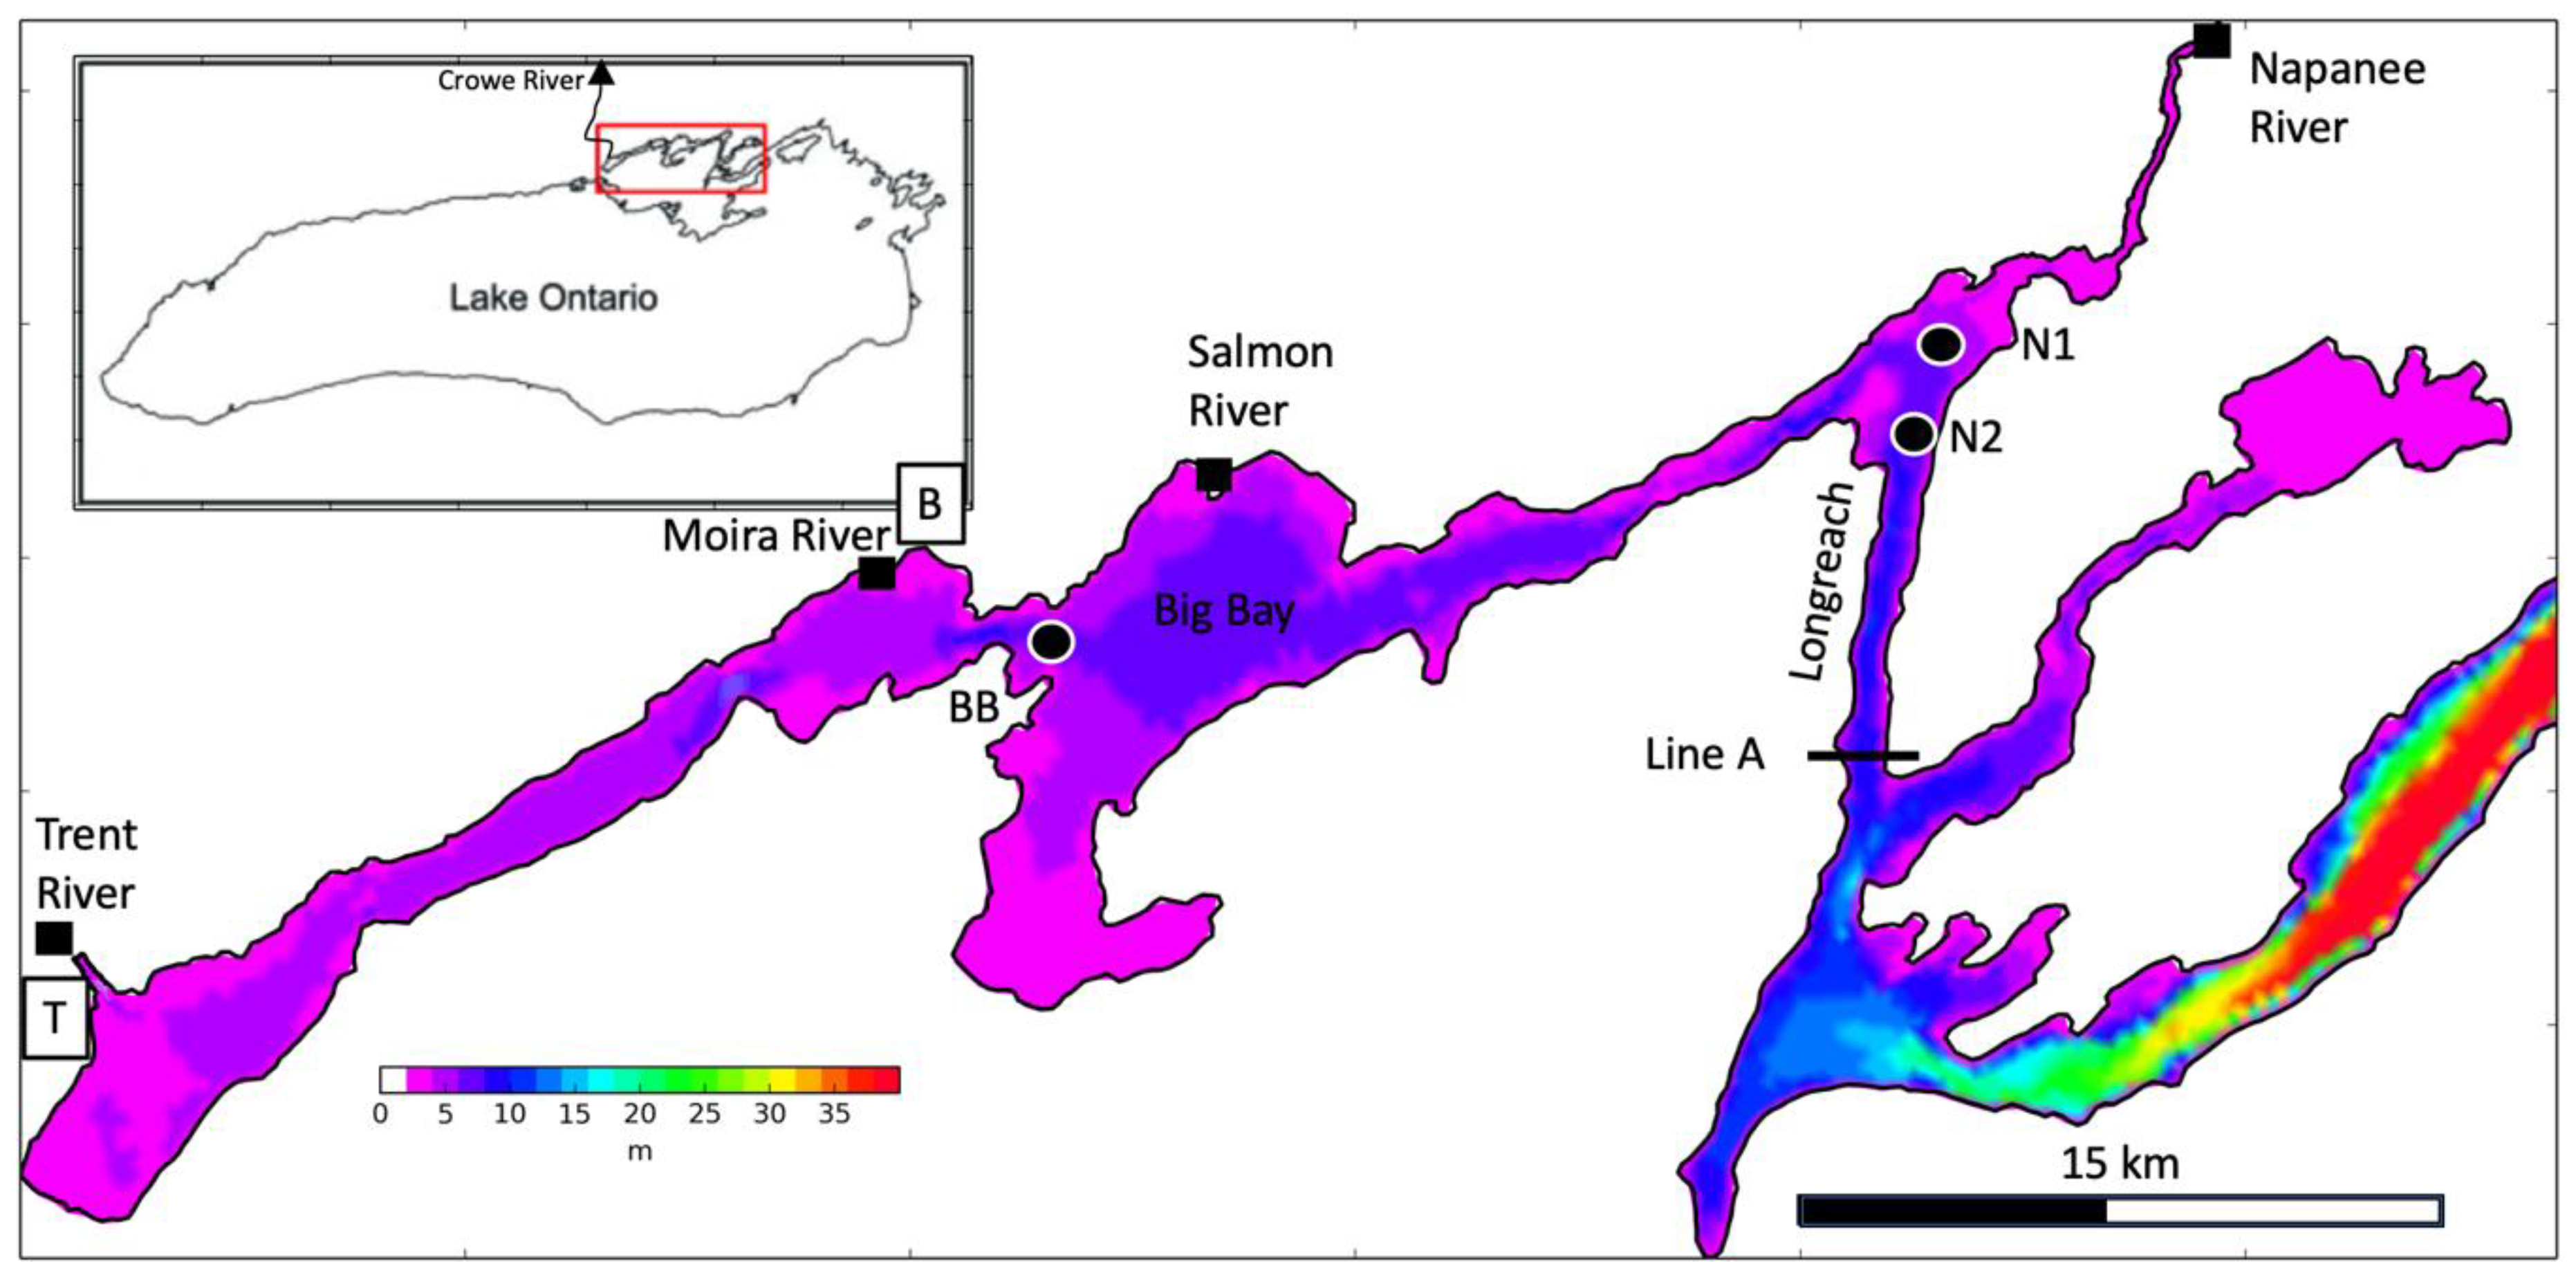
The Trent River is the largest tributary of the Bay of Quinte, Lake Ontario (Figure 1), and is the main contributor of total phosphorus (TP) and riverine sediment loading to the bay. It is also the main driver of the bay’s flushing rate, an estimate of the number of times the water within the bay is exchanged monthly or annually. The bay is an important freshwater resource in Ontario and was listed as a U.N. Area of Concern in 1985 in response to frequent toxic algae blooms. Surface waters carry phosphorous and other nutrients from soil within the watershed into the tributaries, which then transport these nutrients into the bay where they can cause nutrient-driven eutrophication events and algae growth. The U.N. listing spurred a number of studies of TP loading [1,2,3], algae blooms [4] and flushing [5,6], to further understand the nature and risk of these eutrophication events. The nutrient budget and biological studies of the bay have historically used estimates of the average spring Trent River discharge (m3/s) values to estimate TP loading and flow budgets to capture the spring runoff period when loading is highest and flushing is greatest, but these values are not representative of the loading and flushing that occurs later in the year [1,7]. Studies have concluded that there is a need to account for this variability by using monthly estimates of Trent River discharge values which span the algae growing season [8,9]. Despite the importance of the Trent River to the bay, there are few studies of the impacts of the monthly variability of the Trent River discharge, including the resulting variability in the bay’s circulation which determines flushing and particle transport.
A recent study of the Bay of Quinte watershed examined annual trends in the relationships between TP and watershed land use for the period 1964–2010 [2]. This study showed that the Trent River, having the largest drainage area of all the bay’s tributaries, had the highest TP loading in its catchment area (Table 1). Because this study focused on the watershed, it used flow monitoring stations upstream and away from the Trent River itself. The call to use inshore sites to provide better estimates of water quality parameters was the conclusion of a previous study of the bay’s phosphorus budgets [8], which also pointed out the need to establish the variability of critical environmental management variables on daily and monthly timescales. Because monthly and intra-annual river discharge fluctuation is a critical factor in determining uncertainty in TP loadings and nutrient budgets, it is desirable to quantify this variability. Riverine TP loads are estimated using nutrient levels and flows, but while Environment and Climate Change Canada (ECCC) provide estimates of Trent River (02HK010) discharge for the period 1999–2002, these data were not directly observed, but were estimates based on internal ECCC stage–discharge curves and observations of water level. There are no currently active in situ flow-meters in Trent River. To date, studies have used average Trent River discharge estimates derived from multiple upstream tributaries, weirs and creeks.
The Bay of Quinte region recently experienced a wide variation in spring runoff events over the years 2016–2019. River flow in this region of Ontario is low during the winter months when precipitation falls as snow and accumulates. As air temperatures rise in spring, rain and snow melt combine to cause significant surface ground water which flows into the bay via its tributaries. This spring runoff generally peaks in April or May. In June, flows are reduced to a summer minimum state [1,6]. In 2016, there was an early peak runoff, then a record breaking runoff in 2017 characterized by three large precipitation events, followed by an average 2018 and finally succeeded by another record-breaking peak flow in 2019 that occurred in late spring. This four-year period encapsulates a broad range of tributary inflow into the Bay of Quinte that can be used to quantify the effects of the variability of the Trent River and its effects in the bay.
This paper studies the monthly variation in the Trent River for four years with uniquely different patterns of spring run-off. The study focused on the April, May and June period, which captures the time when runoff falls from the peak outflows to the lowest, and algae growth reaches peak levels. There is very little flushing of the bay after June, while algae growth peaks in June, e.g., [4,6]. We quantify the impact that the variability of the Trent River has on flushing by illustrating the resulting flushing patterns in the bay. For this study, we measured the speed of the Trent River using Lagrangian drifters in 2017–2019 and used this data to derive river forcing for a three-dimensional hydrodynamic numerical model of the Bay of Quinte. We used the Finite Volume Community Ocean Model (FVCOM) [10] with surface winds, heatflux and river discharges from its four largest tributaries to estimate monthly flushing rates, to quantify the importance of the Trent River over other tributaries to flushing, to illustrate the variability of the flushing patterns and to compare particle fate for the bay’s four main tributaries in order to aid in future nutrient and algae bloom studies.
2. Materials and Methods
2.1. Numerical Model
The Finite Volume Community Ocean Model (FVCOM) model developed at the University of Massachusetts–Dartmouth was used for this study [10]. This model is used operationally in the Great Lakes and has been successfully applied to a variety of studies including a 28-year simulation of the Bay of Quinte [6,11,12,13]. Simulations for this study used river inputs for the 4 main tributaries (the Trent, Moira, Salmon and Napanee rivers), wind and heat flux forcing, and simulated the spring runoff period April–June for 2016–2019 (Figure 1). Model simulations were initiated with a uniform temperature of 4 °C everywhere consistent with the average 1 April water temperature when the bay generally becomes ice-free [14]. Daily atmospheric forcing from Environment and Climate Change Canada (ECCC) and the High Resolution Deterministic Prediction System (HRDPS) included solar radiation, surface heat fluxes and wind [15,16]. Hourly water levels were specified at the eastern open boundary using water level data from the Canadian Dept. of Fisheries and Oceans (DFO) Kingston Station (ID 13988) [17]. Trent river inflow values were estimated from upstream discharges (method discussed in Section 2.3) and daily discharges from the Moira, Salmon and Napanee rivers were directly taken from estimations provided by ECCC monitoring stations (02HL001, 02HM003, 02HM007) [18]. Daily air temperatures from a local ECCC Weather Station (Trenton A) were binned into 3-day averages and specified as the inflowing river temperatures, consistent with previous modeling efforts [19]. The bathymetry of the bay is shallow [20], less than 20 m in the upper bay and reaching 40 m as it connects to Lake Ontario, and the model grid used 11 uniformly spaced sigma (terrain following) levels in the vertical. The smallest triangle side length in the unstructured mesh was 23 m, which sufficiently resolved river inflow locations.
Model-estimated flushing is quantified for the upper part of the bay down to Line A (Figure 1). At this location, the water column becomes stratified each year, starting in late May, and there is a persistent bottom backflow. Previous models of the bay using FVCOM showed that the model reproduced the three-dimensional temperature and velocity structures, including the stratification and backflow, which are necessary to include when estimating flushing [6]. In addition, the model includes water elevation changes induced by wind and water level boundary conditions, which modify the total volume of the bay, factors which are also necessary to include when estimating flushing. Consequently, the 3-dimensional prognostic model estimates are an improvement over the bulk residence times estimated by river models or two-dimensional models, and this three-dimensional model requires accurate inputs and forcing to reproduce the dynamics. These simulations use the same model and parameter settings that were used to effectively simulate previous years of the Bay of Quinte which were validated with historical temperature and Acoustic Doppler Current Profiler (ADCP) data [6]. The HRDPS forcing and FVCOM mesh used for these model simulations have much higher resolutions, and the Trent River discharges are calibrated via real world observations (discussed below). The model results for this study are validated using ECCC surface temperatures and Lagrangian drifter observations.
2.2. Drifter Observations in the Trent River
Observed current velocities were used to estimate Trent River discharge inputs for model simulations. The Trent River does not have a moored flow-meter but its discharge can be estimated by correlating observed current speeds with its largest upstream monitored tributary, the Crowe River (ECCC station 02HK003), which is continuously monitored. Current velocities in the Trent River were measured monthly for spring and summer periods during 2017–2019 using Lagrangian drifters. The observations were collected in a sheltered section of the river on days when the 10 m wind (the wind measured at 10 m above the ground) was less than 7 m/s. The drifters used a drogue with four vertical vanes set in a cross shape for drag, which had minimal wind exposure (subsurface to surface drag ratio, R = 53.5) and captured the surface flow down to 1.5 m [21,22]. The drifters contained GPS units which could be tracked in near real-time and recorded position data every minute (2.5 min in 2017) resulting in an average of 230 data points per day (70 in 2017). The resulting near-surface velocity estimates were computed via a 3-point centered difference scheme [23,24]. These velocity observations were linearly regressed to Crowe River discharges and then the model Trent River inputs required to reproduce the same velocities were determined, thereby establishing a relationship between the observed Crowe River discharges and Trent River inputs.
2.3. Linear Regression of Trent River Speeds to Crowe River
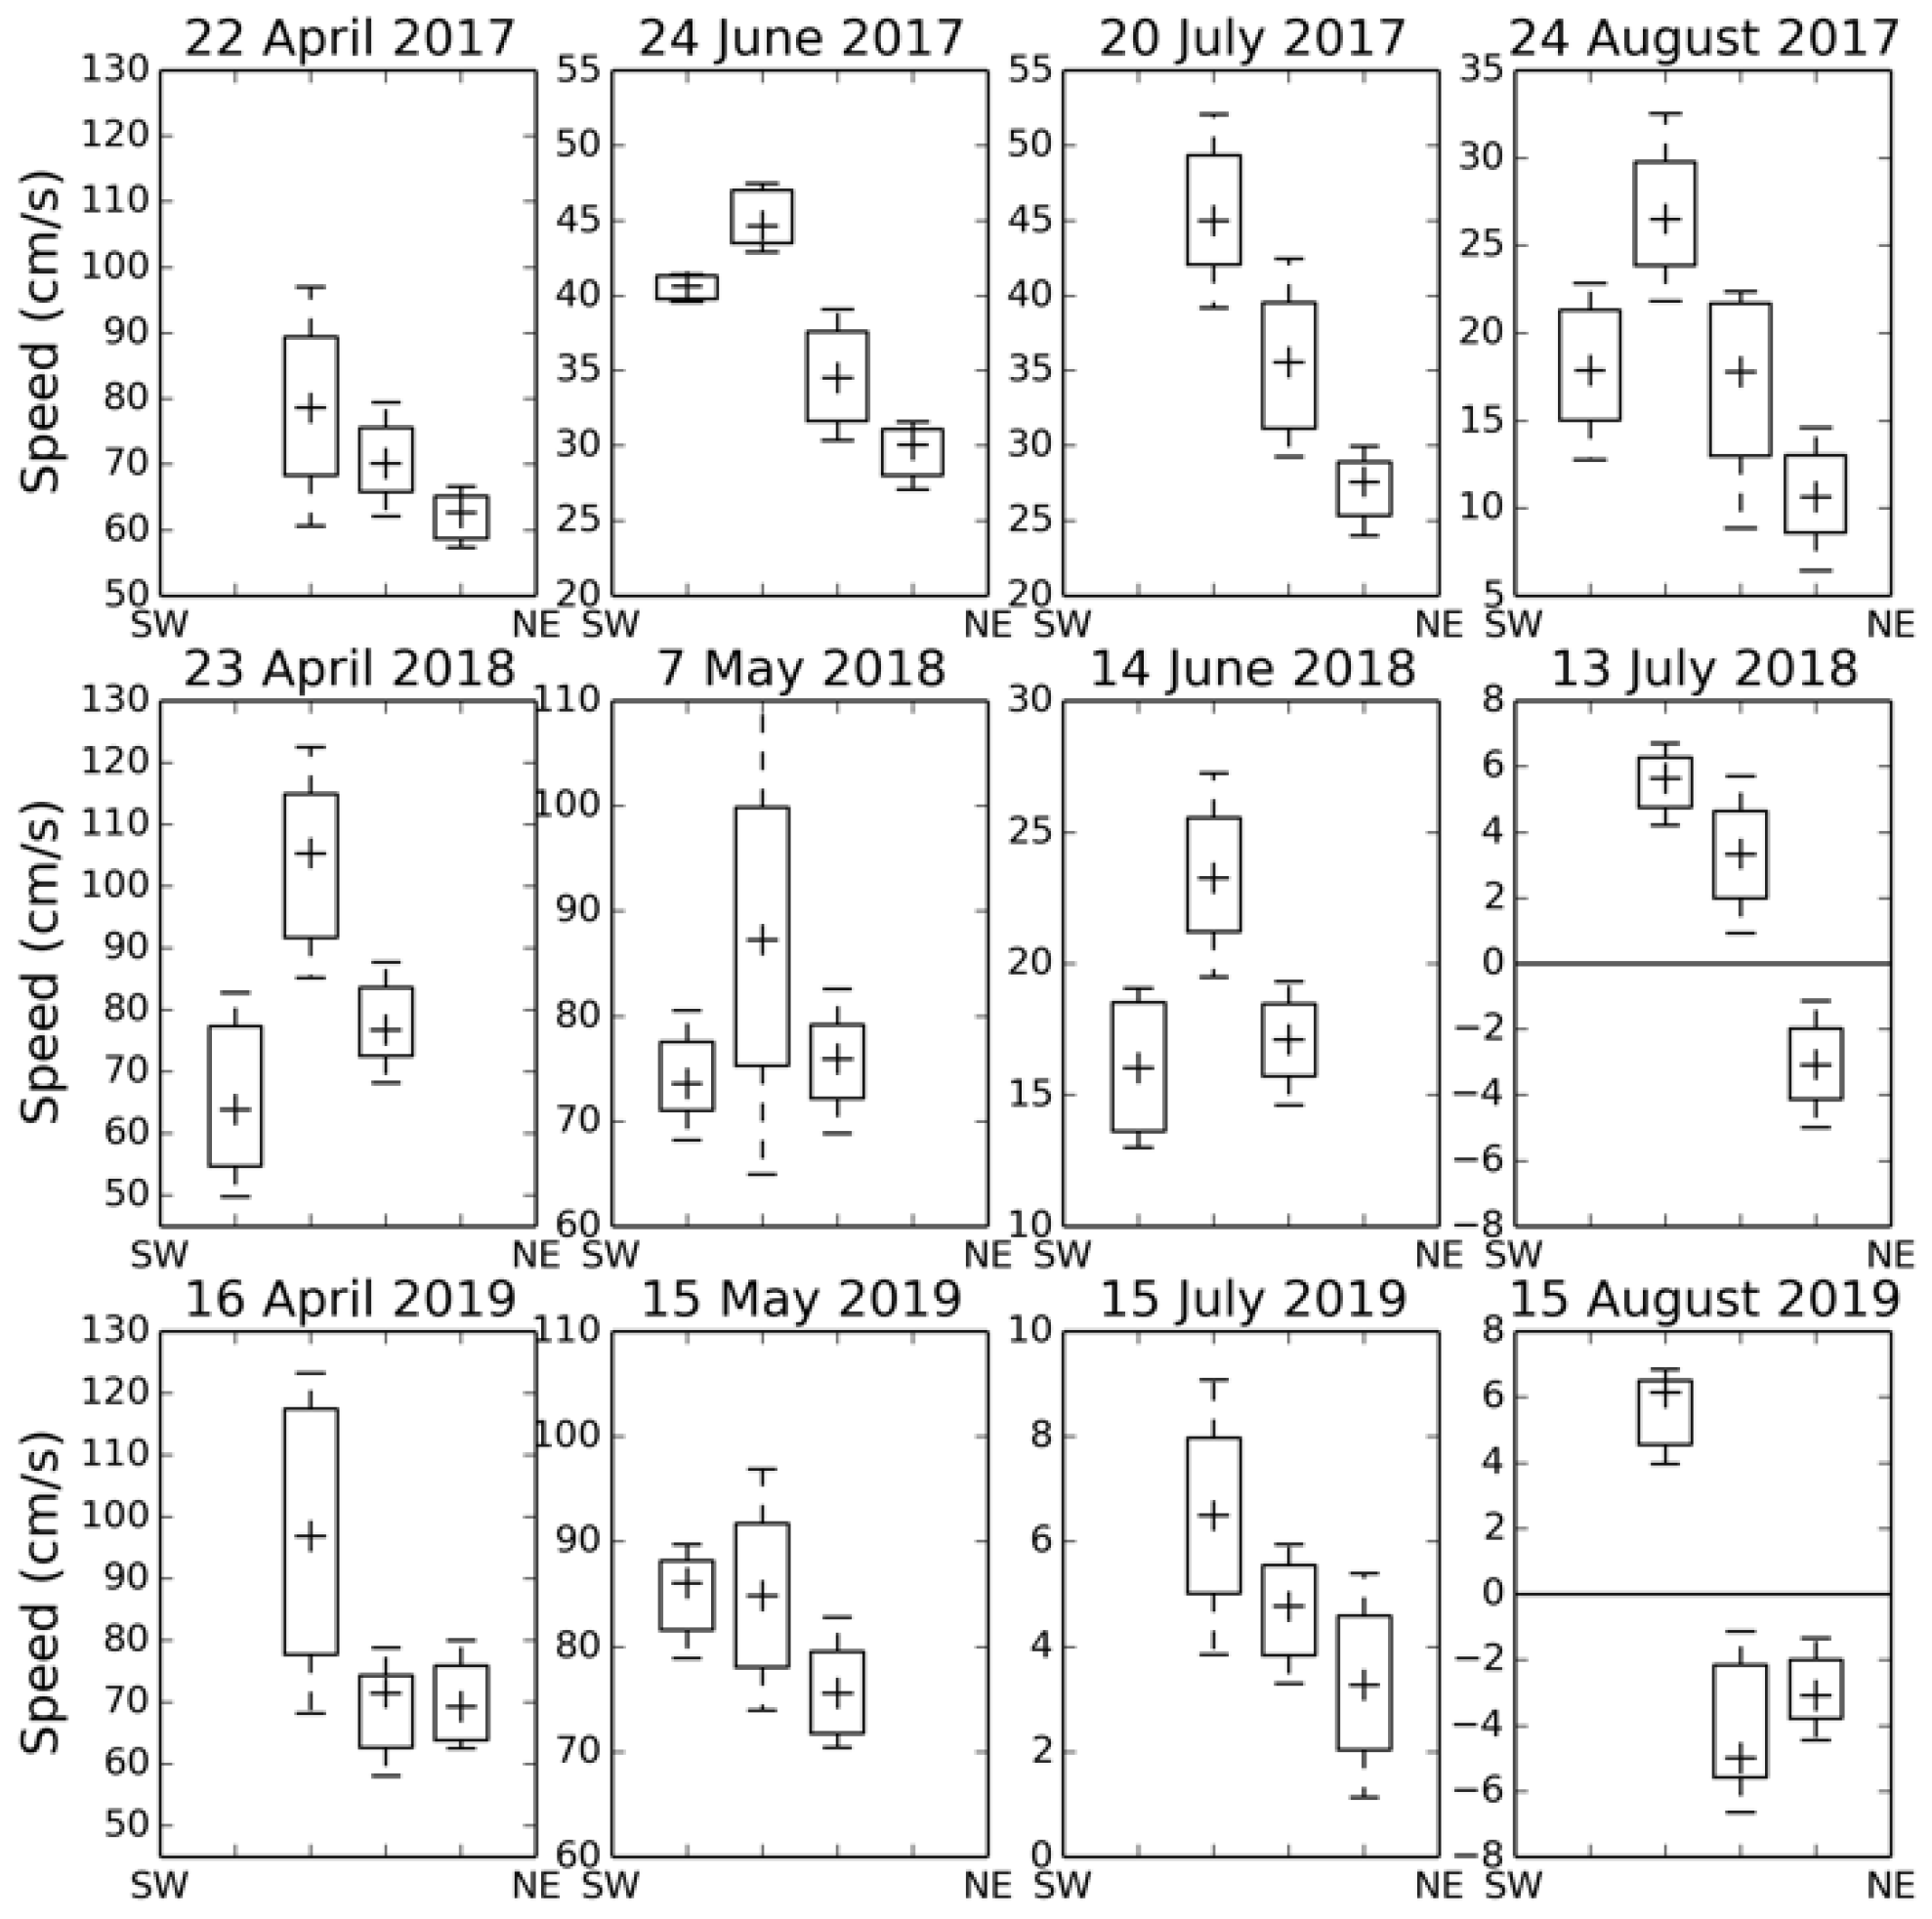
The Trent River was sampled monthly through the springs and summers of 2017–2019 in a straight section of the river that is about 200 m wide. Average speeds were calculated from drifter data binned into approximate 50 m wide cross-river bins, which identified a current with faster speeds closer to the southwestern side of the river (Figure 2). Variability in the drifter speeds is captured by the quartile ranks of the box-plots, and there is generally an identifiable jet of faster flow on each day (speeds presented in the box with the highest average speed). The spring runoff cycle in the flow speed is evident in the drifter observations with large spring inflows followed by very low summer and fall values [14]. The April speeds are the highest each year, with the average maximum flow speed in 2018 reaching about 106 cm/s. Interestingly, speeds in the summer of 2017 were much faster than in the following years, with the speeds in June and July being almost 50 cm/s and August almost 30 cm/s, whereas the speeds in July 2018 and August 2019 were so small that there is a reverse flow on the northeastern side of the river. The average speeds of the fastest flowing streams (identified as having the highest of the 50 m averaged river speeds) are used to determine the Trent River forcing for FVCOM model simulations.
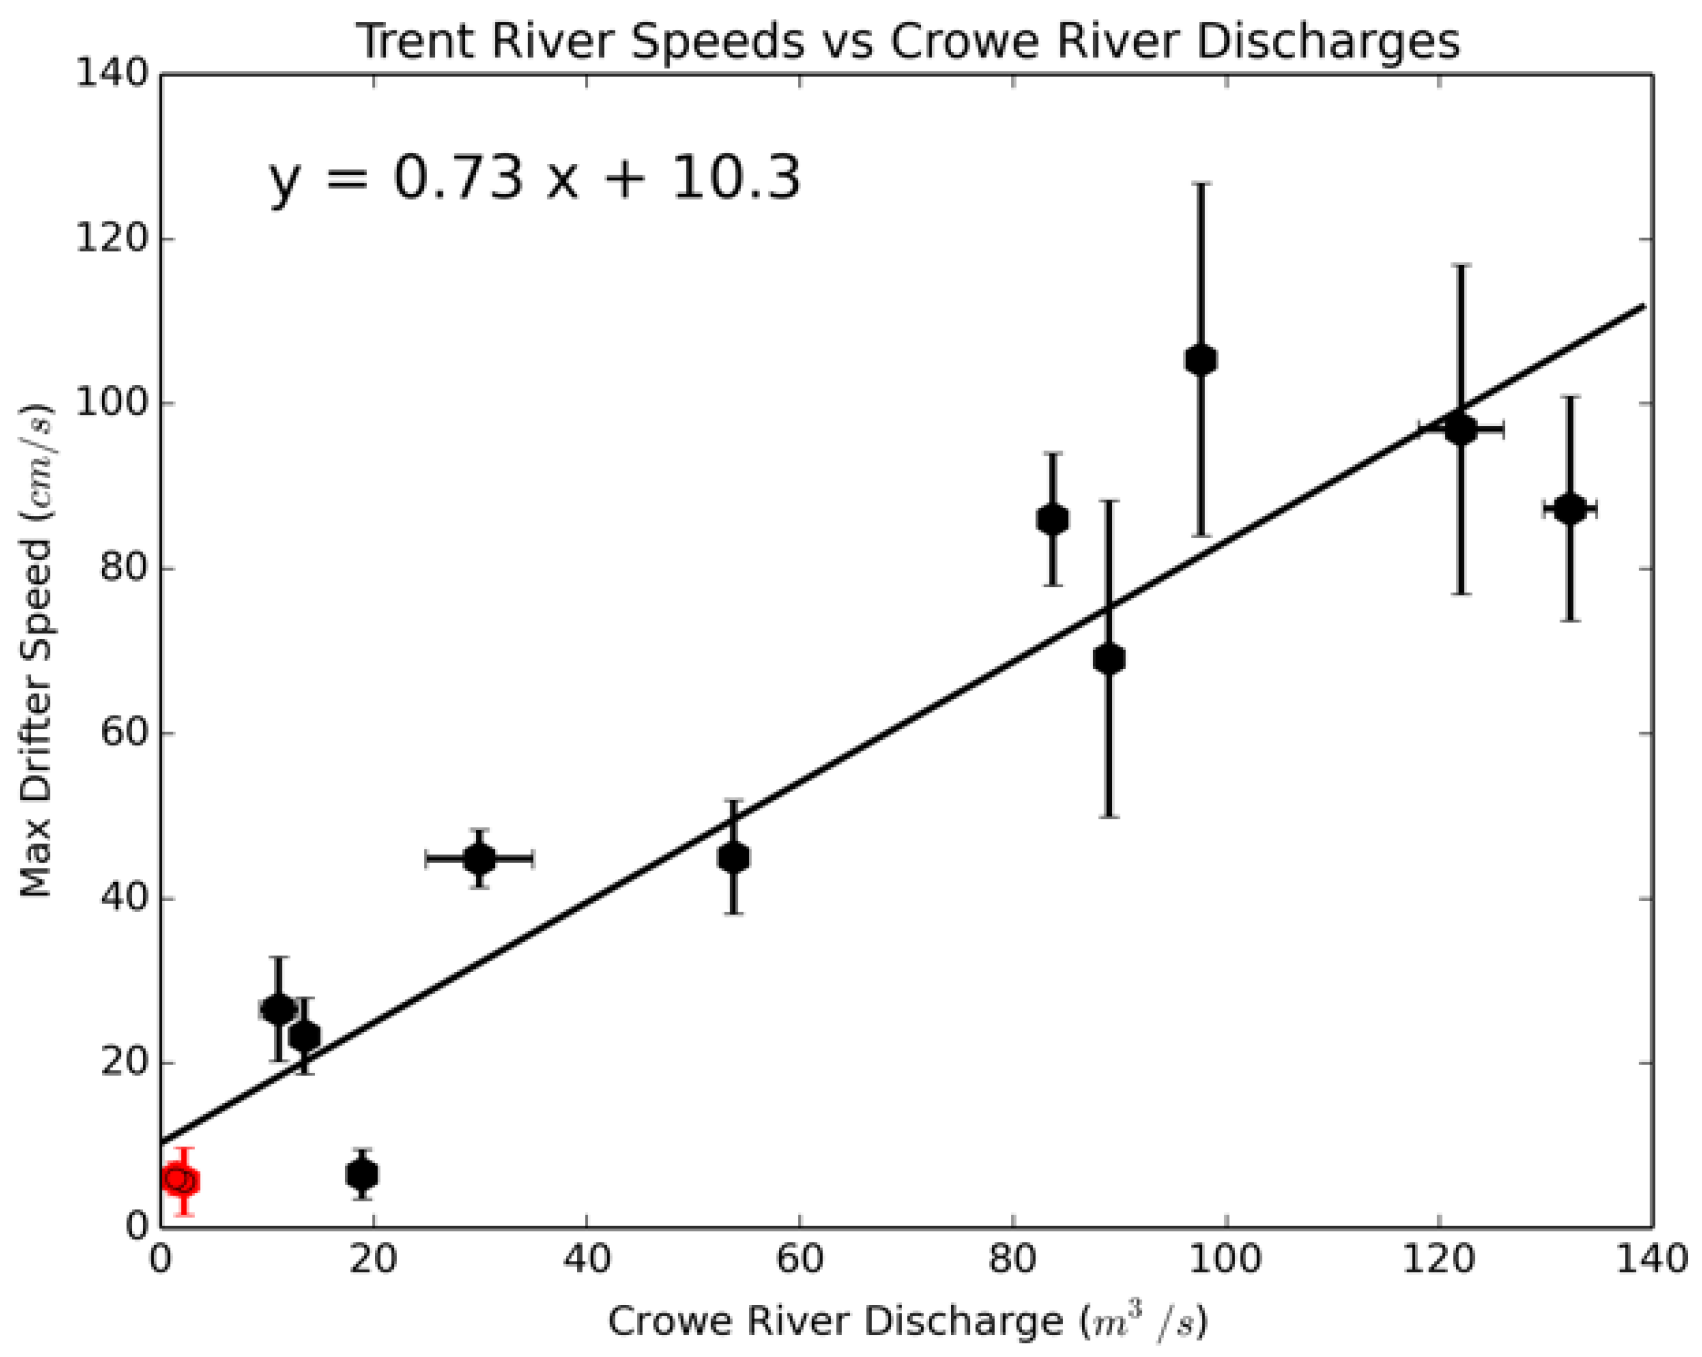
The average speeds in the fastest jet for each month (the box with the highest average as shown in Figure 2) were linearly regressed to Crowe River discharges (Figure 3). Crowe River is a significant source of flow into the Trent River and it is continuously monitored by ECCC (station 02HK003). This station is located 50 km north of Trent River at 44°28′53.0″ N, 77°41′05.0″ W and there are short records of hourly discharge data available for this station, as well as historical records of daily observations back to 1959. Variances for the daily discharges at this station are estimated from the uncertainties for a 3-day binning period. The linear regression produced a relationship for the average Trent River speeds, v (cm/s), relative to the Crowe River discharges, whereby QC (m3/s): v = 0.73 QC + 10.3 with an r value of 0.9, though the linear regression shows that as upstream discharges increased, variability in the observed speeds was up to 0.15 m/s.
The Trent River discharges necessary for the FVCOM model to reproduce the observed average drifter speeds shown in Figure 2 were correlated with the Crowe River discharges on the observation dates. The resulting relationship was then applied to the complete timeseries of the ECCC-observed Crowe River discharges to provide continuous daily Trent River discharge estimates, QT_est (m3/s): QT_est = 3.661 QC + 88.9. Using these estimates, the total volume flushed during the spring run-off and peak discharges can be quantified (Figure 4). Using the Trent River estimated discharge timeseries for each year from 1959–2019, the day on which the annual peak discharge occurred was identified. The peak discharge for most years falls between 1 April and 10 May (Figure 4a). In addition, the total volume flushed during the spring run-off (summed over 15 May–30 June to capture the peak in every year) was also calculated. Figure 4a shows the peak discharge for each year versus the relative total volume flushed for that year. These results indicate that the estimated Trent River discharge reaches up to almost 950 m3/s on some occasions, with 2019 having one of the largest discharges. The years 2016–2018 have lower peak discharge rates, about 700 m3/s, however the timing of these peaks varies. Individual timeseries of Trent River discharges for 2016–2019 are shown in Figure 4b. In 2016, the peak occurred early on in the first week of April, whereas in 2018 it was 3 weeks later. The peak discharges for 2017 and 2018 were delayed and occurred after the onset of algae growth. The large peak discharge in 2019 is evident. In 2017 there were 2 significant discharge events during spring run-off (another occurred before 1 April), both having moderately large peaks over 500 m3/s. For comparison, estimates for the 2017 Trent River discharge were also available from the Lower Trent Conservation Authority (LTCA) [25]. These values are estimated using a different method, with observed rainfall data, prorated drainage areas and non-publicly available water level and flow data for 15 rivers, creeks and weirs upstream of the Trent River. Comparisons show that our estimated discharges capture the magnitude and timing of the LTCA estimates, giving us some confidence in the estimates. These results show that over 2016–2019 there is a range of above-average peak inflows of 700 m3/s to 950 m3/s (relative to the period starting in 1950), spread over 6 weeks of spring, with widely varying flushing volumes.
2.4. Comparison of Numerical Model Temperatures and Speeds to Observations
Hourly surface temperatures collected by ECCC from 4 May 2016 near the Napanee river (N1; Figure 1) are compared to model estimates [17]. The modeled surface temperature reproduces the rise in the observed spring Napanee temperatures where the modeled daily values have a smoother curve (Figure 5a). To evaluate the model, an RMSE was computed comparing daily model surface temperatures to daily values from a 6-day running average of the observations. The resulting RMSE for 4 May–30 June was 0.9 °C. ECCC also collected surface temperatures at 64 locations in the bay on 25 May 2016 [16]. An RMSE error for these observations was computed using model temperatures taken from nodes closest to the observed temperature location, and the squared model-observation error term was averaged over the number of observations. The RMSE error was 1.0. The model does reasonably well overall in reproducing the observed temperatures.
The Lagrangian surface drifters were also used within the Bay of Quite on two days when the wind conditions were uniform and aligned with the axis of the main channel. Current speeds were collected at Big Bay (BB; Figure 1) on 16 June 2017 and Napanee (N2; Figure 1) on 24 June 2017. On 16 June, winds were approximately 4.3 m/s in the direction of the downstream movement and drifters moved downstream in the main channel at an average speed of 6.3 cm/s (Figure 5b). In comparison, the average model speeds were 3.1 cm/s, which is in the lower range of the observed drifter speed. Waves were observed to be present during the drifter deployment due to the fact that the winds were aligned with the axis of the bay (resulting in a long fetch). A recent study that used Lagrangian drifters to validate models of the North Sea found that adding a direct wind drag term to model velocities was as effective as including a stokes drift term to capture the observed drifter speeds [26]. To account for the stokes drift due to wind waves, an adjustment of 0.6% of the 10 m wind speed was added to the model speeds following the North Sea study, which was consistent with an earlier drifter study in Lake St. Claire that determined a windage factor of 0.72% [26,27]. Using this adjustment, the average model speed was within 0.6 cm/s of the observed average. On 24 June 2017, winds were approximately 4.9 m/s to the north and drifters in the main channel had an average speed of 7.8 cm/s. Average model speeds were approximately 4.8 cm/s. Again, adjusting for stokes drift, the estimated model speeds were 7.8 cm/s, in line with the observed drifter speeds. The model does well in reproducing the observed near surface water speeds.
3. Results
3.1. Model-Estimated Flushing
The impact of the variability of the Trent River is shown in the resulting flushing. Changes in flushing of the bay are driven by the amount of precipitation and melting events unique to each year, which control the tributary discharges. Simulations of the spring runoff period for the years 2016–2019 were conducted, and monthly volumetric flushing for the bay (defined by the volume upstream of line A; Figure 1) is represented by the number of flushes, N, according to:
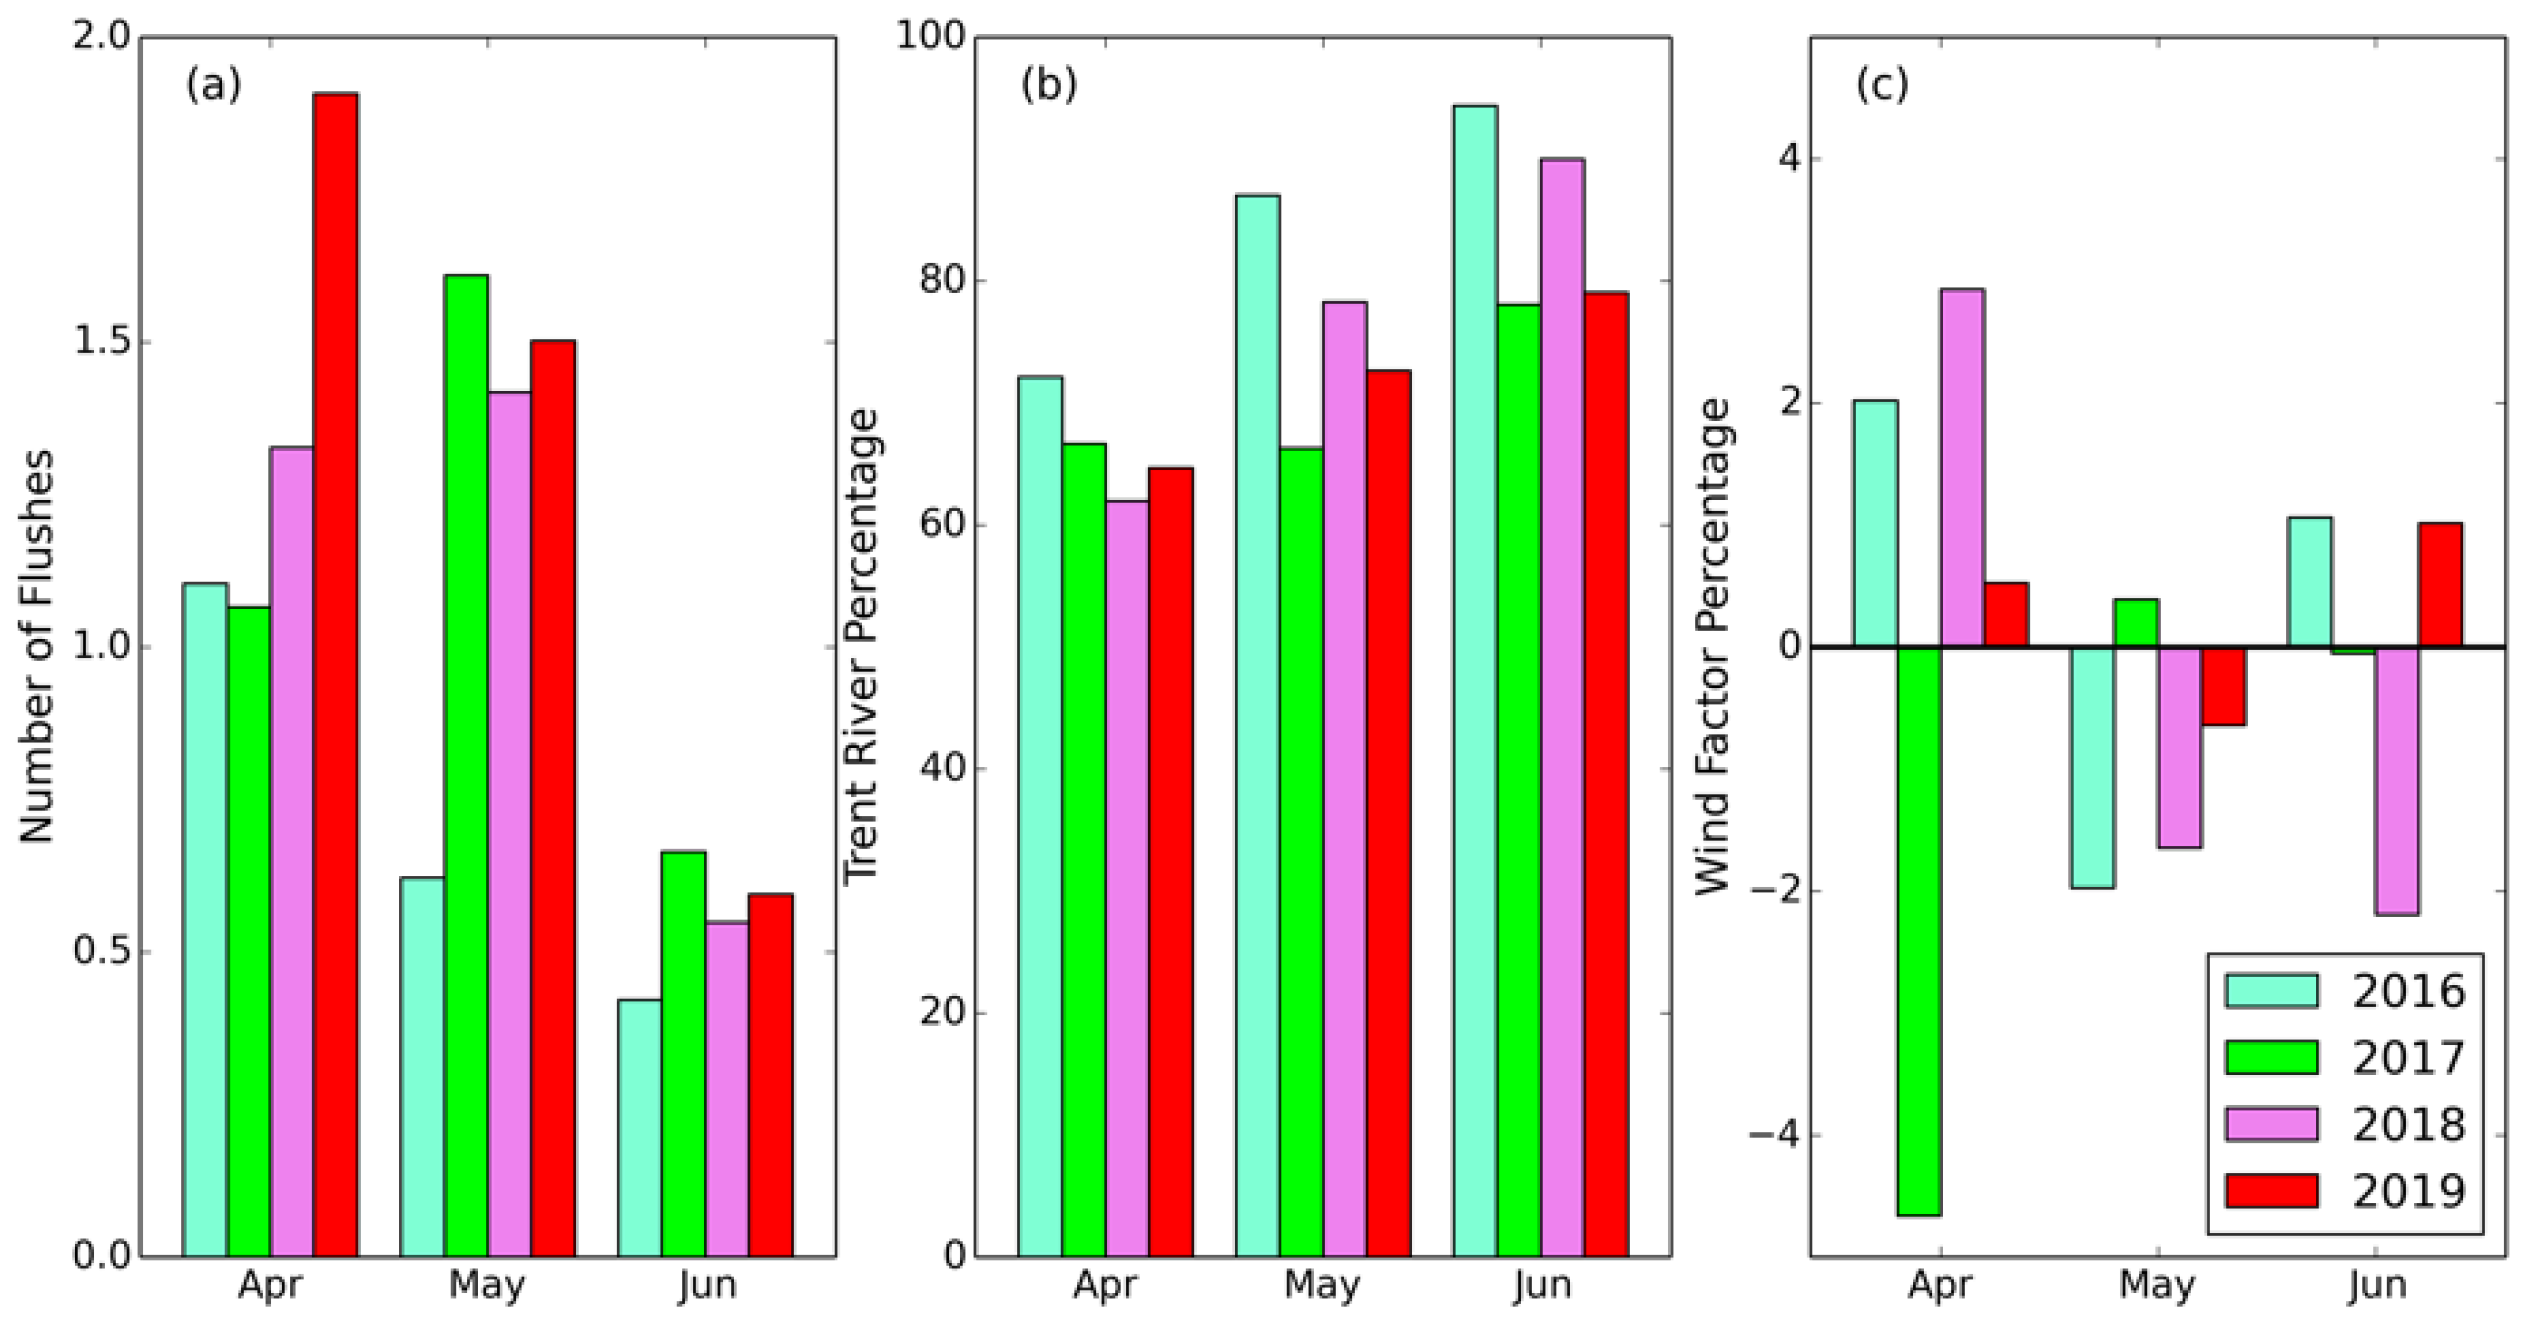
where V is the volume (m3) upstream of, and Q the total flow (m3/day) through, Line A (Figure 6a) in time T (days). All four rivers discharge into this part of the bay and results can be directly compared to earlier studies [1,5,6]. These results show that the bay flushed at least once in April of each year, but that comparatively 2019 had double the amount of flushing. There is also significant flushing in May 2019, consistent with 2019 having one of the largest Trent River spring runs-offs by volume. Both 2017 and 2018 had their largest flushing in May, far outpacing 2016, with 2017 flushing over 1.5 times due to two major precipitation events. The bay flushed in June in all years as the spring run-off finished. The least amount of flushing occurred in 2016 with a reduction of flushing in each successive month. Uncertainty propagation analysis and assuming a 15 cm/s uncertainty in the peak Trent River speeds give a discharge uncertainty of 75 m3/s for Trent River discharges greater than 365 m3/s. The overall total number of flushes over the spring runoff periods for 2016–2019 ranged between two and four times over April to June, similar to previous estimations [1,5,6], but the values are now broken down into monthly estimates with the peak monthly flushing being up to 2.5 to 3 times as much as the lowest. These results show that the timing and magnitude of the flushing varies significantly year to year, and the flushing can double in some years.
The Trent River is a major driver of the amount of flushing in the bay, and studies generally assume that it is responsible for about 70% of the total flushing because it contributes about 70% of the average spring runoff discharge of all four tributaries (Table 1) [9,28]. To quantify the importance of the Trent River, twin simulations were run under the exact same forcing for each year 2016–2019, but with one simulation having only Trent River inflow for comparison. The ratio of the number of flushes due solely to the Trent River to the number of those driven by all the rivers illustrates the impact of the Trent River over time (Figure 6b). Results show that in April, the Trent River is responsible for about 60% to 70% of the flushing, however as the spring progresses it becomes even more important: about 80% in May and 90% in June. The algae growing season generally starts in May as water temperatures warm up, thus the contribution of the Trent River to flushing of algae from the bay is significant, increases into the summer, and is more important during years with lower flushing amounts [4,7,8].
The main axis of the bay is aligned with the predominant wind direction, and the shallowness of the bay suggests that wind events could alter the flushing as it does in similar shallow bodies within the Great Lakes system [27]. When the wind is aligned with the axis and in the downstream direction, wind-driven flow could push surface water out of the bay, adding to the flushing. Flushing results for 2016–2019 twin simulations with and without wind forcing were compared to quantify the wind effects (Figure 6c). The wind factor is the percent change in the number of flushes which result from changes to V and Q in Equation (1). Wind events during April acted to increase the number of flushes, with the exception of 2017, where the number was reduced by about 4%. For most years and months, wind acted to alter the overall flushing by very small amounts.
3.2. Model Estimated Particle Tracks
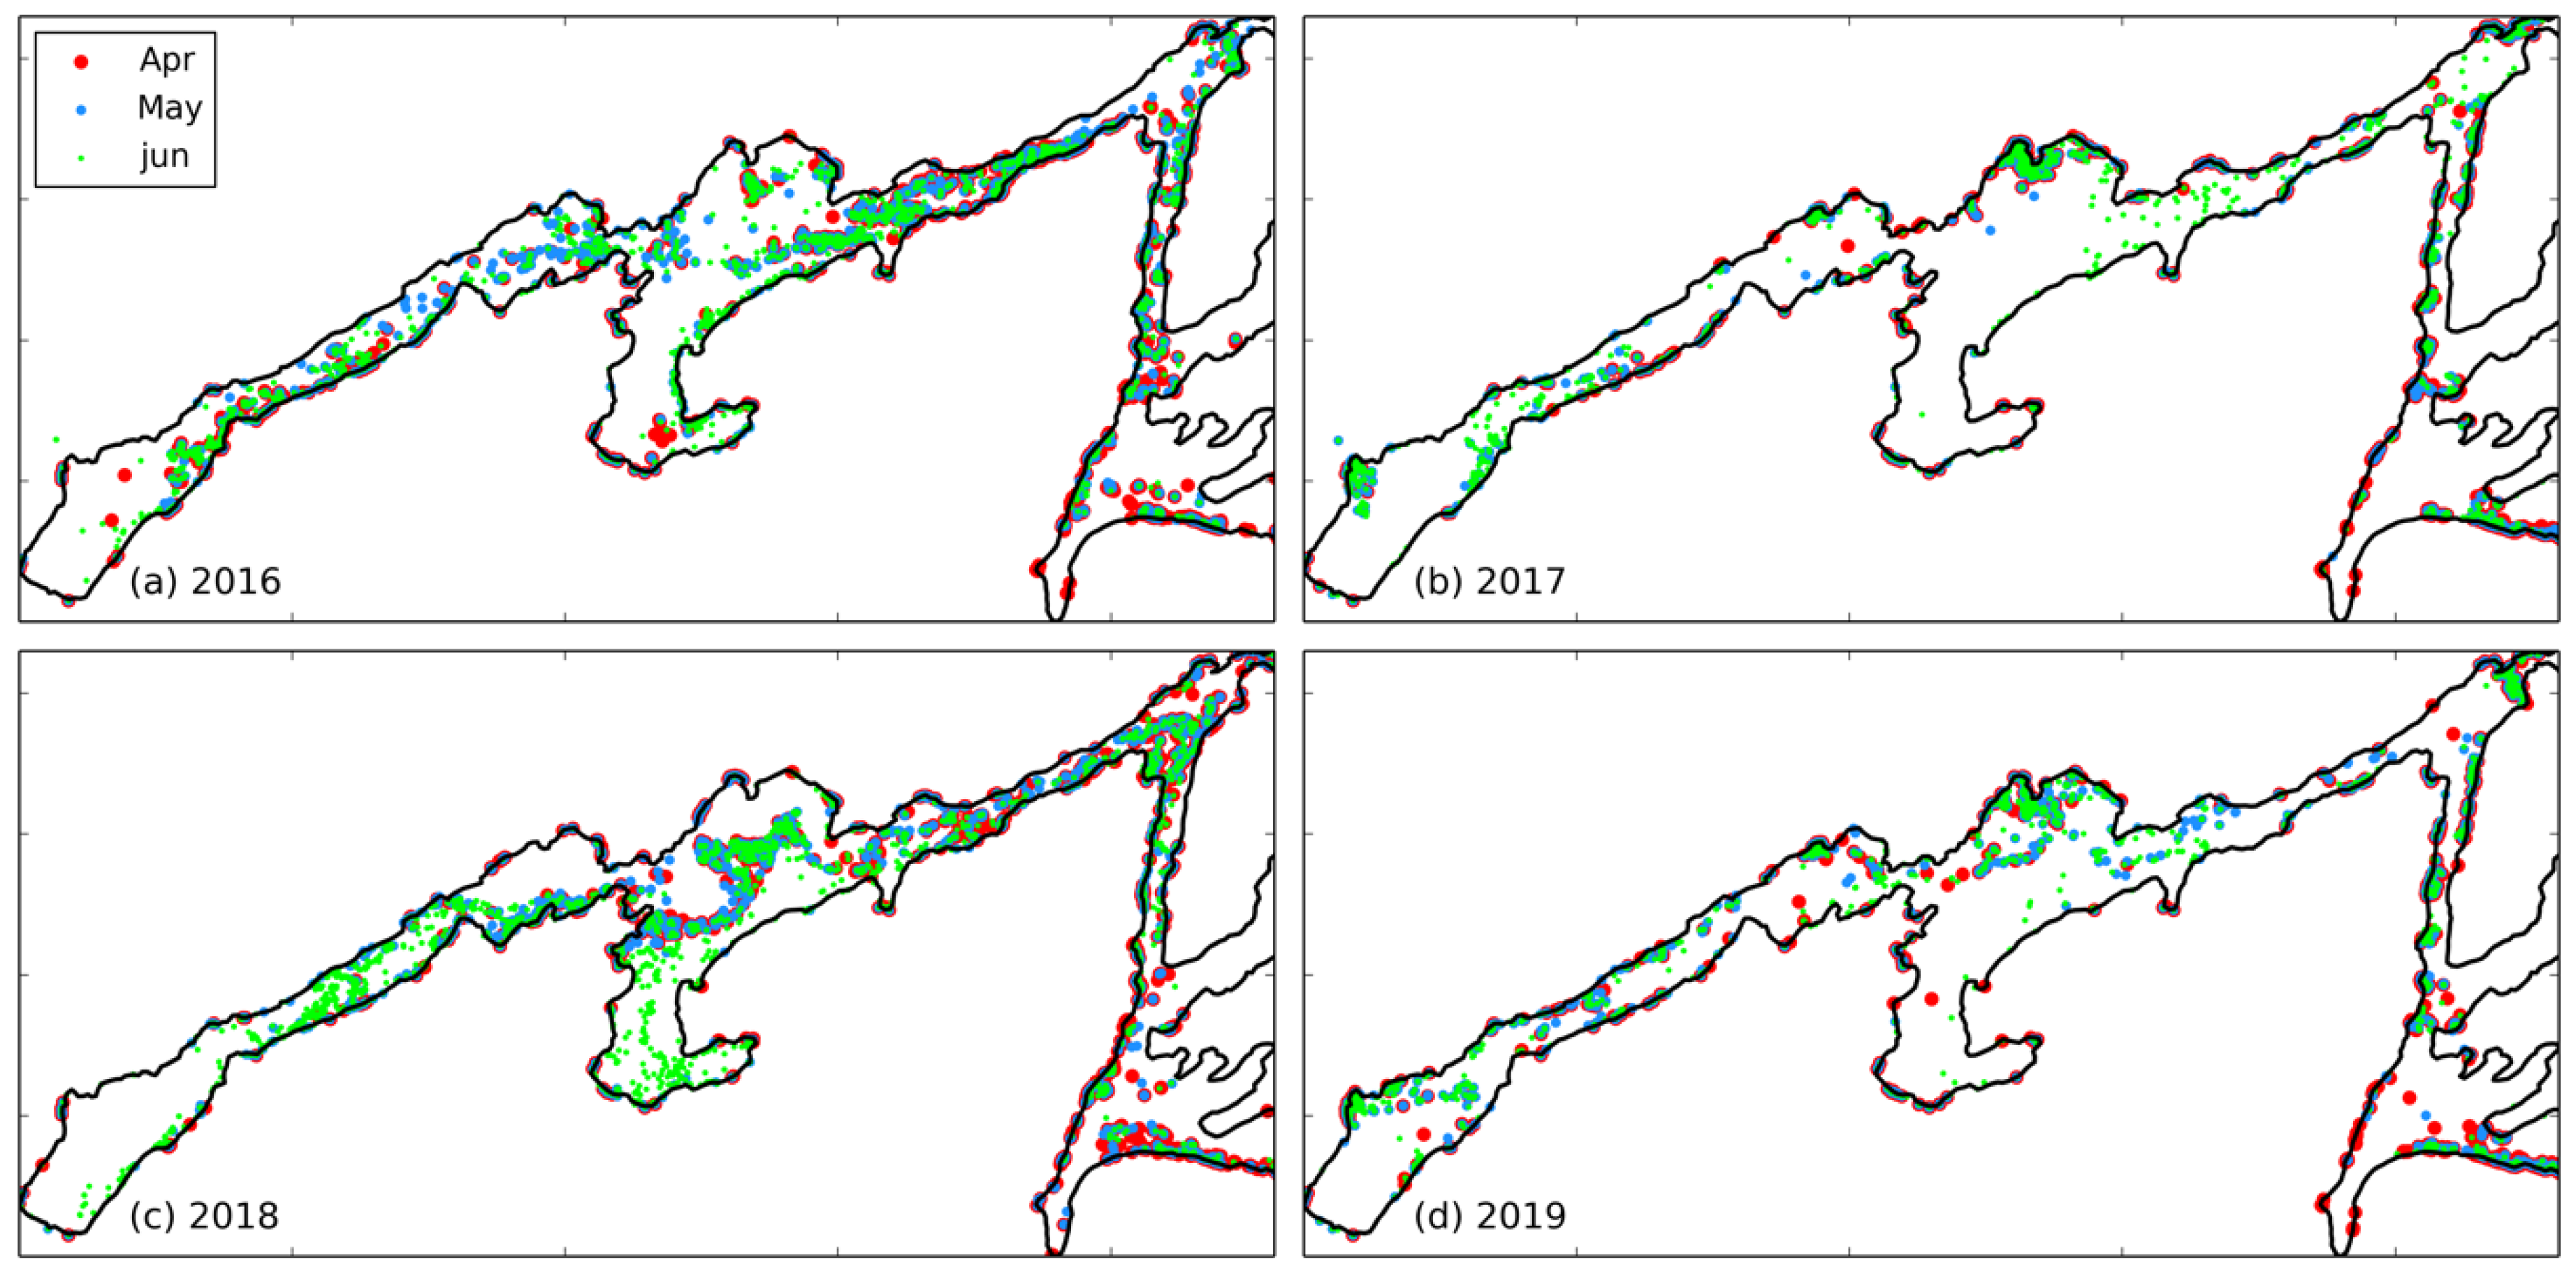
The wind played a role that is more evident in the particle tracking results simulating the spring run-off periods of each year. To evaluate the wind forcing effects on particles found in the near surface, such as algae, inert surface particles were released covering the entire bay on the first of each month of April, May and June in each year, and tracked until the end of June. The particles’ positions are computed using the surface velocity field from the model solutions, which include inflow from all four tributaries. The final positions of these simulated particles on 30 June are marked with earlier released particles shown as slightly darker and larger (Figure 7). As we might expect, the high flushing rate in 2019 moved most of the particles out of the bay, whereas in 2016, when there was comparatively much less flushing, particles from all months remain and are dispersed throughout. It can be seen that particles seeded on 1 April 2016 were present in the arm west of Big Bay, and were within the main channel east of Big Bay after 3 months (Figure 7a). In 2019, the particles that remain at the end of June are closer to the edges, trapped near the shoreline, unable to be flushed down the main channel (Figure 7d). This trapping effect was effective in 2018 but not 2017. Both of these years have peak flushing in May, and in 2017, particles that were seeded in April were flushed (Figure 7b). In 2018, however, particles were generally pushed out of the main channel towards the shoreline by transient wind effects, and sheltered from the main channel flow. Even though there is enough water movement in the main channel to flush the upper bay more than once in May 2018, particle residence times were increased by shoreline trapping. Near the end of June 2018, when the flushing was greatly reduced, the wind pushed particles back into the main channel and they remained spread throughout the bay, including in Big Bay and southern Big Bay. The particles released at the start of each month were all co-located at the end of June in Big Bay because they were trapped together at the same shoreline locations (Figure 7c).
To further illustrate the variability of particle transport during spring runoff, particles were released at the beginning of April and June 2019 and tracked for one month. These two months represent particle movement during periods with a high and low number of flushes. Particle paths in these two scenarios are mapped using four metrics: snapshots, net displacement, total distance travelled and tortuosity (the ratio of a particle’s distance travelled to its net displacement) (Figure 8). In total, 30 snapshots of daily particle positions were stacked sequentially, with the latest positions placed on top, to produce a spatial map of cumulative particle transport. In April 2019, particles were displaced downstream, with some particles that were initially near the Trent River (in red) dispersed through the main channel into Big Bay, and some transiting the entire length of the bay and exiting into Lake Ontario (Figure 8a). Particles near the northern shoreline of Big Bay (in blue) tended to remain there as well as in other areas isolated from the main channel. These isolated areas are locations where particles can be sheltered and retained from flushing, as happened in 2018. In June 2019, particles transitioned into the main channel, but were not transported far from their original positions (Figure 8b).
Net distance travelled (the straightline distance between the initial particle position and its position 30 days later) is shown for the April and June 2019 months in Figure 8c,d. In April, particles in the arm west of Big Bay travelled the farthest, with the exception of a pocket in the westernmost end where there is very low movement (Figure 8c). In June 2019 there was movement in the narrow arms east and west of Big Bay, but the sheltered areas on the northern shore were pronounced (Figure 8d). Very interestingly, there was movement out of the southern part of Big Bay when these particles were wind-blown northward and dispersed. Patterns of transport through the main channel during high flow events and particle trapping near the northern shores are evident in the maps of total distance travelled (Figure 8e,f). The total distance travelled by a particle is the sum of the distance it takes on each step. In April 2019, particles in the well-flushed regions travelled about 30 km, compared to about half that in poorly flushed areas. In June, the average flushing throughout the region fell to about 9.6 km. As tortuosity is the ratio of the pathlength to the net displacement, a larger value indicates more meandering pathways. In April 2019, the average path length was always about 2.3 times larger than the net displacement, compared to 3.7 times in June, and there was greater variation in the tortuosity in June reflecting the strong spatial patterns. In April, meandering pathways were restricted to sheltered locations, whereas in June these regions appeared to be near river locations. There were significant spatial differences in monthly particle transport that we might expect to see expressed as lagged TP loading peaks between monitoring sites, or as clustered algae patches during summer.
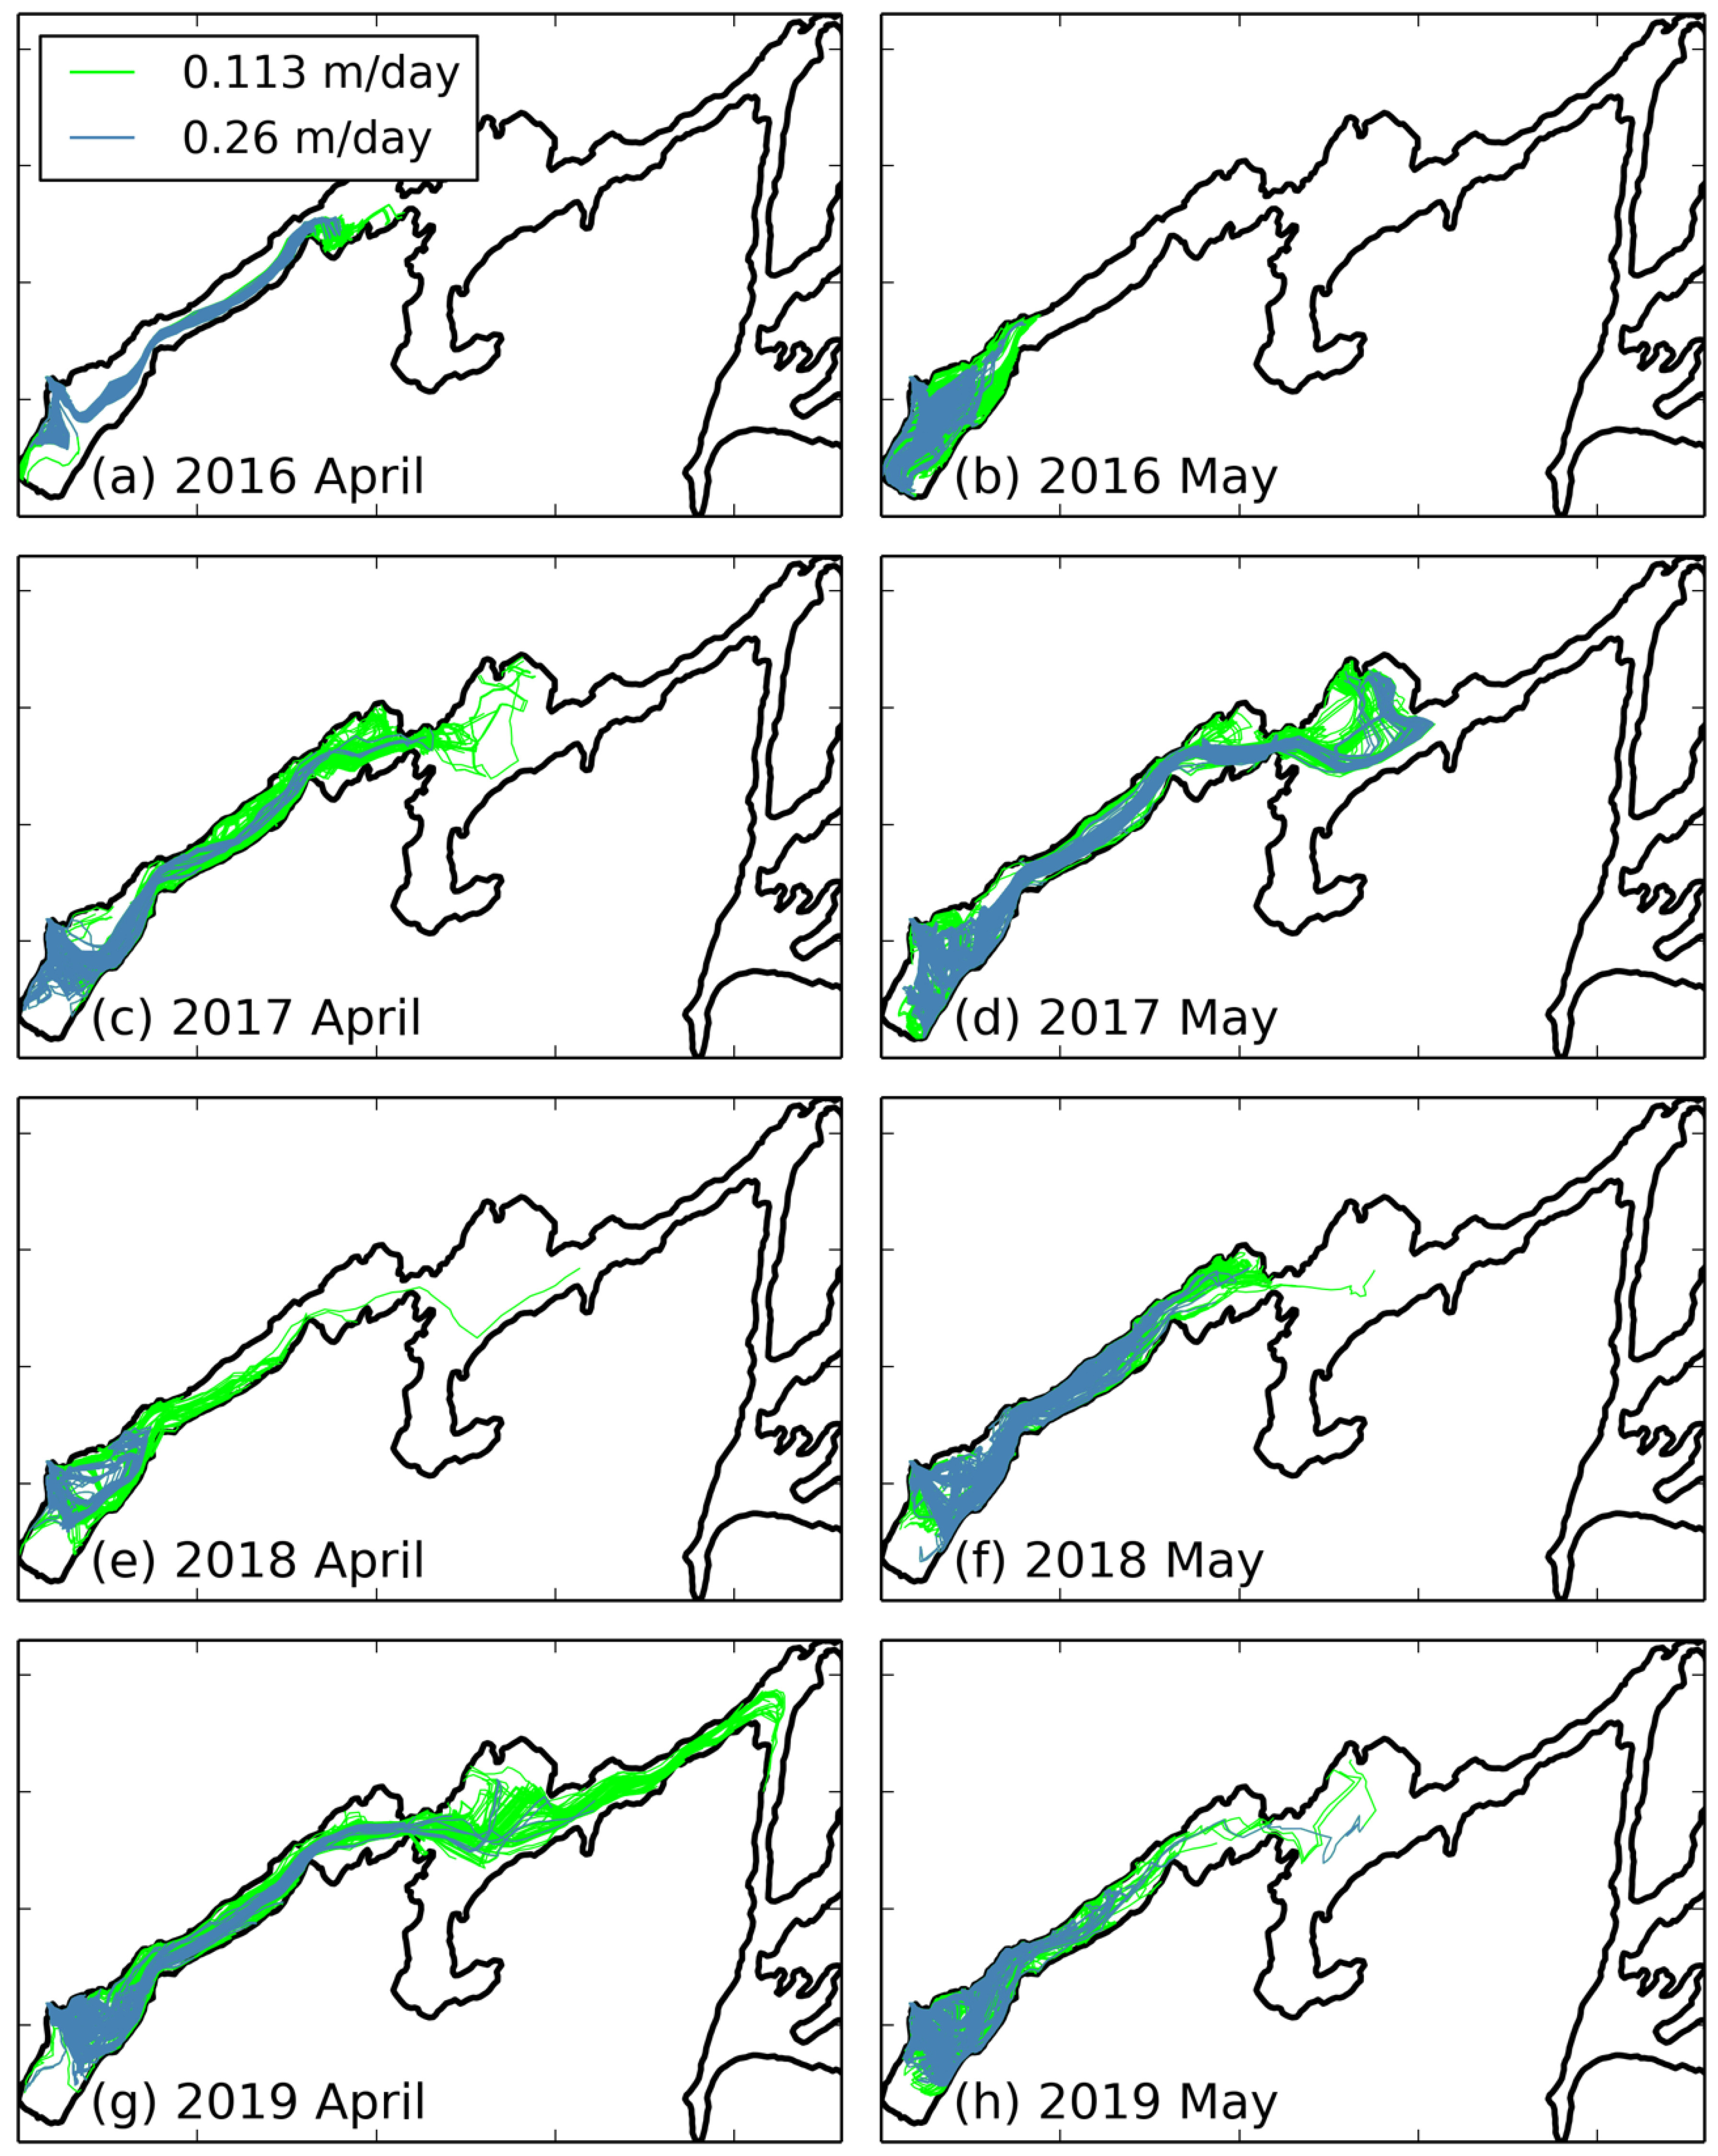
High diffusive phosphorous fluxes were observed from the particulate phosphorous originating out of the Bay of Quinte’s rivers, and these fluxes are thought to be a significant driver of algae growth [3,28]. We applied a fixed settling rate to the released surface particles to model sedimentation, a common assumption in nutrient budget models. To estimate the extent and variability of potential sediment deposition initiated by the Trent River, 800 surface particles were released from the mouth of the river, with two different settling speeds of 0.113 m/day and 0.26 m/day. These speeds represent a range of particle settling speeds consistent with previous TP studies in the Bay of Quinte [2,14]. Particles were released at the beginning of April and May in all four years to capture times of peak river discharges, and tracked for 30 days or until they reached the bed (Figure 9). While particles were released from the Trent River, the inflow from the three other tributaries is present in the model simulations as well. Particles with the slower settling speed travelled farther, with particles in April 2019 travelling the farthest, almost reaching Line A (Figure 9g). These particles also spread out and covered almost all of Big Bay, unlike in other years. In April (in all years), particle pathways were mostly constrained to the main channel, whereas there was slightly more divergence from the main channel in May. A 1994 study of the fate of inorganic compounds seeded by the Trent River found material deposits extended past the Moira river and into Big Bay, similar to the patterns seen in Figure 9 [29]. With the exception of April 2019, particles did not succeed in reaching beyond Big Bay; this suggests that sedimentation in those downstream regions is controlled by the other tributaries.
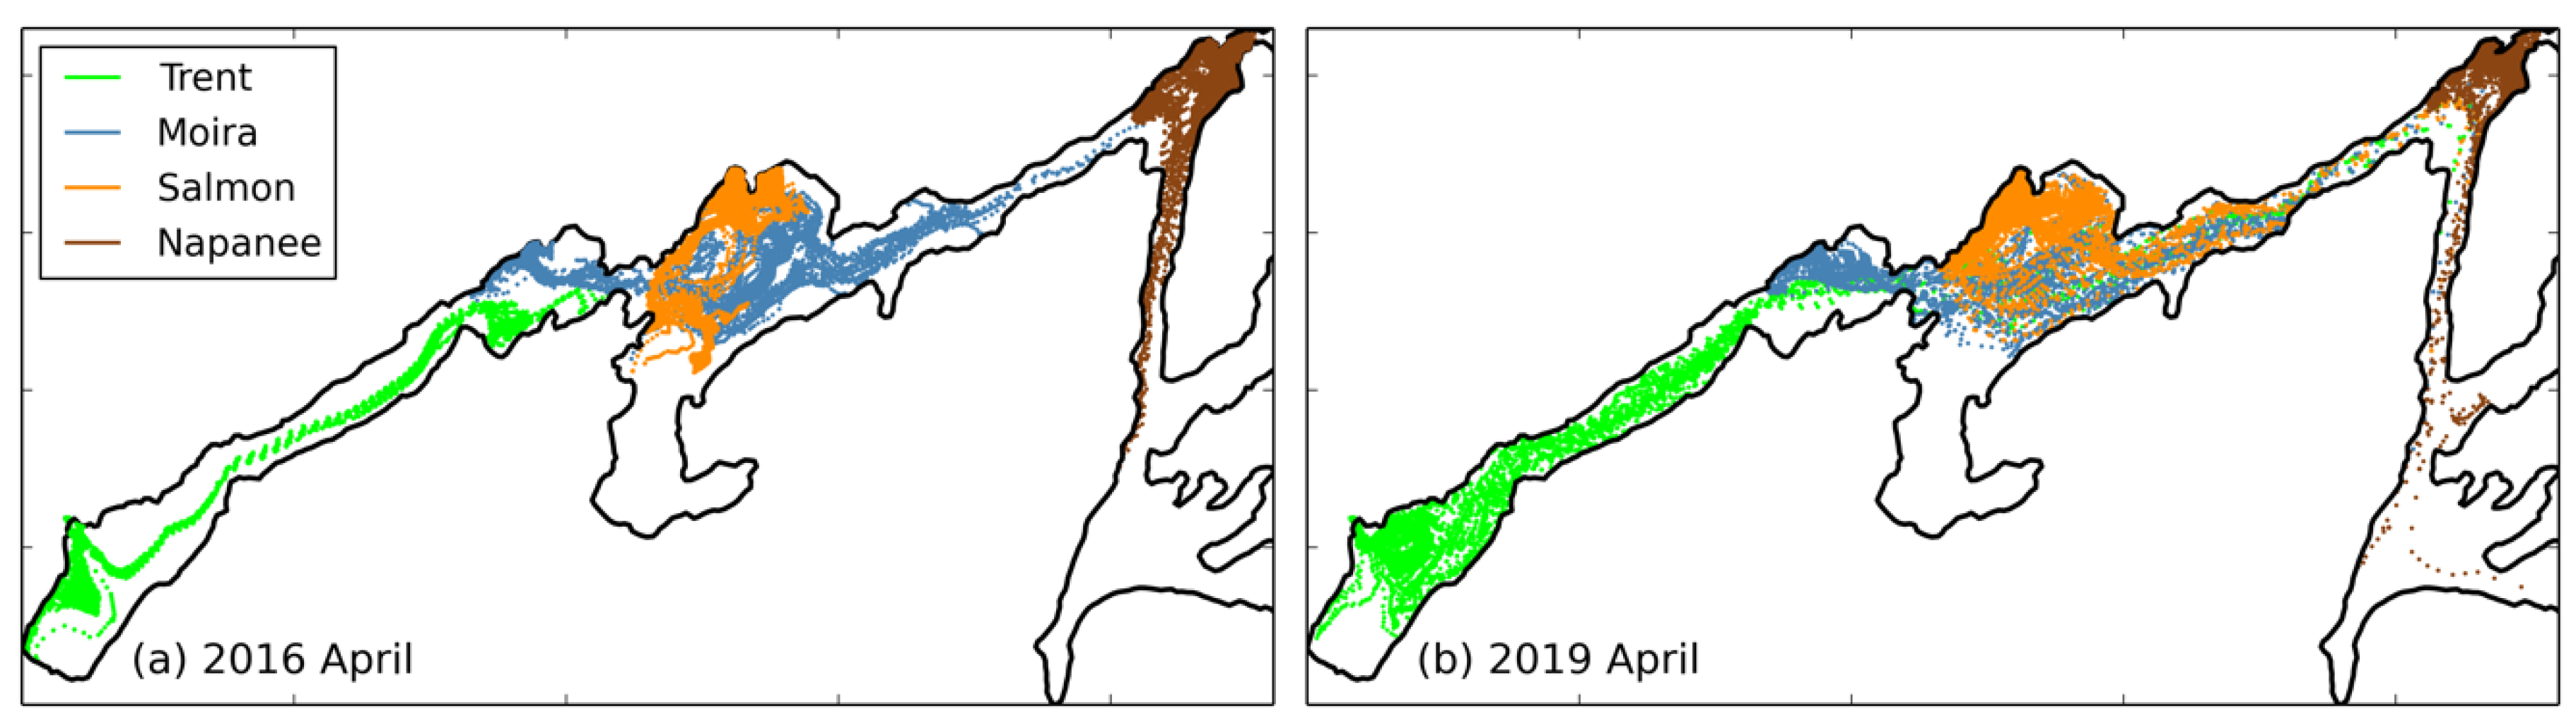
To illustrate the nature of particle spreading from each individual river, particles with a settling velocity of 0.113 m/day were released on 1 April for 2016 and 2019 from all four rivers and tracked for 30 days or until they reached the bed (Figure 10). Again, model velocities include inflow from all four tributaries. In 2019, particles were spread out from the main channel and transported further downstream from all rivers, compared to 2016. In 2016, the footprint of the Salmon river (orange) was restricted to Big Bay, and the footprint of the Napanee river (brown) was close to the river mouth and directed to the south. In 2019, some of the Napanee river particles exited the domain and none seemed to meander upstream. In general, the particles from Trent River (green) were transported throughout the upper bay, with 10% transiting downstream into Longreach in 2019. Big Bay is significantly impacted by the Trent, Moira and Salmon rivers, and the Napanee river is the primary source of particles for Longreach. The footprint of the Moira river (blue) is consistent with previous observations of higher arsenic levels in the water (as the Moira river is the main source of arsenic due to the presence of old arsenic mines in its watershed) [30]. These results suggest that though the Trent River is the main driver of flushing, its sediment signature is somewhat restricted to the area west of Big Bay.
4. Discussion
This study examined the effects of the variability of the Trent River’s inflow on flushing and particle transport and fate in the Bay of Quinte. To derive Trent River discharges, observations of river speeds were collected to capture the monthly flow cycle over three years. The estimated Trent River discharges were consistent with those estimated by the LTCA, which uses precipitation amounts, water levels and prorated watershed areas. In addition, correlating the ECCC Trent River to Crowe River discharges estimated from water levels for the years 1999–2002 gives a relationship (QT_ECCC = 4.0 QC_ECCC + 26.6) quite similar to the one derived from the measured river flows. Differences may be due to the fact that peak discharges in 2016–2019 were 1.5 to 2 times larger than in 1999–2002. While these three methods are not similar, the similarity of the estimated results lends confidence to the results.
The Trent River is responsible for about 60% to 70% of the flushing in early spring, but its importance increases in the summer. Its contribution reached a high of 95% in June 2016.
Particle tracking was used to illustrate the variability of transport pathways and the fate of sinking particles under the different flushing scenarios. Algae simulations showed that particles could be flushed in high flush years like 2019 (and retained in low flush years like 2016), but that wind and the bay’s geometry could affect residence times. Under transient wind conditions, particles could transit out of the main channel of flow and become trapped along shorelines, where they occasionally remained until the end of June. In general, estimating the number of flushes is important for nutrient budget studies, but the particle tracking results illustrate the dynamic results. This conclusion is in line with [31], that recognized monthly variability in water age and spatial dynamics is an important factor in primary productivity rates in Lake St. Claire.
Particle movements were analyzed for two months that represented extremes of the monthly flushing: April and June 2019. Results indicated that the northern part of Big Bay and the far western end of the bay could both trap and retain particles. These results are similar to the Bay of Quinte model results for the year 2004, which showed that simulated Trent River particles reached Big Bay in 16 days before being trapped there [5]. Our study, however, showed that there was evidence that surface particles were flushed out of southern Big Bay in June 2019, contrary to the 2004 model results. Again, the dynamics of a wind-driven shallow water system mean there will be variability in particle transport. The particle transport results from the Trent River suggest that researchers should look for delayed peaks in TP load measurements in observations between Trenton and Belleville as particles move downstream.
Particle tracks from tributaries illustrate regions where individual rivers are major contributors of settling particles. In particular, the Napanee river was the main source of particles to Longreach in months with low flows. These results would be of particular interest if particulate types could be uniquely attributed to individual rivers such as the Napanee river. No such distinctions have been observed in the diversity of algae found within the bay [4]; however, a recent study of the bioavailability of particulate phosphorous (PP) has proposed sediment reflux rates for PP in Longreach, under the assumption that Napanee River is the source of the riverine sediment there [32].
There was value in using Lagrangian drifters to sample the Trent River’s flow speeds. The flow reversal on the northeastern side of the Trent River in late summer is generally neglected in discussions about the river, but it indicates an area of seasonal habitat loss for Channel Darter (Percina copelandi) (currently listed as Threatened under the Species at Risk Act), as that species tends to be found in the Trent River, in upstream areas where the flow speed is greater than 20 cm/s [33]. This flow reversal was seen to occur when the Crowe River discharges fell below 5 m3/s.
Funding
This research received no external funding.
Acknowledgments
The ECCC HRDPS data set was downloaded from the CASPaR website using the online GLOBUS file transfer service. The FVCOM mesh was based on work originally done by Felix Ouellet of ECCC.
Conflicts of Interest
The authors declare no conflict of interest.
References
- Minns, C.K.; Moore, J.E.; Seifried, K. Nutrient loads and budgets in the Bay of Quinte, Lake Ontario, 1972 to 2001. Aquat. Ecosyst. Health Manag. 2004, 14, 9–20. [Google Scholar] [CrossRef]
- Kim, D.-K.; Kaluskar, S.; Mugalingam, S.; Arhonditsis, G.B. Evaluating the relationships between watershed physiography, land use patterns, and phosphorus loading in the bay of Quinte basin, Ontario. Canada. J. Great Lakes Res. 2016, 42, 972–984. [Google Scholar] [CrossRef]
- Doan, P.T.K.; Watson, S.B.; Markovic, S.; Liang, A.; Guo, J.; Muganlingam, S.; Stokes, J.; Morley, A.; Zhhang, W.; Arhonditsis, G.B.; et al. Phosphorus retention and internal loading in the Bay of Quinte, Lake Ontario, using diagenetic modelling. Sci. Total Envrion. 2018, 636, 39–51. [Google Scholar] [CrossRef] [PubMed]
- Munawar, M.; Fitzpatrick, M.; Niblock, H.; Rozon, R.; Lorimer, J.; Kling, H. Ecology of algal blooms in the Bay of Quinte: Composition, diversity and dynamics. Aquat. Ecosyst. Health Manag. 2018, 21, 447–457. [Google Scholar] [CrossRef]
- Oveisy, A.; Boegman, L.; Rao, Y.R. A model of the three-dimensional hydrodynamics, transport and flushing in the Bay of Quinte. J. Great Lakes Res. 2015, 41, 536–548. [Google Scholar] [CrossRef]
- Shore, J.A.; Valipour, R.; Blukcacz-Richards, E.A. Twenty-eight years of hydrodynamic variability in the Bay of Quinte (ice-free periods of 1979–2006). J. Great Lakes Res. 2016, 42, 985–996. [Google Scholar] [CrossRef]
- Kim, D.-K.; Zhang, W.; Rao, Y.R.; Watson, S.; Mugalingam, S.; Labencki, T.; Dittrich, M.; Morley, A.; Arhonditsis, G.B. Improving the representation of internal nutrient recycling with phosphorus mass balance models: A case study in the Bay of Quinte, Ontario, Canada. Ecol. Model. 2013, 256, 53–68. [Google Scholar] [CrossRef]
- Zhang, W.; Kim, D.-K.; Rao, Y.R.; Watson, S.; Mugalingam, S.; Labencki, T. Can simple phosphorus mass balance models guide management decisions? A case study in the Bay of Quinte, Ontario, Canada. Ecol. Model. 2013, 24, 66–79. [Google Scholar] [CrossRef]
- Arhonditsis, G.B.; Kim, D.-K.; Shimoda, Y.; Zhang, W.; Watson, S.; Mugalingam, S.; Dittrich, M.; Geater, K.; McClure, C.; Keene, B.; et al. Integration of best management practices in the Bay of Quinte watershed with the phosphorus dynamics in the receiving waterbody: What do the models predict? Aquat. Ecosyst. Health Manag. 2017, 19, 1–18. [Google Scholar] [CrossRef]
- Chen, C.; Huang, H.; Beardsley, R.C.; Liu, H.; Zu, Q.; Cowles, G. A finite volume numerical approach for coastal ocean circulation studies: Comparisons with finite difference models. J. Geophys. Res. 2007, 112, C03018. [Google Scholar] [CrossRef]
- Bai, X.; Wang, J.; Schwab, D.J.; Yang, Y.; Luo, L.; Leshkevich, G.A.; Liu, S. Modeling 1993–2008 climatology of seasonal general circulation and thermal structure in the Great Lakes using FVCOM. Ocean Models 2013, 65, 40–63. [Google Scholar] [CrossRef]
- Mao, M.; Xia, M. Monthly and Episodic Dynamics of Summer Circulation in Lake Michigan. J. Geophys. Res. Ocean. 2020, 125, e2019JC015932. [Google Scholar] [CrossRef]
- Mason, S.A.; Daily, J.; Aleid, G. High levels of pelagic plastic pollution within the surface waters of Lakes Erie and Ontario. J. Great Lakes Res. 2020, 46, 277–288. [Google Scholar] [CrossRef]
- Minns, C.K.; Owen, G.E.; Johnson, M.G. Nutrient loads and budgets in the Bay of Quinte, Lake Ontario 1965–81. Can. Spec. Publ. Fish. Aquat. Sci. 1986, 86, 59–76. [Google Scholar]
- CaSPar. Available online: https://caspar-data.ca (accessed on 14 January 2019).
- Valipour, R.; Environment and Climate Change Canada, Burlington, ON, Canada. Personal communication, 2016.
- Tides, Current and Water Levels. Available online: https://tides.gc.ca/eng/Station/Month?sid=13988 (accessed on 30 June 2019).
- Water Level and Flow—Environment Canada. Available online: https://wateroffice.ec.gc.ca (accessed on 9 July 2019).
- Historical Climate Data—Environment and Climate Change Canada. Available online: https://climate.weather.gc.ca (accessed on 29 May 2020).
- Bathymetry of Lake Ontario—NCEI. Available online: https://www.ngdc.noaa.gov/mgg/greatlakes/ontario.html (accessed on 9 June 2014).
- Davis, R.E. Lagrangian ocean studies. Annu. Rev. Fluid Mech. 1991, 23, 43–64. [Google Scholar] [CrossRef]
- Niiler, P.P.; Paduan, J.D. Wind-driven motions in the northeast Pacific as measured by Lagrangian drifters. J. Phys. Oceanogr. 1995, 25, 2819–2830. [Google Scholar] [CrossRef] [Green Version]
- Johnson, D.; Pattiaratchi, C. Application, modelling and validation of surfzone drifters. Coast. Eng. 2004, 51, 455–471. [Google Scholar] [CrossRef]
- De Dominicis, M.; Leuzzi, G.; Monti, P.; Pinardi, N.; Poulain, P.-M. Eddy diffusivity derived from drifter data for dispersion model applications. Ocean Dyn. 2012, 62, 1381–1398. [Google Scholar] [CrossRef] [Green Version]
- Mugalingam, S.; Lower Trent Conservation Authority, Trenton, ON, Canada. Personal communication, 2018.
- Callies, U.; Groll, N.; Horstmann, J.; Kapitza, H.; Klein, H.; Massmann, S.; Schwichtenberg, F. Surface drifters in the German Bight: Model validation considering windage and Stokes drift. Ocean Sci. 2017, 13, 799–827. [Google Scholar] [CrossRef] [Green Version]
- Schwab, D.J.; Clites, A.H.; Murthy, C.R.; Sandall, J.E.; Meadows, L.A.; Meadows, G.A. The effect of wind on transport and circulation in Lake St. Clair. J. Geophys. Res. Ocean. 1989, 94, 4947–4958. [Google Scholar] [CrossRef]
- Robinson, G.W. Water quality of the Bay of Quinte, Lake Ontario, before and after reduction in phosphorus loading, Lake Ontario. Can. Spec. Publ. Fish. Aqua. Sci. 1986, 86, 50–58. [Google Scholar]
- Diamond, M.L.; Poulton, D.J.; Mackay, D.; Stride, F.A. Development of a Mass-Balance Model of the Fate of 17 Chemicals in the Bay of Quinte. J. Great Lakes Res. 1994, 20, 643–666. [Google Scholar] [CrossRef]
- Poulton, D. Heavy metals and toxic organic contaminants in effluents, water, and sediments of the Bay of Quinte, Lake Ontario. J. Great Lakes Res. 1992, 18, 390–404. [Google Scholar] [CrossRef]
- Bocaniov, S.A.; Scavia, D. Nutrient Loss Rates in Relation to Transport Time Scales in a Large Shallow Lake (Lake St. Clair, USA—Canada): Insights from a Three-Dimensional Model. Water Resour. Res. 2018, 54, 3825–3840. [Google Scholar] [CrossRef]
- Markovic, S.; Blukacz-Richards, A.E.; Dittrich, M. Speciation and bioavailability of particulate phosphorus in forested karst watersheds of southern Ontario during rain events. J. Great Lake Res. 2020, 46, 824–838. [Google Scholar] [CrossRef]
- Reid, S.M.; Brown, S.; Haxton, T.; Luce, J.; Metcalfe, B. Habitat Modelling in Support of the Recovery of Channel Darter (Percina copelandi) Populations along the Trent River, Ontario. In Fisheries and Oceans Canada, Research Document 2016/043; Fisheries and Oceans Canada: Vancouver, BC, Canada, 2016; pp. 1–15. [Google Scholar]
Figure 1.
Bathymetry of the Bay of Quinte located on the northern side of Lake Ontario (see inset; location of the Crowe River is also given in the inset (▲)). Locations of the Trent, Moira, Salmon and Napanee Rivers are marked (■). Drifter releases in 2017 at 2 sites: BB and N2; Environment and Climate Change Canada (ECCC) 2016 temperature site N1 (sites marked with ●). Location of Trenton (T) and Belleville (B) are marked.

Figure 2.
Observations of drifter speeds sampled in the Trent River from 2017 to 2019. Drifter data binned into approximate 50 m wide cross-stream bins (some bins had no drifter data).
Figure 2.
Observations of drifter speeds sampled in the Trent River from 2017 to 2019. Drifter data binned into approximate 50 m wide cross-stream bins (some bins had no drifter data).

Figure 3.
Average of observed drifters speeds (cm/s) in the fastest part of the river linearly regressed against Crowe River discharges (m3/s) (ECCC station 02HK002) as measured in 2017–2019. Cases where there was a flow reversal in the Trent River are marked in red.
Figure 3.
Average of observed drifters speeds (cm/s) in the fastest part of the river linearly regressed against Crowe River discharges (m3/s) (ECCC station 02HK002) as measured in 2017–2019. Cases where there was a flow reversal in the Trent River are marked in red.

Figure 4.
(a) Total spring volume (m3) and peak flow discharge (m3/s) and day for years 1950–2019 estimated for the Trent River, and (b) estimated Trent River discharges (m3/s) for 2016–2019 and from the Lower Trent Conservation Authority [24].
Figure 4.
(a) Total spring volume (m3) and peak flow discharge (m3/s) and day for years 1950–2019 estimated for the Trent River, and (b) estimated Trent River discharges (m3/s) for 2016–2019 and from the Lower Trent Conservation Authority [24].

Figure 5.
(a) Comparison of observed and modeled surface temperatures at Napanee (N1; Figure 1) and (b) observed drifter speeds captured at Big Bay (16 June 2017) and Napanee (24 June 2017) (BB and N2; Figure 1) compared to model speeds and model speeds adjusted by wind factor.

Figure 6.
(a) Number of flushes, (b) percentage of the number of flushes due to the Trent River, and (c) percentage flush due to the wind, in April, May and June for each year.
Figure 6.
(a) Number of flushes, (b) percentage of the number of flushes due to the Trent River, and (c) percentage flush due to the wind, in April, May and June for each year.

Figure 7.
Final particle positions on 30 June for basin-wide seedings on 1 April, May and June of each year for (a) 2016, (b) 2017, (c) 2018 and (d) 2019.
Figure 7.
Final particle positions on 30 June for basin-wide seedings on 1 April, May and June of each year for (a) 2016, (b) 2017, (c) 2018 and (d) 2019.

Figure 8.
One month of stacked particle positions for releases on (a) 1 April and (b) 1 June. Inset: initial particle positions and their assigned colors (no particles are released downstream of Line A). Net displacement of particles for (c) April and (d) June, 2019. Total distance travelled for particles for (e) April and (f) June, 2019. Tortuosity for particles for (g) April and (h) June, 2019.

Figure 9.
Trent River particle paths for 2 settling speeds tracked for the months of (a,c,e,g) April and (b,d,f,h) May in the years 2016–2019.
Figure 9.
Trent River particle paths for 2 settling speeds tracked for the months of (a,c,e,g) April and (b,d,f,h) May in the years 2016–2019.

Figure 10.
Particle paths originating from the four rivers on 1 April (a) 2016 and (b) 2019. Particles had a settling speed of 0.113 m/day and were tracked for 30 days or until they reached the bottom.
Figure 10.
Particle paths originating from the four rivers on 1 April (a) 2016 and (b) 2019. Particles had a settling speed of 0.113 m/day and were tracked for 30 days or until they reached the bottom.


Table 1.
Percent of total catchment area and average river discharge for Bay of Quinte tributaries. Total ECCC estimated discharges for April–June averaged over 2016–2019 (Trent River estimates derived following method discussed in Section 2.3).
Table 1.
Percent of total catchment area and average river discharge for Bay of Quinte tributaries. Total ECCC estimated discharges for April–June averaged over 2016–2019 (Trent River estimates derived following method discussed in Section 2.3).
| Tributary Name | % of Total Catchment Area (Total 2070 km2) | % of Average April–June Discharge (Average 433 m3/s) |
|---|---|---|
| Trent River | 80.6 | 73 |
| Moira River | 4.7 | 16 |
| Salmon River | 5.7 | 6 |
| Napanee River | 8.7 | 5 |
© 2020 by the author. Licensee MDPI, Basel, Switzerland. This article is an open access article distributed under the terms and conditions of the Creative Commons Attribution (CC BY) license (http://creativecommons.org/licenses/by/4.0/).
Share and Cite
MDPI and ACS Style
Shore, J.A. Impact of the Monthly Variability of the Trent River on the Hydrodynamical Conditions of the Bay of Quinte, Ontario: A Case Study 2016–2019. Water 2020, 12, 2683. https://doi.org/10.3390/w12102683
AMA Style
Shore JA. Impact of the Monthly Variability of the Trent River on the Hydrodynamical Conditions of the Bay of Quinte, Ontario: A Case Study 2016–2019. Water. 2020; 12(10):2683. https://doi.org/10.3390/w12102683
Chicago/Turabian StyleShore, Jennifer A. 2020. "Impact of the Monthly Variability of the Trent River on the Hydrodynamical Conditions of the Bay of Quinte, Ontario: A Case Study 2016–2019" Water 12, no. 10: 2683. https://doi.org/10.3390/w12102683
Note that from the first issue of 2016, this journal uses article numbers instead of page numbers. See further details here.