Anthropization and Climate Change: Impact on the Discharges of Forest Watersheds in Central Africa


1
Department of Geography, University of Yaounde 1, P.O. Box 755 Yaounde, Cameroon
2
International Joint Laboratory DYCOFAC, IRGM-UY1-IRD, BP 1857, Yaoundé (Cameroon) and UMR HSM, IRD-CNRS-University of Montpellier, 34090 Montpellier, France
*
Authors to whom correspondence should be addressed.
Water 2020, 12(10), 2718; https://doi.org/10.3390/w12102718
Submission received: 6 August 2020
/
Revised: 9 September 2020
/
Accepted: 15 September 2020
/
Published: 29 September 2020
(This article belongs to the Special Issue Multiscale Impacts of Anthropogenic and Climate Changes on Tropical and Mediterranean Hydrology)
Abstract
:Climate change and anthropization are major drivers of river flows variability. However, understanding their simultaneous impact on discharges is limited. As a contribution to address this limitation, the objective of this study is to assess the impact of climate change and anthropization on the discharges of two watersheds of Central Africa (Nyong and Ntem) over a recent period. For this, the hydropluviometric data of the watersheds concerned were analyzed using the Pettitt test. Similarly, the dynamics of the main land use modes (LUM) have been assessed, through classifications obtained from the processing of Landsat satellite images of the watersheds studied on two dates. The results of this study show that in Central Africa, annual discharges have decreased significantly since the 1970s, and yet the decline in annual rainfall does not become significant until the 2000s. The discharges of the rainy seasons (spring and autumn) recorded the most important changes, following variations in the rainfall patterns of the dry seasons (winter and summer) that precede them. Winters experienced a significant decrease in precipitation between the 1970s and 1990s, which caused a drop in spring flows. Their rise, which began in the 2000s, is also accompanied by an increase in spring flows, which nevertheless seems rather slight in the case of the Nyong. Conversely, between the 1970s and 1990s, there was a joint increase in summer rainfall and autumn flows. A decrease of summer rainfall was noted since the 2000s, and is also noticeable in autumn flows. Maximum flows have remained constant on the Nyong despite the slight drop in rainfall. This seems to be the consequence of changes in land use patterns (diminution of forest and increasing of impervious areas). The decrease in maximums flows noted on the Ntem could be linked to the slight drop in precipitation during the rainy seasons that generates it. Factors such as the general decrease in precipitation during the winter and the reduction in the area occupied by water bodies could justify the decrease in minimum flows observed in the two watersheds. These findings would be vital to enhance water management capabilities in the watersheds concerned and in the region. They can also give some new elements to study and understand the seasonal variation and fresh water availability in downstream, estuaries and coastal areas of the regional rivers.
1. Introduction
River flows are essentially variable over time. Their evolution is generally considered to be the result of their interactions with climate change and/or anthropization [1,2,3,4,5,6], although it is recognized that sensitivity of watercourses to these factors depends on the natural predispositions (size, slope system, type of soil, etc.) of their watersheds [7]. Apart from some interesting attempts, such as that of Dzana et al. [1], research studies in which the effects of these two factors are dissociated and evaluated separately are rare. Most of the studies undertaken thus far around the world have generally focused on one or another of these interferences, as given in the results in West Africa, South Africa, Ethiopia and even Uruguay, linking land cover change/or climate change with river discharges [8,9,10,11].
In sub-Saharan Africa, the work devoted to the research of the driving factors of the flows variability has been carried out mainly since the 1980s. Those in which the authors correlate the precipitations and the flows are based on the detection of discontinuities in the hydropluviometric series. Their results confirmed, in the case of West Africa, that the 1970s appeared as the main period of discontinuity, marking the beginning of the hydroclimatic drought in this region [12,13,14,15]. In Central Africa, the most obvious fluctuations in discharges and precipitation have been observed with seasonal time steps [16,17,18]. Liénou et al. [19] demonstrated in the case of three equatorial rivers (Ntem, Nyong and Kienke), that the most important climatic variations leading to changes in flows result from variations in precipitation in dry seasons. These authors explain the sensitivity of watersheds to this precipitation variability by the fact that their reduction induces a significant deficit in soil and groundwater storage, resulting in a decrease in the runoff. Conversely, their increase keeps the soil wetter during the dry season, and therefore, improves runoff from the start of the rainy season. It seems, therefore, that the variability of the regimes of equatorial rivers can be better appreciated when these precipitations are taken into account. Regarding the impact of anthropic action (changes in land use modes (LUM)) on runoff, reference works are generally based on supervised classifications of satellite images on at least two dates, with a view to assessing the dynamics of land use and its possible impact on flows [20,21,22,23,24,25,26]. Their results generally confirm an increase in flows resulting from an increase in Impervious Area (IA) such as buildings, roads and cultivated areas. Paturel et al. [24] specifies, in the context of a Sahelian basin in West Africa (Nakambe in Burkina-Faso), that this increase in flows is linked to the reduction in the water capacity of the soils resulting from the increase of the impervious surface. However, Dezetter et al. [27] had noted, in a humid tropical climate under forest cover (in the case of the upper Niger River basin in Guinea), an insignificant impact of the increase in agricultural areas, to the detriment of the forest, on flows. According to them, evaporation (due to the increase in temperature) from this region would have a greater impact than that of changes in LUM on the hydrological balance of this region. These conclusions follow those of a former study by Fritsch [28]. This author noted earlier in the context of small Guyanese basins, also under equatorial forest cover, a considerable impact of deforestation on runoff; however this did not last long, as after two years the runoff coefficients returned to nearly past values on surfaces where vegetation was left wild or over plantations, while the runoff remained higher over grass lands (for cattle grazing). This led Fritsch to specify that the magnitude of the hydrological changes observed in the different cases depends on the type and importance of the developments carried out in these basins, together with the impact of the inter-annual variability of natural phenomena.
Few studies have been carried out on this type of basins in forested equatorial area, and there is still a large uncertainty on what are the main drivers of the variability of the hydrological balance in equatorial basins within the context of increasing temperature due to climate change.
The Nyong and Ntem watersheds offer us the opportunity to make possible progress on this issue, as these are two basins that have been observed for decades in this equatorial area, and for which there have already been several former studies on the hydroclimatological variability, which showed some questionable issues about the origin of the observed change in the river flow regime since some decades. These watersheds are forested, but since the early 1970s, climatic fluctuations have been observed there, as in the rest of sub-Saharan Africa [19]. Moreover, their population is increasingly growing [29]. This population growth generally has as a corollary the increase in IA, which can have repercussions on the hydrological functioning of these hydrosystems. However, unlike the West African watersheds, the Nyong and Ntem basins were the subject of a very small number of works after the 2000s, due to the absence of observation data in certain cases, and significant gaps in existing observation series in other cases. Likewise, the difficulty of acquiring satellite images of sufficient quality (without cloud) for processing over large areas would have led the authors to ignore the study of the impact of anthropization (change of LUM) on discharges. Most of the studies cited above relate to West Africa, apart from those of Moffo [25] and Ebodé [26]. Despite these difficulties, it is nevertheless advisable to try to update the information available on these watersheds in the limited number of similar investigations that have focused on them before, but also to take note of certain aspects (land use) having important links with flows, which have been less studied in the region thus far, in connection with the dynamics of IA. Such a study seems fundamental for these rivers, which are among the main sources of water and fishery resources in the country, whose recent decreases are partly attributed to hydroclimatic changes. It is particularly useful in the case of Ntem, where the Memve’ele dam was recently built (in Nyabessan, downstream from Ngoazik station), with the aim of ensuring electricity production, replacing the old dam of Songloulou. It is hoped that the results of this study will reinforce the debate on the issue since the rationing in the electrical distribution of the southern Cameroon network is also generally attributed to climate change. In addition, the data and new inputs from this study would contribute to long-term planning of water demand and use, and improve future simulations of the flows of these rivers.
The main objective of this article is to assess the observed changes in streamflow of Nyong and Ntem watersheds, in response to current climate change and anthropization (land use/land cover change). For this, we propose to study long-term rainfall and discharges time series, and changes in land cover over time from satellite images. The links between rainfall and some sources of large-scale climate variability will also be checked.
2. Materials and Methods
2.1. Study Area
This study focuses on the Nyong (14,438 km2) and Ntem (19,563 km2) watersheds, respectively at Mbalmayo and Ngoazik outlets. These watersheds are located in Central Africa between latitudes 1°15′ N and 4°44′ N and longitudes 11°5′ E and 13°30′ E (Figure 1). The first is entirely included in Cameroonian territory, while the second is located between Cameroon, Gabon and Equatorial Guinea. They belong to the equatorial (Ntem) and sub-equatorial (Nyong) domains, with abundant precipitation. The annual precipitation oscillates around 1600 mm over the Nyong and 1800 mm over the Ntem, distributed over four seasons of unequal importance, including two dry and two rainy seasons (Table 1). The rainy seasons (spring and autumn) are generally very wet with record totals of around 900 mm and marked by numerous thunderstorms, which sometimes cause significant floods. The winter dry season is the only real dry season in the region, with average precipitation fluctuating around 90 mm and 180 mm, respectively, in the Nyong and Ntem watersheds (Table 1). The summer dry season tends to become more humid in the region since the 1980s [19]. The Nyong and Ntem watersheds are deeply gullied and cut into hills with convex slopes and wide marshy valleys [30]. On both sides of the main rivers, a topographic landscape in steps is observed, which seems to be the result of brittle tectonics. In the middle part of each watershed, there is a major valley (600 m above sea level on average), which represents the collapse ditch. It is a wide corridor, in the middle of which flows the main river. On the two watersheds, this unit is directly followed on each side of the main river by a large plateau with an average altitude of around 700 m, then large hills (800 m of altitude on average), which are bristling with a few inselbergs located mainly at the limit with neighboring watersheds, and whose altitude can sometimes reach 1200 m [30]. The geological substratum of these watersheds is made up of a granito-gneissic base on which ferralitic (on the tops and slopes) and hydromorphic (in the shallows) soils develop. The vegetation encountered on these basins is a dense semi-deciduous forest with Sterculiaceae and Ulmaceae strongly subjected to anthropic actions [31].
2.2. Data Collection
The data collected for this study are hydroclimatic series and spatial data (satellite images).
2.2.1. Hydroclimatic Data
Nyong discharge data series come from two sources. The gauging station, as well as the methods used for reading water levels and calculating flow rates, however, remain the same from one source to another. The series obtained from the Hydrological Research Center (CRH) cover the period 1951–1987. This center manages a hydrometric database, generally with a daily time step, which contains almost all the measurements carried out on Cameroonian territory since the early 1950s, for most stations. These measurements were carried out first by ORSTOM (Office de la Recherche Scientifique et Technique Outre-Mer/Office for Scientific Research in Overseas Territories, Paris, France) researchers, currently IRD (Institut de Recherche pour le Développement/Research Institute for Development, Marseille, France) and their predecessors from EDF (Electricité De France/France Electricity, Paris, France) and, since 1980, by CRH. No observation data is available on this river between 1988 and 1997. Indeed, after 1987, due to budgetary constraints, the hydrological service no longer guaranteed the continuity of observations. We note then the abandonment of a large number of stations observed, including those of Nyong and Ntem. Over the period 1998–2016, the series of discharges used are those of the ORE-BVET (Observatory for Environmental Research/Experimental Tropical Watersheds). Funded by the Ministry of Research and New Technologies, the National Institute of Universe Sciences, the Research Institute for Development and the Midi-Pyrénées Observatory, this observatory aims to understand the relative influence of climate variability and agriculture on water cycles and biogeochemical cycles in tropical areas. Based on long-term monitoring (>10 years) of meteorological, hydrological and geochemical variables in watersheds, it is implemented both in Cameroon and in India. In Cameroon, the observatory is interested in the Nyong watershed. The complete series of Ntem discharges comes from the CRH, and covers the period 1953–2015, but with gaps during the 1990s and 2000s. There are no observation data on this river between the intervals 1993–2001 and 2006–2009. All of the hydrological data used in this work were collected daily. The monthly, seasonal and annual modules were calculated thereafter.
The rainfall series comes from two sources. Over the period 1950–1999, the SIEREM (Système d’Informations Environnementales pour les Ressources en Eau et leur Modélisation/System of Environmental Informations on Water Resources and their Modeling) rainfall grids were used. SIEREM [32] is a database based on a generic scheme allowing the management of hydroclimatic but also environmental information on Africa. This database was developed by the HydroSciences Montpellier/HSM Laboratory, from a rainfall database (around 7000 gauging stations) from Africa, inherited among others from ORSTOM, and its experience in the management of hydroclimatic databases in the intertropical region [33,34]. Among its recovery products, SIEREM offers monthly rainfall grids over Africa for the period 1940–1999, at the 0.5° square degree, approximately 2750 km2 of the area considered [35]. The space and time steps chosen seem to be the most appropriate resolutions to be able to appreciate, at the same time, the impacts of climate change and anthropic activities on water resources [36,37]. These grids are freely accessible in ASCII and NetCDF formats on the site http://www.hydrosciences.org/spip.php?article1387. Before use, they had to be validated first by comparison with rain gauges measurements from stations.
From 2000s, the choice was made for TRMM (Tropical Rainfall Measuring Mission) 3B42 V7 rainfall estimates. The TRMM platform was launched in 1997, built jointly by the United States and Japan. It offers several pre-calibrated data sets, including the daily product TRMM 3B42 V7 at a spatial resolution of 0.25° × 0.25°. These data combine syntheses of TRMM images and other satellite data [38]. Thus, microwave sensors from AQUA, NOAA (National Oceanic and Atmospheric Administration), DMSP (Defense Meteorological Satellite Program) and visible/infrared data from geostationary satellites are taken into account in precipitation estimation algorithms. These estimates are then adjusted by incorporating the monthly climate measurements on the ground of the GPCP (Global Precipitation Climatology Project) and CAMS (Climate Assessment and Monitoring System) networks to give the monthly products TRMM 3B43. The adjustment coefficients calculated for this product are finally applied to the daily data to give the final product TRMM 3B42, version 7 [38], downloadable free of charge from the website https://giovanni.gsfc.nasa.gov, in ASCII format. The monthly TRMM rainfall data were first validated through comparisons with the SIEREM rainfall over the years of common availability (1998 and 1999). The correction factors (essentially between 1.17 and 1.4) were subsequently established for the months for which the differences between the two sources were significant (July and August).
Four climatic indices (SOI: Southern Oscillation Index; DMI: Dipole Mode Index; NATL: North Tropical Atlantic sea surface temperature indices; SATL: South Tropical Atlantic sea surface temperature indices) representative of certain sources of large-scale variability (Pacific Ocean, Indian Ocean and Atlantic Ocean), likely to influence the climate of the region [39], were used in this study (Figure 2). These indices were collected at a monthly time step on the NOAA website (https://psl.noaa.gov/data/climateindices/list/). SOI and DMI were collected at the same intervals as the rainfall. The other two indices have only been available since the beginning of the 1980s.
2.2.2. Spatial Data
The spatial data used for the study of land use in the Nyong watershed are essentially the Landsat 8 satellite images from January 2015 and Landsat MSS from March 1973. Three Landsat scenes cover the entire watershed, corresponding to the path/row 185/57, 185/58, 184/57. The same study was carried out in the Ntem watershed, using four Landsat 8 scenes from January 2015 and Landsat MSS from February 1973, corresponding to path/row 184/58, 185/58, 184/59 and 185/59. All of these images are made available to the general public free of charge by the National Aeronautics and Space Administration (NASA), via the US Geological Survey website (https://earthexplorer.usgs.gov/), in GeoTIFF format. The downloaded images taken during the winter (December to mid-March) were preferred to that of the rainy seasons because they are less affected by cloud disturbances.
2.3. Data Analysis
2.3.1. Hydroclimatic Data
The analysis of rainfall, average discharges and runoff coefficients was carried out using statistical discontinuity detection tests [40] at the significance level 95%. The Pettitt test seems to be the most suitable for the analysis of incomplete series such as ours because it separates the series only into two periods with an overall distinct behavior, which avoids the detection of false discontinuities as can sometimes be observed with other tests such as Hubert segmentation. Its choice at the expense of trend tests (Mann-Kendall test for example) is justified by the fact that it indicates a date from which the change becomes statistically significant (discontinuity), which allows a better appreciation of the variability. Its principle consists in dividing the studied series (of N size) into two sub-samples of sizes m and n, respectively. We then calculate the sum of the ranks of the elements of each sub-sample in the total sample. A statistical study is then carried out based on the two sums thus determined, then it is tested according to the hypothesis that the two subsamples do not belong to the same population. The Pettitt test is non-parametric and derives from that of Mann Whitney. The absence of a discontinuity in the series (Xi) of size N constitutes the null hypothesis. Its implementation supposes that for any instant T between 1 and N, the time series (Xi) 1 to t and t + 1 to N belong to the same population. The variable to be tested is the maximum in the absolute value of the variable Ut, N defined by:
where Dij = Sign (Xi − Xj) with: sign (x) = 1 if x > 0, 0 if x = 0 and −1 if x < 0.
If the null hypothesis is rejected, an estimate of the date of discontinuity is given by the instant defining the maximum in the absolute value of the variable Ut, N.
The correlation coefficient is the criterion used to assess the links between the rainfall indices and the climatic indices selected. Denoted by “r,” the correlation coefficient is the ratio between the covariance (γ) of two variables (X and Y) and the product of their standard deviations. It indicates the strength and direction of the linear relationship between these variables. Varying between −1 and +1, it reflects a strong correlation if it is less than −0.5 or greater than 0.5:
where denotes the covariance of the variables X and Y; and denote their standard deviations.
To assess the behavior of extreme flows, the Indicators of Hydrologic Alteration (IHA) tool, version 7.1, developed by The Nature Conservancy was used. This tool offers the possibility of comparing the parameters characterizing the flow regimes under different conditions [41]. It uses daily flow values and produces several important statistics. We will only be interested in four of them, considered essential for this study, among which the average and the coefficient of variation (Cv) of extreme flows and the Julian date of the annual minimum and maximum. By dividing the series of values in the period before and after the discontinuity, the tool calculates the change that occurred in the evolution of each of these parameters after the discontinuity. We can thus analyze not only the sign of change between the two periods but also the magnitude of this difference.
2.3.2. Spatial Data
The supervised classification by maximum likelihood of the downloaded Landsat satellite images, using SNAP software (free access), allowed to perform a diachronic analysis of the evolution of land use in the studied watersheds. This operation was preceded by operations of preprocessing and recognition of objects in the field by photography and GPS (Global Positioning System). The preprocessing of satellite images refers to all of the processes applied to raw data to correct the geometric and radiometric errors that characterize certain satellite images. These errors are generally due to the technical problems of the satellites and to the interactions between the outgoing electromagnetic radiation and atmospheric aerosols, also called “atmospheric noise.” These atmospheric disturbances are influenced by different factors that are present on the day of acquisition, including weather, fires and other human activities. They affect all the images acquired by passive satellites, including Landsat 4-5-7 and 8. The downloaded Landsat images are ortho-rectified, the preprocessing concerns the atmospheric correction of these images and their re-projection in the local system (WGS_84_UTM_Zone_32N). For this, neo-channels are created, to increase the readability of the data by enhancing certain less obvious properties in the original image, thus showing more clearly the elements of the scene. Three indices are therefore created, namely the Normalized Difference Vegetation Index (NDVI), the Brightness Index (IB) and the Normalized Difference Water Index (NDWI). These indices highlight respectively the vegetated surfaces, the sterile (not-chlorophyllin) elements such as the urban and the water bodies. Their formulas are as follows NDVI = (NIR − R)/(NIR + R); IB = (R2 + NIR2)0.5 and NDWI = (NIR − MWIR)/(NIR + MWIR), where NIR: ground reflectance of the surface in the near-infrared channel; R: ground reflectance of the surface in the red channel and MWIR: ground reflectance of the surface in the mid-wave infrared channel. Due to the fact that the watersheds studied extend over several scenes, the enhancement operations were followed by the mosaic of the different scenes used on each date. It is an operation of joining two or more adjacent images into a single image. The use of Google Earth, as well as the spaces sampled from the GPS, made it possible to identify with certainty the IA (buildings, savannas, bare soils and crops), water bodies (large rivers, lakes and ponds) and the forests (secondary, degraded, non-degraded and swampy) of each mosaic. Before the classification operation, the separability of the spectral signatures of the sampled objects to avoid interclass confusion was assessed by calculating the “transformed divergence” index. The value of this index is between 0 and 2. A value >1.8 indicates a good separability between two given classes. The different classes used in this study show good separability between them, whatever the image considered, with indices >1.9 (Table 2). The validation of the classifications obtained was carried out using the confusion matrix, which made it possible to obtain treatment details, in order to validate the choice of training plots. After validating the land use/land cover maps produced, the statistical and spatial differences of each class between the two dates were studied.
3. Results
3.1. Changes in Discharges
3.1.1. Average Discharges
The average discharges of Nyong and Ntem are analyzed through the annual and seasonal modules. The annual modules of these watercourses evolve statistically downwards (Figure 3). This decrease is accompanied by a reduction in Cv compared to the post-discontinuity period which seems negligible on the Nyong (−1%), but relatively significant on the Ntem (−8%) (Table 1). The Pettitt test shows discontinuities in the series of these rivers in 1973–74 for the Nyong and 1970–71 for the Ntem. The homogeneous sequence following this discontinuity recorded a deficit compared to the long-term average estimated at −5.6% in the first case and −8.9% in the second (Figure 3). However timidly started in the 1970s, the decrease in the annual modules of Nyong and Ntem increased considerably during the 2000s and 2010s (Table 3). These two decades are the driest of the entire observation period. The decadal deviations from the whole period average for each of them are greater than −5% whatever the watershed considered.
Regarding the discharges of the rainy seasons, a statistically significant decrease was noted in spring in both watersheds that the Pettitt test situated, in the same years as those of the annual modules. As in the annual timescale, the change in Cv of discharges for this season is slight on the Nyong (−1%), but more accentuated on the Ntem (−4%). The deficits of the periods occurring after the discontinuity are −13.6% for the Nyong and −13.1% for the Ntem (Figure 4). The decrease started since the 1970s seems to persist on the Nyong; however, on the Ntem, a considerable increase in the discharges is observed through decadal deviations. These deviations fell from −3.5% and −17.4% in the 1970s and 1980s to 0.2% in the 2010s (Table 3). In autumn, Nyong discharges decrease statistically insignificantly (Figure 4). However, there has been an important decline in them during the 2000s and 2010s, following the increase that began in the 1960s. Ntem discharges statistically decrease during this season since 1990–91 (Figure 4). This decrease is concomitant with a −4% change in Cv (Table 1). The deficit in the sequence following this discontinuity is −23% (Figure 4). The decadal deviations also show a significant decrease during the 2010s, after a long, generally wet period between the 1960s and the 1980s (Table 3).
In dry seasons, during the summer, the discharges do not change statistically over the two watersheds according to the Pettitt test, although a slight decrease is observed (Figure 4). However, a general decrease since the 1970s can be observed through the decadal deviations, which increased considerably during the 2010s (Table 3). In winter, the Pettitt test does not show any discontinuity in the Nyong discharges, although an increase in them is noted in the 2010s, after the decrease started in the 1970s (Table 3). In the Ntem Watershed, winter flows have decreased statistically and continuously since 1970−71 (Figure 4). The deficit for the post-discontinuity period is −12.8% (Figure 4). Its Cv decreases by 2% (Table 1).
3.1.2. Extreme Discharges
The extreme discharges of the Nyong and the Ntem are analyzed through the maximums and minimums discharges on consecutive days (1, 3, 7, 30 and 90).
As regards the maximums first, it should be noted that in the case of the Nyong, the post-discontinuity period (1973–74 to 2016–17) corresponds to a dry phase. However, despite its dryness, the average maximums have remained essentially constant (Table 4). A slight reduction in variability of the maximums is also noted in this period, which seems more significant in the case of shorter-term ranges (1 day to 7 days), for which the Cv oscillate from 26% before discontinuity to 23% after (Table 4). The maximums appear earlier on the Nyong after the discontinuity. Their average Julian date of observation went from 318 before the discontinuity to 309 after (Table 4).
As for the Nyong, the post-discontinuity period (1970–71 to 2015–16) is dry on the Ntem. It is characterized by a decrease in the average values of the different ranges of maximum discharges (Table 4). There are no remarkable differences between the rates of change recorded from one range to another after the discontinuity since they are all between −16.37% (for the 3-day maximum discharge) and −17.4% (for the 90-maximum discharge). The variability of these discharges ranges is modest overall but increases slightly after discontinuity. Their Cv oscillate between 22% and 24% before discontinuity, and between 29% and 32% after (Table 4). The Julian date of the maximums is early—16 days on average after the discontinuity (Table 4).
Concerning the minimum discharges, their evolution differs from that of the maximums for the Nyong. All the different ranges taken into account decreased considerably after the discontinuity, regardless of the flow duration. The rates of change recorded after the discontinuity are fairly close from one range to another, varying between −29.3% and −36.2% (Table 4). The 90-day minimum discharge is the only one for which there is a slight reduction in variability after discontinuity. For the other ranges, an increase is noted, which seems more significant for shorter-term minimums (1-day and 3-days). Their Cv went from 30% before the discontinuity to 41% after (Table 4). The minimums have occurred slightly later on the Nyong after the discontinuity. Their average Julian date of appearance increased from 61 before the discontinuity to 67 after (Table 4).
The minimum discharges of the Ntem follow the same trend as the maximums. The means of the five ranges decrease after the discontinuity. The rates of change recorded are more or less close (oscillating between −16.2% and −28.29%). However, a slight decrease in the magnitude of these changes can be noted with increasing flow duration. The decrease is greater for shorter-term minimums (1-day to 7-days). Overall, the variability is greater for shorter-term minimums. Their Cv have increased slightly after the discontinuity, while those of the longer-term minimum have decreased (Table 4). The minimums have appeared on the average 45 days earlier after the discontinuity (Table 4).
The results of this study corroborate those obtained by Liénou et al. [19] in the case of the Ntem, but differ in that of the Nyong. These authors indicated an absence of discontinuity on the Nyong annual modules between 1950s and 1990s, yet this study highlights a statistically significant decrease since 1973–74. This attests to a considerable decrease in discharges from this watershed in recent decades.
3.2. Analysis of the Main Forces Having Important Links with Discharges
3.2.1. Rainfall Variability
Annual Rainfall
The variability of annual rainfall is very moderate in the Nyong and Ntem watersheds (Table 1). A slight downward trend seems to be emerging in both cases, but the Pettitt test does not highlight any major discontinuity in their respective series (Figure 3). However, this absence of discontinuity does not necessarily imply more or fewer long dry and wet sequences in these watersheds. Analysis of the decadal deviations shows that after the slightly dry 1950s and 1960s on the Ntem, there followed three slightly wet decades, most of which had surpluses above the whole period average of around +2% (Table 3). The 1950s and 1960s were wet on the Nyong, then followed by a dry decade and two wet decades, respectively. The beginning of the 2000s marks the return of a dry period on the two watersheds, characterized by a decrease in precipitations amplified during the decade 2000 in the case of Nyong and 2010 in that of Ntem. For these decades, there are negative deviations from their average over the whole period greater than −5% (Table 3). Such deviations had never been recorded before in these watersheds.
Seasonal Rainfall
Rainfall in dry seasons changes in opposite trends (Figure 4), with an increase in summer but a decrease in winter. The Pettitt test highlights discontinuities in the respective time series of summer rainfall in Nyong and Ntem in 1964–65 and 1968–69. The resulting rates of increase from the whole period average are +5.8% and +10.5% (Figure 4). The variability of the rainfall in this season remains intact on the Nyong, while it decreases on the Ntem (Table 1). Although there has been a general increase in precipitation in these watersheds during this season since the 1960s, there is still a stabilization beginning in the 2000s, which was reinforced throughout the 2010s (Table 3).
Concerning winter rainfall, a downward discontinuity is detected in the Nyong and Ntem time series, respectively, in 1976–77 and 1977–78, with significant deficits of −16.1% and −9.7% depending on the watersheds (Figure 4). This decrease is synchronous with a change in Cv of 19% on the Nyong and 12% on the Ntem (Table 1). Though declining since the 1970s, winter precipitations seem to have increased slightly again since the beginning of the 2000s in both watersheds (Table 3).
Unlike the two dry seasons for which there are contrary trends, the rainfall of the rainy seasons (spring and autumn) show similar trends to that of the annual rainfall (Figure 4). The Pettitt test does not indicate discontinuities in their time series. There has been no continuing downward or upward trend for the entire period studied, although some dry sequences have been observed, particularly in the last three decades. The deviations observed are generally small, but slightly more pronounced in the spring, especially during the 2010s (Table 3).
Relationships between Rainfall and Some Potential Sources of Variability
The changes in precipitation described above (slight decrease in annual rainfall and rainy seasons, cross-trend evolution in dry season rainfall) motivate us to the examination of the links between the rainfall in these basins and certain relevant sources of large-scale climate variability (SOI, NATL, SATL and DMI), which may influence precipitation in the region [39]. Table 5 presents the correlations between the anomalies of the representative climatic indices of these sources of variability and those of rainfall in the basins studied at annual and seasonal time steps. This analysis shows significant correlations in the two basins between the anomalies of the NATL indices and those of rainfall during spring but also between the anomalies of these same indices and those of rainfall in winter. Important links have also been demonstrated between the rainfall anomalies of these watersheds and those of the SOI in winter.
NATL indices are negatively correlated with rainfall during spring (Table 5). This implies that warming (cooling) of the Tropical North Atlantic is associated with the low (heavy) precipitation over these watersheds during this season (Figure 5). This configuration was sometimes taken by default on the two watersheds, in particular in 1986–87, 1990–91, 1993–94, 1996–97, 2010–11, etc. Opposite signs of NATL indices and the rainfall anomalies were, however, noted for more than 70% of the years studied in each of these watersheds (Table 6).
The NATL indices, on the other hand, are positively correlated with winter rainfall (Table 5). An increase in the temperature of the Tropical North Atlantic would be concomitant with abundant rainfall in the watersheds studied during this season and conversely (Figure 5). A different situation was nevertheless observed in these watersheds in 1990–91, 1996–97, 1997–98, 2004–05, 2015–16, etc. The proportion of years for which the same sign of anomalies was observed between these two variables during winter is 62% in the Nyong basin and 61% in that of Ntem (Table 6).
As in the previous case, the SOI is positively correlated with the rainfall in the watersheds studied in winter (Table 5). This implies that a warming of the Pacific Ocean is synchronous with the generally abundant rainfall during this season (Figure 5). This situation was not, however, observed for certain years (1950–51, 1963–64, 1968–69, 1970–71, 1984–85, 1990–91, 1996–97, etc.). The percentage of years having recorded the same sign of anomalies between rainfall and SOI in winter is 54% for the Nyong and 66% for the Ntem. Correlation between rainfall and SOI anomalies is good in both watersheds in winter, but the proportion of years with the same sign of anomalies does not give enough clear information in the case of the Nyong.
The fact that winter rainfall is correlated with both the temperatures of the Tropical North Atlantic and the Pacific Ocean indicates a probable simultaneous control of these two oceans on the precipitation of the whole region during the winter.
Bogning et al. [44] recently demonstrated that an important relationship exists between the March-April-May (MAM) rainfall and the tropical Atlantic Niño. According to them, the negative temperature anomalies in the south-eastern equatorial Atlantic are at the origin of the positive anomalies of the MAM rainfall in the Ogooue watershed. The negative correlation coefficient between these two variables is high (r = −0.74). This study also highlights a relatively strong link (r = −0.52 and −0.54) between the spring rainfall of two equatorial watersheds located further north of the Equator and the temperatures of the Atlantic ocean, with the difference that the link with the rainfall of this season has been established this time with the temperatures of the Tropical North Atlantic of the same season.
3.2.2. Land Use Dynamics in the Studied Watersheds
A diachronic analysis of the classifications carried out on two dates (1973 and 2015) shows for both watersheds changes in land use marked not only by an increase in IA but also by a decrease in forests and water bodies (Figure 6). Between 1973 and 2015, forests and water bodies decreased by 6% and 42%, respectively, in the Nyong watershed. Their decreases on the Ntem between 1973 and 2015 are 1% and 32%. Between these same years, the increase in IA reached 771% in the Nyong watershed and 451% in the Ntem watershed (Table 7). Figure 6 also shows that the disappearance of the forest cover is localized around urban centers, mainly located in the west, near Ngoazik in the case of Ntem. For the Nyong, deforestation is certainly continuous throughout the watershed, but the change is more significant in the west, with the important boom in the city of Yaoundé, not far from Mbalmayo.
3.3. The Impacts of Environmental Forces on the Discharges
3.3.1. Rainfall
The impact of rainfall is perceptible in the evolution of flows. In general, the annual precipitation of the two watersheds studied does not decrease significantly, while the flows register downwards discontinuities during the 1970s. The stationarity of the hydrological regime and that of the precipitations of the watersheds at this time step thus departs from the general logic, which admits that hydrological discontinuities occur following rainfall discontinuities. However, for both watersheds, the analysis of the decadal deviations from the long-term average of the two compared variables shows a synchronous evolution between them over the last two decades. For the latter, there is a concomitant decrease in rainfall and flows (Table 3).
During the rainy seasons, primarily in the spring, precipitation has changed moderately, so that no sudden mean inflexion point has been detected in their series. In return, the discharges and the runoff coefficients for this season have decreased significantly since the 1970s. Similarly, the examination of the deviations from the mean of these variables generally shows significant decreases for the discharges and the runoff coefficients, while the rainfall does not decrease or decreases very slightly (Table 3). The decline in winter rainfall since the 1970s appears to be closely related in amplitude to that of spring flows. Although the correlations between them are not significant (r < 0.32 on both catchments), the rhythm of evolution of these two variables over the decades is fairly constant. This is observed during the 2010s, for which a small drop in winter rainfall led to a similar evolution in spring runoff coefficients and discharges (Table 3). This influence of winter precipitation has already been suggested by Liénou et al. [19]. These authors wrote that from the 1970s, the decrease in winter rainfall created a greater water deficit (evaporation and soil water reserve) in the watershed area at the start of the first rainy season in spring. This aridification of winter means that a greater part of the precipitation received during the spring first contributes to filling this water deficit, and therefore, the fraction that generates runoff is reduced. This then translates into lower runoff volumes for the same average depths of precipitation during spring, which explains the drop in the runoff coefficient (Figure 4).
In autumn, rainfall and flows decrease very slightly over the entire study period. However, between the 1970s and 1980s, flows and runoff coefficients increased, while the rainfall did not vary much overall. This increase would be due to the increase in summer rainfall. The impact of Summer rainfall on autumn flows is more noticeable during the 2000s and 2010s, for which there is a joint decrease in summer rainfall, discharges and runoff coefficients of autumn, despite a sometimes-negligible variation in autumn rainfall in the different watersheds (Table 3). In view of these developments, it appears that the increase in summer rainfall during the decades from 1970 to 1990 considerably reduces the deficit of evaporation and soil water reserves at the beginning of the autumn, favoring runoff [19]. The part of the precipitation that actually participates in the runoff increases, hence, there is an increase in the autumn runoff coefficient during these decades (Table 3). The decrease in summer rainfall during the 2000s and 2010s has the opposite effect, which is why there has been a reduction in runoff coefficients during these decades, responsible for a decrease in discharges. This is all the more probable since the analysis of the average monthly flows shows that the variations of the summer rainfall are generally felt more on the flows of the first month (September) of autumn. The model developed for this purpose is significant, with a fairly correct quality of fit (r > 0.6) on the two basins (Figure 7). It could be used to predict fairly accurately the runoff in early autumn (September) based on the rainfall recorded during the summer.
In the summer, we notice that rainfall increases statistically, while flows evolve according to varying magnitudes downwards. These opposite trends could be explained by the fact that the summer flows are partly linked to the volumes precipitated during the spring, which occurs just before, even if the correlation between them is not significant (r < 0.35 on both basins). This is why we can note, in the evolution of summer flows, dry decades even when the rainfall was abundant. This was the case in the 1980s, when there was a surplus above average for the summer rainfall, but shortages for both the spring rainfall and the summer flows. However, the variations in summer precipitation themselves seem to also be related to the flows in the season. They participate in the event of a moderate evolution of the spring rainfall, in the maintenance of flows in some cases, or in their reduction in others. This last scenario is observed during the 2010s, where spring rainfall did not vary considerably, but where a decrease in summer rainfall is concomitant with a decrease in flows in the different watersheds (Table 3).
In winter, precipitation and flows decrease according to different magnitudes. The stationarity of these two variables does not reveal an apparent link in the case of Nyong. Additionally, the correlations between them are weak (r < 0.39). However, the analysis of the deviations from the average shows clearer links between these variables, since the beginning of the drought started during the 1970s in these two watersheds (Table 3). The succession of deficit rainfall sequences that were observed between the 1970s and 1990s also led to deficits in terms of flows. Similarly, the resumption of rainfall observed during the 2000s caused an upsurge in the flows, which was interrupted again in the two watersheds studied during the 2010s, following the relapse of the rainfall (Table 3).
Several common and divergent points can be noted in the evolution of rainfall and its impact on discharges during the different seasons in the two studied watersheds. Spring discharges have decreased since the beginning of the 1970s, more markedly for the Ntem in the South of Cameroon close to the Equator, while rainfall has not decreased significantly, even though since 2005, several years of slightly weaker spring rainfall have been recorded. In summer there is a net increase in rainfall in the two watersheds from the early 1980s to the late 2000s, then a return to less abundant rainfall. Summer discharges do not seem to follow a variation related to this variability in rainfall. In autumn the rainfall does not drop on the Ntem, except for a few years of less abundance during the most recent decades, while for the Nyong the rainfall has decreased slightly and fairly regularly since the end of the 1980s. Diminution in these watersheds would result from their respective belonging to the equatorial (Ntem) and sub-equatorial (Nyong) domain, which is already at the origin of the significant differences on the duration of each season on these. The discharges seem to have decreased slightly for the Nyong, since the 1990s, in apparent link with the slight decrease of the rainfall, while the discharges of the Ntem seem to decrease also since the middle of the 1990s, without the rainfall having decreased significantly. It should be noted that the period of the possible change in discharges also corresponds to a period of significant gaps in discharge data series, which does not allow great significance for these analyses. In winter the series of rainfall of the two watersheds show a discontinuity in 1976–77, which separates the wet period from the recent drier period. Although during the 2000s the rainfall became close to the totals for the wet period, the discharges of the two rivers followed the same variation, with values generally lower after 1970—even in the 2000s, when the rainfall apparently increased.
The results, obtained in this study from recent data, corroborate the first observations of change in the hydrological regime in the region [19]. These changes attest to the visible and lasting impact of a change in the rainfall regime which began in the late 1970s, and which have major repercussions on hydrological regimes and the seasonal availability of surface water resources.
3.3.2. Changes in Land Use Patterns
The changes in land use patterns seem to have more or less significant links with certain hydrological modifications observed. The slightly early arrival of the maximum noted at the outlets of the two watersheds (Table 4), in a context where rainfall is decreasing slightly, seems to be related to the increase in IA (+771% for the Nyong and +451% for the Ntem) and the diminution in forests (−6% for the Nyong and −1% for the Ntem). These changes could reduce the time it takes for the maximums to appear by increasing the runoff they cause. The stability observed for the Nyong maximums after the discontinuity (Table 4) could also be a consequence of these same developments. Indeed, in a context where the rainy seasons rainfall, which generate the maximum flows, decrease, the most logical would have been to see the maximums decrease, which is, however, not the case. The current modest urbanization rate in this watershed seems to be the most relevant factor to justify this lack of observed trend. In this case, the decrease in precipitation appears to have been offset by the increased runoff. The annual runoff coefficients of this watershed have increased significantly since the 1980s (Table 3), following an accelerated urbanization phase in the western part of this watershed (Yaoundé region) over the 1980s and 1990s, following the subdivision operations undertaken since the end of the 1970s by the municipal authorities [45]. The decrease in the water bodies noted could have contributed to that of the minima in the two watersheds. When there are in large number, water bodies contribute to the supply of rivers during low water periods and contribute to the maintenance of low flows [46]. However, otherwise, their support for the flows decreases, which causes a decrease in minimum flows.
The impact of the increase in the IA on runoff has already been demonstrated in other forest environments (South America), particularly in the cases of certain watercourses such as the Amazon [47], Upper Xingu [48] and Parana [49]. The discharges of these watercourses have indeed increased, following a reduction in the forest area of their watersheds, which seem relatively greater than that observed in the Nyong and Ntem watersheds. The rate of deforestation in the entire Amazon basin, for example, reaches 30% [47].
Certainly, there is reason to wonder whether such small changes in land use could cause changes in extreme flows as visible as those observed in the watersheds investigated. Since the evolution of these extremes does not agree with other phenomena that have a proven impact on flows, in this case the decrease in precipitation highlighted in this study and the rise in temperatures postulated by Sighomnou [50] and Amougou et al. [51] in the region, which act rather in the direction of a reduction in flows and a late observation of the maximums, it seems appropriate to think that the changes in land use, although modest overall, might be the main cause of these evolutions. Their action on flows could have been considerably amplified by their location in the watersheds (to the west part, near the outlets of the watersheds studied), which would favor the rapid routing of rainwater bodies with the least possible losses to the outlets, thereby erasing the size and forest cover effect of these watersheds. If this situation persists, there is every reason to believe that there will be an increase in maximum flows in the Nyong within a few years, despite the decrease in precipitation.
To be complete, a further study should also analyze the evolution of daily rainfall and dry days within the rainy season, and even the possible changes in the frequency and intensity of rainfall events, which may have significant impact on runoff, as is the case in the Sahel, for instance [52].
4. Discussion: Analysis of Results in the Regional Context
The results of this study have several points in common with similar studies already carried out in Central and West Africa. This study highlights a slight decrease in annual rainfall in the watersheds of Central Africa, rainy seasons and significant changes, but in opposite phases of rainfall in the dry seasons (decrease for winter and increase for summer). The same observation has already been made in other studies carried out in the equatorial region [19]. Discontinuities marking a drop in discharges were highlighted in this study through statistical tests. This corroborates other studies in the region in which the authors have reported discontinuities in the hydrological time series of the Ntem in 1970 [19] and the Ogooue in 1977 [53]. The variability of the flows highlighted for these rivers on a seasonal level reveals a different evolution from the spring and autumn floods. Spring floods decrease significantly compared to those of autumn, which vary little overall. Similar changes have been highlighted by Mahé et al. [42] on Ogooue and Kouilou. In general, this decrease in spring and autumn floods in the equatorial zone is associated with a decrease in rainfall during these seasons which would itself result, not only from anomalies in ocean surface temperatures [54,55,56], but also local zonal wind anomalies [55,56].
This study reveals changes in land use patterns over time in studied watersheds, which are mainly marked by a decrease in forest and water bodies, and conversely an increase in IA (built, bare soil and agricultural areas). Similar observations had already been made by other authors in Central [26] and West Africa [57,58,59]. One of the main results of this work reveals that the observed deforestation is greater around urban centers. The same remark was made in Niger by Amogu et al. [23]. They claim in their study that the capital Niamey and its surroundings have experienced more deforestation than the rest of the study area. They add that the causes of this deforestation are essentially linked to the cutting of wood for domestic use.
A few studies in Central Africa [25,26] and several in West Africa [21,22,23,24,60] have shown an increase in average discharges, following an increase in IA in the watersheds of certain rivers. This is not the case in this work. Despite the increase in IA, average discharges remain low. This could be linked to the size of the catchments, but also their large forest cover. However, Li et al. [61] stated in their study that IA could not influence the flow rates of a watershed until it reached 50% of its total area. This may be in disagreement with the observation made in this study. Urbanized areas occupy less than 10% of the total surface of the studied watersheds, but their probable effects are still perceptible on extreme flows. The proximity of land-use changes to the outlets of that watersheds could explain the impact of such modest urbanization rates on flows. As ground observations data are sparse and mostly lacking for many rivers in the region, further improvements could come from satellite derived data like for the Ogooue [44] and from a better and exhaustive track of human sources of water abstraction as in the case of the Logone River in Central Africa [62].
5. Conclusions
In this paper we studied the possible impact of climate change and anthropization on river flows of two basins of Central Africa (Nyong and Ntem in South Cameroon), from long-term rainfall and discharges time series and changes in land cover over time from satellite images. Considering the rainfall, the 1970s and 1980s marked the start of a major change in the rainfall pattern during the dry seasons in Central Africa, characterized by an increase in rainfall totals in summer and a decrease in winter. These changes, which prevailed until the end of the 1990s, led to a change in the flows of the rainy seasons that directly follow them. Thus, there has been an increase in autumn flows and a drop in winter flows over the same period. The beginning of the 2000s was marked by a reversal of trends. In the more recent years, there is now a significant drop in rainfall in summer accompanied by a decrease in autumn flows, and conversely, an increase in winter rainfall concomitant with an increase in spring flows, which nevertheless seems rather small on the Nyong. The combined effect of the decrease in rainfall (−16% for Nyong and −8% for Ntem) during the winter and water bodies (−42% in the case of Nyong and −20% in that of Ntem) are the most relevant elements that can be associated to the decreases observed in minimum flows. Considering the survey of the land cover change, the increase of 771% in IA to the detriment of the forest seems to have contributed to the maintenance of maximum flows in the Nyong watersheds, although in a context marked by a deficit in rainfall. Such changes favor an accentuation of the runoff, which modifies the rhythm of the flows, especially those of short duration. This particular aspect could be further investigated by studying the changes in daily rainfall. Eventually, the fluctuations of the average discharges of the rivers of Central Africa depend for the moment mainly on rainfall; however, those of the extreme flows are the result of the combined effect of the two forces analyzed (precipitation and anthropization).
Author Contributions
Conceptualization: V.B.E., G.M., J.G.D. and J.A.A.; methodology: J.G.D., J.A.A. and G.M.; software: V.B.E.; validation: G.M., J.G.D. and J.A.A.; formal analysis: V.B.E. and G.M.; investigation: V.B.E.; data curation V.B.E.; writing—original draft preparation: V.B.E. and G.M.; writing—review and editing: V.B.E. and G.M.; project administration: G.M.; funding acquisition: G.M. All authors have read and agreed to the published version of the manuscript.
Funding
This research received no external funding.
Acknowledgments
The authors wish to thank the Cameroonians authorities and national services of Meteorology and Hydrology, for providing data to the Joint International Laboratory (LMI) DYCOFAC. The authors also thank the National Observing System M-TROPICS (Multiscale TROPIcal CatchmentS) from France, which subsidizes observations in experimental tropical watersheds. The authors warmly thanks the agents of the IRD (Research Institute for Developping countries) Représentation in Cameroon and to the direction of the LMI DYCOFAC, at Yaounde, for their administrative and financial support. The authors also wish to address a memoriam to Ms. Claudine Dieulin, from the IRD, who passed away late January, and who spent years in developing the open-source database HSM-SIEREM, dedicated to the African hydrology and climatology, and which data have been used partly in this study.
Conflicts of Interest
The authors declare no conflict of interest.
References
- Dzana, J.G.; Ndam, N.J.R.; Tchawa, P. The Sanaga discharge at Edea catchment outlet (Cameroon): An example of tropical rain-fed river system to change in precipitation and groundwater input and to flow regulation. River Res. Appl. 2010, 27, 754–771. [Google Scholar] [CrossRef]
- Chu, M.L.; Knouft, J.H.; Ghulam, A.; Guzman, J.A.; Pan, Z. Impacts of urbanization on river flow frequency: A controlled experimental modeling-based evaluation approach. J. Hydrol. 2013, 495, 1–12. [Google Scholar] [CrossRef]
- Rosburg, T.T.; Nelson, P.A.; Bledsoe, B.P. Effects of urbanization on flow duration and stream flashiness: A case study of Puget sound stream, Western Washington, USA. JAWRA J. Am. Water Resour. Assoc. 2017, 53, 493–507. [Google Scholar] [CrossRef]
- Aulenbach, B.T.; Landers, M.N.; Musser, J.W.; Painter, J.A. Effects of impervious area and BMP implementation and design on storm runoff and water quality on eight small watersheds. JAWRA J. Am. Water Resour. Assoc. 2017, 53, 382–399. [Google Scholar] [CrossRef]
- Diem, J.E.; Hill, T.C.; Milligan, R.A. Diverse multi-decadal changes in streamflow within a rapidly urbanizing region. J. Hydrol. 2018, 556, 61–71. [Google Scholar] [CrossRef]
- Oudin, L.; Salavati, B.; Furusho-Percot, C.; Ribstein, P.; Saadi, M. Hydrological impacts of urbanization at the catchment Scale. J. Hydrol. 2018, 559, 774–786. [Google Scholar] [CrossRef] [Green Version]
- Gibson, C.A.; Meyer, J.L.; Poff, L.E.; Georgakakos, A. Flow regime alterations under changing climate in two river basins: Implications for freshwater ecosystems. River Res. Appl. 2005, 21, 849–864. [Google Scholar] [CrossRef]
- Yira, Y.; Diekkrüger, B.; Steup, G.; Aymar, Y.B. Impact of climate change on hydrological conditions in a tropical West African catchment using an ensemble of climate simulations. Hydrol. Earth Syst. Sci. 2017, 21, 2143–2161. [Google Scholar] [CrossRef] [Green Version]
- Namugize, J.N.; Jewitt, J.; Graham, M. Effects of land use and land cover changes on water quality in the Umngeni river catchment, South Africa. Phys. Chem. Earth Parts A/B/C 2018, 105, 247–264. [Google Scholar] [CrossRef]
- Gorgoglione, A.; Gregorio, J.; Rios, A.; Alonso, J.; Chreties, C.; Fossati, M. Influence of land use/land cover on surface-water quality of Santa Lucìa river, Uruguay. Sustainability 2020, 12, 4692. [Google Scholar] [CrossRef]
- Getahun, Y.S.; Li, M.H.; Chen, P.Y. Assessing impact of climate change on hydrology of Melka Kuntrie Subbasin, Ethiopia with Ar4 and Ar5 projections. Water 2020, 12, 1308. [Google Scholar] [CrossRef]
- Olivry, J.C.; Bricquet, J.P.; Mahé, G. Vers un appauvrissement durable des ressources en eau de l’Afrique humide. In Hydrology of Warm Humid Regions, 4ème Assemblée IAHS, Yokohama, Japon, 13-15 Juillet 1993; Gladwell, J.S., Ed.; IAHS Press: Wallingford, UK, 1993; pp. 67–78. [Google Scholar]
- Bricquet, J.P.; Bamba, F.; Mahé, G.; Touré, M.; Olivry, J.C. Evolution récente des ressources en eau de l’Afrique atlantique. Rev. des Sci. L’eau 2005, 10, 321–337. [Google Scholar] [CrossRef] [Green Version]
- Servat, E.; Paturel, J.E.; Lubès-Niel, H.; Kouamé, B.; Masson, J.M.; Travaglio, M.; Marieu, B. De différents aspects de la variabilité de la pluviométrie en Afrique de l’Ouest et Centrale. Rev. des Sci. L’eau 2005, 12, 363–387. [Google Scholar] [CrossRef] [Green Version]
- Mahé, G.; L’Hôte, Y.; Olivry, J.C.; Wotling, G. Trends and discontinuities in regional rainfall of West and Central Africa—1951–1989. Hydrol. Sci. J. 2001, 46, 211–226. [Google Scholar] [CrossRef]
- Buisson, A. La grande saison sèche 1985 au Gabon. Situation climatique en Afrique intertropicale. La Météorologie 1985, 15, 5–13. [Google Scholar]
- Mahé, G.; Lerique, J.; Olivry, J.C. L’Ogooué au Gabon. Reconstitution des débits manquants et mise en évidence de variations climatiques à l’équateur. Hydrol. Cont. 1990, 5, 105–124. [Google Scholar]
- Bigot, S.; Moron, V.; Melice, J.L.; Servat, E.; Paturel, J.E. Fluctuations pluviométriques et analyse fréquentielle de la pluviosité en Afrique centrale. In Water Ressources Variability in Africa during the XXth Century, Abidjan, Côte d’ivoire, Novembre 1998; Servat, E., Hughes, D., Fritsch, J.M., Hulme, M., Eds.; IAHS Press: Wallingford, UK, 1998; pp. 71–78. [Google Scholar]
- Lienou, G.; Mahé, G.; Paturel, J.E.; Servat, E.; Sighomnou, D.; Ekodeck, G.E.; Dezetter, A.; Dieulin, C. Evolution des régimes hydrologiques en région équatoriale camerounaise: Un impact de la variabilité climatique en zone équatoriale? Hydrol. Sci. J. 2008, 53, 789–801. [Google Scholar] [CrossRef]
- Kouassi, A. Caractérisation d’une Modification Eventuelle de la Relation Pluie-Débit et ses Impacts Sur Les Ressources en eau en Afrique de l’Ouest: Cas du Bassin Versant du N’zi (Bandama) en Côte d’Ivoire. Ph.D. Thesis, Université de Cocody, Abidjan, Côte d’ivoire, 2007. [Google Scholar]
- Souley, Y.K. L’evolution De L’occupation Des Sols A L’echelle Des Bassins Versants De Wankama Et Tondi Kiboro: Quelles Consequences Sur Les Debits Et L’evapotranspiration Reelle (Etr). Master Thesis, Université Abdou Moumouni, Niamey, Niger, 2008. [Google Scholar]
- Leblanc, M.; Favreau, G.; Massuel, S.; Tweed, S.; Loireau, M.; Cappelaere, B. Land clearance and hydrological change in the Sahel: South-west Niger. Glob. Planet. Chang. 2008, 61, 49–62. [Google Scholar] [CrossRef]
- Amogu, O.; Descroix, L.; Yéro, K.S.; Le Breton, É; Mamadou, I.; Ali, A.; Vischel, T.; Bader, J.-C.; Moussa, I.B.; Gautier, E.; et al. Increasing river flows in Sahel? Water 2010, 2, 170–199. [Google Scholar] [CrossRef] [Green Version]
- Paturel, J.E.; Mahé, G.; Diello, P.; Barbier, B.; Dezetter, A.; Dieulin, C.; Karambiri, H.; Yacouba, H.; Maiga, A. Using land cover changes and demographic data to improve hydrological modeling in the Sahel. Hydrol. Process. 2017, 31, 811–824. [Google Scholar] [CrossRef] [Green Version]
- Moffo, Z.M. Contribution Des Systemes D’information Geographiques Pour La Cartographie Des Zones A Risques A Yaounde: Application Au Bassin Du Mfoundi. Master’s Thesis, Université de Yaoundé I, Yaounde, Cameroon, 2011. [Google Scholar]
- Ebodé, V.B. Etude De La Variabilite Hydroclimatique Dans Un Bassin Versant Forestier En Voie D’urbanisation Acceleree: Le Cas De La Mefou. Master’s, Université de Yaoundé I, Yaounde, Cameroun, 2017. Master’s Thesis, Université de Yaoundé I, Yaounde, Cameroun, 2017. [Google Scholar]
- Dezetter, A.; Paturel, J.E.; Ruelland, D.; Ardoin-Bardin, S.; Ferry, L.; Mahé, G.; Dieulin, C.; Servat, E. Prise en compte des variabilités spatio-temporelles de la pluie et de l’occupation du sol dans la modélisation semi-spatialisée des ressources en eau du haut fleuve Niger. In Global Change: Facing Risks and Threats to Water Resources, Proceedings of the Sixth World FRIEND Conference, Fez, Morocco, 25–29 October 2010; IAHS Press: Wallingford UK, 2010; pp. 544–552. [Google Scholar]
- Fritsch, J.M. Les Effets Du Defrichement De La Foret Amazonienne Et De La Mise En Culture Sur L’hydrologie De Petits Bassins Versants. Ph.D. Thesis, Université de Montpellier II, Montpellier, France, 1990. [Google Scholar]
- BUCREP. Rapport de présentation des résultats définitifs du recensement de la population en 2005; BUCREP: Yaoundé, Cameroun, 2011. [Google Scholar]
- Olivry, J.C. Fleuves et Rivieres du Cameroun; MESRES-ORSTOM: Paris, France, 1986. [Google Scholar]
- Letouzey, R. Notice de la Carte Phytogéographique du Cameroun au 1/500000; Institut de la carte internationale de la végétation: Toulouse, France, 1985. [Google Scholar]
- Boyer, J.F.; Dieulin, C.; Rouché, N.; Crès, A.; Servat, E.; Paturel, J.E.; Mahé, G. SIEREM: An environmental information system for water resources. In Water Resource Variability–Hydrological Impacts, Proceedings of the Fifth FRIEND World Conference, Havana, Cuba, 26 November 2006; IAHS Press: Wallingford, UK, 2006; pp. 19–25. [Google Scholar]
- Rouché, N.; Mahé, G.; Ardoin-Bardin, S.; Brissaud, B.; Boyer, J.F.; Crès, A.; Dieulin, C.; Bardin, G.; Commelard, G.; Dezetter, A.; et al. Constitution d’une grille de pluies mensuelles pour l’Afrique (période 1900-2000). Sécheresse 2010, 21, 336–338. [Google Scholar] [CrossRef]
- Paturel, J.E.; Boubacar, I.; L’Aour, A.; Mahé, G. Analyses de grilles pluviométriques et principaux traits des changements survenus au 20ème siècle en Afrique de l’Ouest et Centrale. Hydrol. Sci. J. 2010, 55, 1281–1288. [Google Scholar] [CrossRef] [Green Version]
- Dieulin, C.; Mahé, G.; Paturel, J.E.; Ejjiyar, S.; Tramblay, Y.; Rouché, N.; Mansouri, B.E. A new 60-year monthly-gridded rainfall data set for Africa. Water 2019, 11, 387. [Google Scholar] [CrossRef] [Green Version]
- Gleick, P.H. Methods for evaluating the regional hydrologic impacts of global climatic changes. J. Hydrol. 1986, 88, 97–116. [Google Scholar] [CrossRef]
- Arnell, N.W.; Reynards, N.S. The effects of climate change due to global warming on river flows in Great Britain. J. Hydrol. 1996, 183, 397–424. [Google Scholar] [CrossRef]
- Huffman, G.J.; Adler, R.F.; Bolvin, D.T.; Gu, G.; Nelkin, E.J.; Bowman, K.P.; Hong, Y.; Stocker, E.F.; Wolff, D.B. The TRMM Multisatellite Precipitation Analysis (TMPA): Quasi-Global, Multiyear, Combined-Sensor Precipitation Estimates at Fine Scales. J. Hydrom. 2007, 8, 38–55. [Google Scholar] [CrossRef]
- Bush, E.R.; Jeffery, K.; Bunnefeld, N.; Tutin, C.; Musgrave, R.; Moussavou, G.; Mihindou, V.; Malhi, Y.; Lehmann, D.; Edzang, N.J.; et al. Rare ground data confirm significant warming and drying in western equatorial Africa. PeerJ 2020, 8, e8732. [Google Scholar] [CrossRef] [Green Version]
- Lubès, H.; Masson, J.M.; Servat, E.; Paturel, J.E.; Kouame, B.; Boyer, J.F. Caractérisation des fluctuations dans une série chronologique par applications de tests statistiques. Etudes bibliographiques; Programme ICCARE, Rapport n3. ORSTOM: Montpellier, France, 1994. [Google Scholar]
- Richter, B.D.; Baumgartner, J.V.; Braun, D.P.; Powell, J. A spatial assessment of hydrologic alteration within river network. Regul. Rivers Res. Mgmt. 1998, 39, 329–340. [Google Scholar] [CrossRef]
- Mahé, G.; Lienou, G.; Descroix, L.; Bamba, F.; Paturel, J.E.; Laraque, A.; Meddi, M.; Habaieb, H.; Adegea, O.; Dieulin, C.; et al. The rivers of Africa: Witness of climate change and the human impact on the environment. Hydrol. Process. 2013, 27, 2105–2114. [Google Scholar] [CrossRef]
- Tsalefac, M.; Hiol Hiol, F.; Mahe, G.; Laraque, A.; Sonwa, D.; Sholte, P.; Pokam, W.; Haensler, A.; Beyene, T.; Ludwig, F.; et al. Climate of Central Africa: Past, present and future. In The Forests of the Congo Basin. Forests and Climate Change; De Wasseige, C., Tadoum, M., Eba’a, A.R., Doumenge, C., Eds.; Weyrich: Neufchâteau, Belgium, 2015; Volume 2, pp. 37–52. [Google Scholar]
- Bogning, S.; Frappart, F.; Paris, A.; Blarel, F.; Ninõ, F.; Picart, S.S.; Lanet, P.; Seyler, F.; Mahé, G.; Onguene, R.; et al. Hydro-climatology study of the Ogooué River basin using hydrological modeling and satellite altimetry. Adv. Space Res. 2020. [Google Scholar] [CrossRef]
- Dzana, J.G.; Amougou, J.A.; Onana, V. Modélisation spatiale des facteurs d’aggravation des écoulements liquides à Yaoundé. Application au bassin versant d’Akë. Mosella 2004, 29, 78–91. [Google Scholar]
- Tardif, S. Regionalisation Et Facteurs De La Variabilite Spatiale Des Debits Saisonniers Et Extremes Journaliers Au Quebec Meridional. Master’s Thesis, Université du Québec, Québec, Canada, 2005. [Google Scholar]
- Coe, M.T.; Costa, M.H.; Soares-Filho, B.S. The influence of historical and potential future deforestation on the streamflow of the Amazon river—Land surface processes and atmospheric feedbacks. J. Hydrol. 2009, 369, 165–1774. [Google Scholar] [CrossRef]
- Dias, L.C.; Macedo, M.N.; Costa, M.H.; Coe, M.T.; Neil, C. Effects of land cover change on evapotranspiration and streamflow of small catchments in the Upper Xingu river basin, Central Brazil. J. Hydrol. 2015, 4, 108–122. [Google Scholar] [CrossRef] [Green Version]
- Lee, E.; Livino, A.; Han, S.C.; Zhang, K.; Briscoe, J.; Kelman, J.; Moorcroft, P. Land cover change explains the increasing discharge of the Paraná river. Reg. Env. Chang. 2018, 18, 1871–1881. [Google Scholar] [CrossRef] [Green Version]
- Sighomnou, D. Analyse Et Redefinition Des Regimes Climatiques Et Hydrologiques Du Cameroun: Perspectives D’evolution Des Ressources En Eau. Ph.D. Thesis, Université de Yaoundé I, Yaoundé, Cameroun, 2004. [Google Scholar]
- Amougou, J.A.; Ndam, N.J.R.; Djocgoue, P.F.; Bessoh, B.S. Variabilité climatique et régime hydrologique dans un milieu bioclimatique de transition: Cas du bassin fluvial de la Sanaga. Afr. Sci. 2015, 11. Available online: https://www.semanticscholar.org/paper/Variabilit%C3%A9-climatique-et-r%C3%A9gime-hydrologique-dans-Amougou-Ngoupayou/614a4602790ca1b9c87683c0bb1234ffdbfd7551 (accessed on 15 September 2020).
- Panthou, G.; Lebel, T.; Vishel, T.; Quantin, G.; Sane, Y.; Ba, A.; Ndiaye, O.; Diongue-Niang, A.; Diopkane, M. Rainfall intensification in tropical semi-arid regions: The Sahelian case. Environ. Res. Lett. 2018, 13. [Google Scholar] [CrossRef]
- Conway, D.P.; Persechino, A.; Ardoin–Bardin, S.; Hamandawana, H.; Dieulin, C.; Mahé, G. Rainfall and river flow variability in sub-saharan Africa during the 20th century. J. Hydrom. 2009, 10, 41–59. [Google Scholar] [CrossRef]
- Mahé, G.; Citeau, J. Interactions between the Ocean, Atmosphere and Continent in Africa, Related to the Atlantic Monsoon Flow: General Pattern and the 1984 Case Study. Veille Clim. Satell. 1993, 44, 34–54. [Google Scholar]
- Nicholson, E.N.; Dezfuli, A.K. The relationship of rainfall variability in western equatorial Africa to the tropical oceans and atmospheric circulation. Part I: The boreal Spring. J. Clim. 2013, 26, 45–65. [Google Scholar] [CrossRef]
- Nicholson, E.N.; Dezfuli, A.K. The relationship of rainfall variability in western equatorial Africa to the tropical oceans and atmospheric circulation. Part II: The boreal Autumn. J. Clim. 2013, 26, 66–84. [Google Scholar] [CrossRef]
- Mahé, G.; Leduc, C.; Amani, A.; Paturel, J.E.; Girard, S.; Servat, E.; Dezetter, A. Augmentation récente du ruissellement de surface en région soudano-sahélienne et impact sur les ressources en eau. In Hydrology of the Mediterranean and Semiarid Regions; Servat, E., Najem, W., Leduc, C., Shakeel, A., Eds.; IAHS Press: Wallingford, UK, 2003; pp. 215–222. [Google Scholar]
- Kergoat, L.; Hiernaux, P.; Baup, F.; Boulain, N.; Cappelaere, B.; Cohard, J.M.; Descroix, L.; Galle, S.; Guilbert, S.; Guichard, F.; et al. Land surface in AMMA Extending Ecosystem, Energy and Water Balance Studies in Space and Time is Some-Times Surprising. In Proceedings of the 2nd International Conference of AMMA Program, Karlsruhe, Germany, 26–30 November 2007. [Google Scholar]
- D’Orgeval, T.; Polcher, J. Impacts of precipitation events and land-use changes on West African river discharges during the years 1951–2000. Clim. Dyn. 2008, 31, 249–262. [Google Scholar] [CrossRef]
- Mahé, G.; Olivry, J.C.; Servat, E. Sensibilité des cours d’eau ouest-africains aux changements climatiques et environnementaux: Extrêmes et paradoxes. In Regional Hydrological Impacts of Climatic Change—Hydroclimatic Variability, Proceedings of symposium S6 held during the Seventh IAHS Scientific Assembly, Foz do Iguaçu, Brazil, 3–9 April 2005; IAHS Press: Wallingford, UK, 2005; pp. 167–177. [Google Scholar]
- Li, K.Y.; Coe, M.T.; Ramankutty, N.; De jong, R. Modeling the hydrological impact of land–use change in West Africa. J. Hydrol. 2007, 337, 258–268. [Google Scholar] [CrossRef]
- Tellro Wai, N.; Ngatcha, B.N.; Mahe, G.; Doumnang, J.C.; Delclaux, F.; Ngolona, G.; Genthon, P. Influence des activités anthropiques sur le régime hydrologique du fleuve Logone de 1960 à 2000. In Hydrology in a Changing World: Environmental and Human Dimensions, Proceedings of FRIEND-Water 2014, Montpellier, France, 7–10 October 2014; Daniell, T., van Lanen, H.A.J., Demuth, S., Laaha, G., Servat, E., Mahe, G., Boyer, J.F., Paturel, J.E., Dezetter, A., Ruelland, D., Eds.; IAHS Press: Wallingford, UK, 2014; pp. 438–442. [Google Scholar]
Figure 1.
Location map of Nyong and Ntem watersheds.

Figure 2.
Patterns in oceanic sea surface temperatures (SSTs) known to influence weather in the studied region (blue zones), according to Bush et al. [39]. The Pacific Ocean El Niño Southern Oscillation (ENSO); North and South Tropical Atlantic SSTs (NATL and SATL, respectively) and the Indian Ocean Dipole (IOD).

Figure 3.
Results of statistical segmentation of Nyong (black) and Ntem (gray) annual rainfall, discharges and runoff coefficients, according to the Pettitt test. The thick horizontal lines indicate the averages of the whole period, while the thin horizontal lines indicate those of the different homogeneous periods. The thick and broken vertical lines indicate the years of discontinuity.

Figure 4.
Results of statistical segmentation of Nyong (black) and Ntem (gray) seasonal rainfall, discharges and runoff coefficients, according to the Pettitt test. The thick horizontal lines indicate the averages of the whole period, while the thin horizontal lines indicate those of the different homogeneous periods. The thick and broken vertical lines indicate the years of discontinuity.

Figure 5.
Comparison of climatic indices and normalized rainfall anomalies.

Figure 6.
Spatial distribution of the main land use patterns in the studied watersheds at two dates.
Figure 6.
Spatial distribution of the main land use patterns in the studied watersheds at two dates.

Figure 7.
Regression between September (first month of autumn) discharges and summer (July and August) rainfall.
Figure 7.
Regression between September (first month of autumn) discharges and summer (July and August) rainfall.


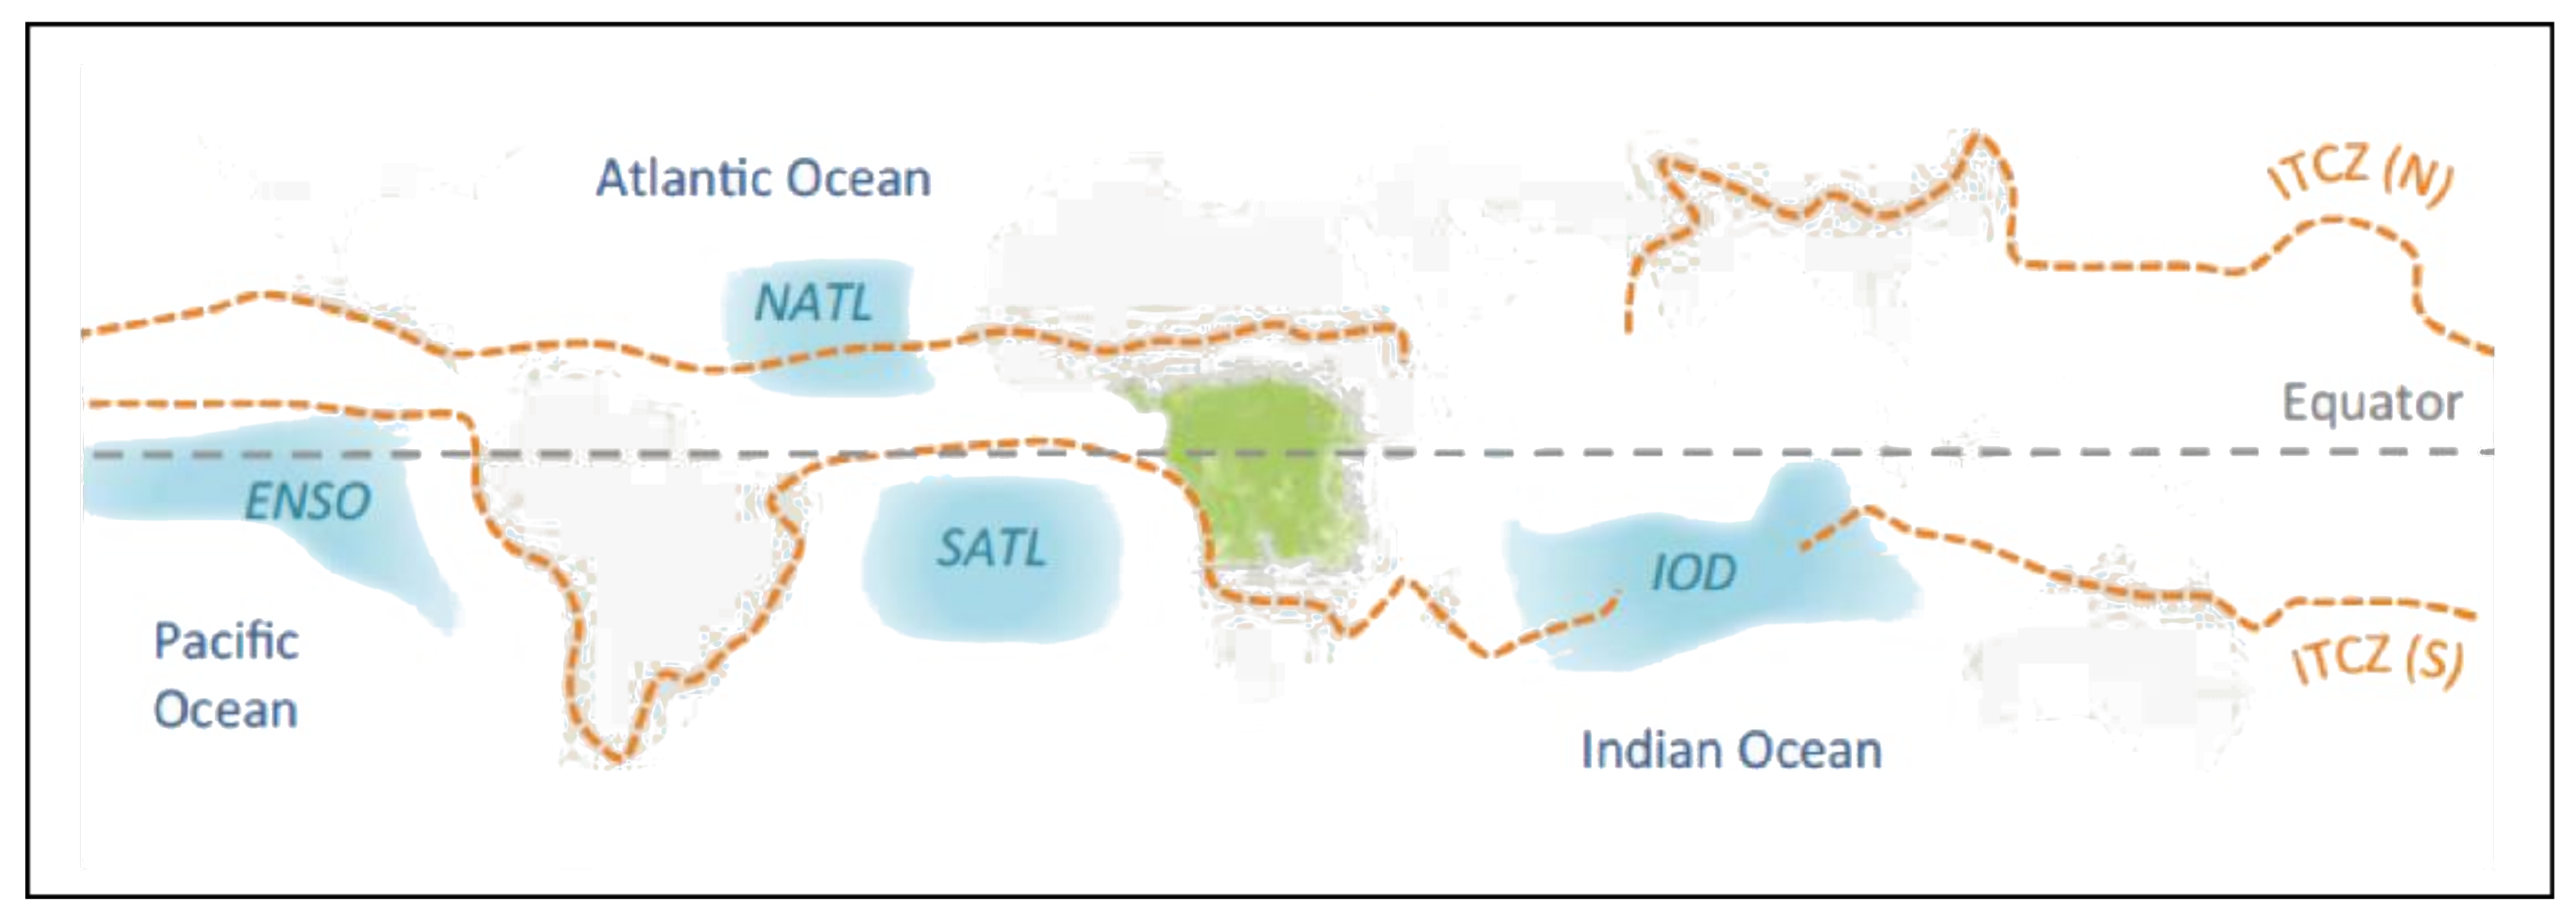
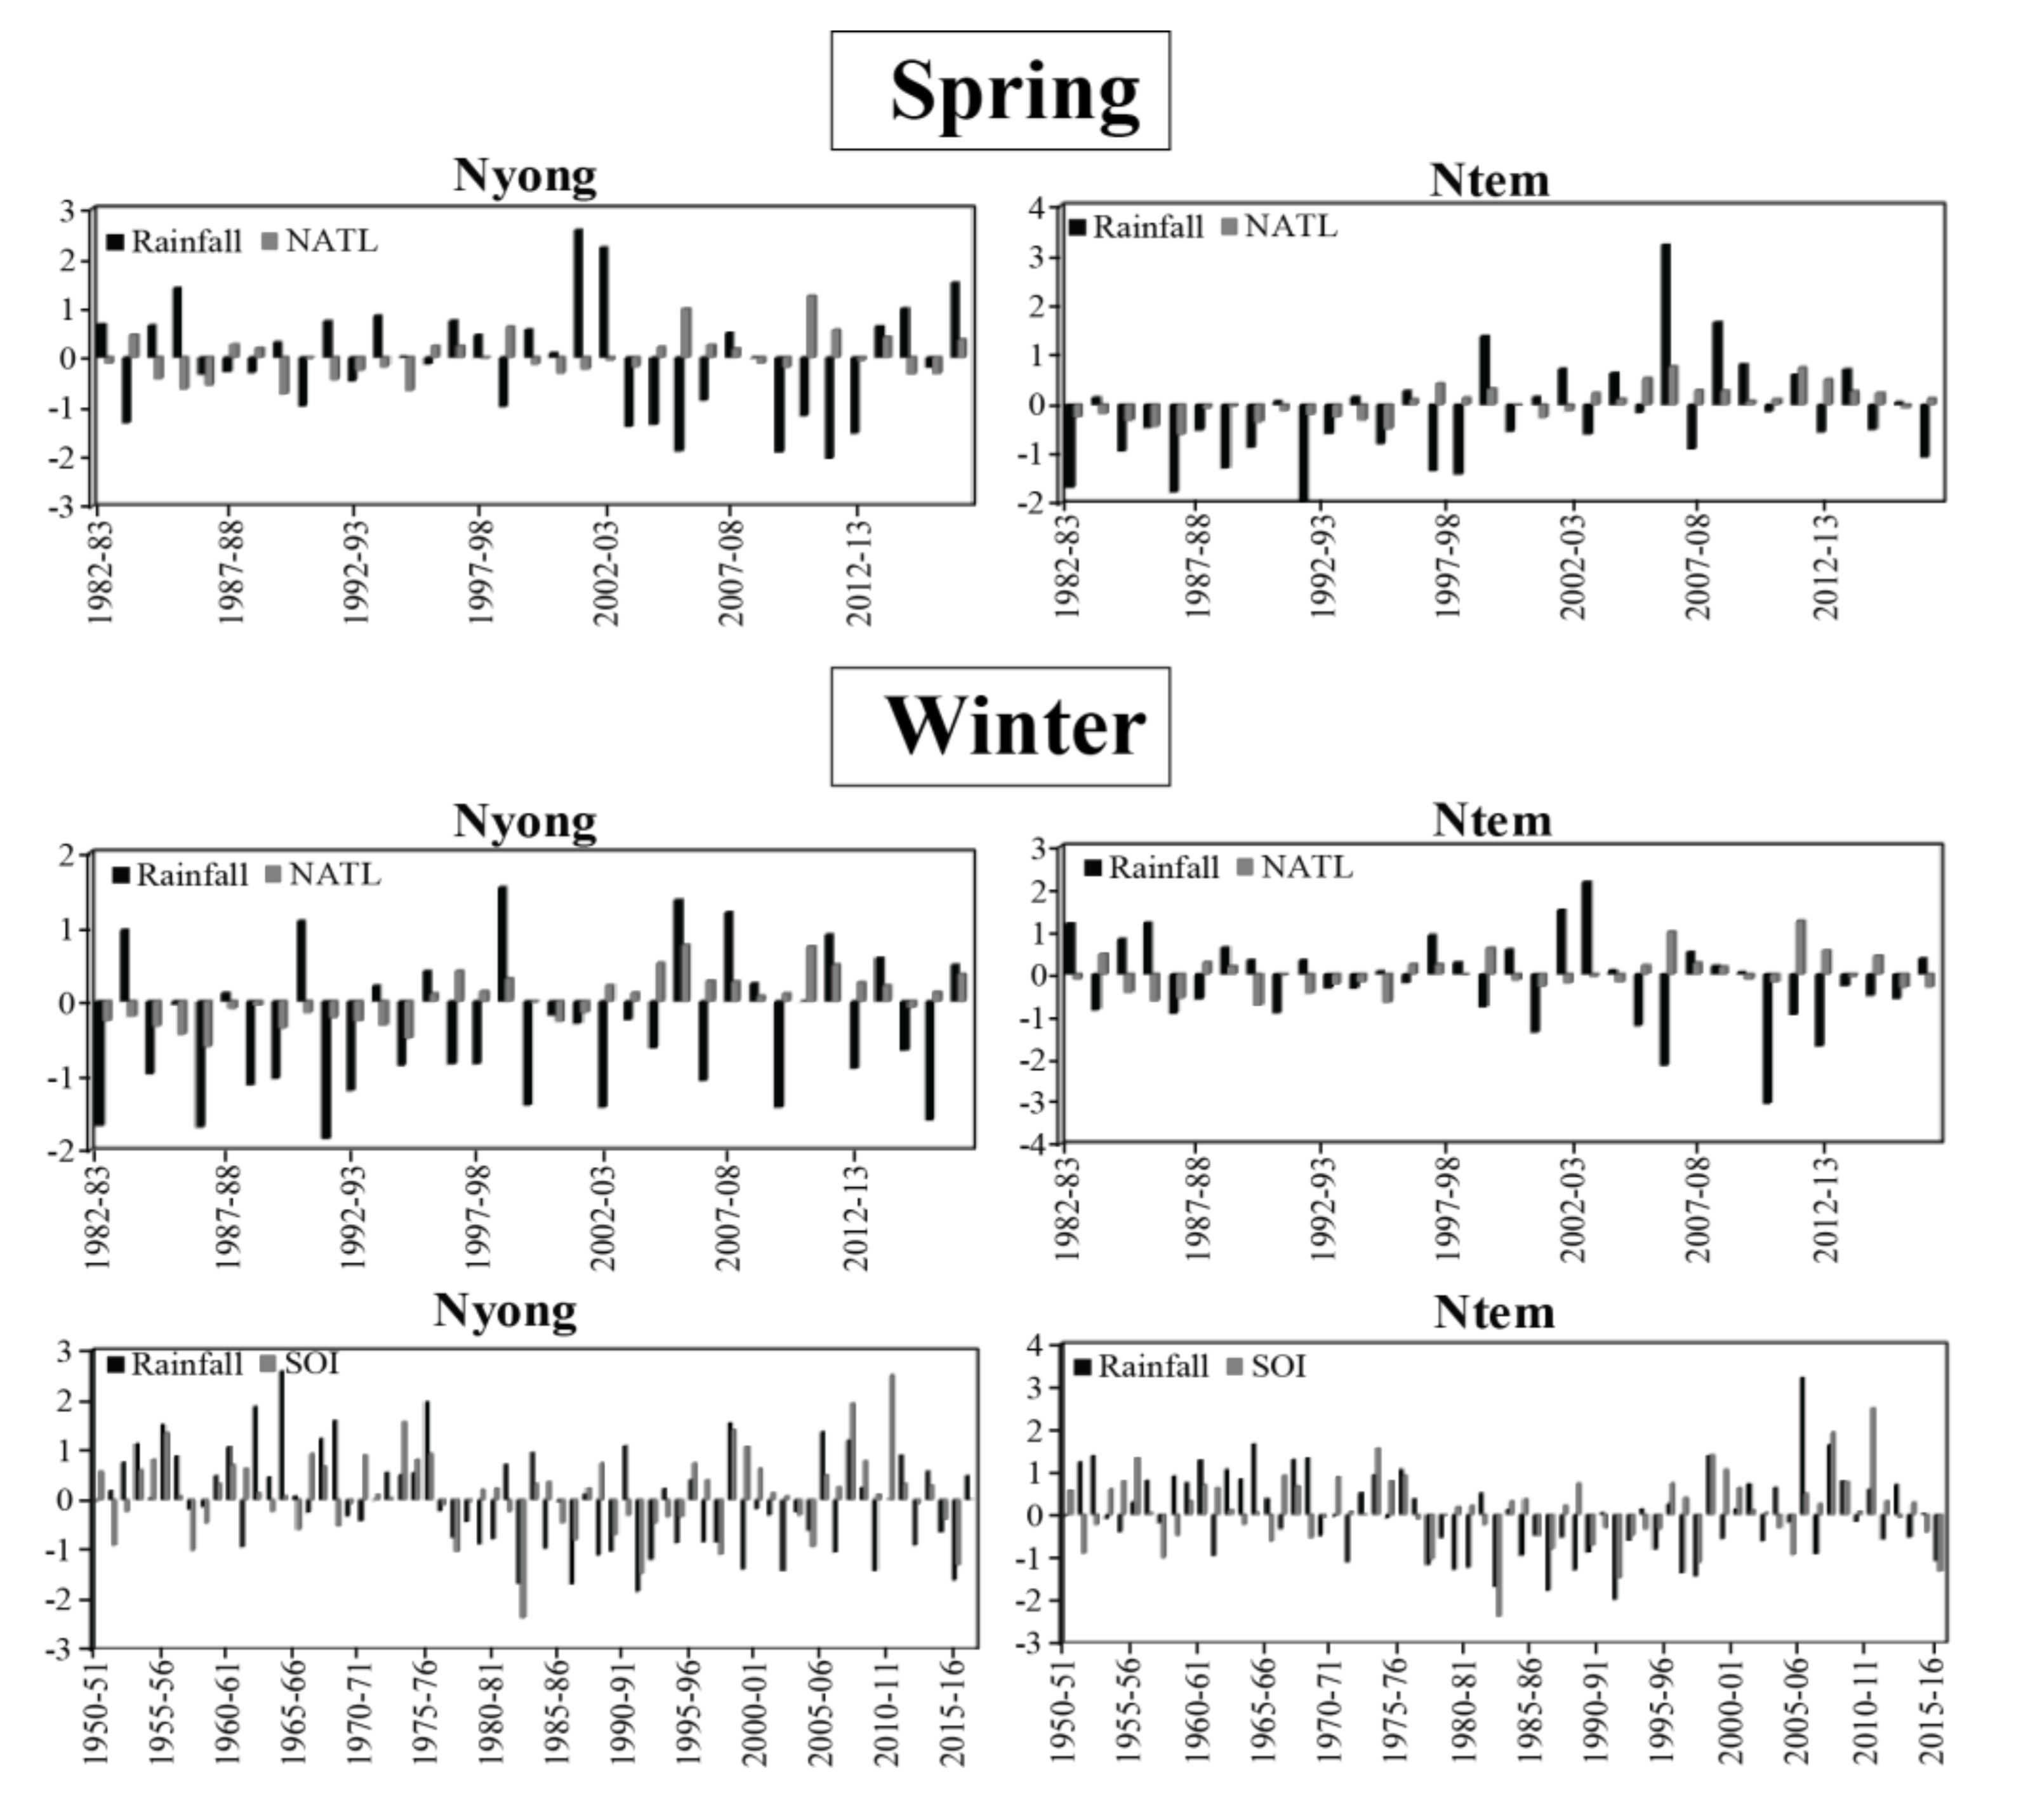
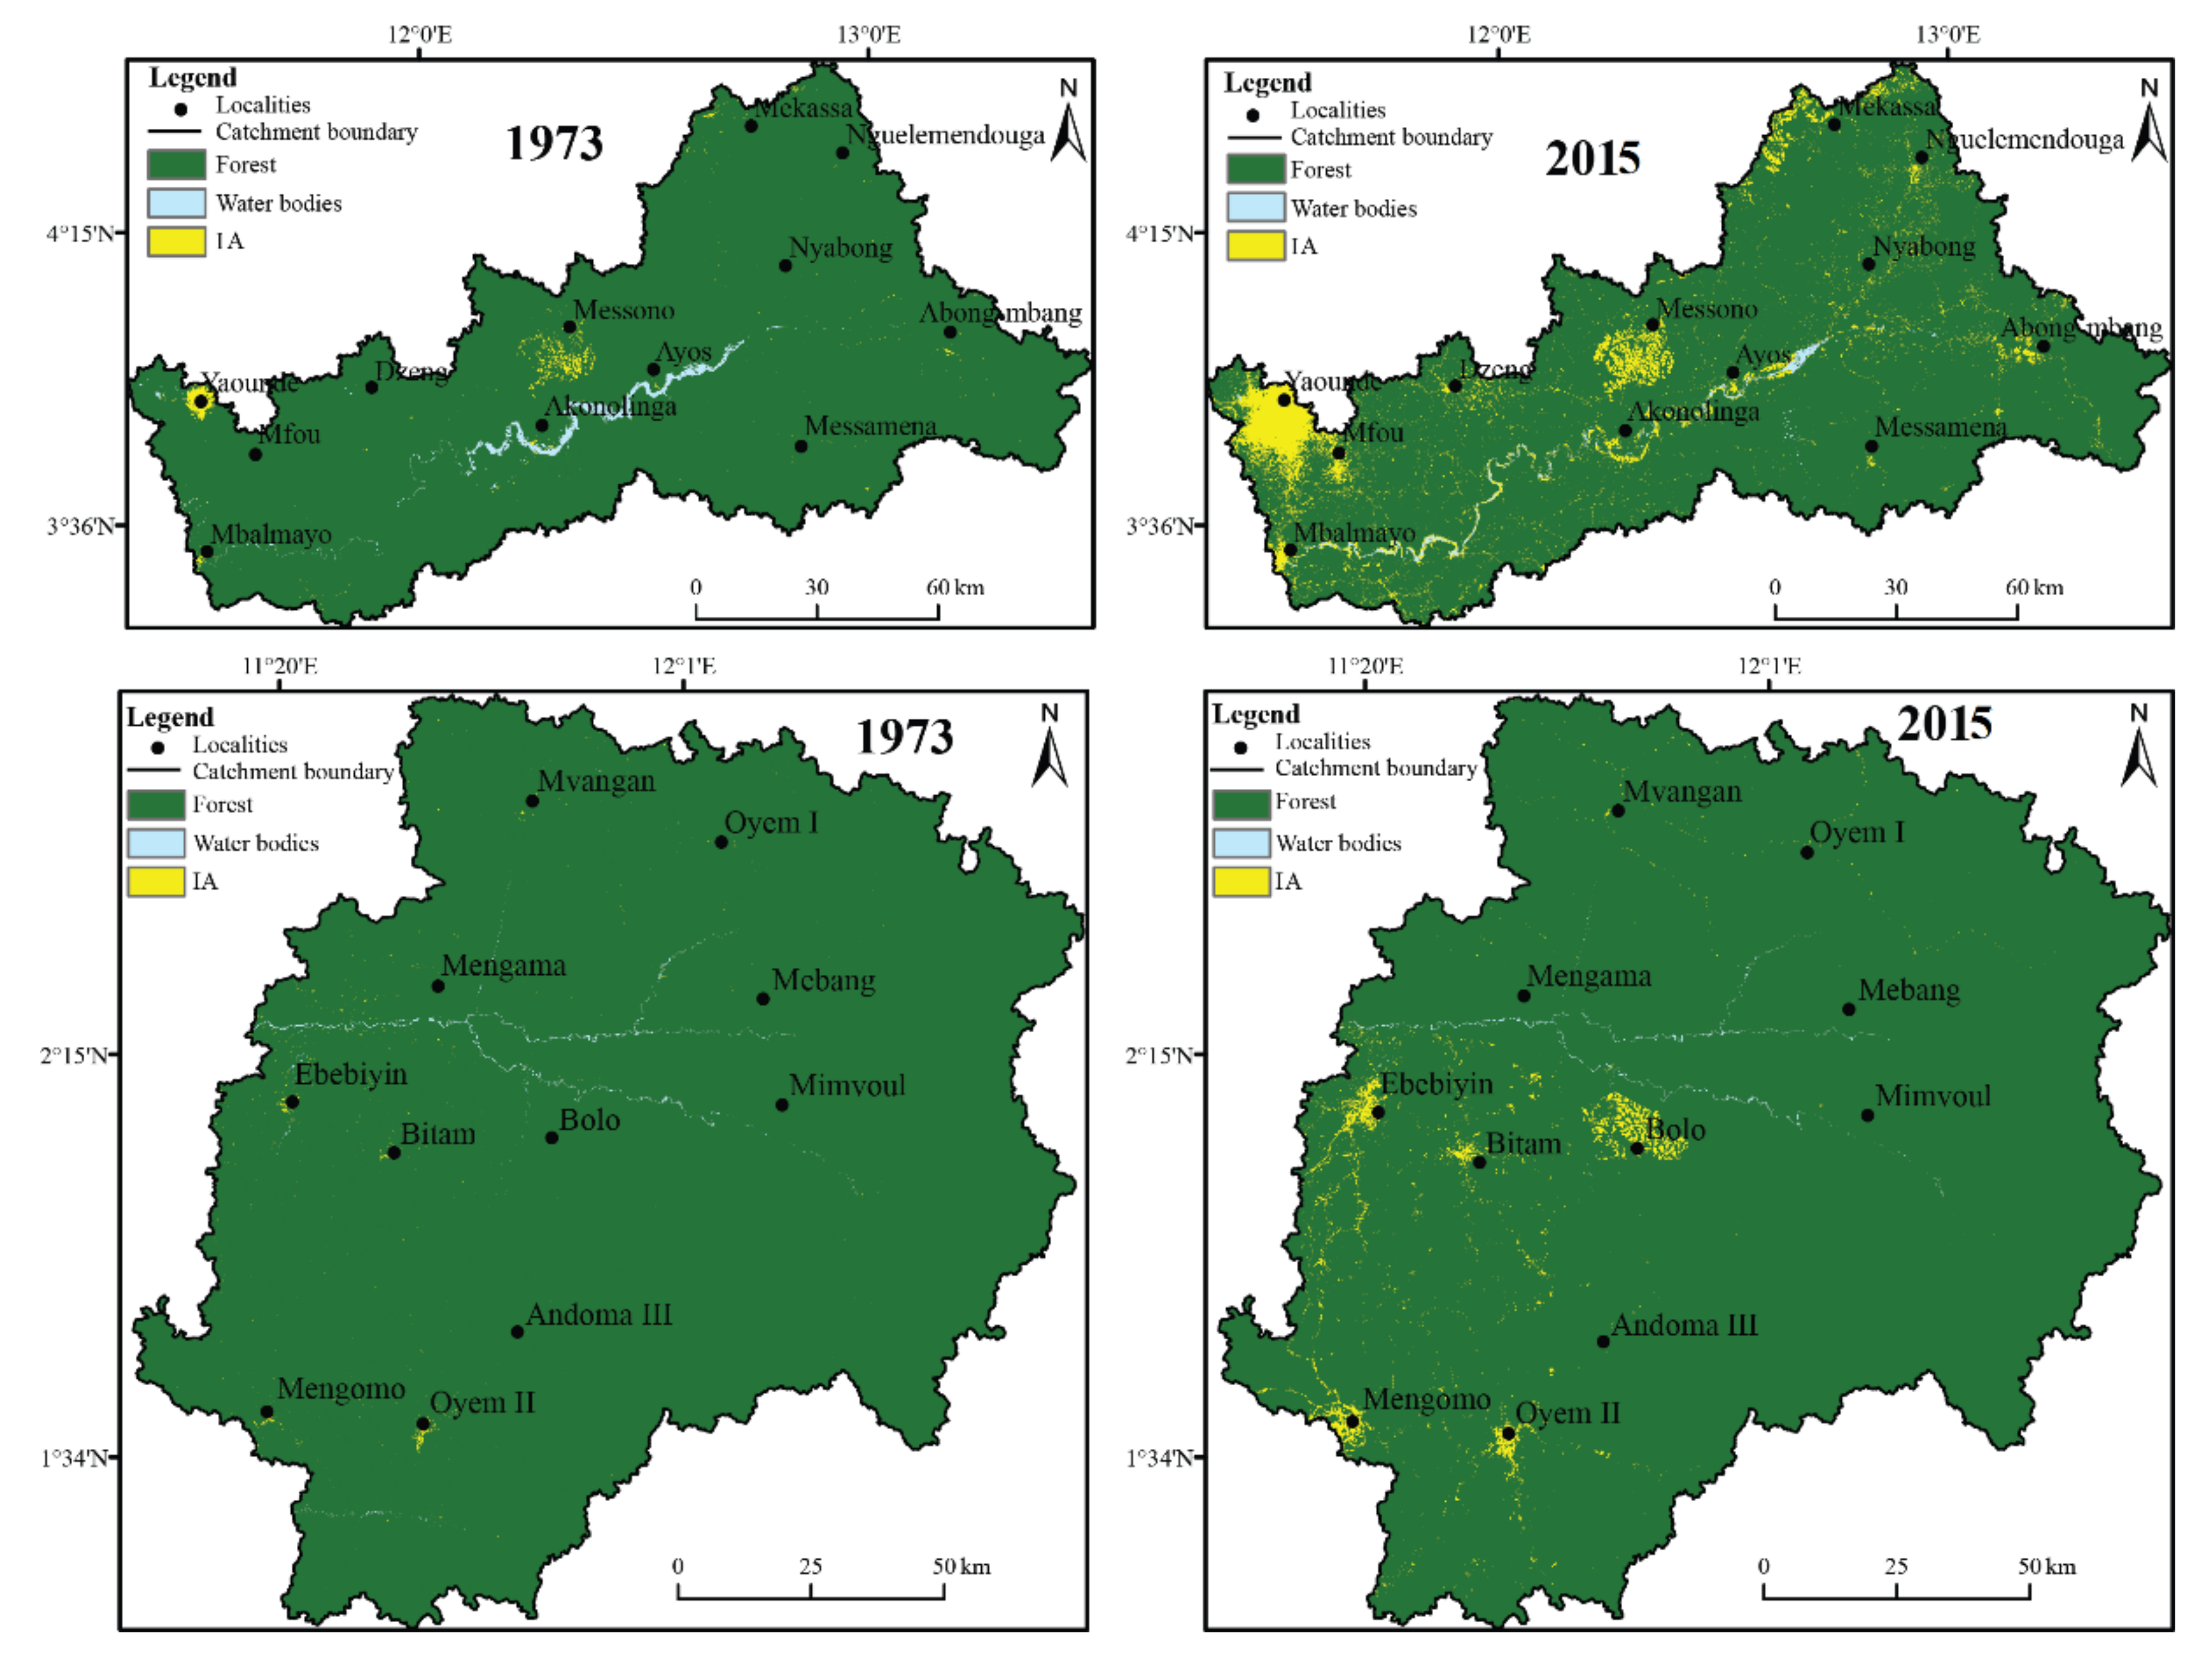
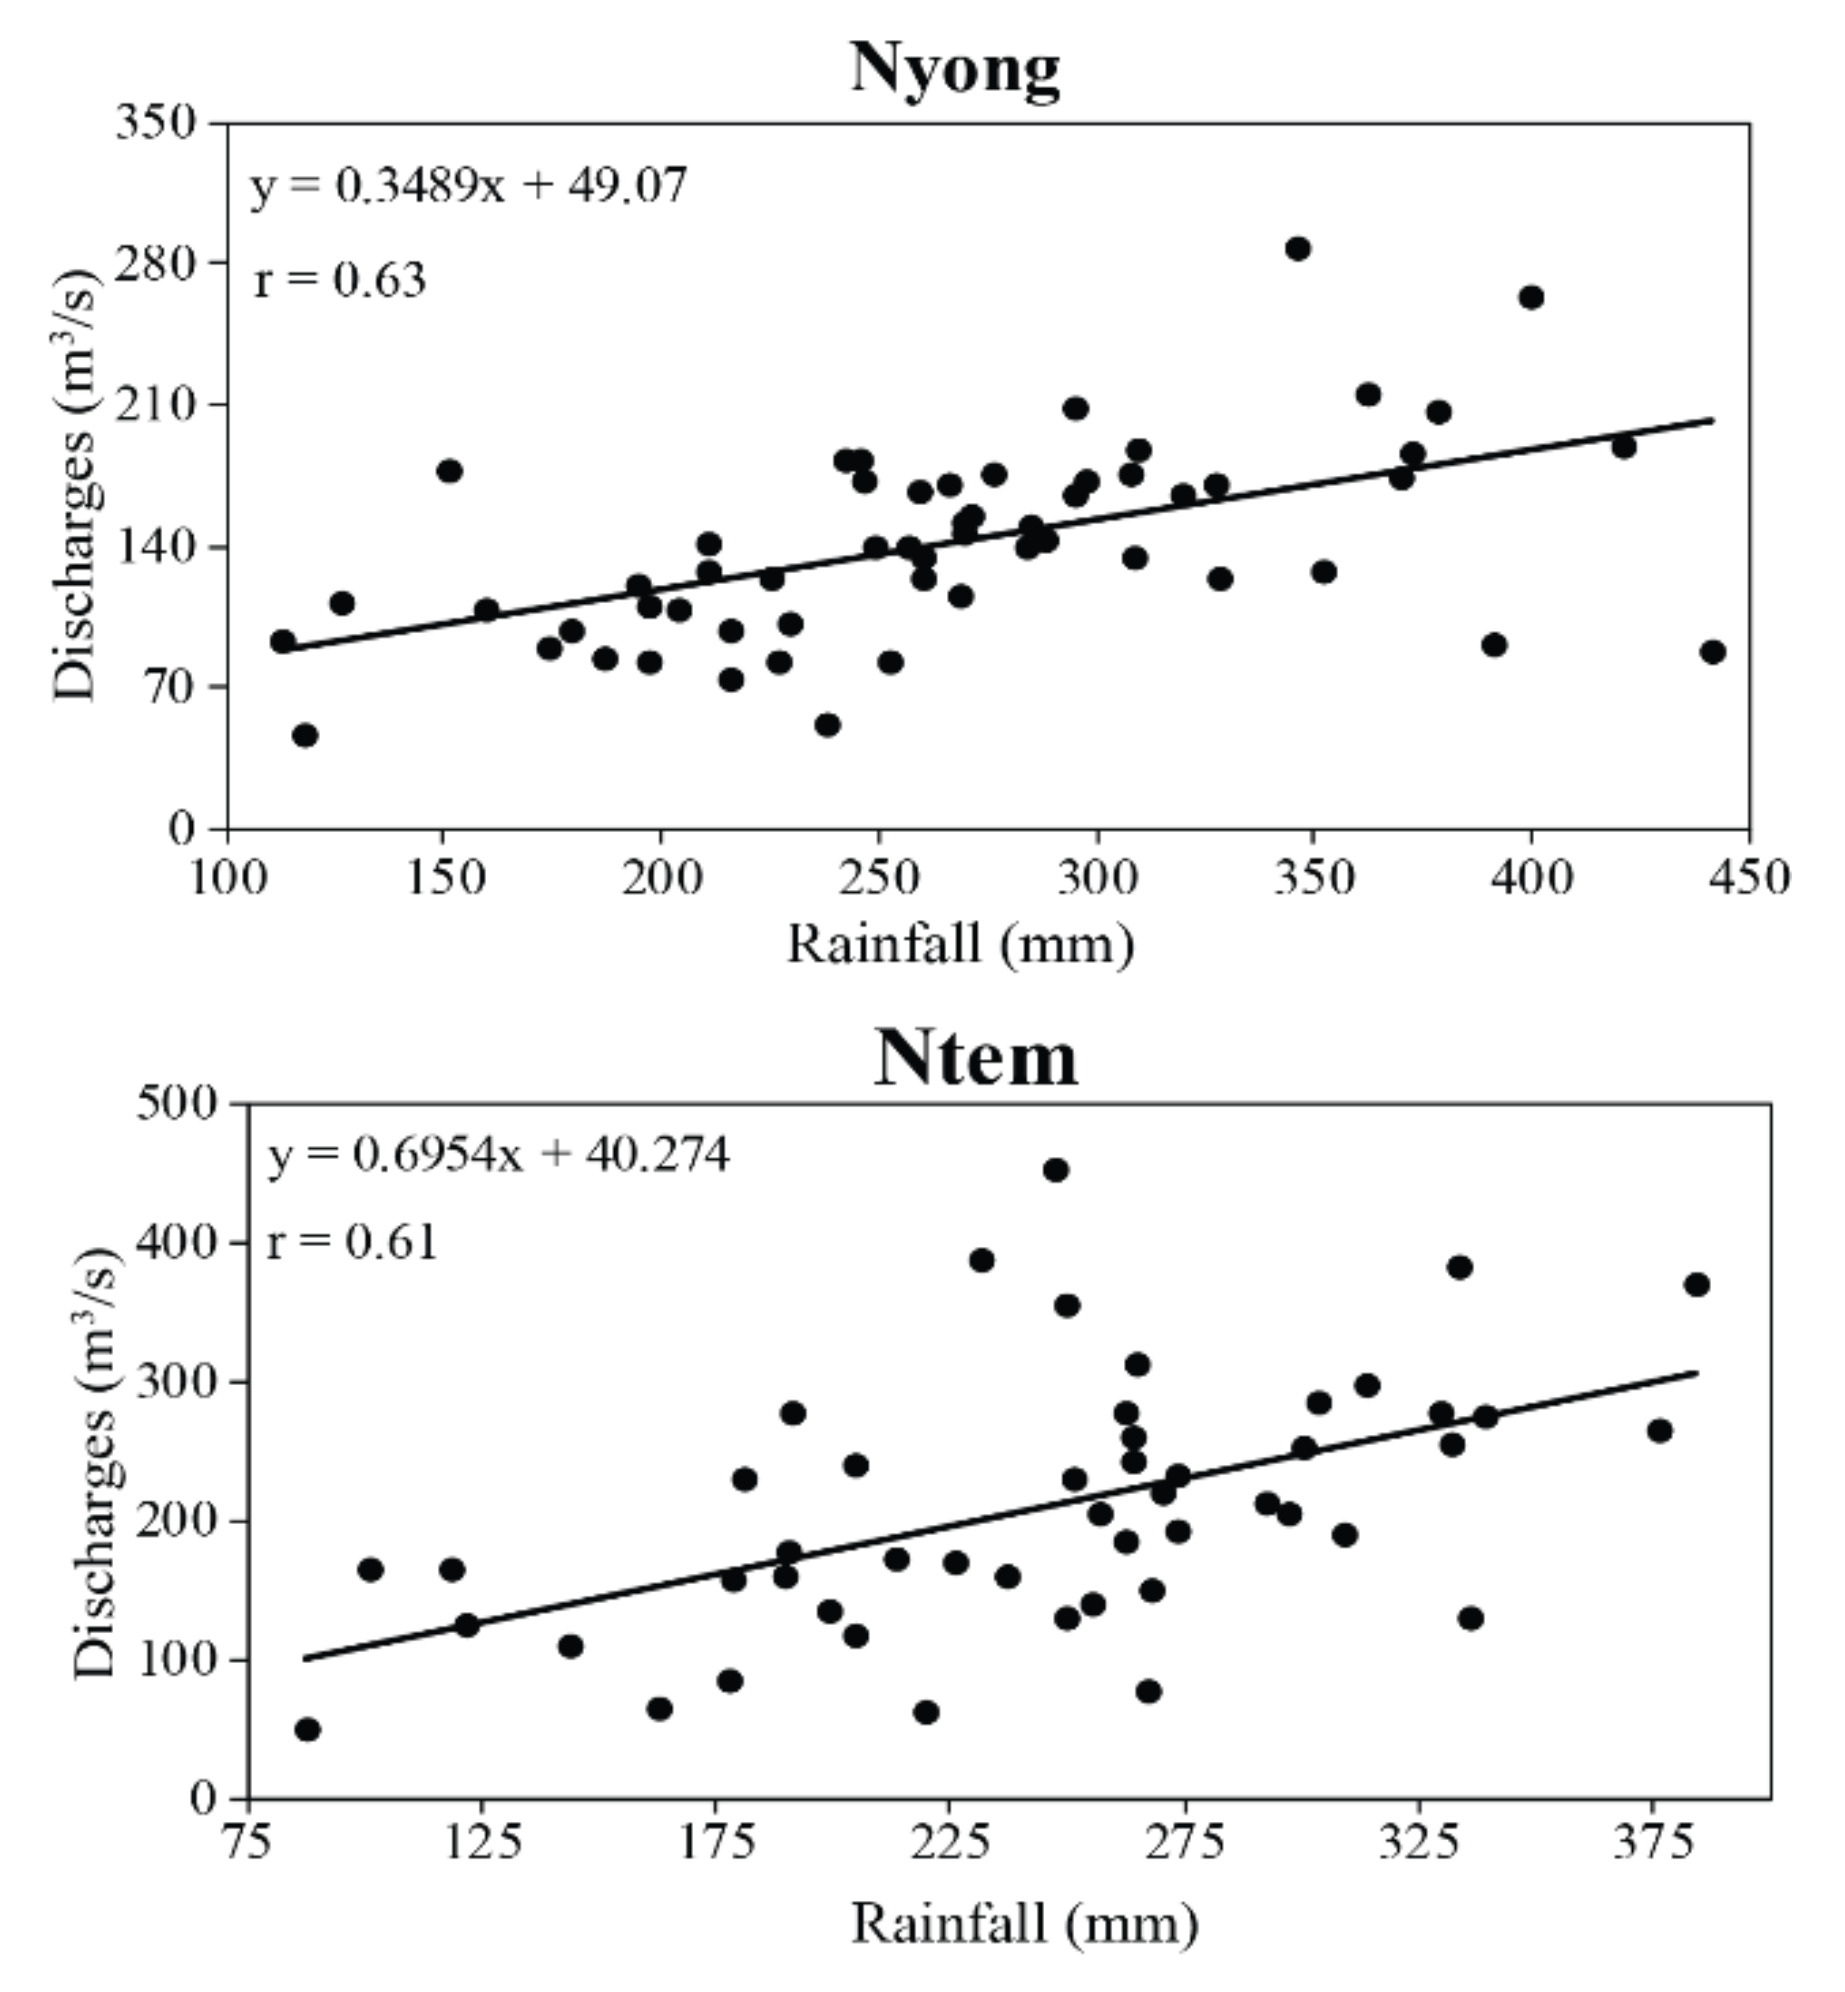
Table 1.
Statistics relating to the evolution of precipitation and average discharges at annual and seasonal time steps over the study period, but also before and after the discontinuity. Cv: coefficient of variation.
Table 1.
Statistics relating to the evolution of precipitation and average discharges at annual and seasonal time steps over the study period, but also before and after the discontinuity. Cv: coefficient of variation.
| Periods | Whole Period | Discontinuity | Mean (m3/s) | Cv (%) | |||
|---|---|---|---|---|---|---|---|
| Mean (m3/s) | Cv (%) | Before | After | Before | After | ||
| Rainfall | |||||||
| Nyong | |||||||
| Annual | 1627 | 9 | - | - | - | - | - |
| Spring | 634 | 13 | - | - | - | - | - |
| Summer | 274 | 28 | 1964–65 | 220 | 290 | 26 | 26 |
| Autumn | 625 | 11 | - | - | - | - | - |
| Winter | 93 | 43 | 1975–76 | 116 | 78 | 29 | 48 |
| Ntem | |||||||
| Annual | 1810 | 7 | - | - | - | - | - |
| Spring | 675 | 12 | - | - | - | - | - |
| Summer | 256 | 29 | 1964–65 | 192 | 283 | 29 | 22 |
| Autumn | 693 | 10 | - | - | - | - | - |
| Winter | 184 | 28 | 1976–77 | 208 | 169 | 20 | 32 |
| Discharges | |||||||
| Nyong | |||||||
| Annual | 139 | 20 | 1973–74 | 151 | 132 | 19 | 18 |
| Spring | 88 | 31 | 1973–74 | 105 | 76 | 28 | 27 |
| Summer | 111 | 31 | - | - | - | - | - |
| Autumn | 243 | 23 | - | - | - | - | - |
| Winter | 123 | 20 | - | - | - | - | - |
| Ntem | |||||||
| Annual | 236 | 23 | 1970–71 | 269 | 215 | 26 | 18 |
| Spring | 222 | 34 | 1970–71 | 270 | 193 | 32 | 28 |
| Summer | 115 | 49 | - | - | - | - | - |
| Autumn | 421 | 25 | 1990–91 | 444 | 324 | 22 | 18 |
| Winter | 156 | 29 | 1970–71 | 186 | 136 | 25 | 23 |
Table 2.
Indices of separability between the different classes considered by watershed and by image. TDI: Transformed Divergence Index and WB: Water Bodies.
Table 2.
Indices of separability between the different classes considered by watershed and by image. TDI: Transformed Divergence Index and WB: Water Bodies.
| Nyong Watershed | |||
| Image from 1973 | Image from 2015 | ||
| Classes Assessed | TDI | Classes Assessed | TDI |
| Forest-IA | 2 | Forest-IA | 2 |
| Forest-WB | 1.92 | Forest-WB | 1.98 |
| WB-Forest | 1.92 | WB-Forest | 1.97 |
| WB-IA | 2 | WB-IA | 2 |
| IA-Forest | 2 | IA-Forest | 2 |
| IA-WB | 2 | IA-WB | 2 |
| Ntem watershed | |||
| Image from 1973 | Image from 2015 | ||
| Classes assessed | TDI | Classes assessed | TDI |
| Forest-IA | 2 | Forest-IA | 2 |
| Forest-WB | 1.97 | Forest-WB | 1.98 |
| WB-Forest | 1.96 | WB-Forest | 1.98 |
| WB-IA | 2 | WB-IA | 2 |
| IA-Forest | 2 | IA-Forest | 2 |
| IA-WB | 2 | IA-WB | 2 |
Table 3.
Deviations (%) of decadal annual and seasonal averages of rainfall, discharges and runoff coefficients compared to the whole period averages of the studied watersheds.
Table 3.
Deviations (%) of decadal annual and seasonal averages of rainfall, discharges and runoff coefficients compared to the whole period averages of the studied watersheds.
| Basins | Decades | Deviations from the Whole Period Average (%) | ||||
|---|---|---|---|---|---|---|
| Annual | Spring | Summer | Autumn | Winter | ||
| Rainfall | ||||||
| Nyong | 1950–59 | 0.2 | 3.2 | −20.3 | 3.2 | 19.9 |
| 1960–69 | 2.2 | 0.9 | −3.1 | 1.4 | 32 | |
| 1970–79 | −1 | −1.8 | −2.9 | −0.1 | 3.6 | |
| 1980–89 | 1.5 | 0.8 | 10.5 | 2.1 | −24 | |
| 1990–99 | 4.5 | 2.1 | 23.8 | 2.9 | −16.1 | |
| 2000–09 | −5.1 | −3.4 | −0.3 | −8.6 | −10.5 | |
| 2010–16 | −3.1 | −3.7 | −9.4 | 0.9 | −7.3 | |
| Ntem | 1950–59 | −0.2 | 3.8 | −30.5 | 3.5 | 12 |
| 1960–69 | −1.7 | 2.2 | −14.9 | −5.6 | 15.9 | |
| 1970–79 | 2.3 | 0.6 | 1.9 | 5.9 | −4.6 | |
| 1980–89 | 0.5 | 2.3 | 15.9 | −0.6 | −23.7 | |
| 1990–99 | 2.5 | −1.2 | 30.2 | −0.2 | −14.5 | |
| 2000–09 | 0.1 | −2.8 | 6.8 | −2.1 | 13.8 | |
| 2010–15 | −5.9 | −7.7 | −12.7 | −2.2 | −4.7 | |
| Discharges | ||||||
| Nyong | 1951–59 | −4.8 | 10.2 | 1.3 | −14 | −4.3 |
| 1960–69 | 17.7 | 27.3 | 22.5 | 13.1 | 14.9 | |
| 1970–79 | −2.6 | 0.1 | −12.7 | 0.9 | −6 | |
| 1980–88 | −0.7 | −8.8 | −11 | 8.1 | −3.6 | |
| 2000–09 | −6.5 | −14.7 | 0.8 | −4 | −7.8 | |
| 2010–16 | −5.7 | −12.3 | −8.1 | −7.4 | 7.4 | |
| Ntem | 1953–59 | −4.4 | 0.2 | −27.6 | −7.6 | 3.4 |
| 1960–69 | 27.8 | 38.1 | 34.4 | 17.1 | 29.3 | |
| 1970–79 | −2.2 | −3.5 | −8.1 | −0.4 | −5.2 | |
| 1980–89 | −2.7 | −17.4 | −0.4 | 11.5 | −12.1 | |
| 1990 | - | - | - | - | - | |
| 2000 | - | - | - | - | - | |
| 2010–15 | −9.1 | 0.2 | −12.9 | −15.7 | −10.4 | |
| Runoff Coefficients | ||||||
| Nyong | 1951–59 | −41.3 | 5.8 | 24.7 | −27.9 | −51.2 |
| 1960–69 | −34.2 | 20.7 | 12.5 | 12 | −48.7 | |
| 1970–79 | −34.5 | −3.9 | −15.9 | 7.8 | −44.7 | |
| 1980–88 | 64.5 | −8.1 | −31.4 | 8.8 | 84.1 | |
| 2000–09 | 36.1 | −6.2 | 13.8 | 9.2 | 44.4 | |
| 2010–16 | 25.1 | −4.2 | −1.3 | −12.8 | 34.5 | |
| Ntem | 1953–59 | −13.9 | −1.6 | 8.8 | −15.2 | −21.7 |
| 1960–69 | 12.2 | 33.8 | 42.9 | 20.8 | −7.3 | |
| 1970–79 | −11.2 | −7.6 | −14.1 | −1.2 | −15.7 | |
| 1980–89 | 2.3 | −20.8 | −23.4 | 10.6 | 11.4 | |
| 1990 | - | - | - | - | - | |
| 2000 | - | - | - | - | - | |
| 2010–15 | 31.5 | 24 | −14.3 | −11.4 | 93.1 | |
Table 4.
Statistics relating to the maximum and minimum flows of Nyong and Ntem before and after the discontinuity. IHA: Indicators of Hydrologic Alteration.
Table 4.
Statistics relating to the maximum and minimum flows of Nyong and Ntem before and after the discontinuity. IHA: Indicators of Hydrologic Alteration.
| IHA Statistics | Means (m3/s) | Cv (%) | Change | |||
|---|---|---|---|---|---|---|
| Before Discontinuity | After Discontinuity | Before Discontinuity | After Discontinuity | m3/s | % | |
| Nyong | ||||||
| Minimum flows | ||||||
| 1-day minimum | 25.5 | 17.9 | 30 | 41 | −7.5 | −29.7 |
| 3-day minimum | 26.1 | 18.1 | 30 | 41 | −8 | −30.6 |
| 7-day minimum | 27.8 | 19.3 | 30 | 38 | −8.4 | −30.2 |
| 30-day minimum | 41.5 | 26.4 | 28 | 36 | −15 | −36.2 |
| 90-day minimum | 82.9 | 58.5 | 31 | 29 | −24.3 | −29.3 |
| Maximum flows | ||||||
| 1-day maximum | 366 | 366 | 26 | 23 | −0.3 | −0.08 |
| 3-day maximum | 363 | 365 | 26 | 23 | 2 | 0.55 |
| 7-day maximum | 361 | 362 | 26 | 23 | 1.3 | 0.36 |
| 30-day maximum | 340 | 338 | 26 | 25 | −2.6 | −0.76 |
| 90-day maximum | 274 | 271 | 25 | 25 | −2.3 | −0.84 |
| Average Julian dates | ||||||
| Of minimum | 61 | 67 | ||||
| Of maximum | 318 | 309 | ||||
| Ntem | ||||||
| Minimum flows | ||||||
| 1-day minimum | 48 | 34.4 | 51 | 61 | −13.5 | −28.3 |
| 3-day minimum | 50.24 | 36.2 | 51 | 60 | −14 | −27.9 |
| 7-day minimum | 53.1 | 38.9 | 51 | 56 | −14.1 | −26.5 |
| 30-day minimum | 68.71 | 53.8 | 45 | 39 | −14.8 | −21.5 |
| 90-day minimum | 128.4 | 107 | 33 | 29 | −20.8 | −16.2 |
| Maximum flows | ||||||
| 1-day maximum | 793.6 | 662 | 23 | 29 | −131 | −16.5 |
| 3-day maximum | 785.4 | 656 | 23 | 30 | −128 | −16.3 |
| 7-day maximum | 767.4 | 640 | 24 | 30 | −126 | −16.4 |
| 30-day maximum | 685.7 | 567 | 22 | 32 | −118 | −17.2 |
| 90-day maximum | 516.7 | 426 | 22 | 29 | −90 | −17.4 |
| Average Julian dates | ||||||
| Of minimum | 147 | 102 | ||||
| Of maximum | 291 | 275 | ||||
Table 5.
Correlation between rainfall indices and climatic indices at annual and seasonal time steps. Significant correlations are in bold.
Table 5.
Correlation between rainfall indices and climatic indices at annual and seasonal time steps. Significant correlations are in bold.
| Watersheds | Indices | Annual | Spring | Summer | Autumn | Winter |
|---|---|---|---|---|---|---|
| Ntem | DMI | −0.05 | −0.15 | 0.22 | −0.1 | −0.06 |
| NATL | −0.03 | −0.52 | −0.04 | −0.02 | 0.58 | |
| SATL | −0.06 | −0.05 | 0.06 | −0.2 | 0.43 | |
| SOI | 0.03 | −0.17 | 0.12 | −0.09 | 0.51 | |
| Nyong | DMI | −0.23 | −0.09 | 0.09 | −0.23 | −0.02 |
| NATL | −0.17 | −0.54 | −0.09 | −0.11 | 0.52 | |
| SATL | 0 | −0.08 | 0.14 | −0.12 | 0.36 | |
| SOI | 0.21 | −0.04 | 0.1 | 0.16 | 0.53 |
Table 6.
Frequency of years having the same/opposite signs of ocean indices and rainfall anomalies. NY: Number of years; NYOS: Number of years with opposite signs; NYSS: Number of years with same signs.
Table 6.
Frequency of years having the same/opposite signs of ocean indices and rainfall anomalies. NY: Number of years; NYOS: Number of years with opposite signs; NYSS: Number of years with same signs.
| Watersheds | NATL&Rainfall (Spring) | NATL&Rainfall (Winter) | SOI&Rainfall (Winter) | ||||||
|---|---|---|---|---|---|---|---|---|---|
| NY | NYOS | % | NY | NYSS | % | NY | NYSS | % | |
| Nyong | 34 | 24 | 71 | 34 | 23 | 62 | 65 | 35 | 54 |
| Ntem | 33 | 23 | 70 | 33 | 20 | 61 | 64 | 42 | 66 |
Table 7.
Evolution of the main land use modes in the Nyong and Ntem watersheds.
| Basins | Land Use Modes | Area Occupied in the Basin (km2) | Change | ||
|---|---|---|---|---|---|
| 1973 | 2015 | km2 | % | ||
| Forest | 14,174 | 13,326 | −848 | −6 | |
| Nyong | Water bodies | 146 | 84 | −62 | −42 |
| IA | 118 | 1028 | 910 | 771 | |
| Forest | 19,469 | 19,301 | −168 | −1 | |
| Ntem | Water bodies | 53 | 36 | −17 | −32 |
| IA | 41 | 226 | 185 | 451 | |
© 2020 by the authors. Licensee MDPI, Basel, Switzerland. This article is an open access article distributed under the terms and conditions of the Creative Commons Attribution (CC BY) license (http://creativecommons.org/licenses/by/4.0/).
Share and Cite
MDPI and ACS Style
Ebodé, V.B.; Mahé, G.; Dzana, J.G.; Amougou, J.A. Anthropization and Climate Change: Impact on the Discharges of Forest Watersheds in Central Africa. Water 2020, 12, 2718. https://doi.org/10.3390/w12102718
AMA Style
Ebodé VB, Mahé G, Dzana JG, Amougou JA. Anthropization and Climate Change: Impact on the Discharges of Forest Watersheds in Central Africa. Water. 2020; 12(10):2718. https://doi.org/10.3390/w12102718
Chicago/Turabian StyleEbodé, Valentin Brice, Gil Mahé, Jean Guy Dzana, and Joseph Armathé Amougou. 2020. "Anthropization and Climate Change: Impact on the Discharges of Forest Watersheds in Central Africa" Water 12, no. 10: 2718. https://doi.org/10.3390/w12102718
Note that from the first issue of 2016, this journal uses article numbers instead of page numbers. See further details here.