The Assessment of Hydrological Availability and the Payment for Ecosystem Services: A Pilot Study in a Brazilian Headwater Catchment

 , ,
, ,  and
and 
Abstract
:1. Introduction
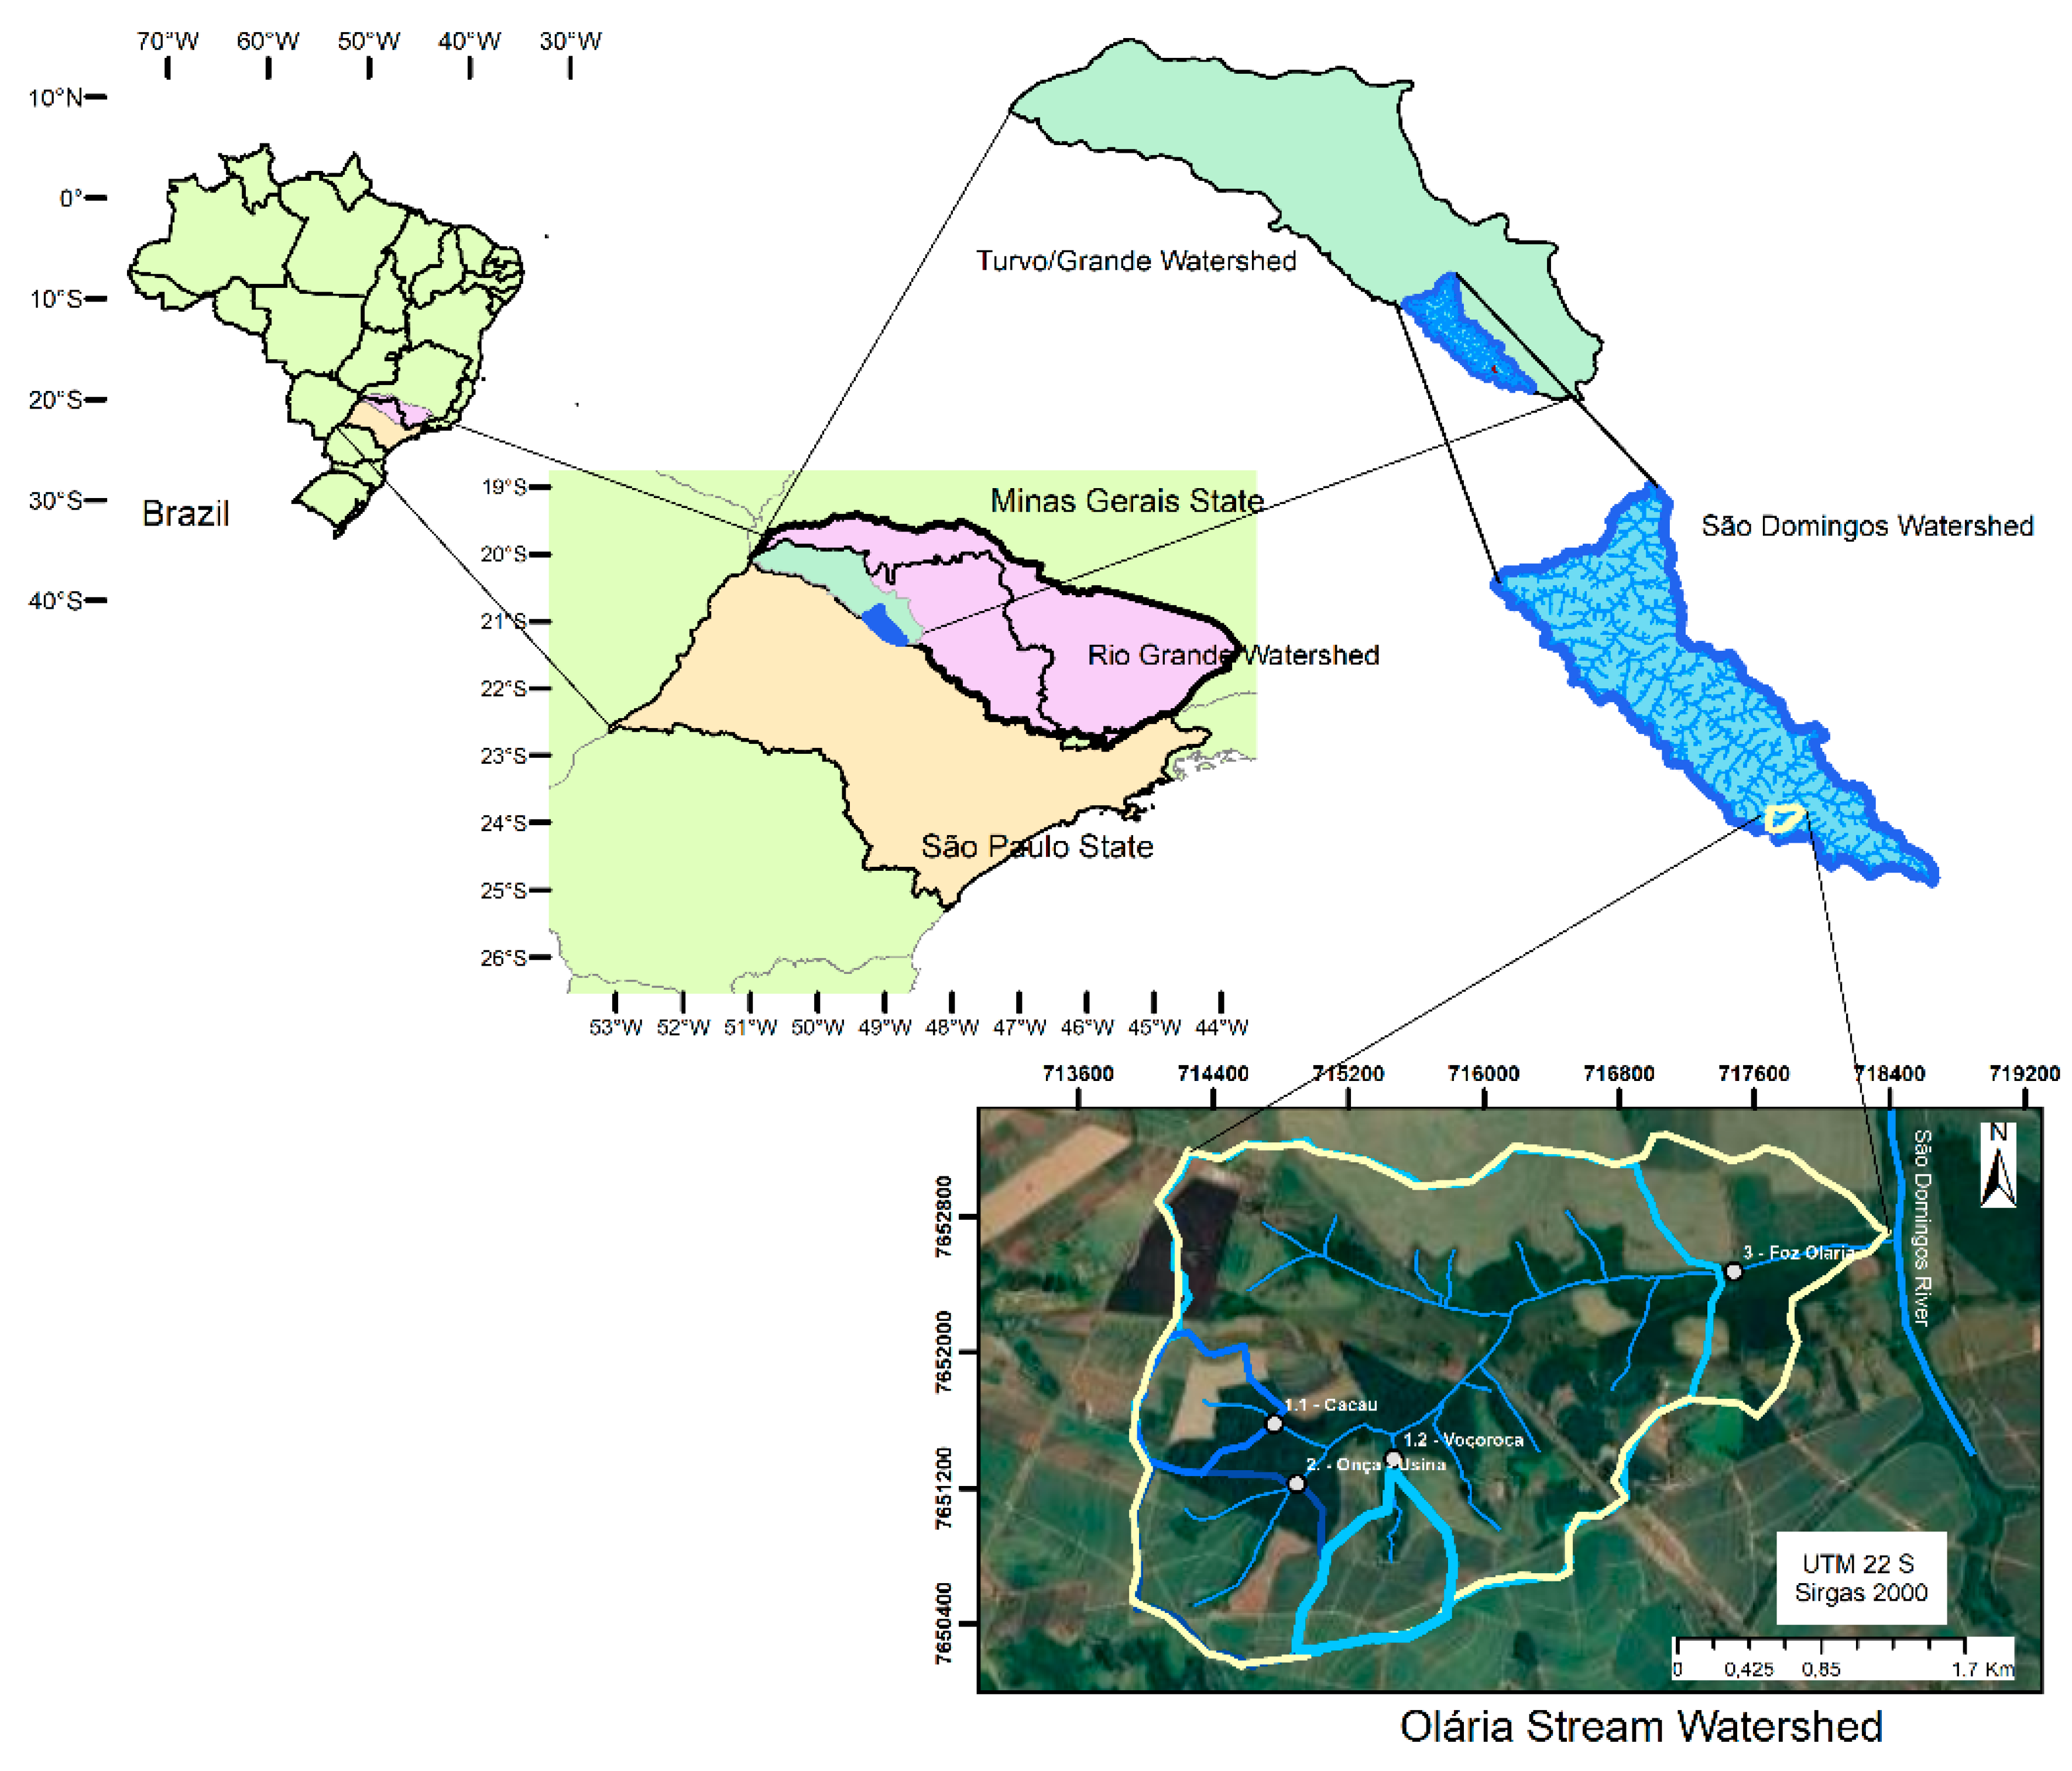
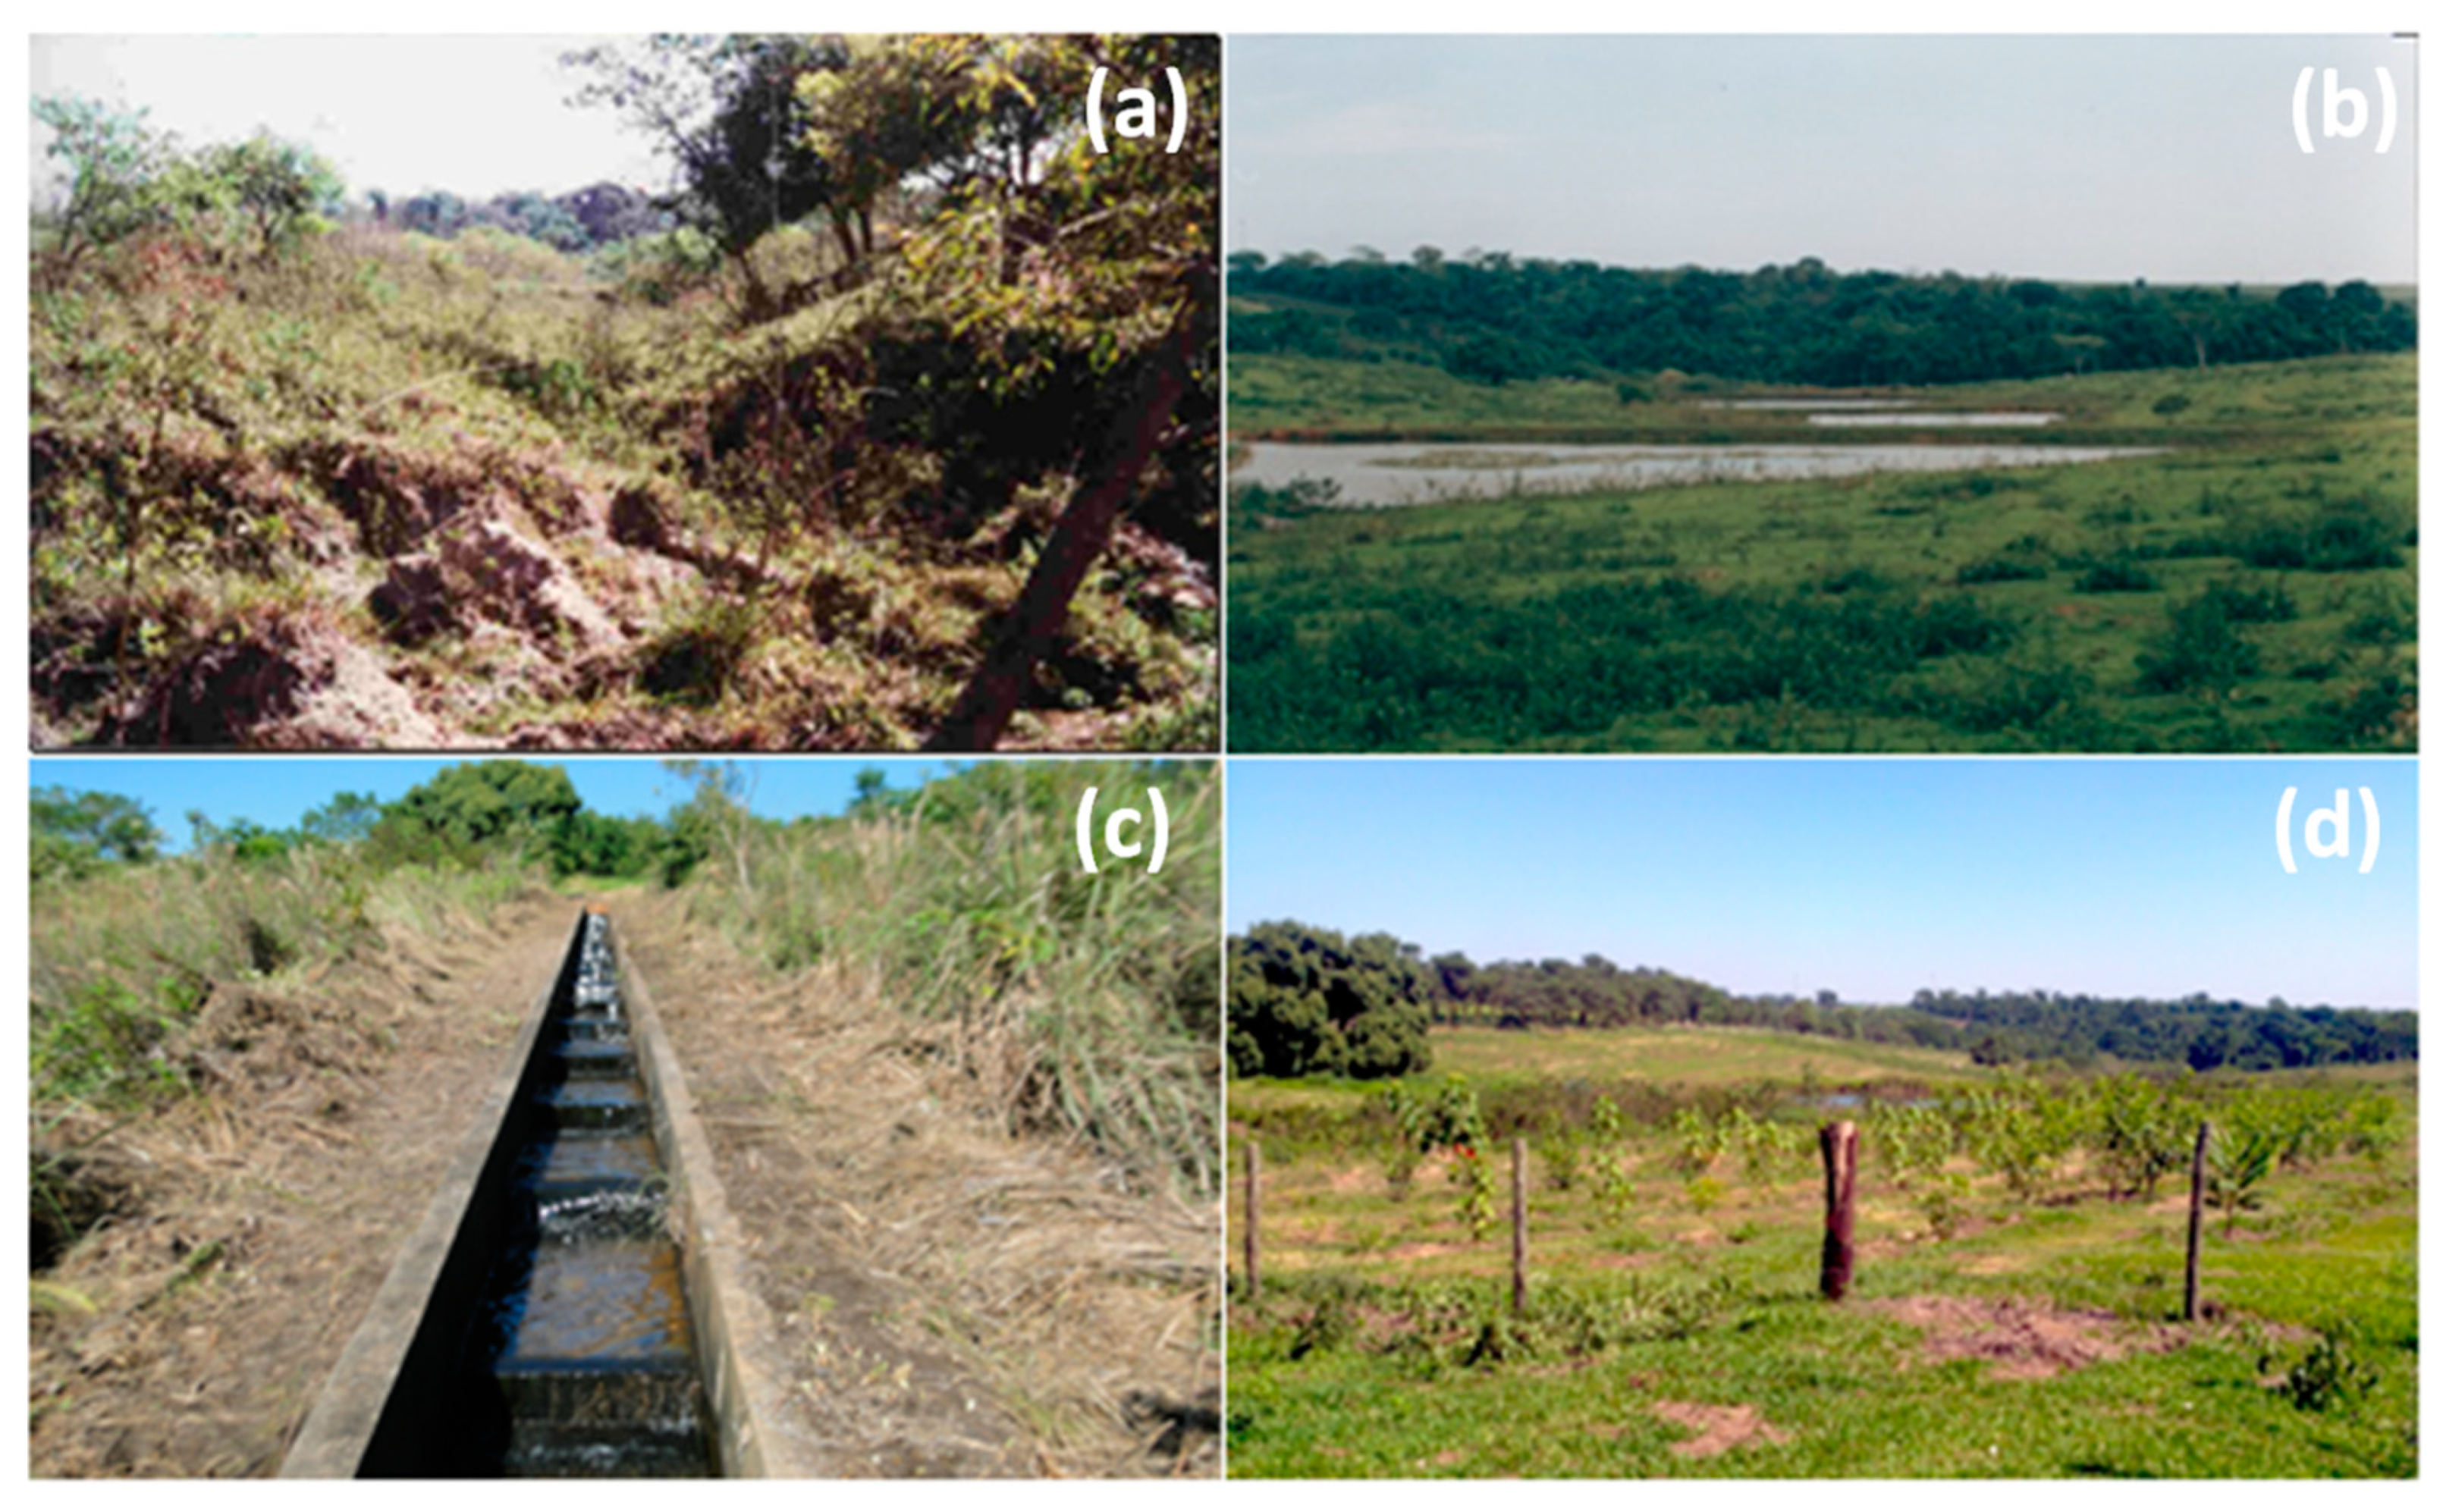
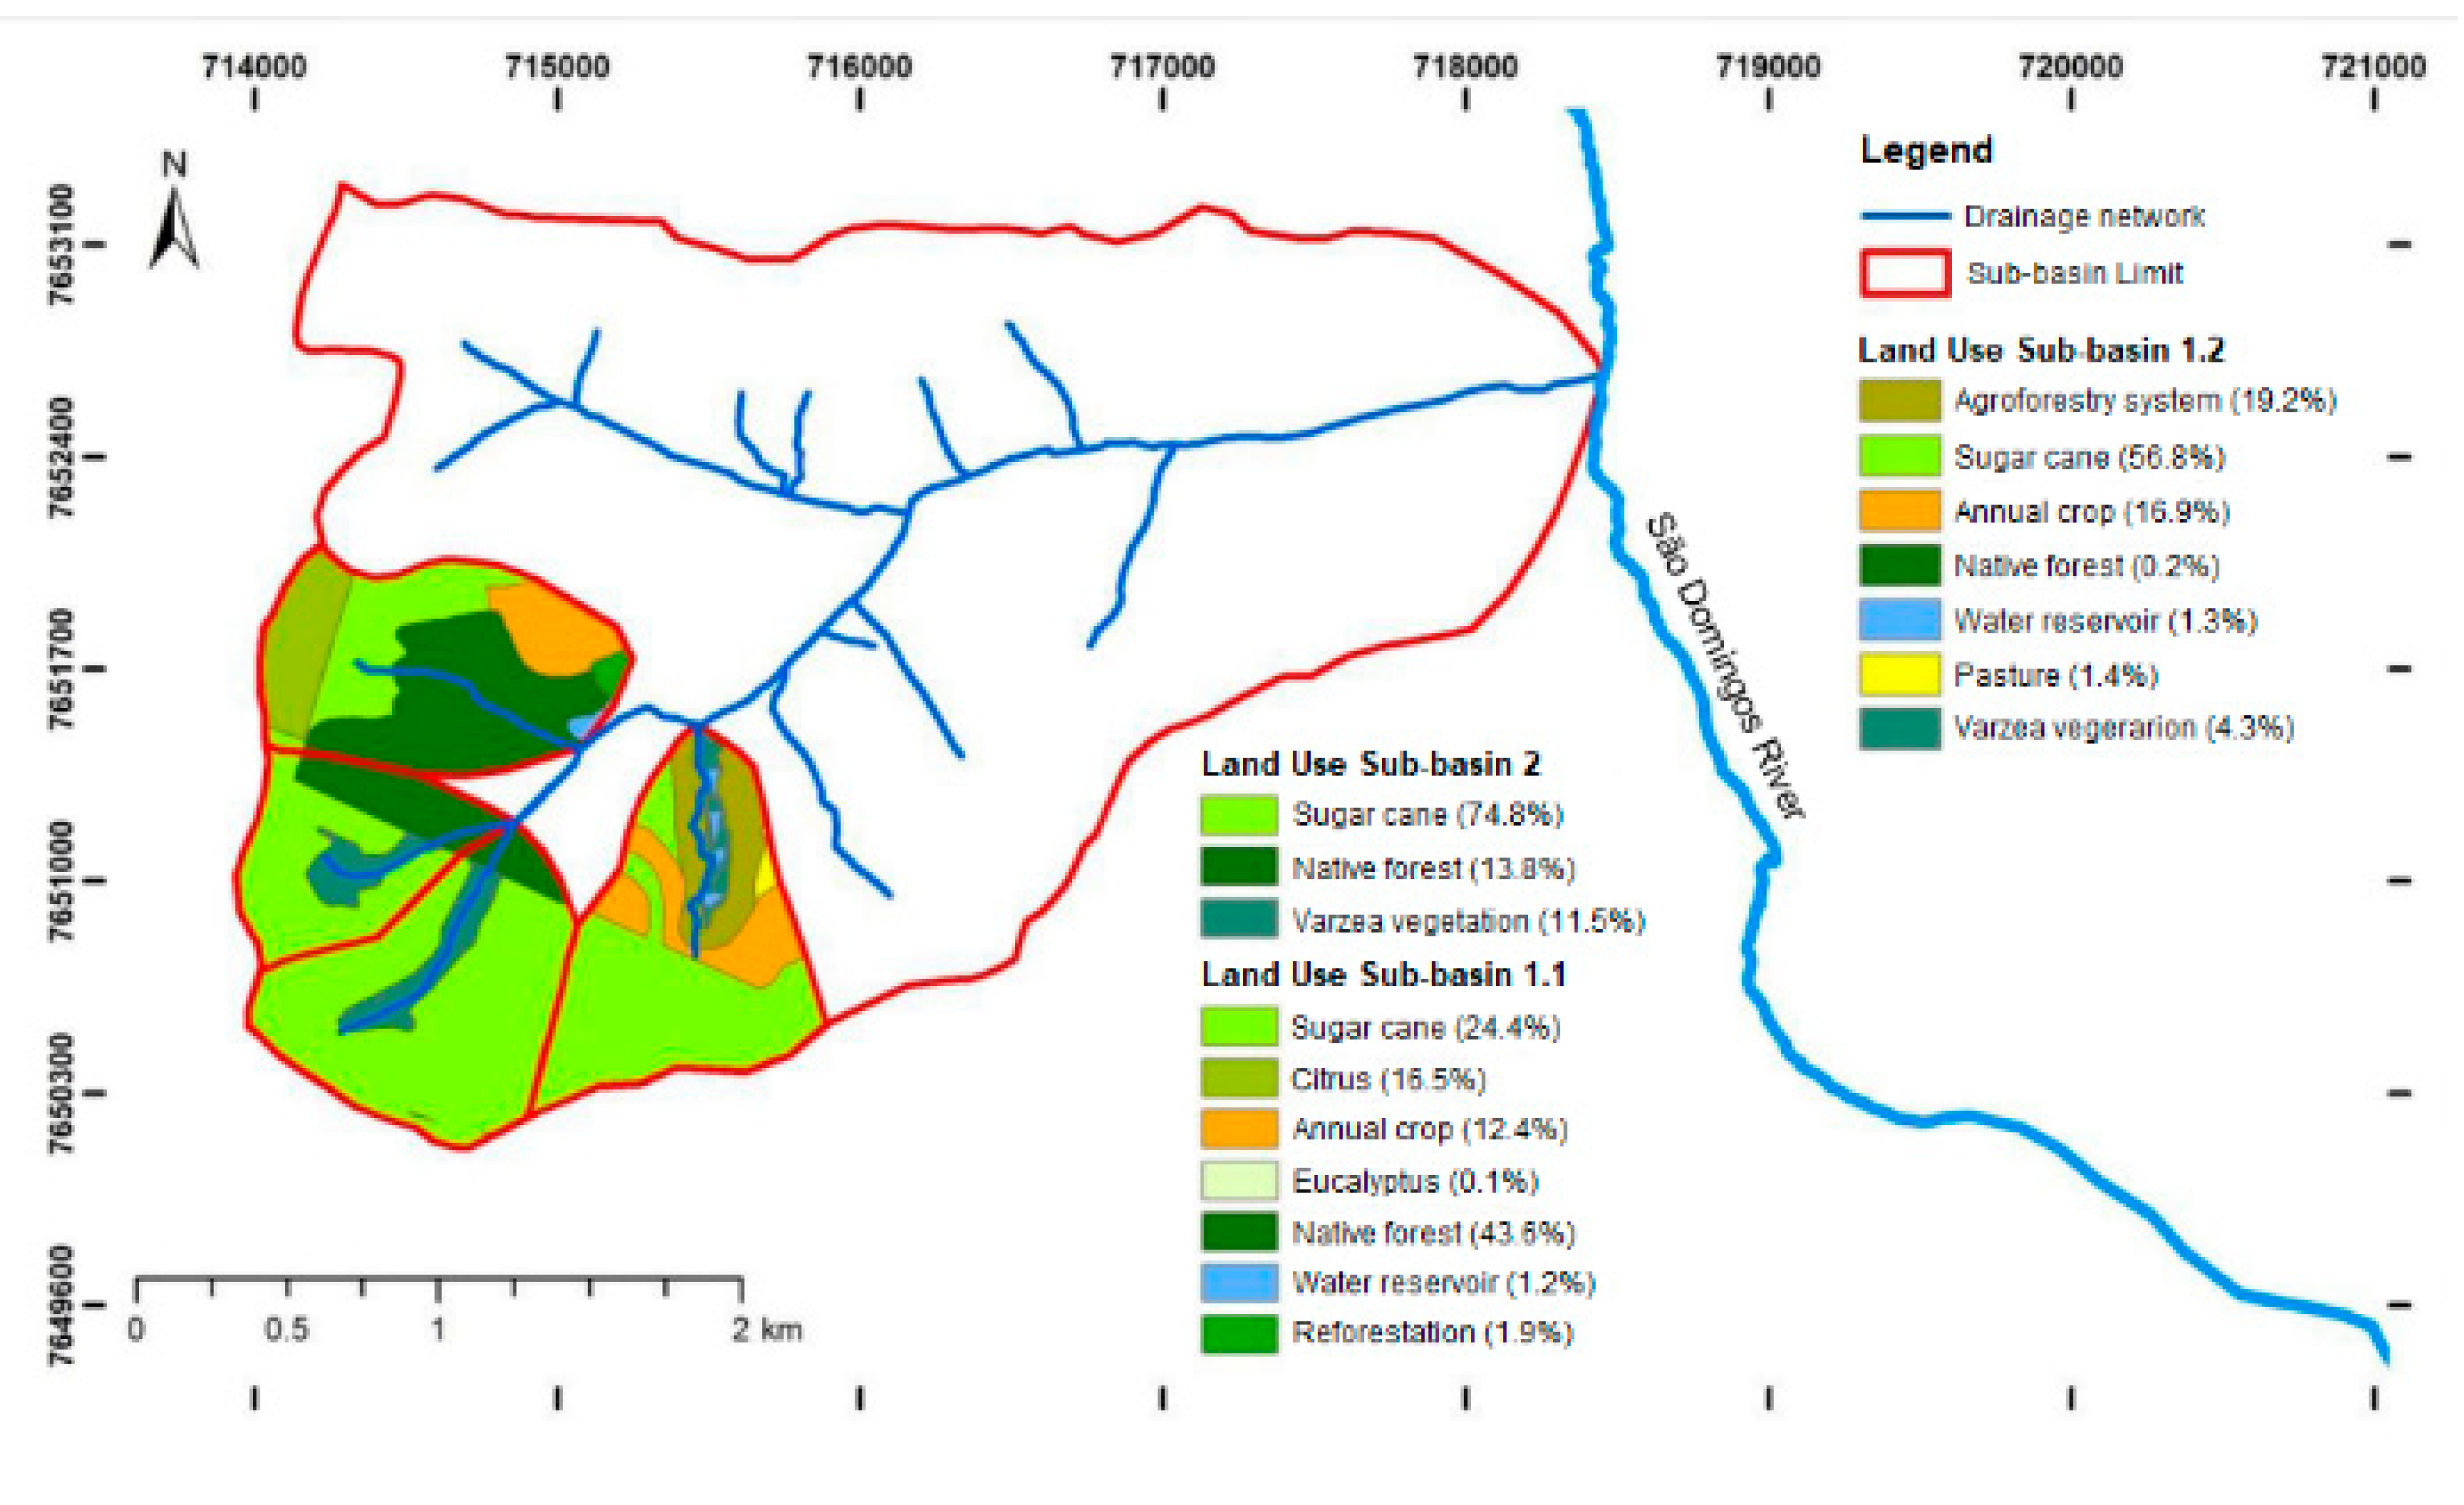
2. Study Area
3. Materials and Methods
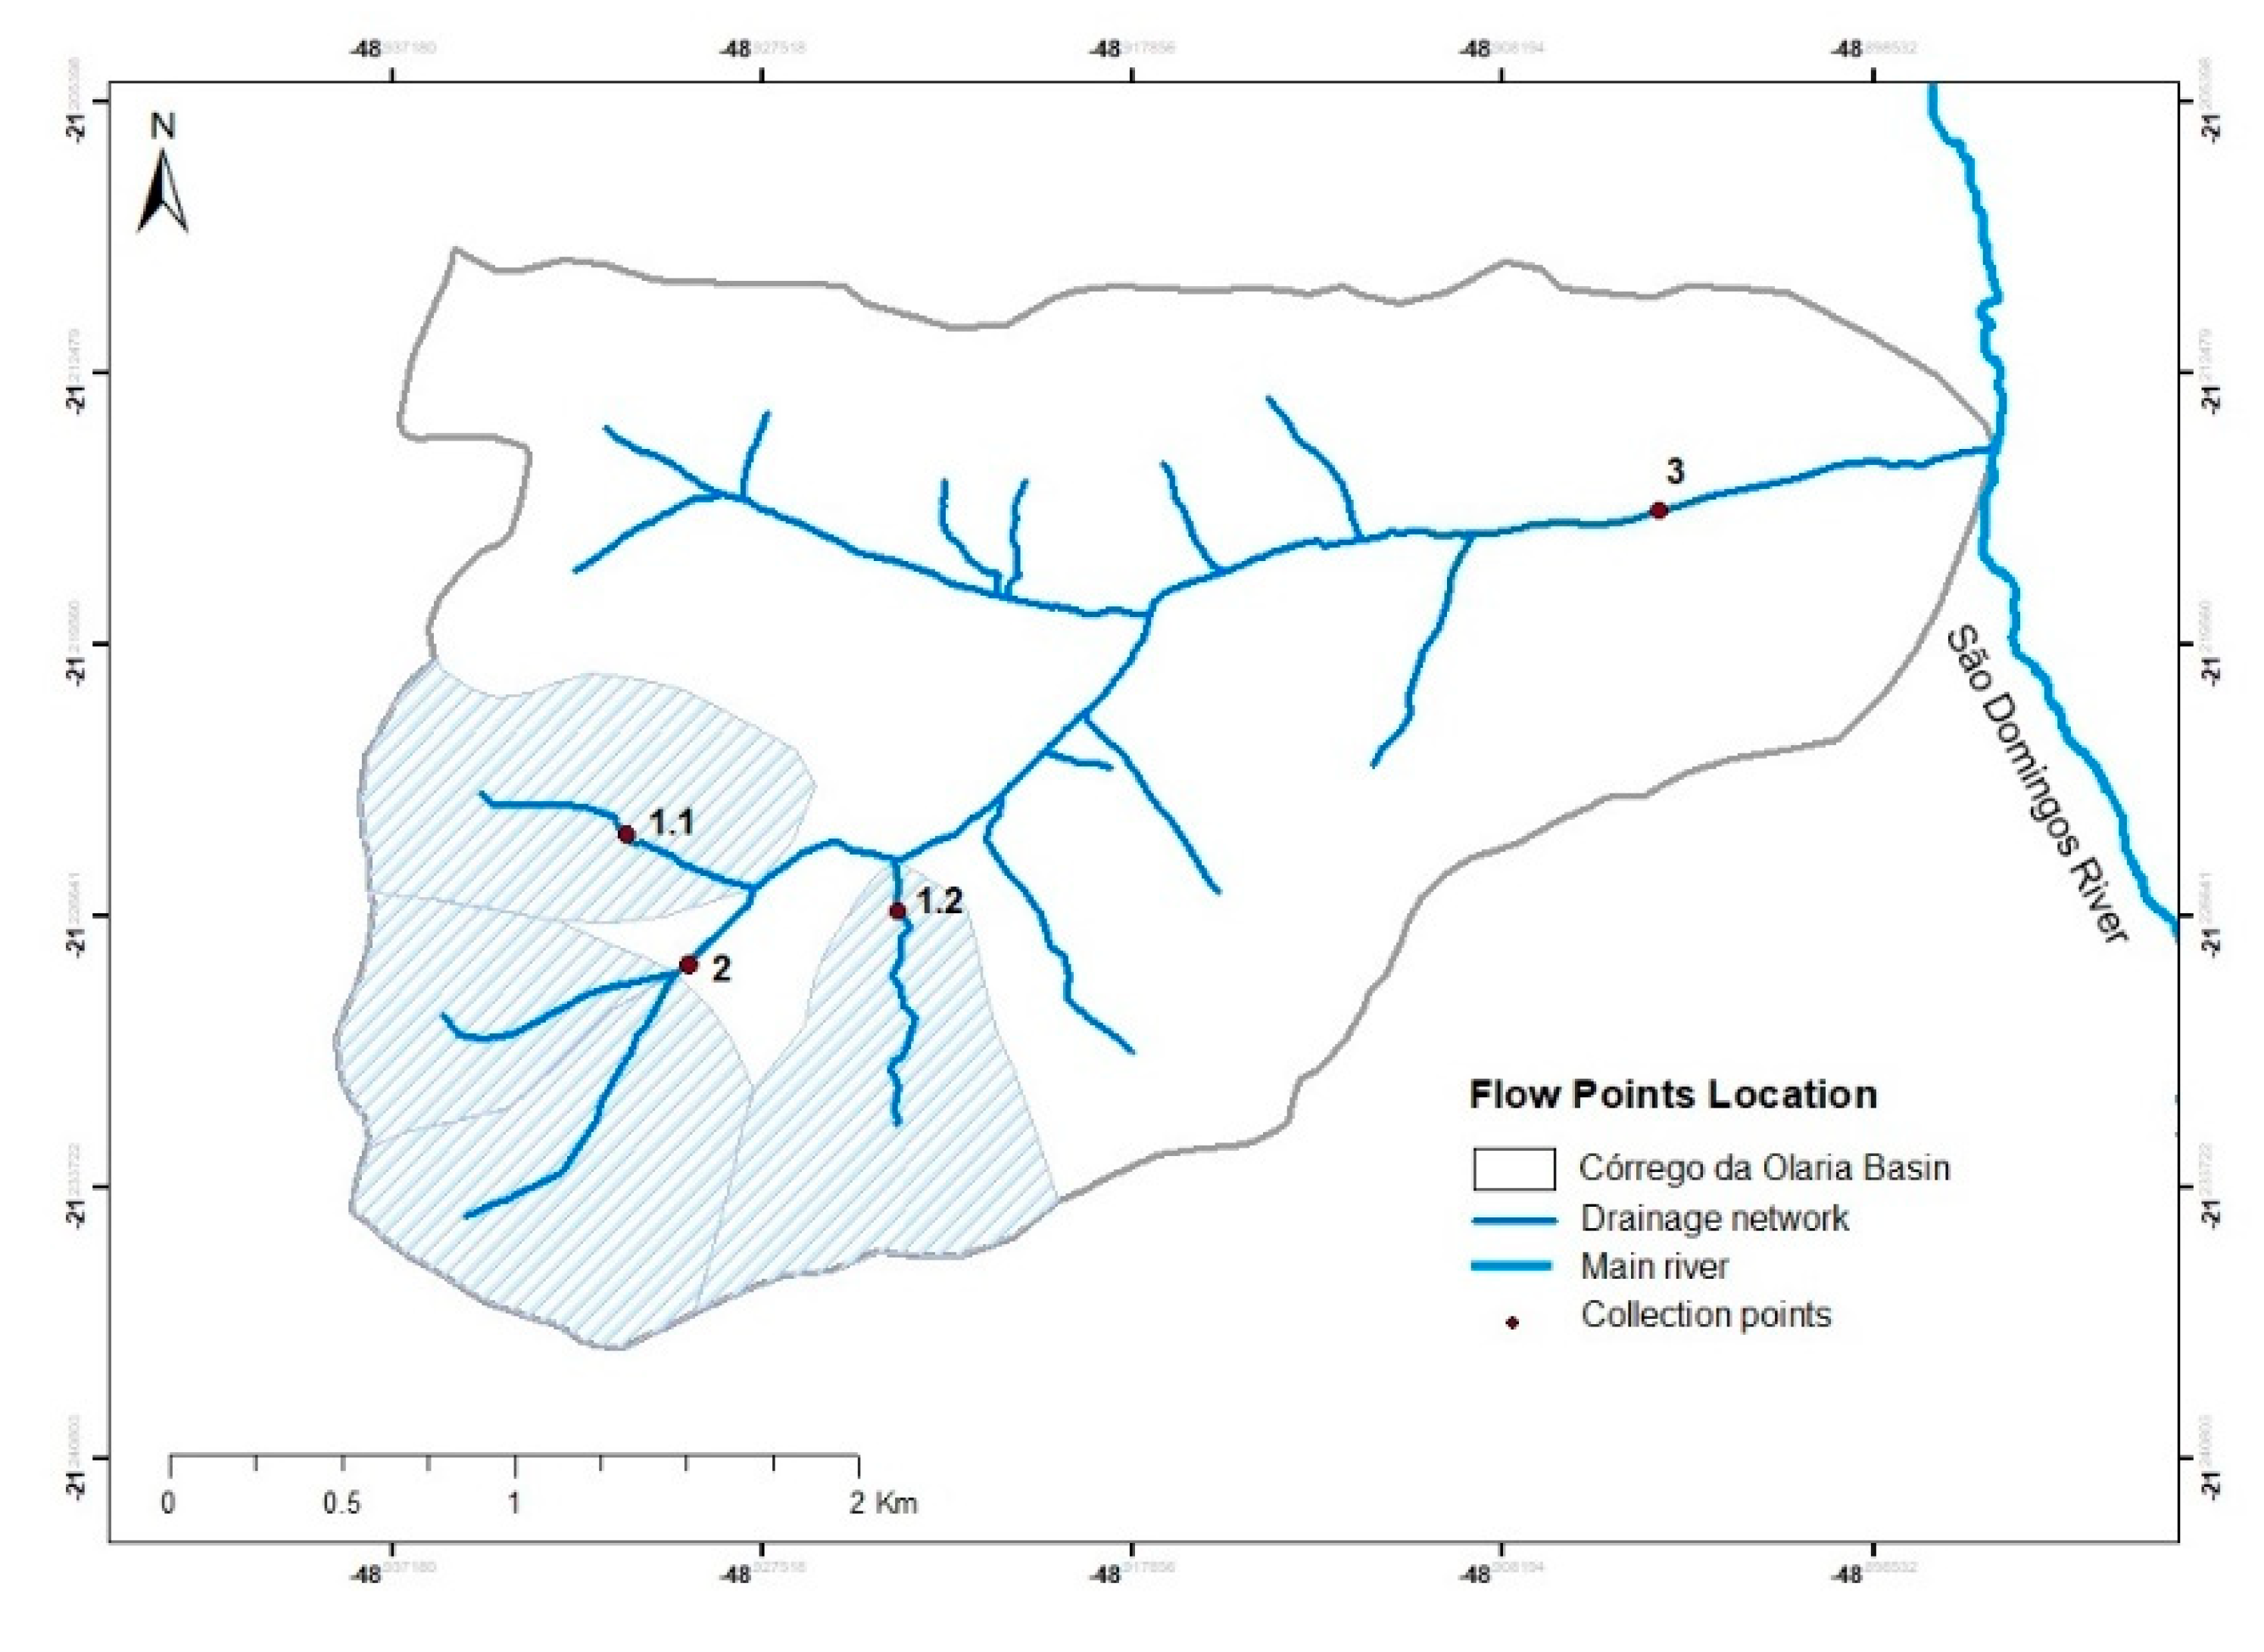
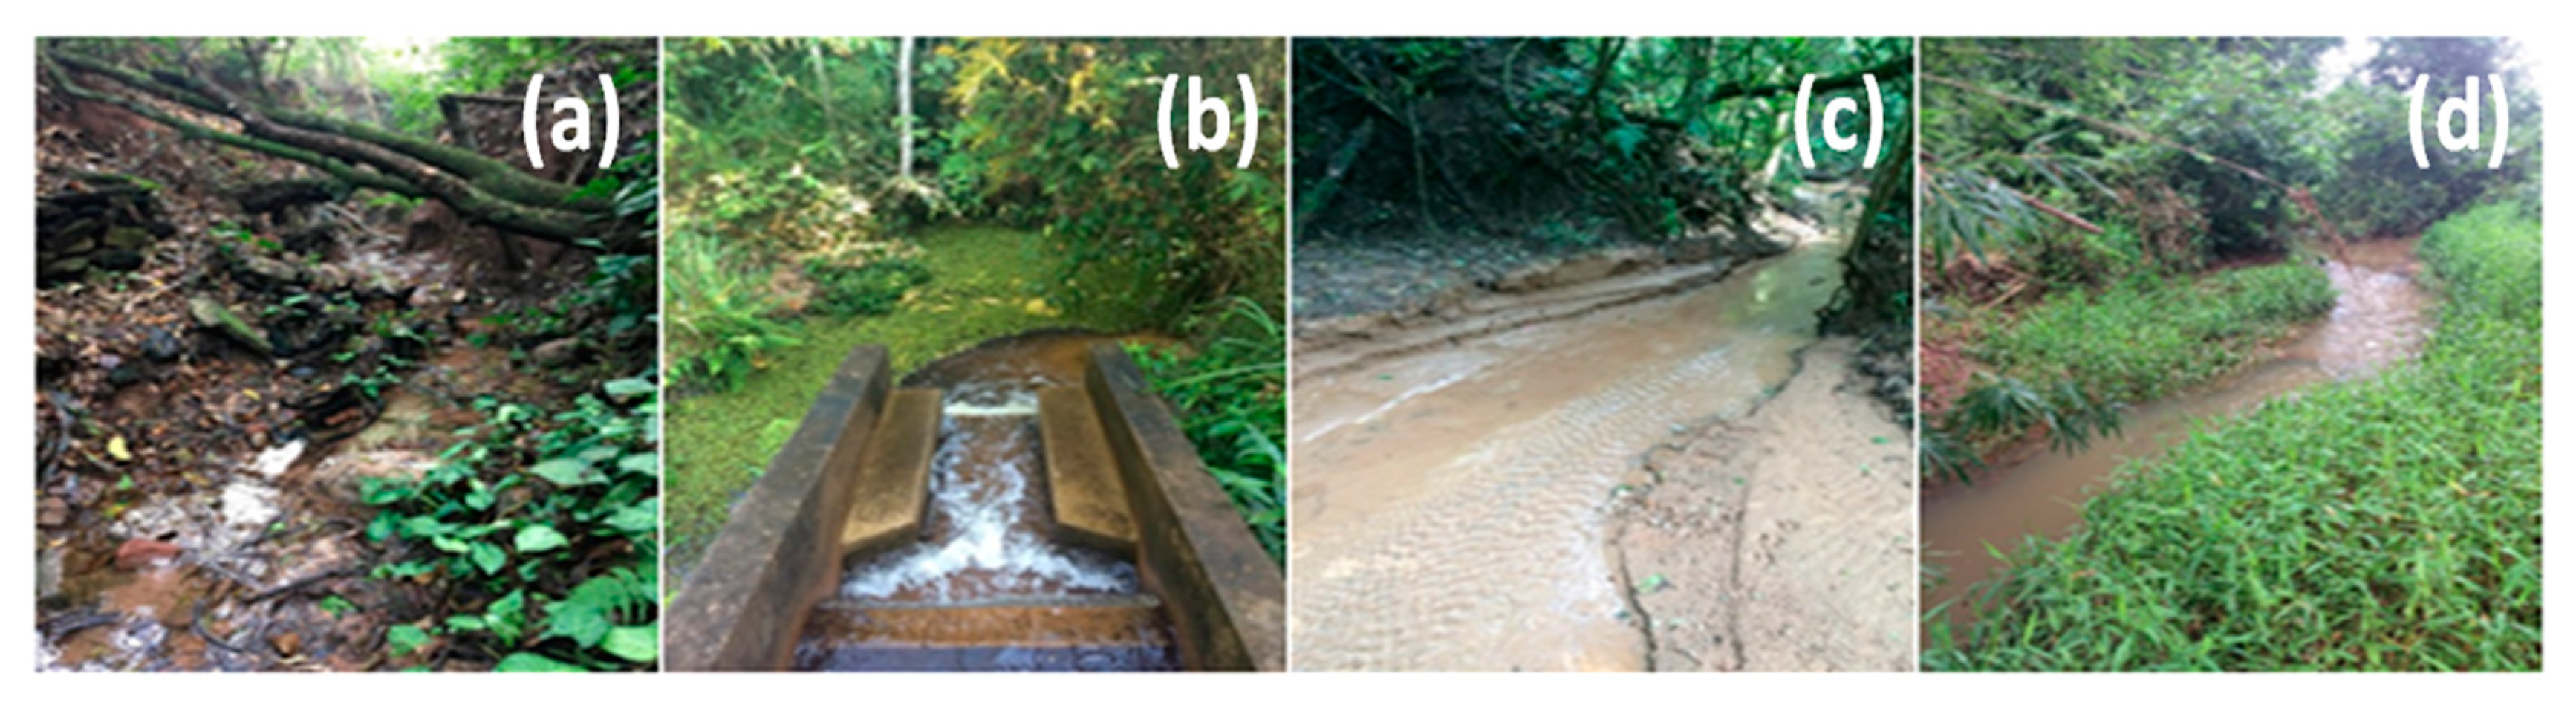
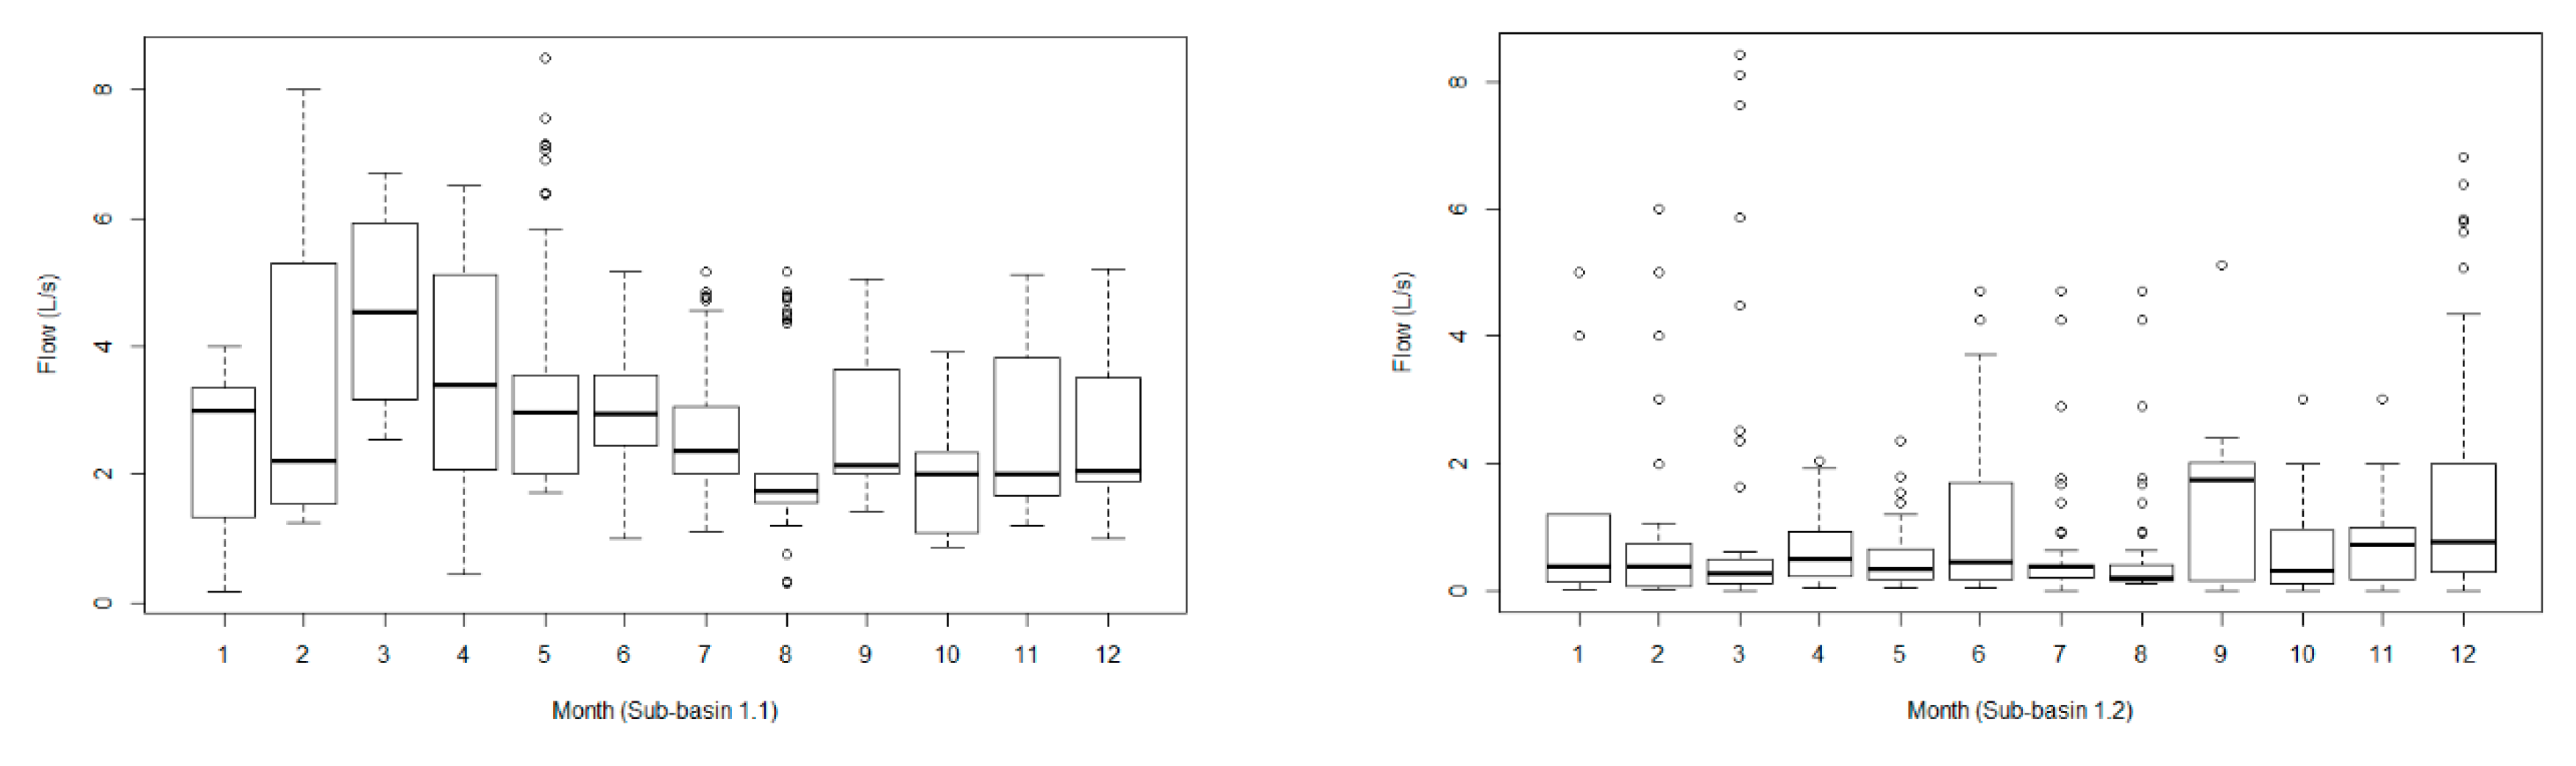
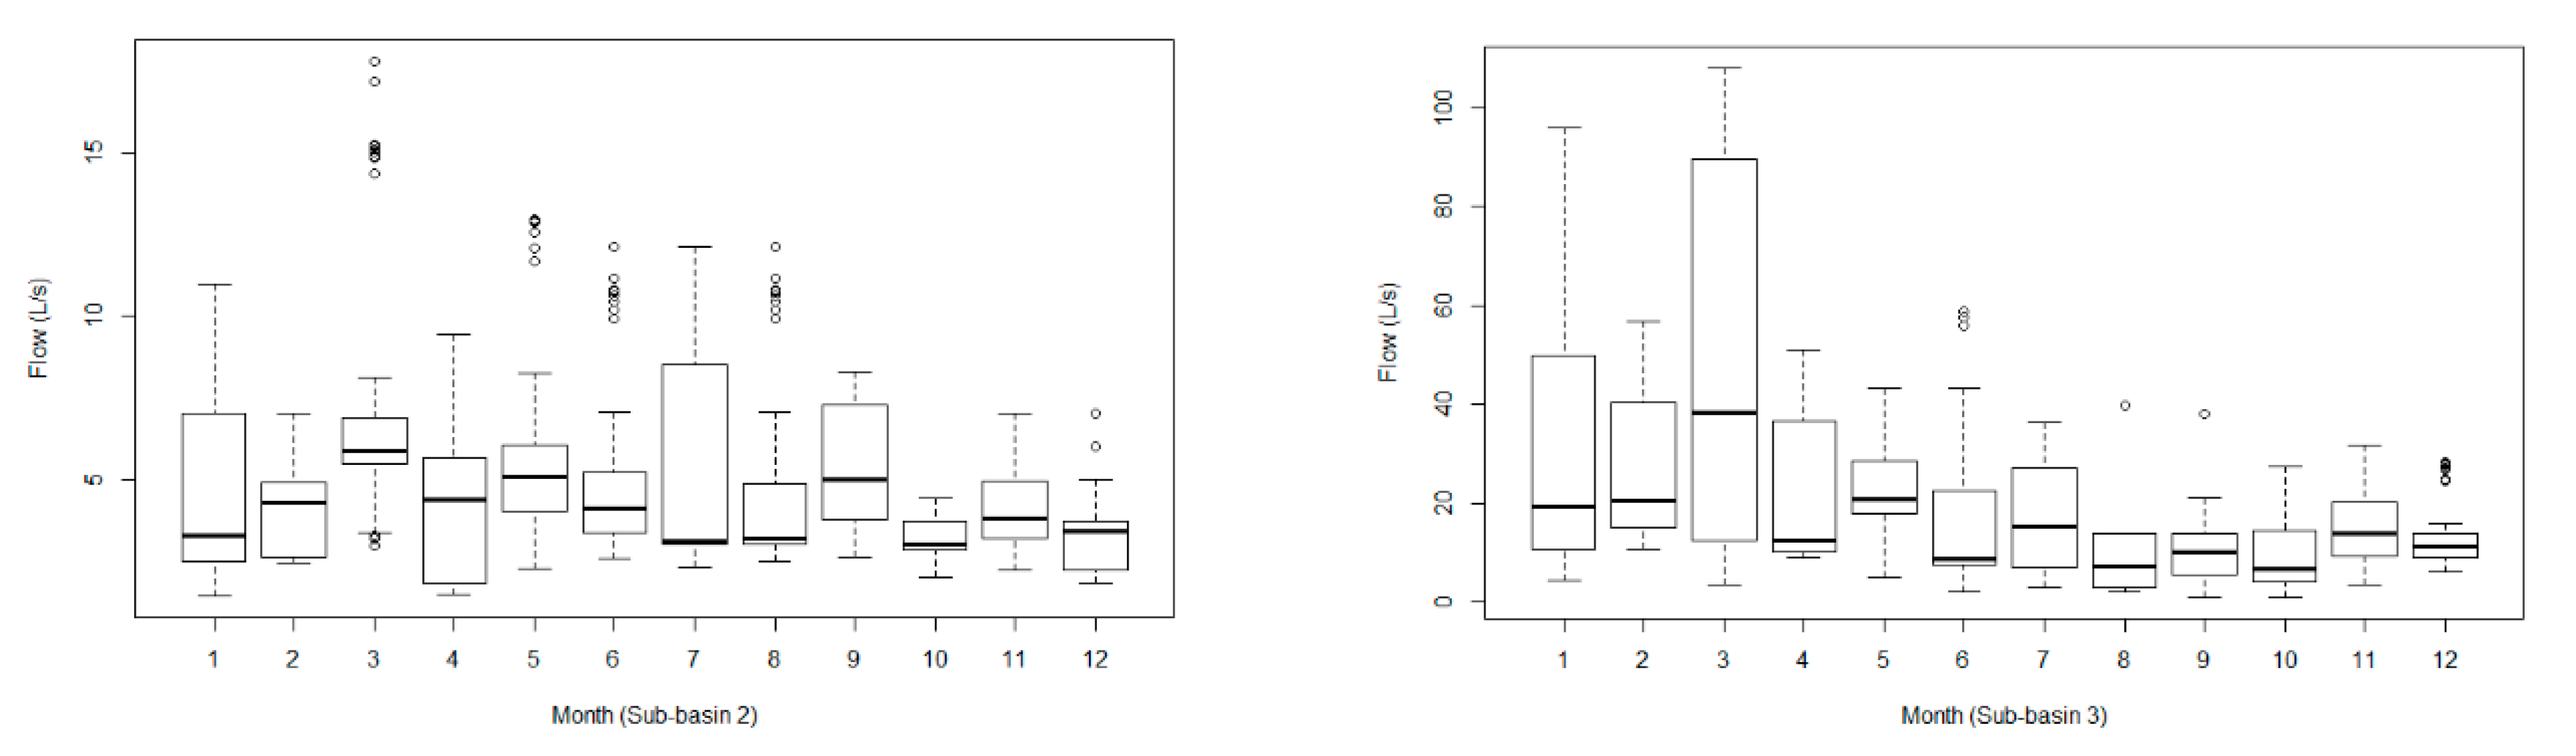
3.1. Discharge Flow Monitoring in Sub-Basins
3.2. Thematic Maps
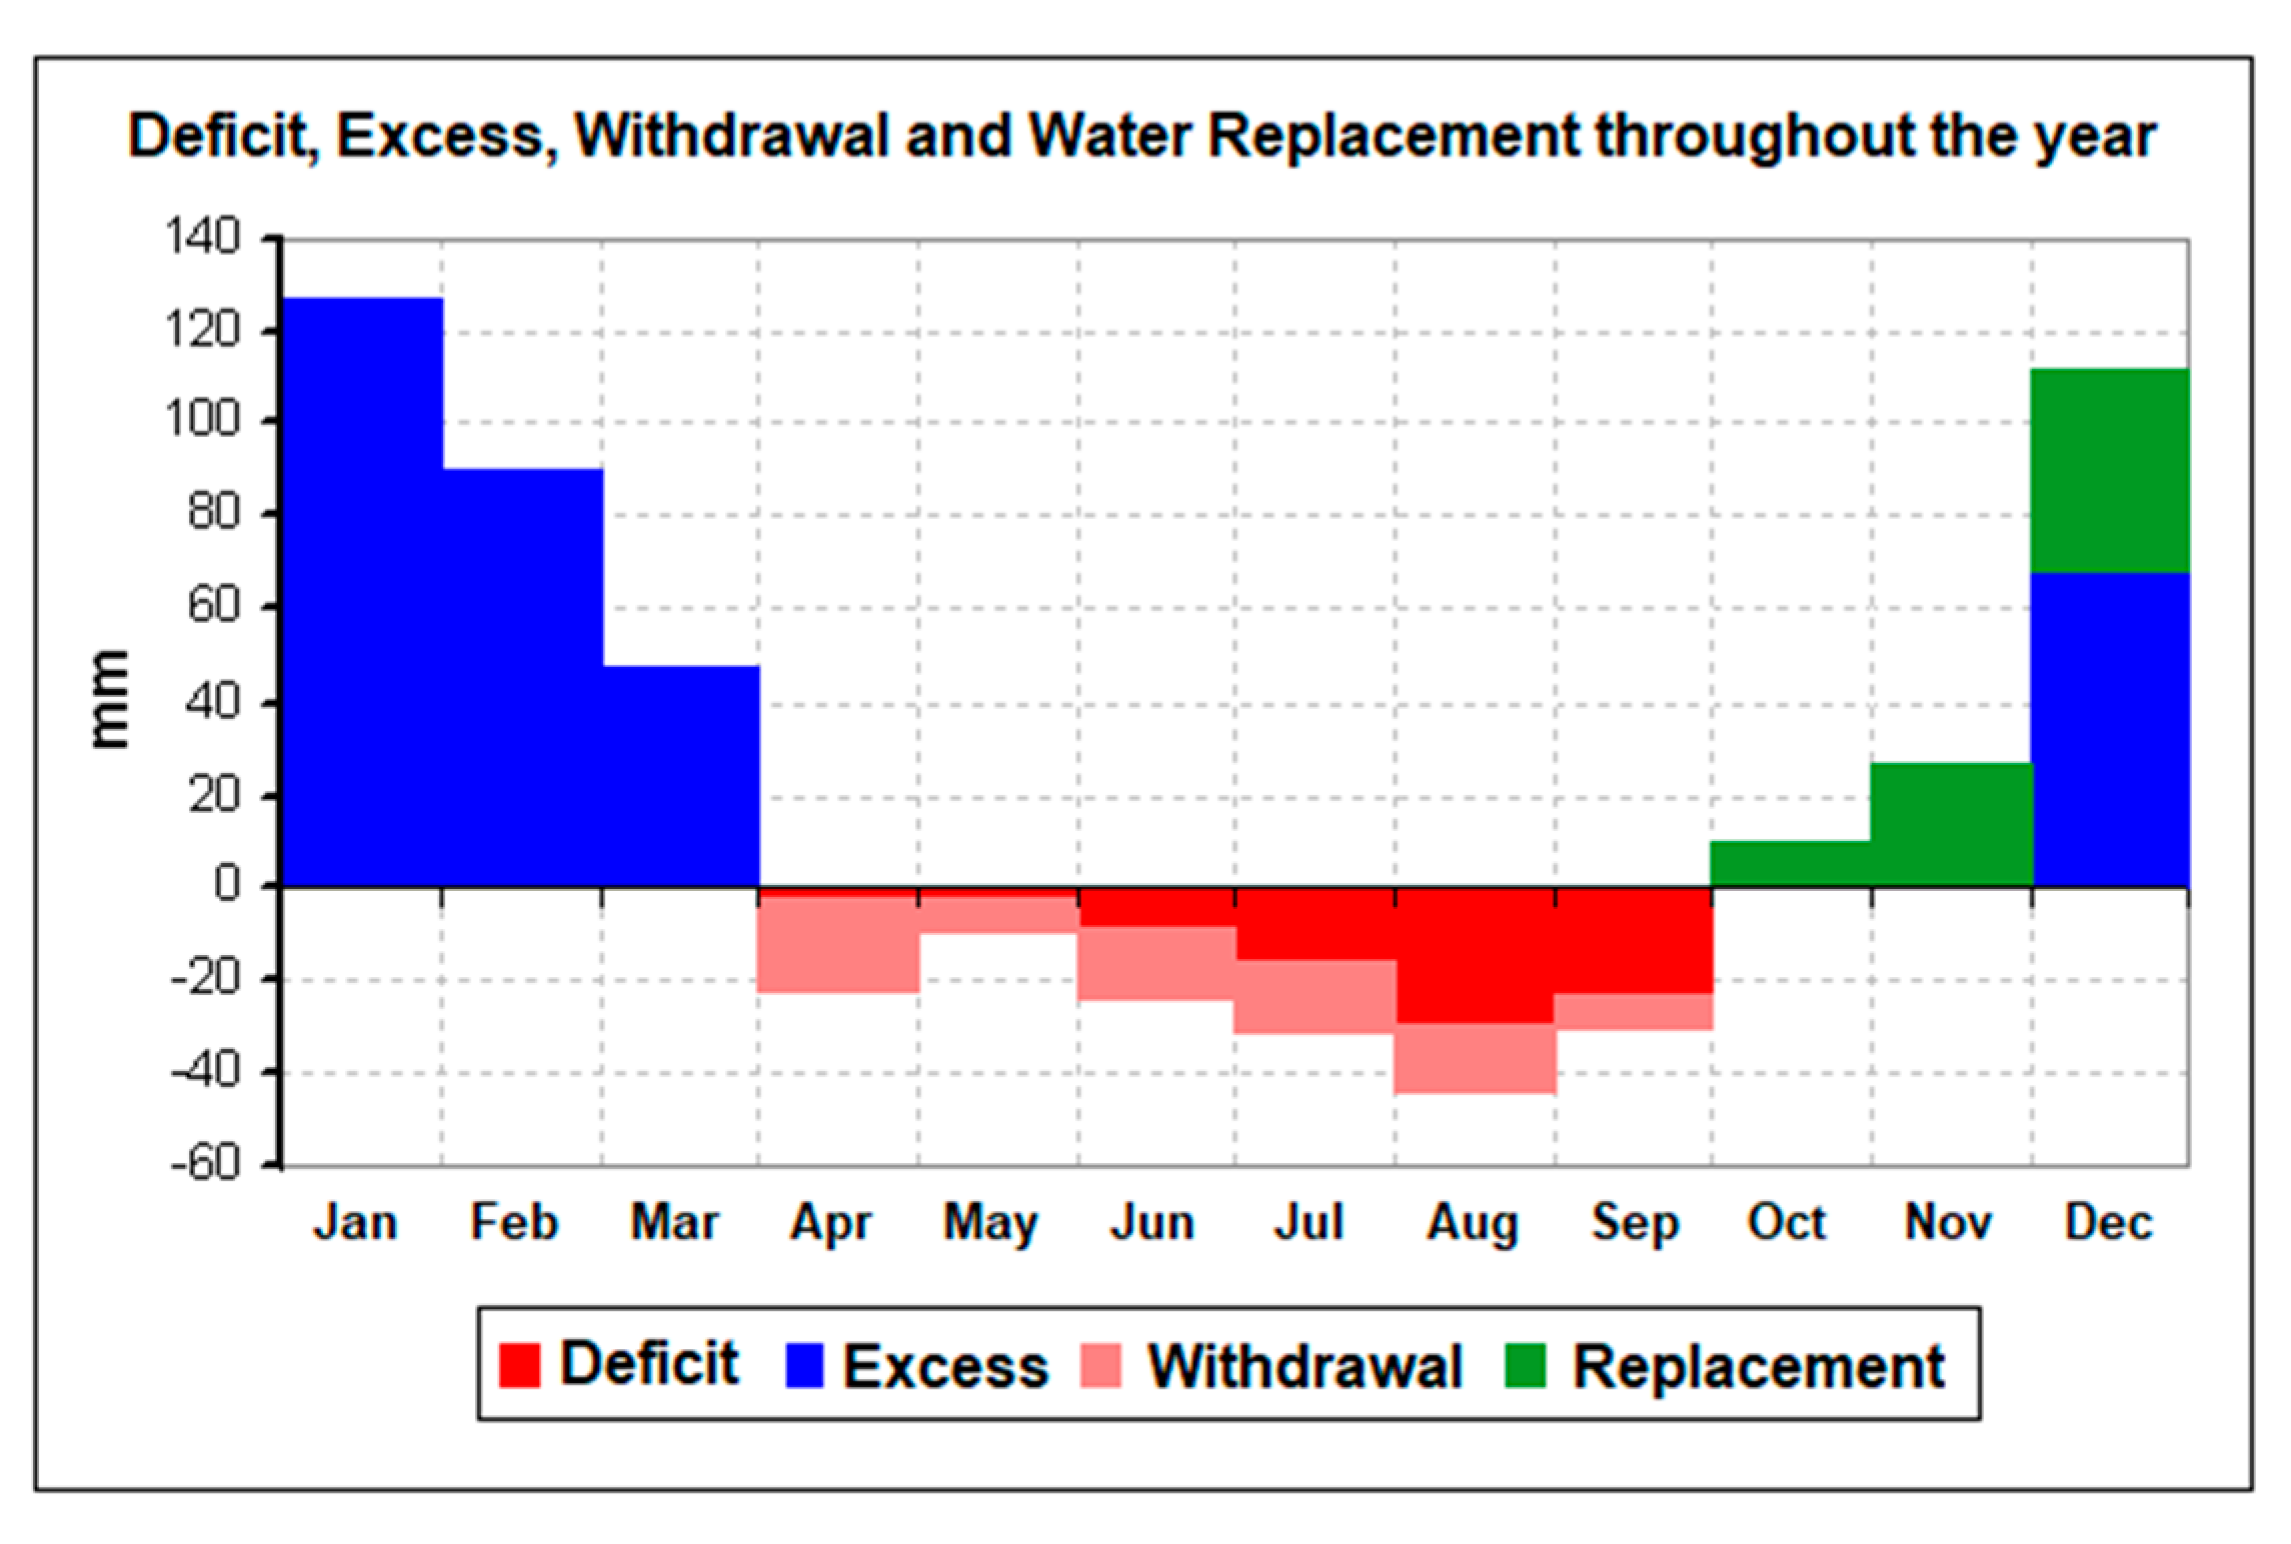
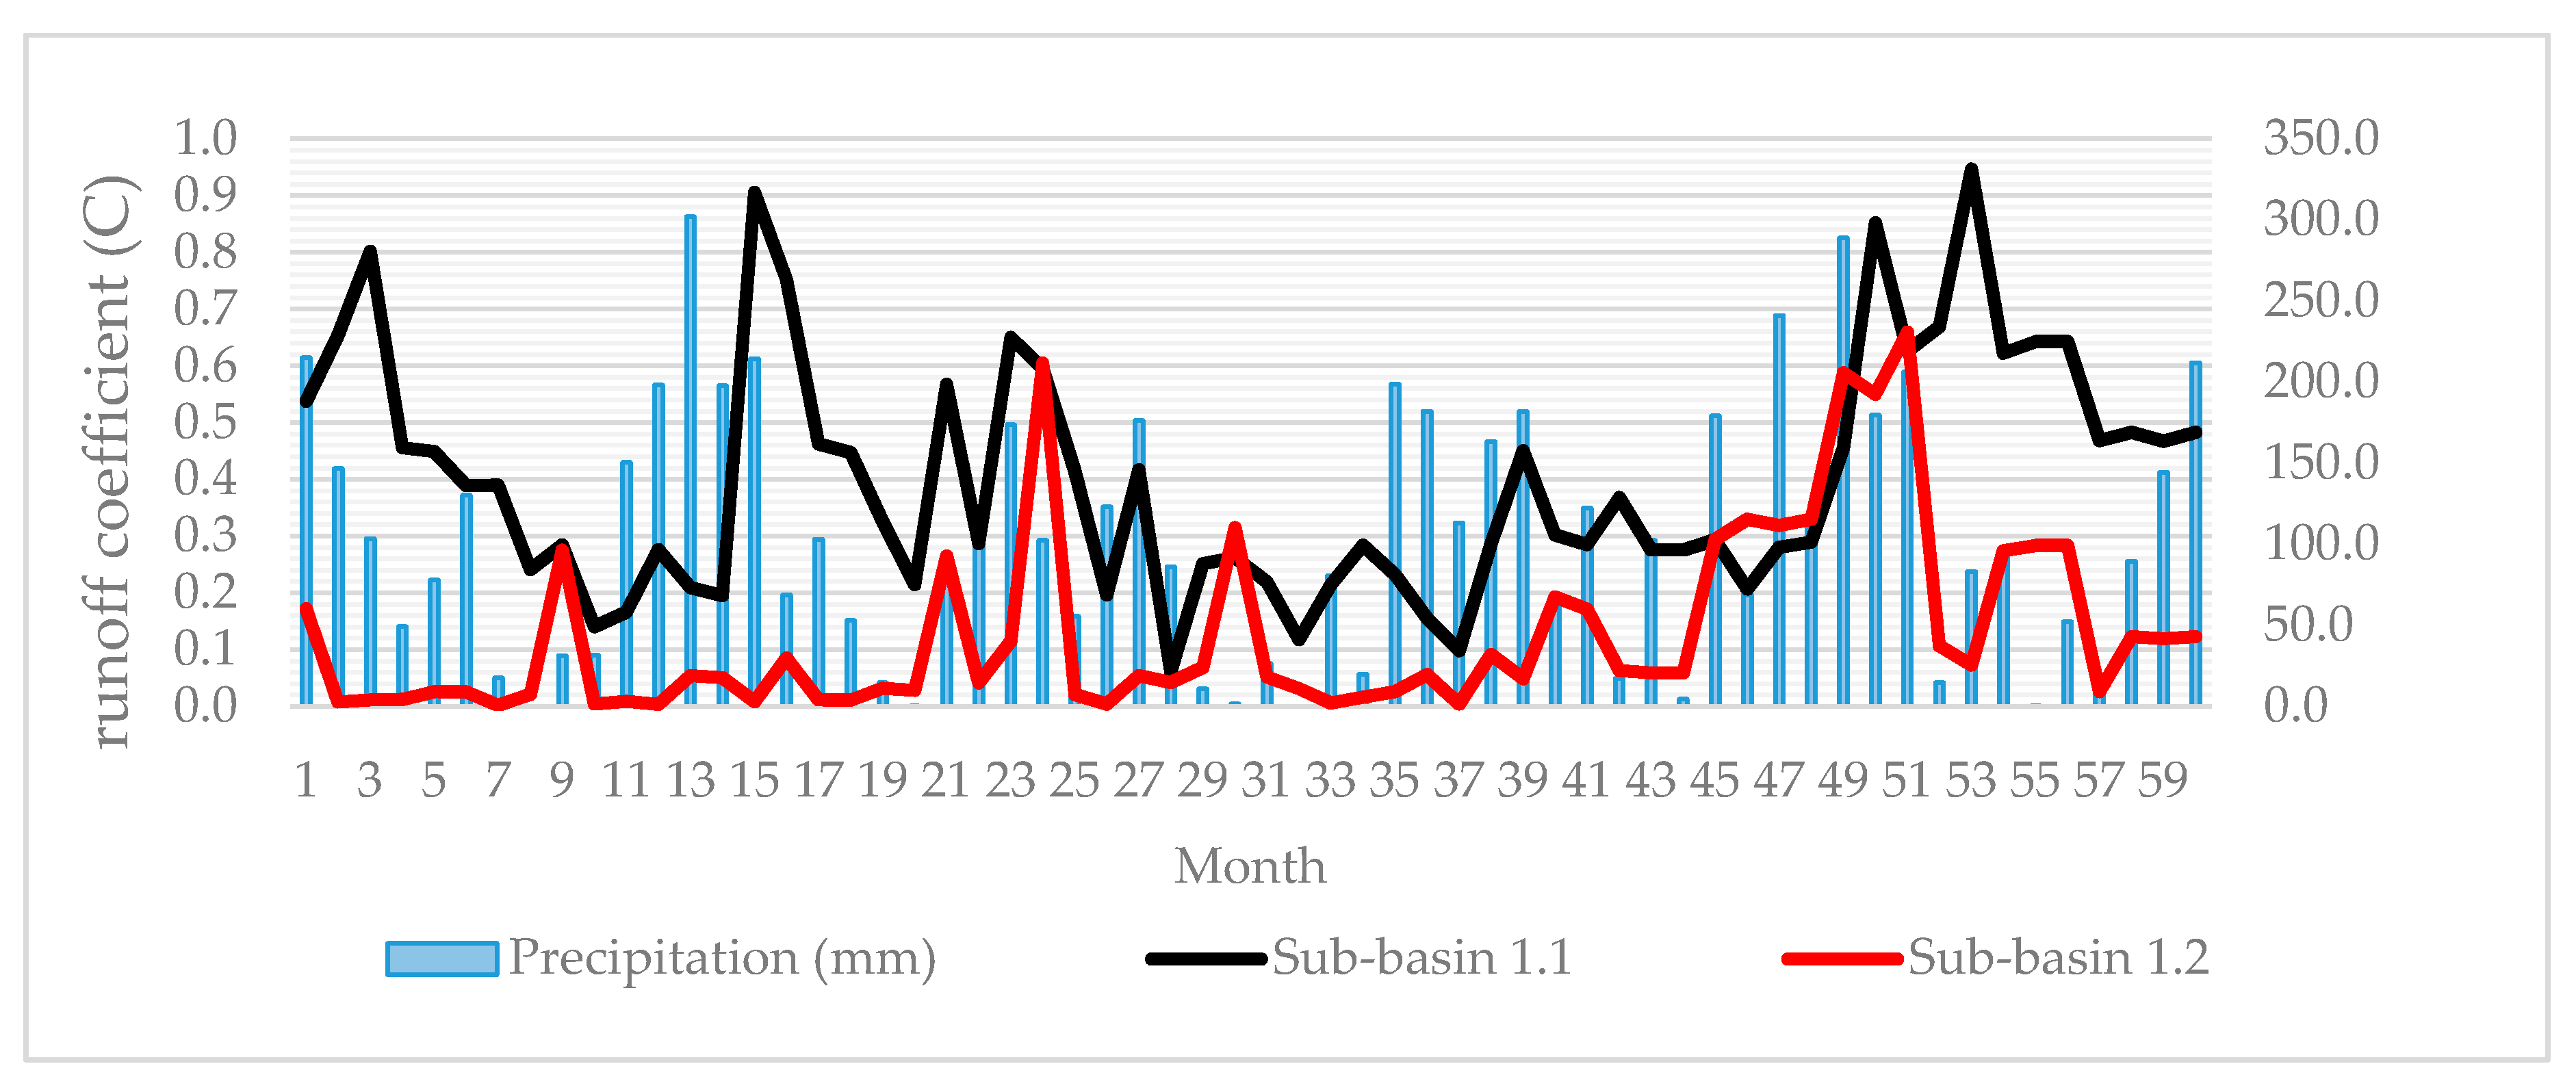
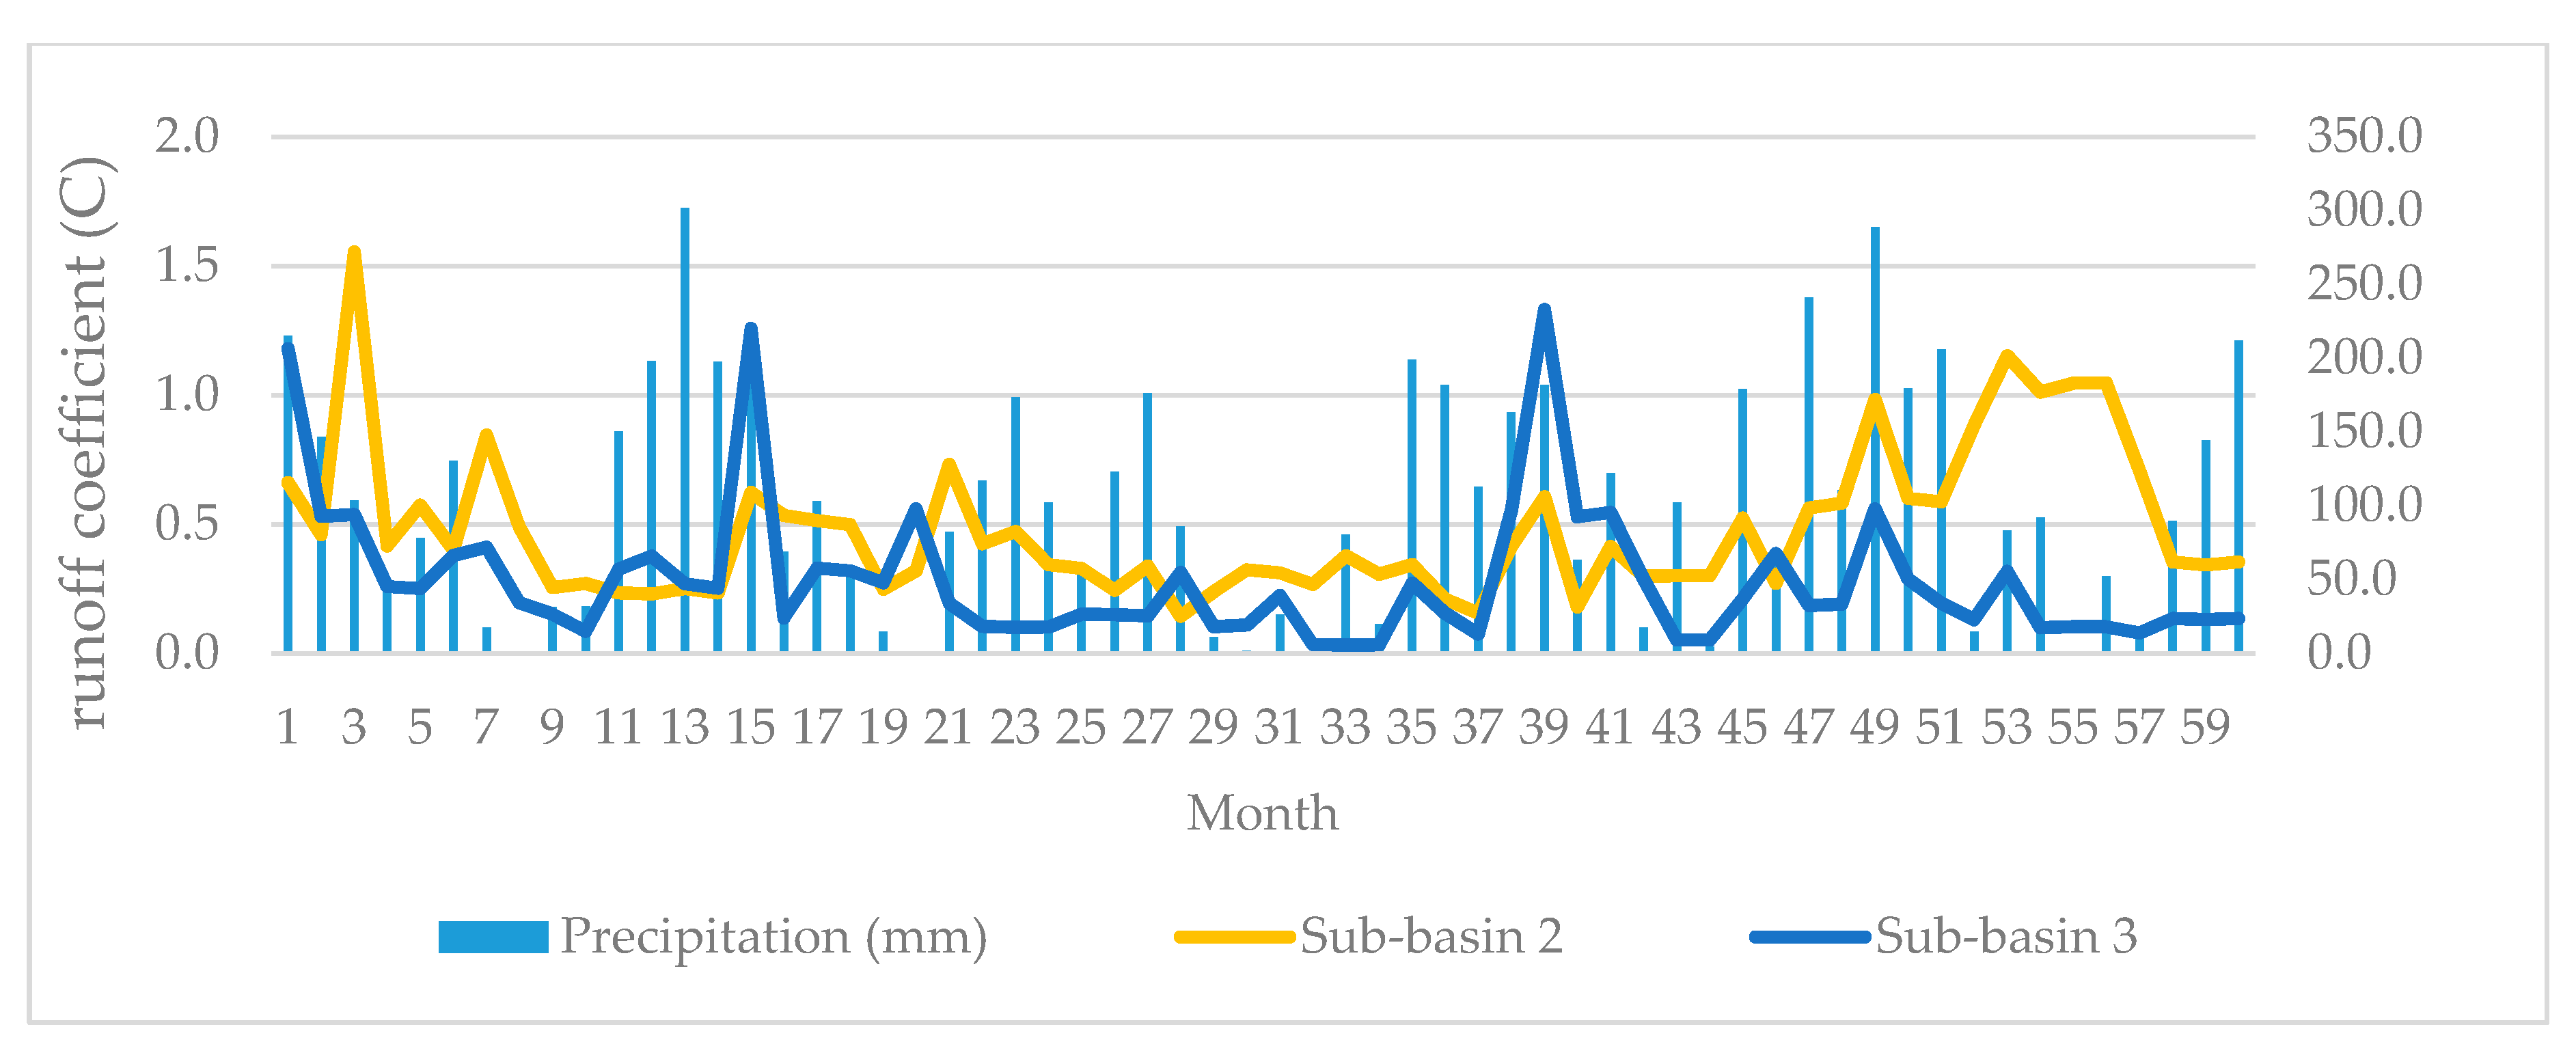
4. Results and Discussion
5. Conclusions
Author Contributions
Funding
Acknowledgments
Conflicts of Interest
References
- Academia Brasileira de Ciências-ABC. Recursos Hídricos no Brasil: Problemas, Desafios e Estratégias; Academia Brasileira de Ciências-ABC: Rio de Janeiro, Brazil, 2014; ISBN 9788585761363. [Google Scholar]
- United Nations Educational Scientific and Cultural Organization-UNESCO. Water Security and the Sustainable Development Goals; Global Water Security Issues (GWSI) Series, Series I; UNESCO Publishing: Paris, France, 2019; ISBN 9789231003233. [Google Scholar]
- Zogheib, C.; Ochoa-Tocachi, B.F.; Paul, J.D.; Hannah, D.M.; Clark, J.; Buytaert, W. Exploring a water data, evidence, and governance theory. Water Secur. 2018, 4, 19–25. [Google Scholar] [CrossRef]
- Keys, P.W.; Porkka, M.; Wang-Erlandsson, L.; Fetzer, I.; Gleeson, T.; Gordon, L.J. Invisible water security: Moisture recycling and water resilience. Water Secur. 2019, 8, 100046. [Google Scholar] [CrossRef] [PubMed]
- Van Oel, P.; Chukalla, A.; Vos, J.; Hellegers, P. Using indicators to inform the sustainable governance of water-for-food systems. Curr. Opin. Environ. Sustain. 2019, 40, 55–62. [Google Scholar] [CrossRef]
- Licciardello, F.; Piergiovanni, L. Packaging and food sustainability. In The Interaction of Food Industry and Environment; Galanakis, C., Ed.; Academic Press: Cambridge, MA, USA, 2020; pp. 191–222. ISBN 978-0-12-816449-5. [Google Scholar]
- Shiklomanov, I.A. World Water Resources: A New Appraisal and Assessment for the 21st Century: A Summary of the Monograph World Water Resources; UNESCO International Hydrological Programme, UNESCO-IHP: Paris, France, 1998; 37p. [Google Scholar]
- Agência Nacional de Águas (Brazilian National Water Agency)-ANA. Quantidade de água. Available online: https://www.ana.gov.br/panorama-das-aguas/quantidade-da-agua (accessed on 15 January 2020).
- Departamento de Águas e Energia Elétrica (Department of Water and Electricity)-DAEE Água. Available online: http://www.daee.sp.gov.br/index.php?option=com_content&view=article&id=50&Itemid=29 (accessed on 16 January 2020).
- United Nations Educational Scientifc and Cultural Organization-UNESCO. Relatório Mundial das Nações Unidas Sobre Desenvolvimento dos Recursos Hídricos 2016: Água e Emprego, Resumo Executivo; United Nations Educational Scientifc and Cultural Organization-UNESCO: Paris, France, 2016. [Google Scholar]
- Food and Agriculture Organization of the United Nations-FAO. The State of Food and Agriculture 2019. Moving Forward on Food Loss and Waste Reduction; Food and Agriculture Organization of the United Nations-FAO: Rome, Italy, 2019; ISBN 9781315764788. [Google Scholar]
- United Nations Water-UN-Water. Water Security & the Global Water Agenda: A UN-Water Analytical Brief; United Nations Universit, Institute for Water, Environment & Health (UNU-INWEH): Hamilton, ON, Canada, 2013; ISBN 9788578110796. [Google Scholar]
- Jepson, W.; Budds, J.; Eichelberger, L.; Harris, L.; Norman, E.; O’Reilly, K.; Pearson, A.; Shah, S.; Shinn, J.; Staddon, C.; et al. Advancing human capabilities for water security: A relational approach. Water Secur. 2017, 1, 46–52. [Google Scholar] [CrossRef]
- Tucci, C.; Chagas, M. Segurança hídrica: Conceitos e estratégia para Minas Gerais. REGA Porto Alegre 2018, 14, 1–12. [Google Scholar] [CrossRef]
- Gunda, T.; Hess, D.; Hornberger, G.M.; Worland, S. Water security in practice: The quantity-quality-society nexus. Water Secur. 2019, 6, 100022. [Google Scholar] [CrossRef]
- Garrick, D.; Iseman, T.; Gilson, G.; Brozovic, N.; O’Donnell, E.; Matthews, N.; Miralles-Wilhelm, F.; Wight, C.; Young, W. Scalable solutions to freshwater scarcity: Advancing theories of change to incentivise sustainable water use. Water Secur. 2020, 9, 100055. [Google Scholar] [CrossRef]
- Vieira, I.F.B.; Rolim Neto, F.C.; Carvalho, M.N.; Caldas, A.M.; Costa, R.C.A.; Silva, K.S.D.; Parahyba, R.D.B.V.; Pacheco, F.A.L.; Fernandes, L.F.S.; Pissarra, T.C.T. Water Security Assessment of Groundwater Quality in an Anthropized Rural Area from the Atlantic Forest Biome in Brazil. Water 2020, 12, 623. [Google Scholar] [CrossRef] [Green Version]
- Tundisi, J.G.; Tundisi, T.M. As múltiplas dimensões da crise hídrica. Rev. USP 2015, 106, 21–30. [Google Scholar] [CrossRef] [Green Version]
- Purvis, L.; Dinar, A. Are intra- and inter-basin water transfers a sustainable policy intervention for addressing water scarcity? Water Secur. 2020, 9, 100058. [Google Scholar] [CrossRef]
- Flörke, M.; Schneider, C.; McDonald, R.I. Water competition between cities and agriculture driven by climate change and urban growth. Nat. Sustain. 2018, 1, 51–58. [Google Scholar] [CrossRef]
- Marengo, J.A.; Alves, L.M. Crise Hídrica em São Paulo em 2014: Seca e Desmatamento. GEOUSP Espaço e Tempo 2015, 19, 485. [Google Scholar] [CrossRef] [Green Version]
- Soriano, É.; Londe, L.D.R.; Di Gregorio, L.T.; Coutinho, M.P.; Santos, L.B.L. Crise hídrica em São Paulo sob o ponto de vista dos desastres. Ambient. Soc. 2016, 19, 21–42. [Google Scholar] [CrossRef] [Green Version]
- Empinotti, V.L.; Budds, J.; Aversa, M. Governance and water security: The role of the water institutional framework in the 2013–15 water crisis in São Paulo, Brazil. Geoforum 2019, 98, 46–54. [Google Scholar] [CrossRef] [Green Version]
- Tundisi, J.G. Governança da água. Rev. Univ. Fed. Minas Gerais 2013, 20, 223–235. [Google Scholar] [CrossRef]
- Simedo, M.B.L.; Martins, A.L.M.; Pissarra, T.C.T.; Lopes, M.C.; Costa, R.C.A.; Valle-Junior, R.F.; Campanelli, L.C.; Rojas, N.E.T.; Finoto, E.L. Effect of watershed land use on water quality: A case study in Córrego da Olaria Basin, São Paulo State, Brazil. Braz. J. Biol. 2018, 78, 625–635. [Google Scholar] [CrossRef] [Green Version]
- Pissarra, T.C.T.; Valera, C.A.; Costa, R.C.A.; Siqueira, H.E.; Martins Filho, M.V.; Valle Júnior, R.F.D.; Sanches Fernandes, L.F.; Pacheco, F.A.L. A Regression Model of Stream Water Quality Based on Interactions between Landscape Composition and Riparian Buffer Width in Small Catchments. Water 2019, 11, 1757. [Google Scholar] [CrossRef] [Green Version]
- Valera, C.; Pissarra, T.; Filho, M.; Valle Júnior, R.; Oliveira, C.; Moura, J.; Sanches Fernandes, L.; Pacheco, F. The Buffer Capacity of Riparian Vegetation to Control Water Quality in Anthropogenic Catchments from a Legally Protected Area: A Critical View over the Brazilian New Forest Code. Water 2019, 11, 549. [Google Scholar] [CrossRef] [Green Version]
- Ulibarri, N.; Escobedo Garcia, N. Comparing Complexity in Watershed Governance: The Case of California. Water 2020, 12, 766. [Google Scholar] [CrossRef] [Green Version]
- Rodrigues, V.; Sansígolo, C.; Cicco, L.; Viana, S.; Coneglian, A.; Haas, J. Avaliação do fluxo de água dos canais nas ruas de Freiburg-Alemanha. Rev. Científica Eletrôn. Engenharia Florestal Garça 2012, 19, 13–22. [Google Scholar]
- Marmontel, C.V.F.; Rodrigues, V.A. Parâmetros Indicativos para Qualidade da Água em Nascentes com Diferentes Coberturas de Terra e Conservação da Vegetação Ciliar Indicative Parameters for Water Quality in Water Springs with Different Land Cover and Conservation of Riparian Vegetation. Floresta e Ambiente 2015, 22, 171–181. [Google Scholar] [CrossRef] [Green Version]
- Debastiani, A.B.; Silva, R.D.A.D.; Rafaeli Neto, S.L. Eficácia da arquitetura MLP em modo closed-loop para simulação de um Sistema Hidrológico. RBRH 2016, 21, 821–831. [Google Scholar] [CrossRef] [Green Version]
- McNally, A.; Verdin, K.; Harrison, L.; Getirana, A.; Jacob, J.; Shukla, S.; Arsenault, K.; Peters-Lidard, C.; Verdin, J.P. Acute Water-Scarcity Monitoring for Africa. Water 2019, 11, 1968. [Google Scholar] [CrossRef] [Green Version]
- Lindhe, A.; Rosén, L.; Johansson, P.O.; Norberg, T. Dynamic water balance modelling for risk assessment and decision support on MAR potential in Botswana. Water 2020, 12, 721. [Google Scholar] [CrossRef] [Green Version]
- Tariq, M.A.U.R.; van de Giesen, N.; Janjua, S.; Shahid, M.L.U.R.; Farooq, R. An engineering perspective of water sharing issues in Pakistan. Water 2020, 12, 477. [Google Scholar] [CrossRef] [Green Version]
- Citrini, A.; Camera, C.; Beretta, G. Pietro Nossana Spring (Northern Italy) under Climate Change: Projections of Future Discharge Rates and Water Availability. Water 2020, 12, 387. [Google Scholar] [CrossRef] [Green Version]
- Honda, E.A.; Durigan, G. A restauração de ecossistemas e a produção de água. Hoehnea 2017, 44, 315–327. [Google Scholar] [CrossRef] [Green Version]
- Zhang, S.; Li, W.; Lei, X.; Ding, X.; Zhang, T. Implementation methods and applications of flow visualization in a watershed simulation platform. Adv. Eng. Softw. 2017, 112, 66–75. [Google Scholar] [CrossRef]
- Caldas, A.; Pissarra, T.; Costa, R.; Neto, F.; Zanata, M.; Parahyba, R.; Sanches Fernandes, L.; Pacheco, F. Flood Vulnerability, Environmental Land Use Conflicts, and Conservation of Soil and Water: A Study in the Batatais SP Municipality, Brazil. Water 2018, 10, 1357. [Google Scholar] [CrossRef] [Green Version]
- Park, Y.; Kim, Y.; Park, S.K.; Shin, W.J.; Lee, K.S. Water quality impacts of irrigation return flow on stream and groundwater in an intensive agricultural watershed. Sci. Total Environ. 2018, 630, 859–868. [Google Scholar] [CrossRef]
- Choto, M.; Fetene, A. Impacts of land use/land cover change on stream flow and sediment yield of Gojeb watershed, Omo-Gibe basin, Ethiopia. Remote Sens. Appl. Soc. Environ. 2019, 14, 84–99. [Google Scholar] [CrossRef]
- Miraji, M.; Liu, J.; Zheng, C. The Impacts of Water Demand and Its Implications for Future Surface Water Resource Management. Water 2019, 11, 2–11. [Google Scholar]
- Santos, R.M.B.; Sanches Fernandes, L.F.; Vitor Cortes, R.M.; Leal Pacheco, F.A. Hydrologic Impacts of Land Use Changes in the Sabor River Basin: A Historical View and Future Perspectives. Water 2019, 11, 1464. [Google Scholar] [CrossRef] [Green Version]
- Ul Hasson, S.; Saeed, F.; Böhner, J.; Schleussner, C.F. Water availability in Pakistan from Hindukush–Karakoram–Himalayan watersheds at 1.5 °C and 2 °C Paris Agreement targets. Adv. Water Resour. 2019, 131, 103365. [Google Scholar] [CrossRef]
- Hernández-Guzmán, R.; Ruiz-Luna, A.; Cervantes-Escobar, A. Environmental flow assessment for rivers feeding a coastal wetland complex in the Pacific coast of northwest Mexico. Water Environ. J. 2019, 33, 536–546. [Google Scholar] [CrossRef]
- Thakur, J.K.; Khanal, K.; Poudyal, K. Land cover changes for enhancing water availability in watersheds of tanahun and kaski, Nepal. J. Water Clim. Chang. 2019, 10, 431–448. [Google Scholar] [CrossRef]
- Bessa Santos, R.M.; Sanches Fernandes, L.F.; Vitor Cortes, R.M.; Leal Pacheco, F.A. Development of a Hydrologic and Water Allocation Model to Assess Water Availability in the Sabor River Basin (Portugal). Int. J. Environ. Res. Public Health 2019, 16, 2419. [Google Scholar] [CrossRef] [Green Version]
- Andrade, E.M.; Guerreiro, M.J.S.; Palácio, H.A.Q.; Campos, D.A. Ecohydrology in a Brazilian tropical dry forest: Thinned vegetation impact on hydrological functions and ecosystem services. J. Hydrol. Reg. Stud. 2020, 27, 100649. [Google Scholar] [CrossRef]
- Chen, H.; Fleskens, L.; Baartman, J.; Wang, F.; Moolenaar, S.; Ritsema, C. Impacts of land use change and climatic effects on streamflow in the Chinese Loess Plateau: A meta-analysis. Sci. Total Environ. 2020, 703, 134989. [Google Scholar] [CrossRef]
- Emerton, L.; Bos, E. Value: Counting Ecosystems As an Economic Part of Water Infrastructure; IUCN: Gland, Switzerland; Cambridge, UK, 2004; ISBN 283170720X. [Google Scholar]
- Ministério do Meio Ambiente (Ministry of the Environment)-MMA. Pagamento por Serviços Ambientais na Mata Atlântica: Liçoes Aprendidas e Desafios, 2th ed.; Guedes, F.B., Seehusen, S.E., Eds.; Ministério do Meio Ambiente-MMA: Brasília, Brazil, 2011; ISBN 9788577381579. [Google Scholar]
- Empresa Brasileira de Pesquisa Agropecuária (Brazilian Agricultural Research Corporation)-Embrapa. Marco Referencial em Serviços Ecossitêmicos, 1st ed.; Ferraz, R.P.D., Prado, R.B., Parron, L.M., Campanha, M.M., Eds.; Embrapa Soils: Brasília, Brazil, 2019; ISBN 9788570359094. [Google Scholar]
- Tundisi, J.G.; Tundisi, T.M. Potencial impacts of changes in the Forest Law in relation to water resources. Biota Neotrop. 2010, 10, 67–75. [Google Scholar] [CrossRef]
- Santos, F.L.D.; Silvano, R.A.M. Aplicabilidade, potenciais e desafios dos Pagamentos por Serviços Ambientais para conservação da água no sul do Brasil. Desenvolvimento e Meio Ambiente 2016, 38, 481–498. [Google Scholar] [CrossRef] [Green Version]
- Valera, C.A. Avaliação do novo Código Florestal: As Áreas de Preservação Permanente—APPs, e a Conservação da Qualidade do solo e da água Superficial. Ph.D. Thesis, Universidade Estadual Paulista, Jaboticabal-São Paulo, Brazil, 2017. [Google Scholar]
- Periotto, N.A.; Tundisi, J.G. A characterization of ecosystem services, drivers and values of two watersheds in São Paulo state, Brazil. Braz. J. Biol. 2018, 78, 397–407. [Google Scholar] [CrossRef] [PubMed] [Green Version]
- Naeem, S.; Ingram, J.C.; Varga, A.; Agardy, T.; Barten, P.; Bennett, G.; Bloomgarden, E.; Bremer, L.L.; Burkill, P.; Cattau, M.; et al. Get the science right when paying for nature’s services: Few projects adequately address design and evaluation. Science 2015, 347, 1206–1207. [Google Scholar] [CrossRef] [PubMed] [Green Version]
- Siqueira, H.E. Identificação de Áreas para Conservação do solo e da água na área de Proteção Ambiental do rio Uberaba cm Geoprocessamento. Ph.D. Thesis, Universidade Estadual Paulista, Jaboticabal-São Paulo, Brazil, 2019. [Google Scholar]
- Chu, L.; Quentin Grafton, R.; Keenan, R. Increasing Conservation Efficiency While Maintaining Distributive Goals With the Payment for Environmental Services. Ecol. Econ. 2019, 156, 202–210. [Google Scholar] [CrossRef]
- Alvares, C.A.; Stape, J.L.; Sentelhas, P.C.; De Moraes Gonçalves, J.L.; Sparovek, G. Köppen’s climate classification map for Brazil. Meteorol. Z. 2013, 22, 711–728. [Google Scholar] [CrossRef]
- Empresa Brasileira de Pesquisa Agropecuária (Brazilian Agricultural Research Corporation)-Embrapa. Banco de Dados Climáticos do Brasil. Available online: https://www.cnpm.embrapa.br/projetos/bdclima/balanco/resultados/sp/419/balanco.html (accessed on 18 January 2020).
- Rossi, M. Mapa Pedológico do Estado de São Paulo: Revisado e Ampliado; Instituto Florestal (Florestal Institute)-IF: São Paulo, Brazil, 2017; Volume 1, ISBN 3239660180. [Google Scholar]
- Instituto Brasileiro de Geografia e Estatística (Brazilian Institute of Geography and Statistics)-IBGE. Manual Técnico da Vegetação Brasileira, 2th ed.; Instituto Brasileiro de Geografia e Estatística (Brazilian Institute of Geography and Statistics)-IBGE: Rio de Janeiro, Brazil, 2012; ISBN 9788524042225. [Google Scholar]
- Instituto Brasileiro de Geografia e Estatística (Brazilian Institute of Geography and Statistics)-IBGE. Censo Agropecuário 2017; Instituto Brasileiro de Geografia e Estatística (Brazilian Institute of Geography and Statistics)-IBGE: São Paulo, Brazil, 2017. [Google Scholar]
- Vieira, S.R.; Martins, A.L.M.; Silveira, L.C.P. Relatório de Implantação do Projeto de Recuperação Ambiental da Estação Experimental de Agronomia de Pindorama, SP, Pindorama; Polo Regional Centro Norte-APTA: Pindorama-São Paulo, Brazil, 1999; 13p. [Google Scholar]
- Abdo, M.T.V.N.; Vieira, S.R.; Martins, A.L.M.; Silveira, L.C.P. Estabilização de Uma Voçoroca no Polo Regional Centro Norte-APTA Pindorama-Sp; Anais do III Congresso Latino Americano de Ecologia: São Lourenço, Minas Gerais, Brazil, 2009. [Google Scholar]
- Martins, A.L.M.; Lopes, M.C.; Pissarra, T.C.T.; Abdo, M.T.V.N.; Valaretto, R.S.; Bonatti, M.B.L. Monitoramento de vazão e avaliação da interferência de sistemas agroflorestais na qualidade de recursos hídricos na microbacia “Córrego Da Olaria”-Polo Regional Centro Norte, Pindorama, SP. Pesqui. Tecnol. 2012, 9, 1–9. [Google Scholar]
- Abdo, M.T.V.N.; Martins, A.L.M.; Finoto, E.L.; Fabri, E.G.; Pissarra, T.C.T.; Bieras, A.C.; Lopes, M.C. Implantação de sistema agroflorestal com seringueira, urucum e acerola sob diferentes manejos. Pesqui. Tecnol. 2012, 9, 1–15. [Google Scholar]
- Strahler, A.N. Quantitative analysis of watershed geomorphology. Eos Trans. Am. Geophys. Union 1957, 38, 913–920. [Google Scholar] [CrossRef] [Green Version]
- Lima, W.D.P. Hidrologia Florestal Aplicada ao Manejo de Bacias Hidrográficas, 2th ed.; Escola Superior de Agricultura “Luiz de Queiroz” Departamento de Ciências Florestais Piracicaba–São Paulo: Piracicaba, Brazil, 2008. [Google Scholar]
- Tazioli, A. Méthodes expérimentales pour mesurer le débit des cours d’eau: Comparaison entre les traceurs artificiels et le courantomètre. Hydrol. Sci. J. 2011, 56, 1314–1324. [Google Scholar] [CrossRef]
- Agência Nacional de Águas (Brazilian National Water Agency)-ANA. Medição de Descarga Líquida em Grandes Rios: Manual Técnico, 2th ed.; Agência Nacional de Águas (Brazilian National Water Agency)-ANA: Brasília, Brazil, 2014; ISBN 978-85-8210-026-4. [Google Scholar]
- Valera, C.A.; Pissarra, T.C.T.; Martins Filho, M.V.; Valle Junior, R.F.; Sanches Fernandes, L.F.; Pacheco, F.A.L. A legal framework with scientific basis for applying the ‘polluter pays principle’ to soil conservation in rural watersheds in Brazil. Land Use Policy 2017, 66, 61–71. [Google Scholar] [CrossRef] [Green Version]
- Araújo Costa, R.C.; Pereira, G.T.; Tarlé Pissarra, T.C.; Silva Siqueira, D.; Sanches Fernandes, L.F.; Vasconcelos, V.; Fernandes, L.A.; Pacheco, F.A.L. Land capability of multiple-landform watersheds with environmental land use conflicts. Land Use Policy 2019, 81, 689–704. [Google Scholar] [CrossRef]
- Agência Nacional de Águas (Brazilian National Water Agency)-ANA. Conjuntura dos Recursos Hídricos no Brasil 2017: Relatório Pleno/Agência Nacional de Águas; Agência Nacional de Águas (Brazilian National Water Agency)-ANA: Brasília, Brazil, 2017. [Google Scholar]
- Rodrigues, V.A. Processos Hidrológicos e Sustentabilidade da água em Microbacias com Pinus Halepensis Mill Albacete-Espanha. Postdoctoral Thesis, Universidade Estadual Paulista (UNESP), Botucatu-São Paulo, Brasil, Universidad de Castilla-La Mancha, Albacete, Spain, 2016. [Google Scholar]
- Krishnaswamy, J.; Bonell, M.; Venkatesh, B.; Purandara, B.K.; Rakesh, K.N.; Lele, S.; Kiran, M.C.; Reddy, V.; Badiger, S. The groundwater recharge response and hydrologic services of tropical humid forest ecosystems to use and reforestation: Support for the “infiltration-evapotranspiration trade-off hypothesis”. J. Hydrol. 2013, 498, 191–209. [Google Scholar] [CrossRef]
- Aguilar, F.X.; Obeng, E.A.; Cai, Z. Water quality improvements elicit consistent willingness-to-pay for the enhancement of forested watershed ecosystem services. Ecosyst. Serv. 2018, 30, 158–171. [Google Scholar] [CrossRef]
- Ferreira, P.; van Soesbergen, A.; Mulligan, M.; Freitas, M.; Vale, M.M. Can forests buffer negative impacts of land-use and climate changes on water ecosystem services? The case of a Brazilian megalopolis. Sci. Total Environ. 2019, 685, 248–258. [Google Scholar] [CrossRef] [PubMed]
- Bremer, L.L.; Wada, C.A.; Medoff, S.; Page, J.; Falinski, K.; Burnett, K.M. Contributions of native forest protection to local water supplies in East Maui. Sci. Total Environ. 2019, 688, 1422–1432. [Google Scholar] [CrossRef]
- Rodrigues, V.; Estrany, J.; Ranzini, M.; de Cicco, V.; Martín-Benito, J.M.T.; Hedo, J.; Lucas-Borja, M.E. Effects of land use and seasonality on stream water quality in a small tropical catchment: The headwater of Córrego Água Limpa, São Paulo (Brazil). Sci. Total Environ. 2018, 622, 1553–1561. [Google Scholar] [CrossRef] [Green Version]
- Vanzela, L.S.; Hernandez, F.B.T.; Franco, R.A.M. Influência do uso e ocupação do solo nos recursos hídricos. Rev. Bras. Eng. Agrícola e Ambient. 2010, 14, 55–64. [Google Scholar] [CrossRef] [Green Version]
- Zakia, M.J.B. Identificação e Caracterização da zona Ripária em uma Microbacia Experimental: Implicações no Manejo de Bacias Hidrográficas e na Recomposição de Florestas. Ph.D. Thesis, Universidade de São Paulo, São Carlos-São Paulo, Brazil, 1998. [Google Scholar]
- Tucci, C.E.M.; Mendes, C.A. Avaliação Ambiental Integrada de Bacia Hidrográfica, 2th ed.; Ministério do Meio Ambiente (Ministry of the Environment)-MMA: Brasília, Brazil, 2006; ISBN 9788578110796. [Google Scholar]
- Oliveira, L.F.C.D.; Fioreze, A.P. Estimativas de vazões mínimas mediante dados pluviométricos na Bacia Hidrográfica do Ribeirão Santa Bárbara, Goiás. Rev. Bras. Eng. Agrícola e Ambient. 2011, 15, 9–15. [Google Scholar] [CrossRef] [Green Version]
- Cicco, L.S.D. Evolução da Regeneração Natural de Floresta Ombrófila Densa Alto-Montana e a Produção de água em Microbacia Experimental, Cunha-SP. Masters Thesis, Universidade Estadual Paulista (UNESP), Botucatu-São Paulo, Brazil, 2013. [Google Scholar]
- Rodrigues, V.A. Análise dos processos hidrológicos em modelo didático de microbacias. Rev. Científica Eletrônica Eng. Florest. 2011, 17, 1–15. [Google Scholar]
- Ren, H.Q.; Yuan, X.Z.; Liu, H.; Zhang, Y.W.; Zhou, S.B. The effects of environment factors on community structure of benthic invertebrate in rivers. Ecol. Soc. China 2015, 35, 3148–3156. [Google Scholar]
- Zhang, X.K.; Fan, J.; Cheng, G.W. Modelling the effects of land-use change on runoff and sediment yield in the Weicheng River watershed, Southwest China. J. Mt. Sci. 2015, 12, 434–445. [Google Scholar] [CrossRef]
- Guidotti, V.; Ferraz, S.F.D.B.; Pinto, L.F.G.; Sparovek, G.; Taniwaki, R.H.; Garcia, L.G.; Brancalion, P.H.S. Changes in Brazil’s Forest Code can erode the potential of riparian buffers to supply watershed services. Land Use Policy 2020, 94, 104511. [Google Scholar] [CrossRef]
- Likens, G.E.; Bormann, F.H. Linkages between Terrestrial and Aquatic Ecosystems. Bioscience 1974, 24, 447–456. [Google Scholar] [CrossRef]
- Tundisi, J.G.; Tundisi, T.M. Limnologia, 1st ed.; Oficina de Textos: São Paulo, Brazil, 2008. [Google Scholar]
- Diário Oficial [da] República Federativa do Brasil, Poder Executivo. Lei no 12.651, de 25 de maio de 2012. Dispõe Sobre a proteção da Vegetação Nativa; Diário Oficial [da] República Federativa do Brasil, Poder Executivo: Brasilia, Brazil, 2012; p. 38. [Google Scholar]
- Assembleia Legislativa do Estado de São Paulo, Poder Executivo. Lei No 13.798, de 9 de Novembro de 2009. Institui a Política Estadual de Mudanças Climáticas-PEMC O; Assembleia Legislativa do Estado de São Paulo, Poder Executivo: São Paulo, Brazil, 2009. [Google Scholar]
- Diário Oficial do Estado de São Paulo, Poder Executivo, Brasil. Decreto No 55.947, DE 24 de Junho de 2010. Regulamenta a Lei no 13.798, de 9 de Novembro de 2009, que Dispõe Sobre a Política Estadual de Mudanças Climáticas; Diário Oficial do Estado de São Paulo, Poder Executivo, Brasil: São Paulo, Brazil, 2010; pp. 1–28. [Google Scholar]
- Richards, R.C.; Rerolle, J.; Aronson, J.; Pereira, P.H.; Gonçalves, H.; Brancalion, P.H.S. Governing a pioneer program on payment for watershed services: Stakeholder involvement, legal frameworks and early lessons from the Atlantic forest of Brazil. Ecosyst. Serv. 2015, 16, 23–32. [Google Scholar] [CrossRef]


| Sub-Basin | Max | Min | Mean | Med | SD | CV (%) | AC | KC |
|---|---|---|---|---|---|---|---|---|
| 1.1 | 8.50 | 0.18 | 2.95 | 2.50 | 1.57 | 53.2 | 0.803 | 0.0001 |
| 1.2 | 8.42 | 0.09 | 0.92 | 0.41 | 1.32 | 144.1 | 2.542 | 0.012 |
| 2 | 17.80 | 1.44 | 4.84 | 3.97 | 2.85 | 58.8 | 1.605 | 0.005 |
| 3 | 107.99 | 1.01 | 20.47 | 13.91 | 20.23 | 98.8 | 2.327 | 0.010 |
| Sub-Basins | Area | Perimeter | L | W | Sl | Ha | La | S |
|---|---|---|---|---|---|---|---|---|
| (ha) | (km) | (km) | (km) | (km) | (m) | (m) | (%) | |
| 1.1 | 80.9 | 3.54 | 1.11 | 1.1 | 0.82 | 607 | 554 | 6.4 |
| 1.2 | 77.8 | 3.97 | 1.22 | 0.84 | 0.80 | 605 | 547 | 5.7 |
| 2 | 111.2 | 4.42 | 1.96 | 1.4 | 2.72 | 615 | 554 | 7.4 |
| 3 | 794 | 11.9 | 4.46 | 2.55 | 7.35 | 615 | 520 | 5.4 |
| Year | Flow (L/s) | |||
|---|---|---|---|---|
| Average | S.D. | |||
| Sub-basin 1.1 | 2012 | 2.9 | 1.4 | c |
| 2013 | 3.4 | 1.7 | b | |
| 2014 | 1.7 | 0.8 | d | |
| 2015 | 2.1 | 0.7 | d | |
| 2016 | 4.5 | 1.2 | a | |
| Sub-basin 1.2 | 2012 | 0.3 | 0.6 | d |
| 2013 | 0.8 | 1.4 | bc | |
| 2014 | 0.4 | 0.6 | cd | |
| 2015 | 1.2 | 0.9 | b | |
| 2016 | 1.9 | 1.9 | a | |
| Sub-basin 2 | 2012 | 5.4 | 3.6 | b |
| 2013 | 4.4 | 1.6 | c | |
| 2014 | 2.9 | 0.7 | d | |
| 2015 | 3.9 | 1.6 | c | |
| 2016 | 7.7 | 3.1 | a | |
| Sub-basin 3 | 2012 | 28.2 | 21.3 | a |
| 2013 | 23.4 | 22.7 | a | |
| 2014 | 10.4 | 7.8 | b | |
| 2015 | 26.6 | 25.6 | a | |
| 2016 | 13.7 | 10.9 | b | |
© 2020 by the authors. Licensee MDPI, Basel, Switzerland. This article is an open access article distributed under the terms and conditions of the Creative Commons Attribution (CC BY) license (http://creativecommons.org/licenses/by/4.0/).
Share and Cite
Lopes Simedo, M.B.; Pissarra, T.C.T.; Mello Martins, A.L.; Lopes, M.C.; Araújo Costa, R.C.; Zanata, M.; Pacheco, F.A.L.; Fernandes, L.F.S. The Assessment of Hydrological Availability and the Payment for Ecosystem Services: A Pilot Study in a Brazilian Headwater Catchment. Water 2020, 12, 2726. https://doi.org/10.3390/w12102726
Lopes Simedo MB, Pissarra TCT, Mello Martins AL, Lopes MC, Araújo Costa RC, Zanata M, Pacheco FAL, Fernandes LFS. The Assessment of Hydrological Availability and the Payment for Ecosystem Services: A Pilot Study in a Brazilian Headwater Catchment. Water. 2020; 12(10):2726. https://doi.org/10.3390/w12102726
Chicago/Turabian StyleLopes Simedo, Mariana Bárbara, Teresa Cristina Tarlé Pissarra, Antonio Lucio Mello Martins, Maria Conceição Lopes, Renata Cristina Araújo Costa, Marcelo Zanata, Fernando António Leal Pacheco, and Luís Filipe Sanches Fernandes. 2020. "The Assessment of Hydrological Availability and the Payment for Ecosystem Services: A Pilot Study in a Brazilian Headwater Catchment" Water 12, no. 10: 2726. https://doi.org/10.3390/w12102726