Assessing the Climate Tendency over the Yangtze River Delta, China: Properties, Dry/Wet Event Frequencies, and Causes


1
Department of Geography and Spatial Information Techniques, Ningbo University, Ningbo 315211, China
2
Ningbo Universities Collaborative Innovation Center for Land and Marine Spatial Utilization and Governance Research, Ningbo University, Ningbo 315211, China
3
Institute of East China Sea, Ningbo University, Ningbo 315211, China
*
Author to whom correspondence should be addressed.
Water 2020, 12(10), 2734; https://doi.org/10.3390/w12102734
Submission received: 4 September 2020
/
Revised: 25 September 2020
/
Accepted: 28 September 2020
/
Published: 30 September 2020
(This article belongs to the Special Issue Assessment of Spatial and Temporal Variability of Water Resources)
Abstract
:In view of the important role to in revealing climate wet/dry tendency, Standardized Precipitation Index (SPI) was applied to identify wetness/dryness trends and their relationship with large-scale climate oscillations in the Yangtze River Delta (YRD) from 1957 to 2016. The daily precipitation in 43 meteorological stations was used to calculate SPI time series for a time scale of 12 months. The results indicate that there are three dominant geographic sub-regions of SPI-12 modes. Increasing trends dominate, except for some of the northern regions. High frequencies of wet and dry events are mainly located in the southern regions and part of the northwestern and southeastern regions, respectively. Temporally, large-scale dry events mainly happened in the 1960s–1970s, and wet events in the 1990s and the 2010s. They show a tendency towards more wet conditions of the regional climate in the YRD. The climate variations are primarily controlled by large-scale atmospheric oscillations. The North Atlantic Oscillation (NAO) and Southern Oscillation Index (SOI) have much higher influence on the variation of SPI in the mid and east; whereas the Pacific Decadal Oscillation (PDO) and North Pacific Index (NP) show higher correlations with SPI in the northern regions of the YRD.
1. Introduction
Due to the intensification of human activities but also to natural factors, the climate is undergoing a drastic change worldwide in recent decades [1,2,3]. This is accelerating the hydrological cycle, which causes maldistribution of precipitation and increases regional flood/drought occurrences [4,5]. Among climate variables, precipitation controls regional water resources and wetness/dryness states to a great extent. Xu et al. pointed out that climate change and its impact on hydrological regimes are priority areas for both research and water management practice [6]. It is therefore essential to fully understand precipitation climate and related water resources when developing appropriate and sustainable water disaster prevention and management strategies.
There are many methods to detect regional hydrological processes. In ungauged watershed, some hydrological models have been built to detect and predict regional flood and drought events [7,8]. Meanwhile, there are many approaches to flood studies, based on the regionalization of rainfall, such as the one reported in Pellicani et al. [9]. In well measured regions, hydrological processes and extreme wetness/dryness events can be assessed by numerous indexes such as Percentage of Precipitation Anomalies, Relative Humidity Index, Standardized Precipitation Index (SPI), Relative Soil Humidity Index and Palmer Index [10,11]. Among these indexes, SPI is a widely accepted method to reveal the climate tendency and assess the severity of extreme wet/dry events [12,13,14]. What is more, the application of SPI requires only data on precipitation, is easier to calculate, even at multiple time scales, and can identify more extreme events [12]. Thus, the SPI was selected to assess climate tendency over the Yangtze River Delta.
So far, both gradual trends and temporal oscillations have been detected for several regions of the world. Strzepek et al. found an increase in meteorological drought frequencies in the southwestern states of America [15]. In India, climate trends show a significant tendency towards wetter conditions in part of the eastern and southwestern districts, and towards drier conditions in parts of the northern, western and southeastern regions in the monsoon season (June–September) [16,17]. In Europe, an increase of SPI time series was found for the Scandinavian Peninsula, Iberian Peninsula, and the coastal region of the Black Sea; drier conditions were mainly detected for central Europe and the Apennine Peninsula [18]. Globally, downward trends of SPI time series were observed in less than 1% of the hyper-arid and arid zones, and less than 3% of the humid zones [19]. Upward SPI trends were found for 12% and 14.5% of humid zones. In China, the southeast, northwest and Qinghai-Tibet Plateau regions exhibit a tendency towards a wetter climate, and there is a tendency towards a drier climate in the northeast, northern and southwestern China and for the Loess Plateau [14,20,21,22]. Previous studies of climate tendency generally focused on time series analysis by the Mann-Kendall trend analysis and Sen’s Slope [23,24]. Recently, more studies have paid attention to the spatial properties of climate tendency in relatively large research regions [25]. Different methods exist for computing spatial modes of climate tendency, such as Principal Component Analysis (PCA). PCA aims at extracting the coherent variations of meteorological variables that are dominant [12,13]. This will help us to regionalize the spatial mode of climate change.
As well as trends, climate does show oscillatory temporal patterns. It is accepted that the Arctic Oscillation influences the climate in the Northern Hemisphere, including Eurasia, North America, North Africa and the Middle East, especially in the winter months [26]. Tabari et al. found that the North Atlantic Oscillation and El Niño-Southern Oscillation are the other important factors that are significantly correlated with the winter evapotranspiration in Iran [27]. Xu et al. found that dry conditions tend to be associated with El Niño in the southern zone of Southeast Asia [28]. In Northwest China, the precipitation was found to be most strongly correlated with the India Summer Monsoon, and partially correlated with the Pacific Decadal Oscillation and with El Niño and the Southern Oscillation Index [29]. However, no systematic examination of the link between regional climate tendency modes and primary large-scale climate oscillations has been done in the Yangtze River Delta (YRD).
The YRD, located in the east of China, is one of the most important agricultural and industrial regions. This monsoon dominated climate is vulnerable since the YRD is experiencing a transitional climate from humid to semiarid. According to Ren et al., annual precipitation shows an upward trend, while the number of rainy days shows a downward trend [30,31]. This indicates that the rainfall in the region tends to occur in a more temporally concentrated way, hence with a higher frequency of wetness/dryness disasters [32]. The mid-north and southeast regions of the YRD abound with rice and wheat, which requires ample water resources. At the same time, the southeast region is the largest urban agglomeration in China. Booming development leads to water shortages due to human-induced water pollution. The uneven spatiotemporal distribution of precipitation and frequent wetness/dryness disasters have threatened agriculture development and social safety. In view of the increased frequency of climate disasters and the water shortage problem, the objectives of this article are: (1) to analyze the spatial and temporal trends of the 12-month Standardized Precipitation Index (SPI-12), (2) to describe the frequencies of wet/dry events, and (3) to uncover the variation modes of SPI-12 and their correlations with large-scale climate oscillations.
2. Materials and Methods
2.1. Research Region and Data Collection
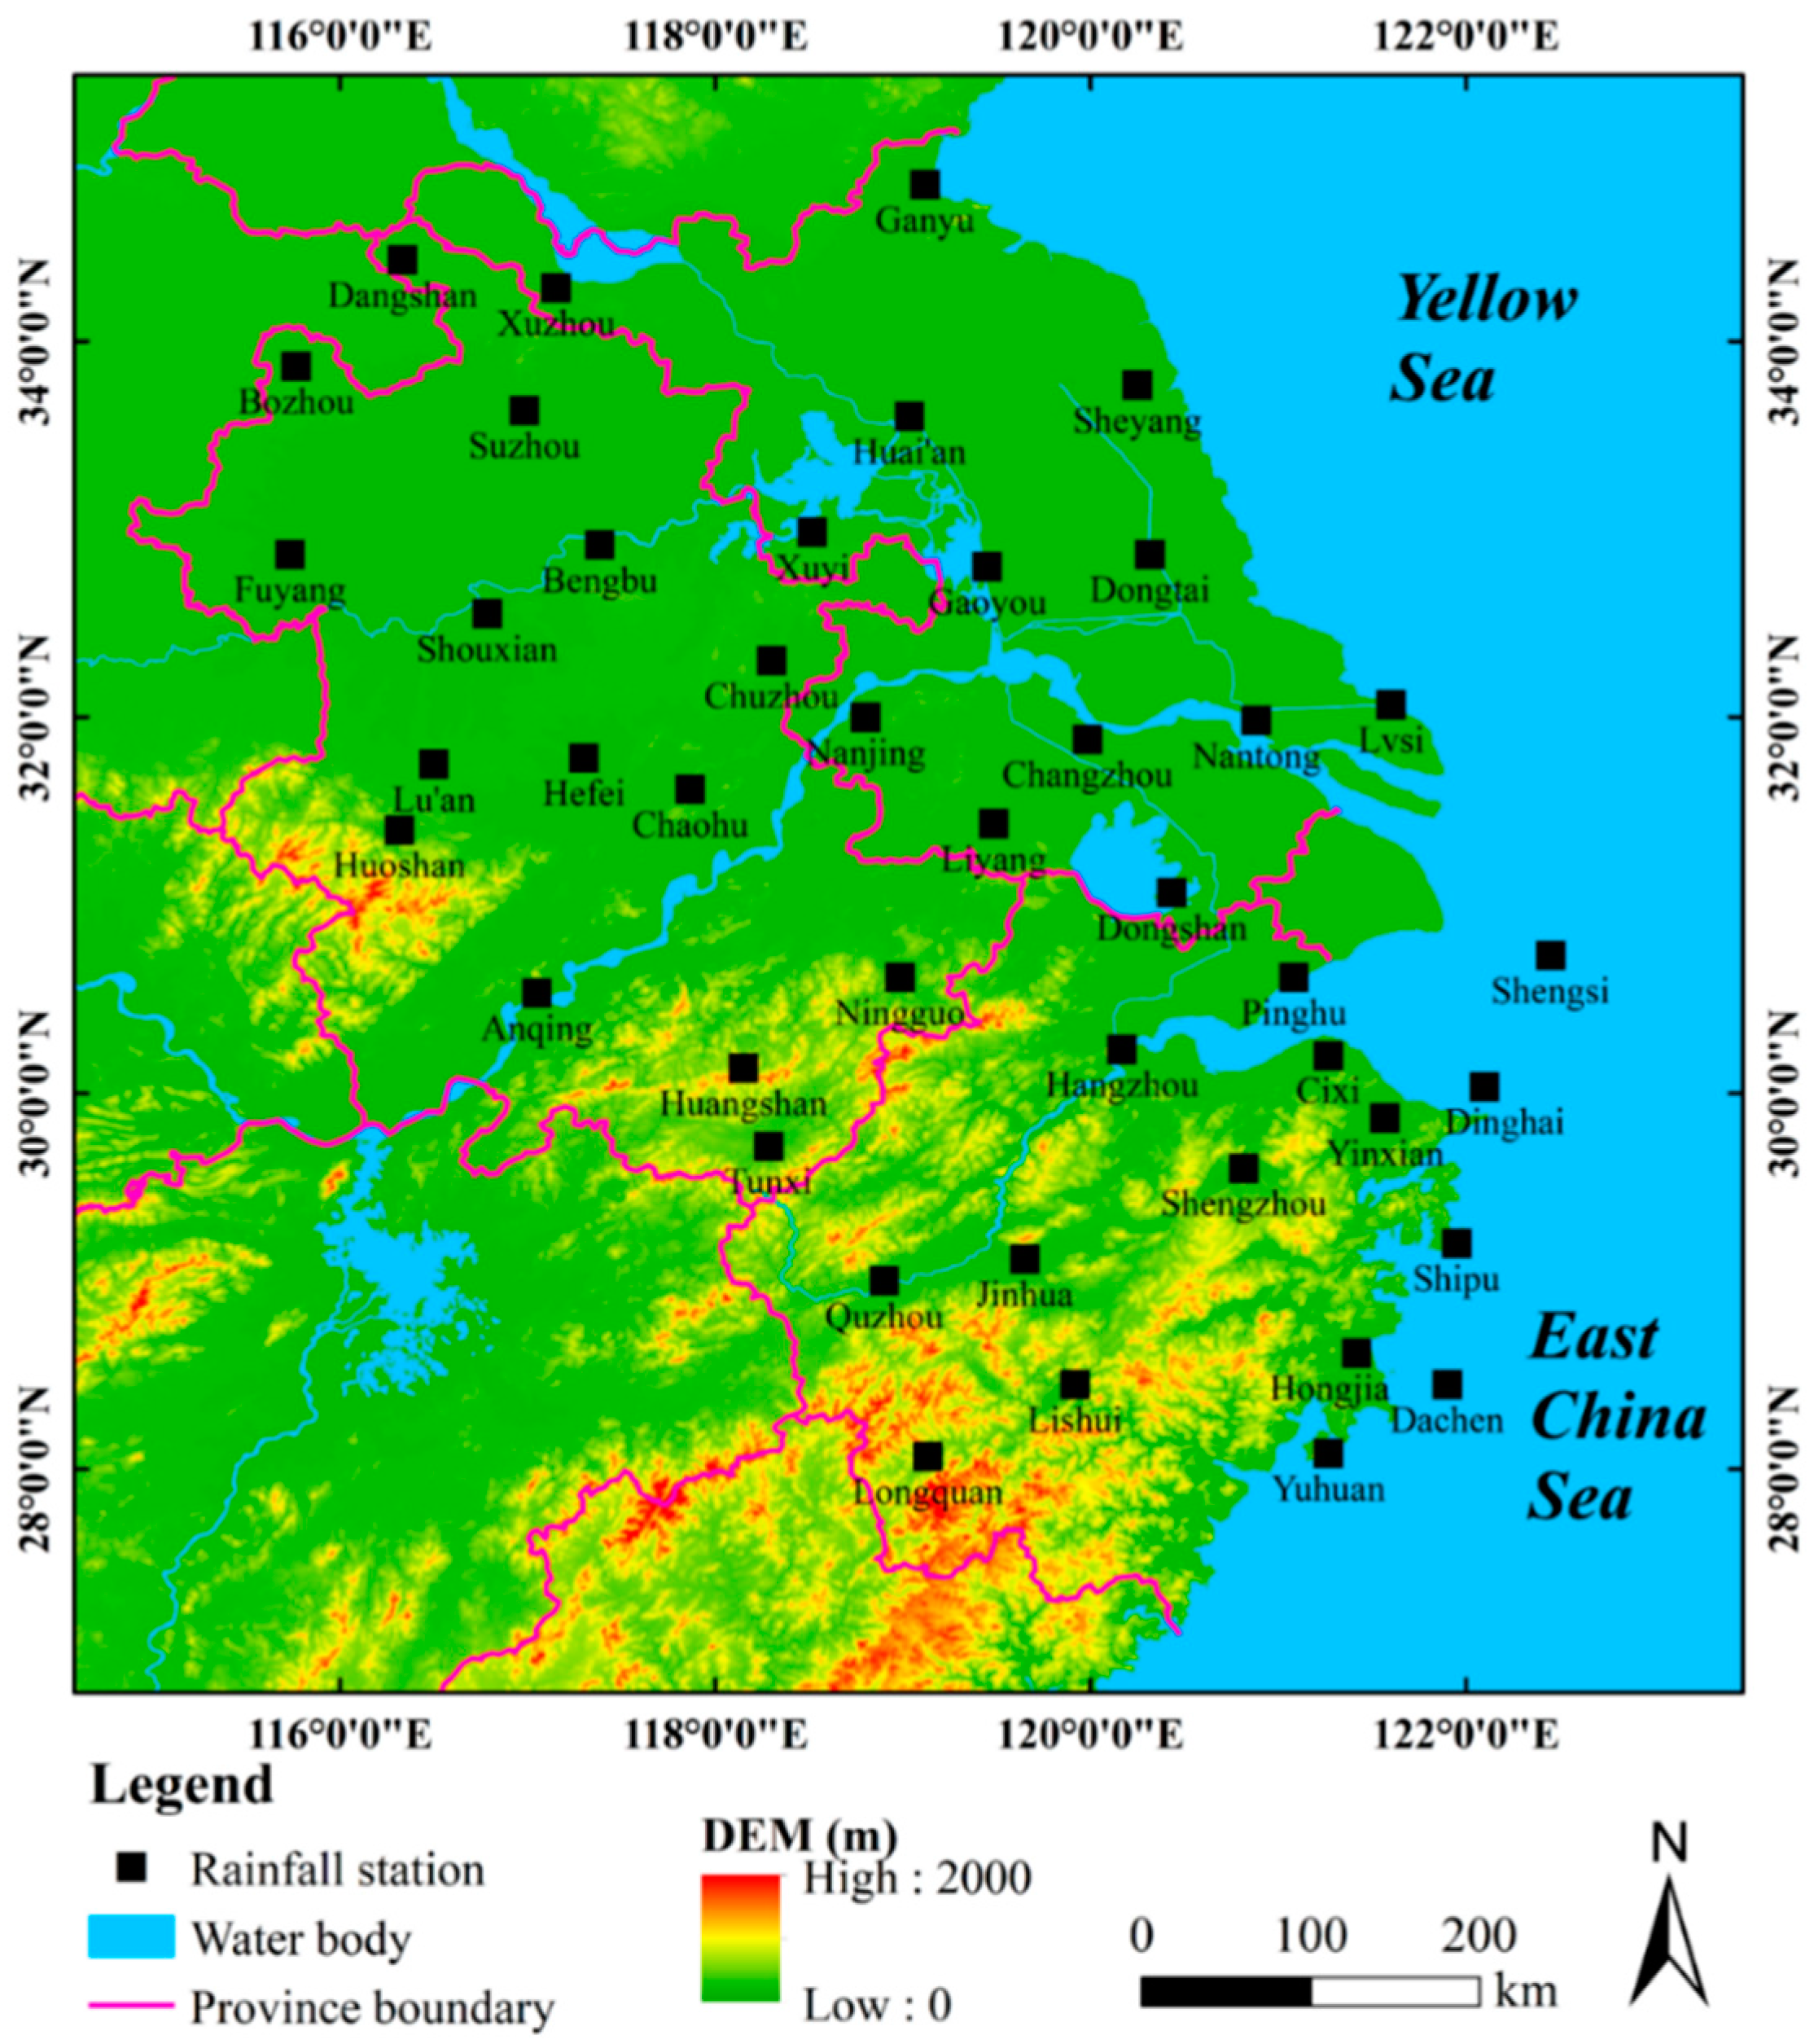
The YRD extends between the longitudes of 114°54′ E to 123°08′ E and latitudes of 27°21′ N to 35°20′ N, covering about 344,300 km2 (Figure 1) [33]. This region mainly belongs to the subtropical monsoon climate zone, except for a small part in the temperate monsoon climate zone in the north. Due to the land and sea location, topography and monsoon climate, annual average precipitation decreases from the southeast to the northwest. Meanwhile, the typical East Asian monsoon climate is characterized by a cold dry winter and hot humid summer. Because of the characteristics of the monsoon climate, the rain band of eastern China experiences a process of advancing from south to north and retreating from north to south every year. The strength of the monsoon decides the location and duration of the rain belt in the Yangtze River Delta. Meanwhile, this is one of the most developed regions in China and has frequently suffered from severe wetness/dryness events in its history. Therefore, it is necessary to fully understand the climate tendency and influencing factors.
In order to study climate tendency and its relationship with large-scale climate indices, daily precipitation data and the monthly data of climatic indices were obtained from the National Meteorological Center of China (http://data.cma.gov.cn) and the National Oceanic Atmospheric Administration website (http://www.esrl.noaa.gov) from 1957 to 2016, respectively. Location of the 43 rainfall stations were shown in Figure 1. The climatic indices include Arctic Oscillation (AO), North Atlantic Oscillation (NAO), Pacific Decadal Oscillation (PDO), North Pacific Index (NP), Southern Oscillation Index (SOI), and the average sea surface temperature from 5° S–5° N and 160° E–150° W (Nino 4 SST Index, NINO).
2.2. Methods
2.2.1. Standardized Precipitation Index
To reveal climate tendency, the SPI was applied to identify the spatiotemporal trends of wetness/dryness. The SPI allows the detection regional dry and wet events at different time scales in a statistically consistent way, and requires only precipitation data [11,12,34]. Positive and negative values of SPI mean wetness and drought events, respectively. In this study, a time scale of 12-months was discussed. The gamma distribution is defined by:
where and are the shape and scale parameter, respectively; x represents the monthly total precipitation; is the gamma function.
The cumulative probability function of the precipitation distribution is given by:
The gamma distribution is undefined for x = 0. Because the precipitation distribution may contain zeros, in order to account for zero value probability the cumulative probability may be written as:
where q is the probability of the zero-precipitation value and G(x) is the incomplete gamma function, representing the cumulative distribution of g(x). The probability H(x) is then transformed to the standard normal random variable Z or the SPI using the following approximation.
where
c0 = 2.515517, c1 = 0.802853, c2 = 0.010328, d1 = 1.432788, d2 = 0.189269, d3 = 0.001308. According to the values of SPI, the climate is divided into three different wet and dry events, respectively (Table 1).
2.2.2. Modified Mann-Kendall Method
In this article, the Mann-Kendall trend test method (MK) was taken into condition to detect the variation in precipitation. Because of the shortage, the method can be improved. Thus, the modified Mann-Kendall trend test method (MMK) was taken to detect the variation in precipitation [35,36]. The test statistic S is calculated as:
where n is the length of the data set, xi and xj are the sequential data values in time series i and j (j > i), respectively, and sgn(xj − xi) is the sign function as:
The variation of S is obtained through:
where m is the number of tied groups, and ti is the number of data points in the ith group. At last, Z is calculated by:
The Z values are approximately normally distributed. In this article, the significant level of 0.05 was selected, which means a significant increasing and decreasing trend when Z values are larger than +1.96 and lower than −1.96, respectively.
The autocorrelation of the data series would influence the significance of the change in trend. In order to eliminate this error, we detected the 1-lag autocorrelation of the time series in advance. So the time series was processed by the Trend Free Pre-Whitening (TFPW) approach if the 1-lag autocorrelation is significant [33,37].
where Var ∗ (S) is the modified variance; Var (S) is the variance of the Mann–Kendall statistic before the modification; n* is the effective sample size; n/n* is termed the correction factor; xi, xj, xt are the data values in time series i, j, and t; and are the mean data values in time series t and t+1. r1 is the auto coefficient value of the first-order sequence.
2.2.3. Principal Component Analysis
Meanwhile, Principal Component analysis (PCA) was considered to detect the spatial and temporal variation of the SPI. PCA proved to be useful and much simpler to understand and interpret [3,38,39]. Thirdly, the frequencies of wet/dry events were described according to the classification. Finally, Cross wavelet transform was used to detect the time-varying correlation between the PCS (scores of the principal component) of SPI and large-scale climate oscillations, such as AO, NAO, PDO, NP, SOI, and NINO [33]. In this research, the original monthly SPI at all the meteorological stations were Xi,1, Xi,2, …, Xi,k.
where Y values are the orthogonal and new linearly uncorrelated variables which explain most of the total variance. To find more stable spatial patterns, a rotation of the principle components using the varimax procedure, proved to be the most useful method, was applied.
3. Results and Discussions
3.1. Spatiotemporal Trends of SPI-12
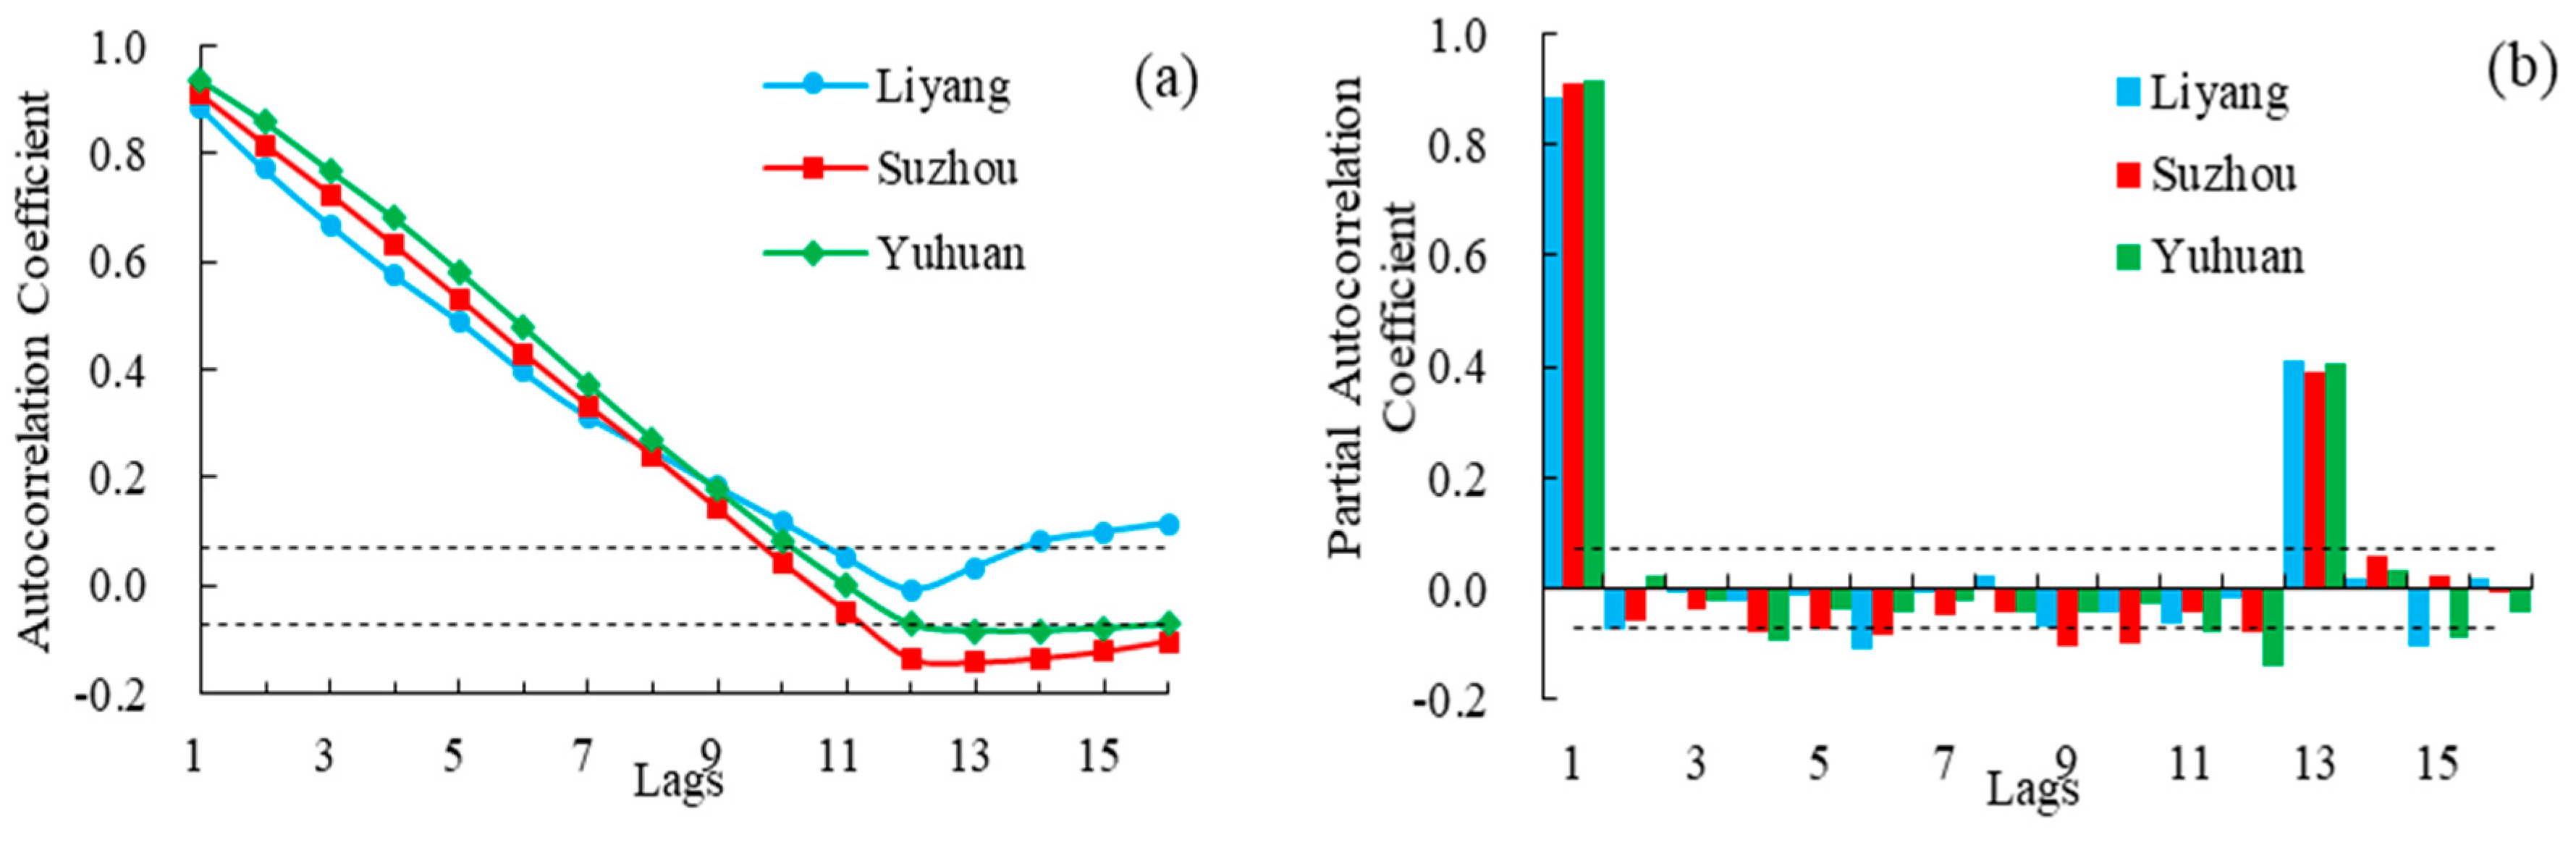
The autocorrelation function and partial autocorrelation function of SPI-12 were applied for all 43 meteorological stations. The results in the three-selected representative meteorological stations are shown in Figure 2. The time series of SPI-12 shows strong serial correlations, being positively and significantly autocorrelated up to a time lag of 9–10 months (Figure 2a). The serial correlations are all significantly positive and decrease rapidly for increasing lag time for all 34 meteorological stations. Similar results are detected across the loess Plateau of China (Liu et al., 2016). Strongest partial autocorrelations are found for lag times of 1 and 13 months (Figure 2b). This indicates that the serial correlations of SPI-12 should be removed before we calculate the wetness/dryness temporal variations and trends.
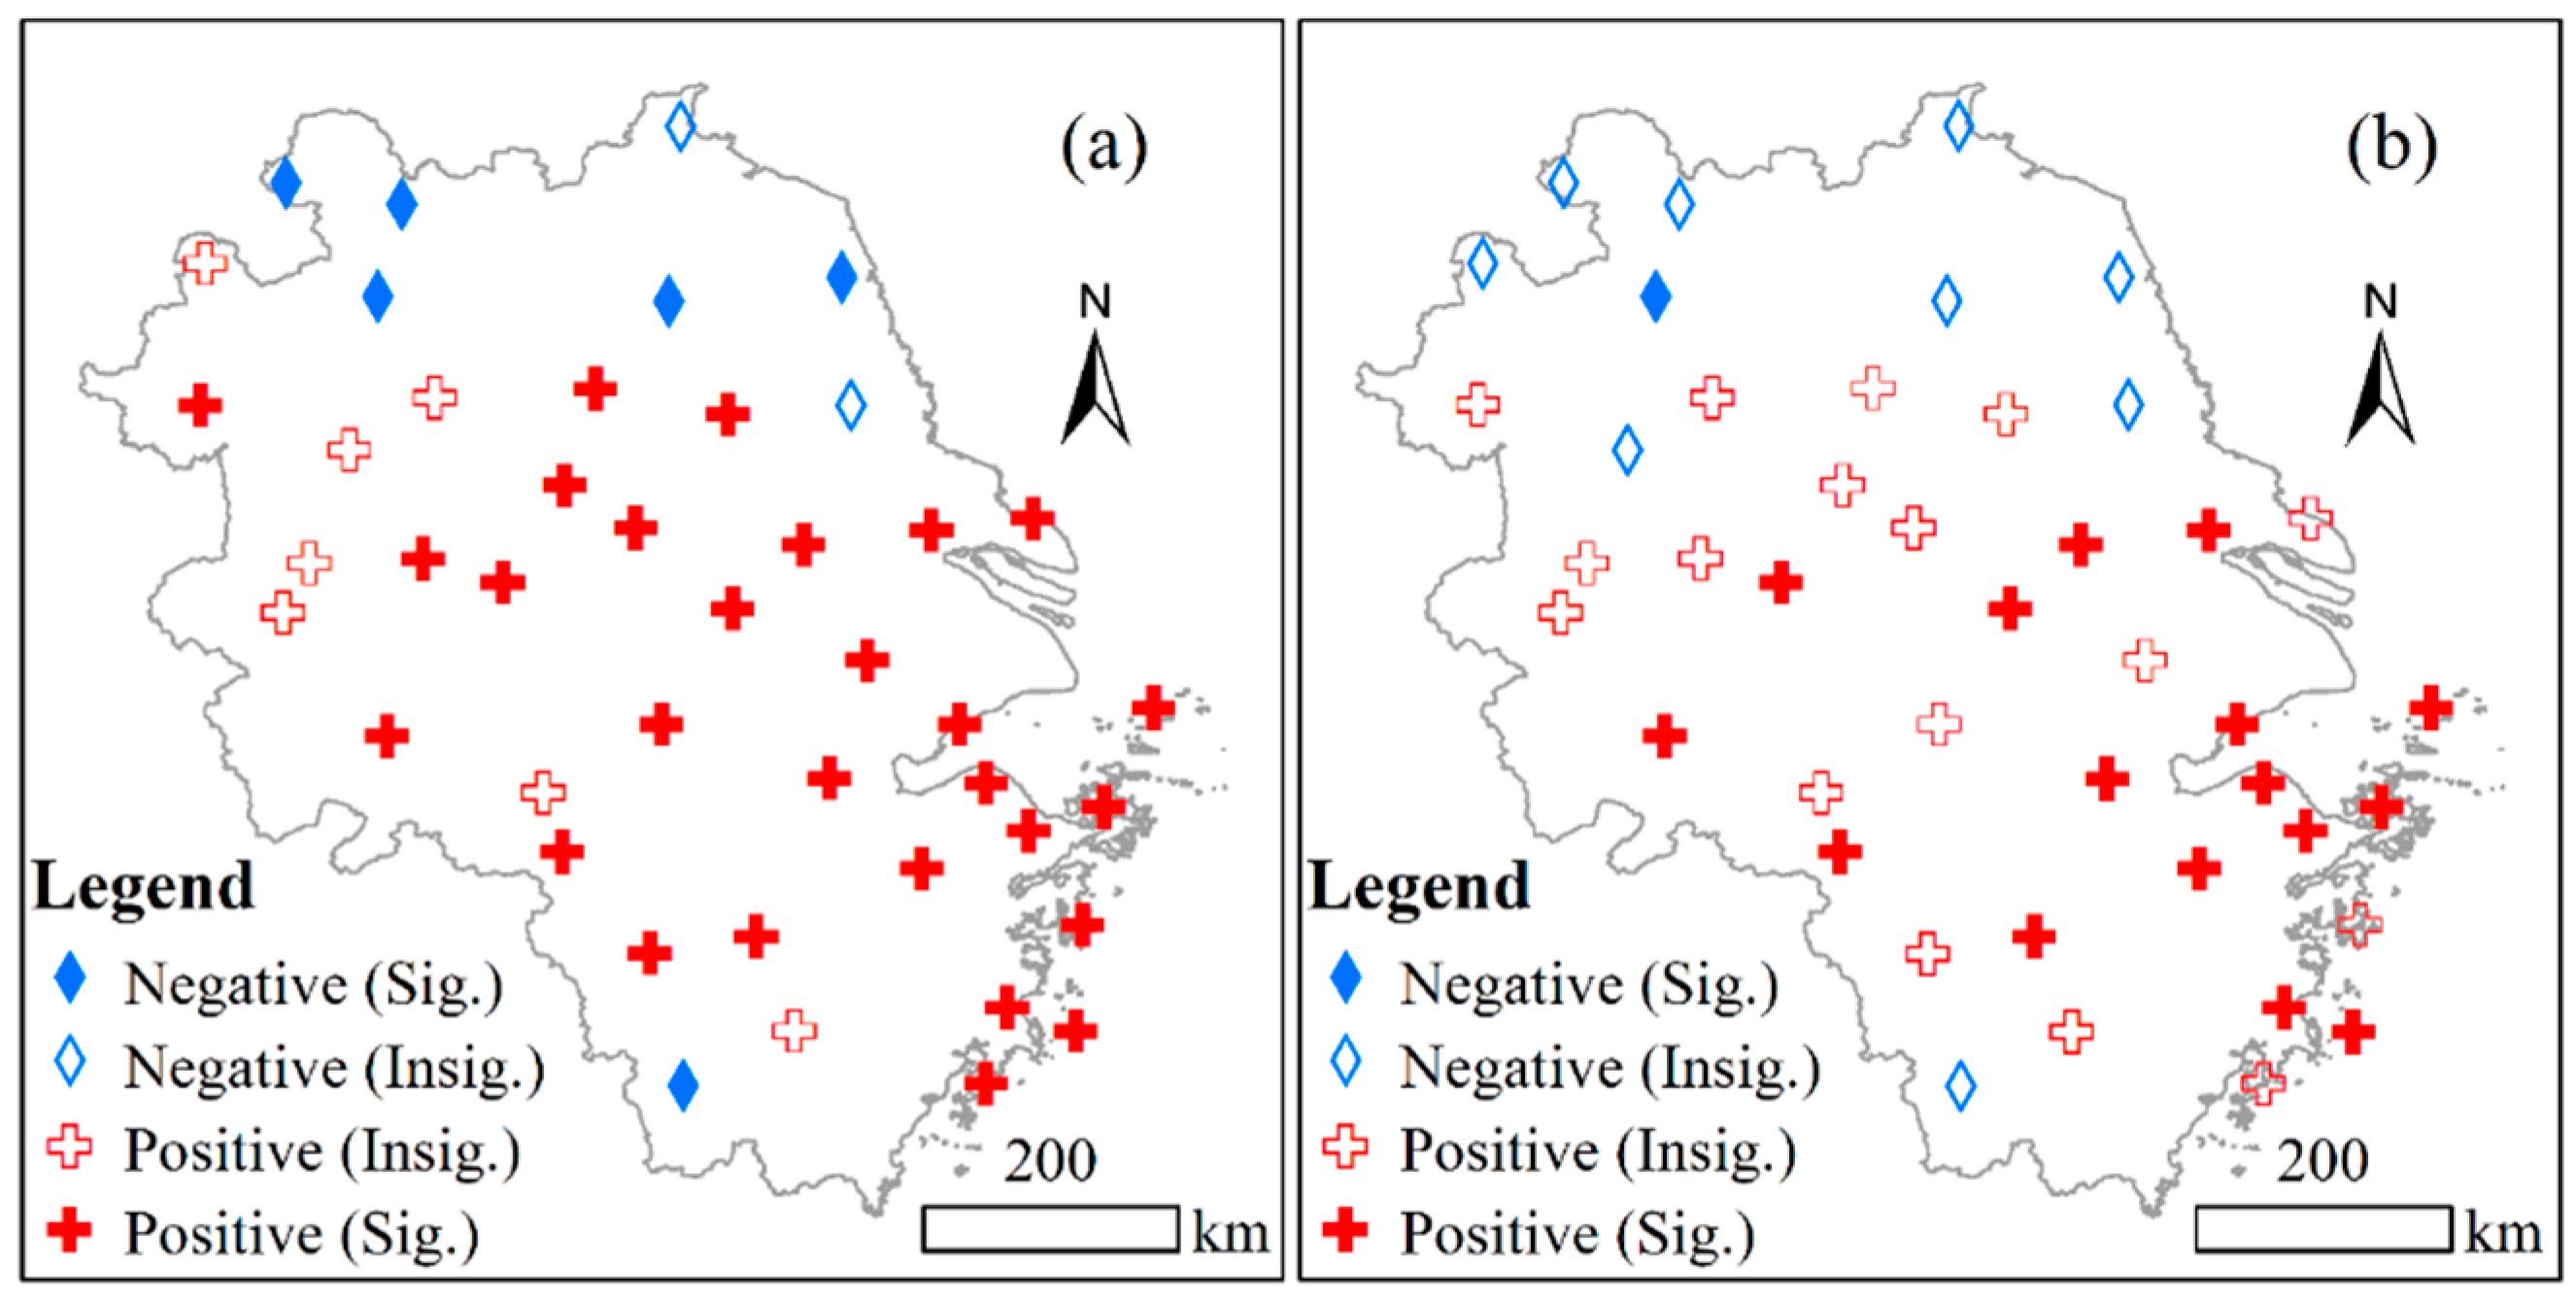
The spatial patterns of Z values, calculated by MK and MMK methods, are presented in Figure 3. Before removing the serial correlations, significant increasing and decreasing trends of SPI-12 were detected in 28 (65.12%) and 6 (13.95%) of the 43 meteorological stations, respectively (Figure 3a). Spatially, the increasing trends were mainly spotted in the middle, eastern and southeastern regions of the YRD, whereas decreasing trends mainly emerged in the northern region and in only one of the meteorological stations, named Longquan, of the southern region. After removing the serial correlations, the stations with significant increasing and decreasing trends decline to 16 (37.21%) and 1 (2.33%), respectively (Figure 3b). The increasing and decreasing trends, however, remain concentrated in the same regions. This indicates a tendency towards more wet conditions of regional climate in the YRD, except for the northern regions, where a dryer tendency dominates. Similar wet tendencies of climate have been found before 12]. In addition, Yao et al. and Zhai et al. concluded that the SPI decreases in most regions of north and northeast China and increases in most parts of southeastern China [14,20]. However, as well as precipitation, evaporation influences the regional climate trends. According to Xu et al., the reference evapotranspiration, calculated by the Penman-Monteith method, increases rapidly in the eastern and southeastern regions and decreases in the northern regions of the YRD [33]. This explains the insignificant tendency of regional wetness/dryness detected in most meteorological stations, based on the surface humidity index [40].
3.2. Frequencies of Wet/Dry Events
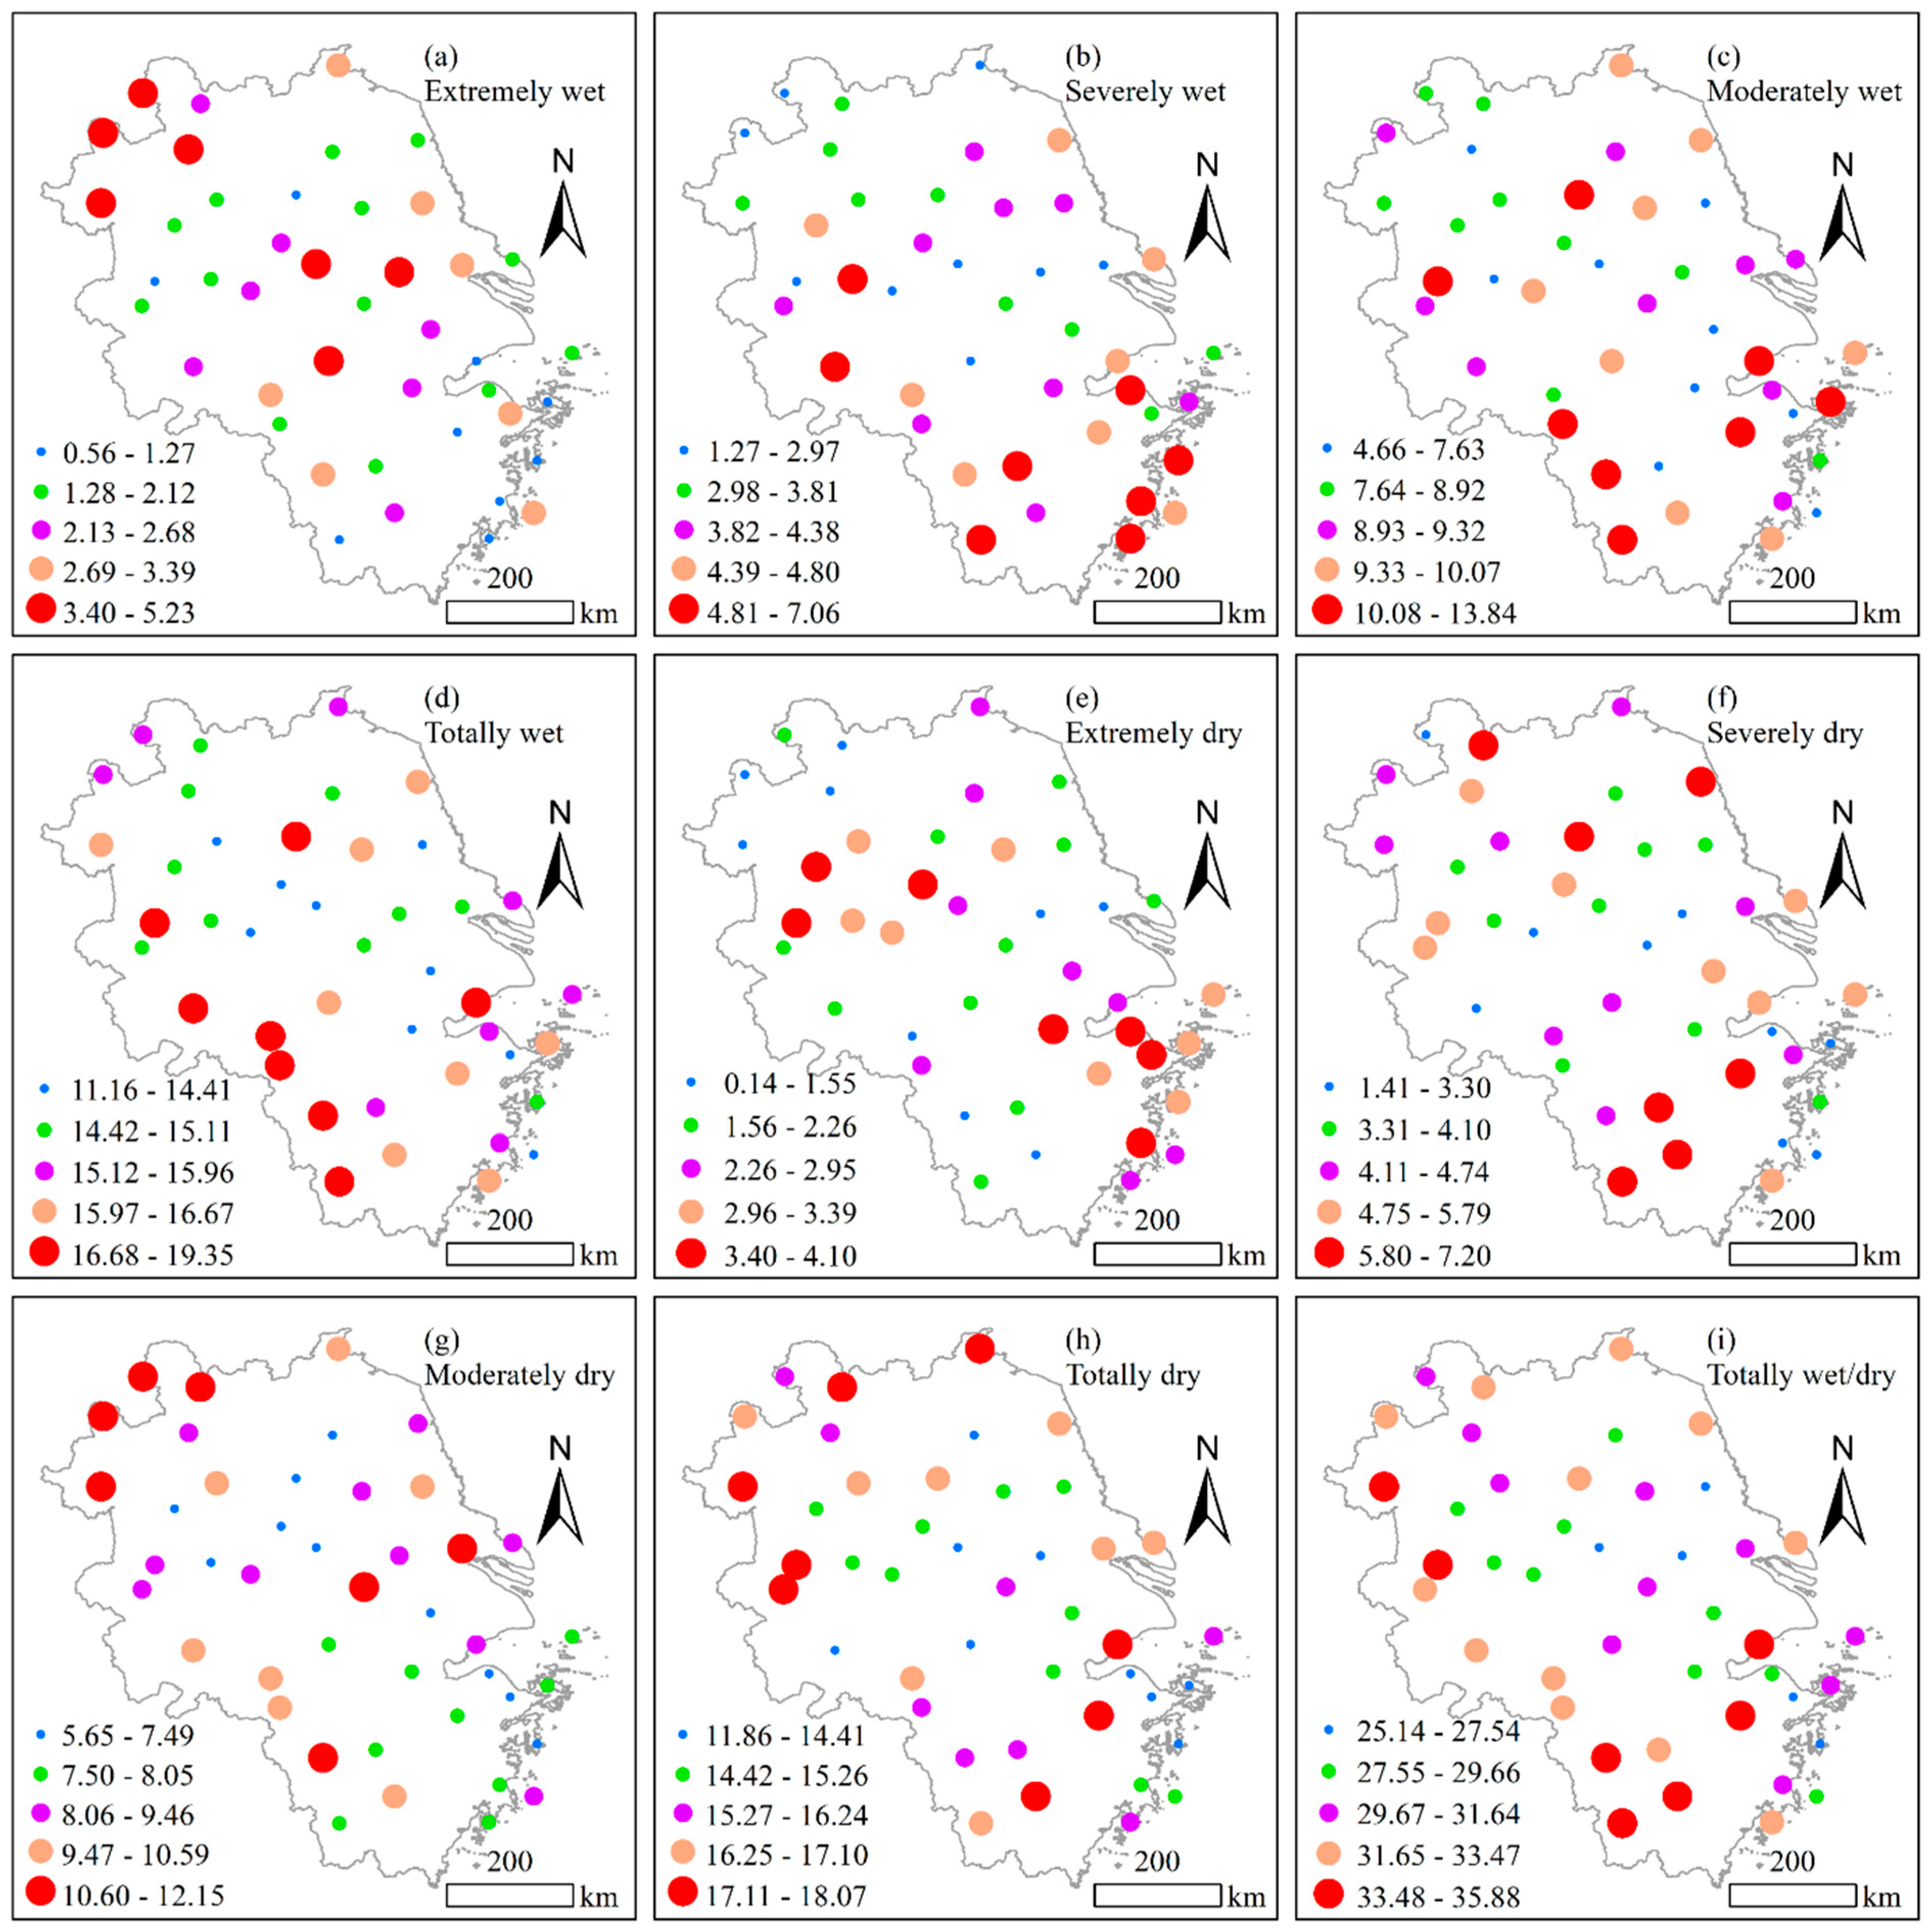
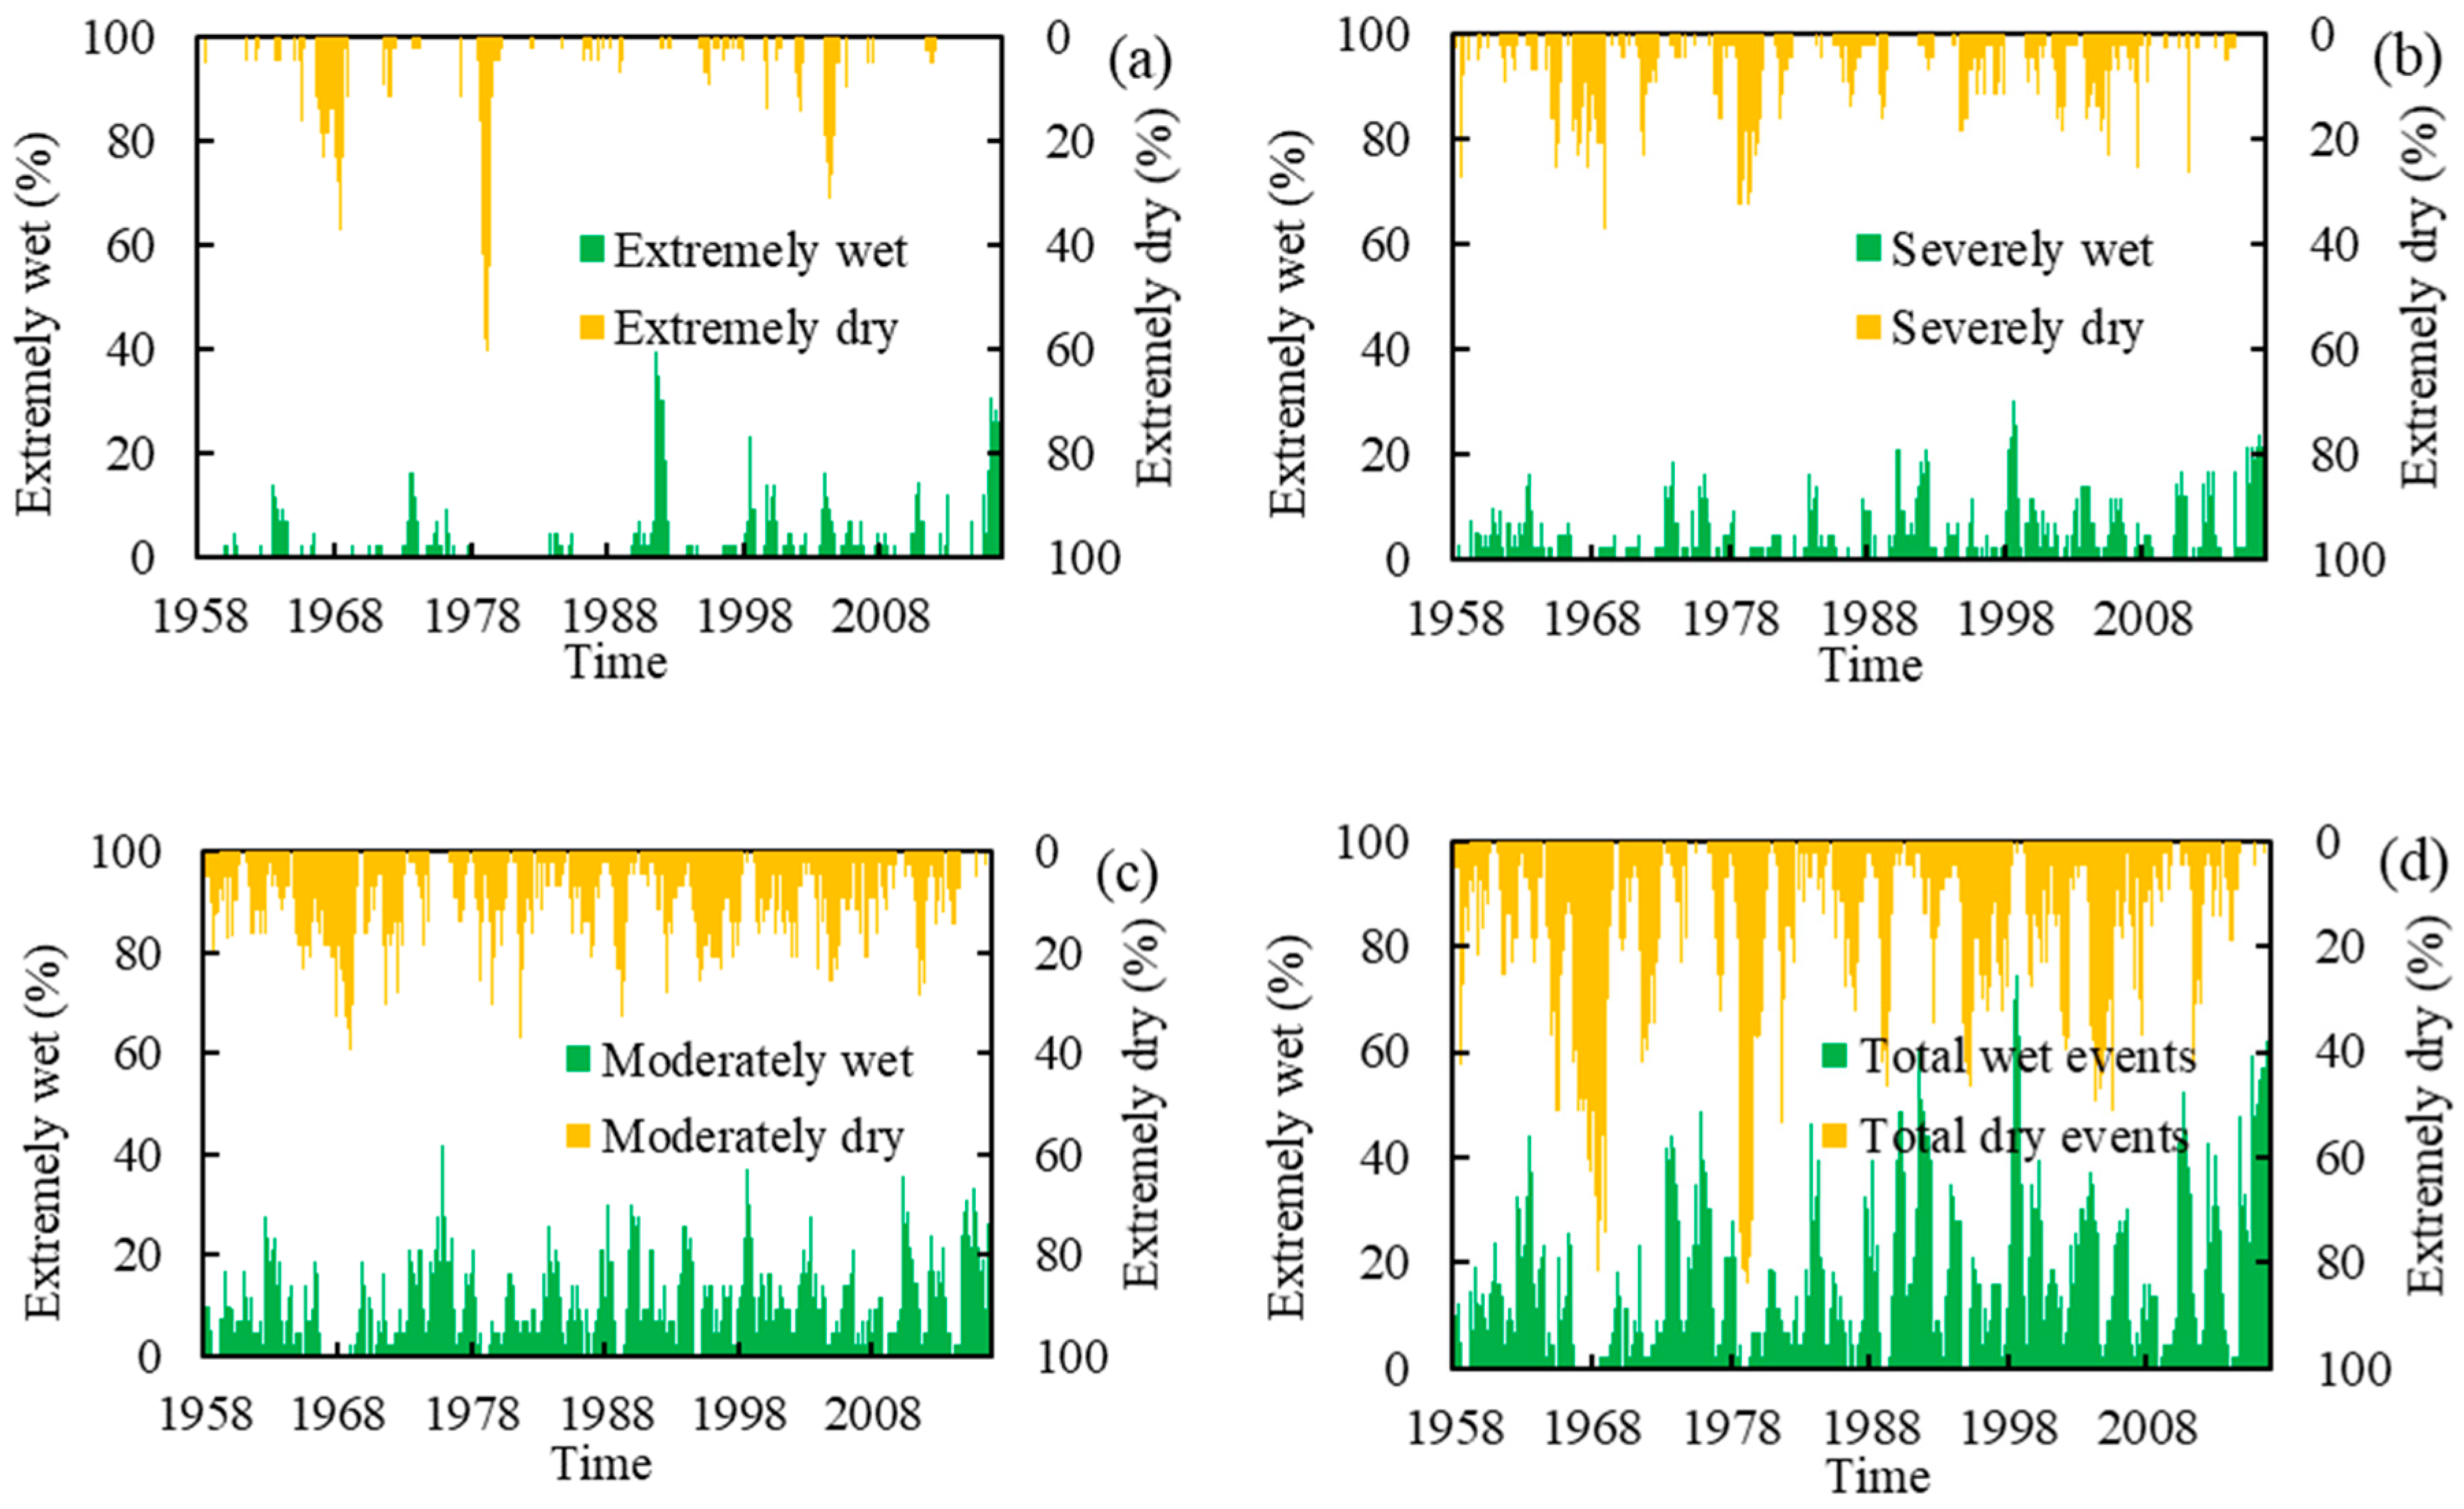
Based on the classification of different types of wet/dry events, as defined in Table 1, the frequencies of these events were spatially mapped for the YRD (Figure 4). The stations with high frequencies of extremely wet events are located in a dispersed way, including the northwestern, middle, and coastal regions (Figure 4a). For the northwestern region, in the stations Bozou, Fuyang, and Dangshan, extremely dry events are mainly concentrated in 1963–1966, 1991–1992 and 1998–2004. In the mid-eastern region, in the stations Nanjing, Changzhou, and Liyang, extremely wet events mainly occurred in 1991, 2003–2004, and 2015–2016. The extreme precipitation conditions in some of these years, 1991, 1998 and 2003, have been documented and analyzed before. Liu et al. found that the heavy rainstorms in 1998 in the northwestern region were caused by a warm shear associated with a southwestern vortex and the interaction between a moving cold front and some mesoscale convective systems embedded in this cold front [41]. In 1991, cold air originating from northern Asia was cut off by southwestern and southeastern warm airflows and interacted with warm airflows, which maintained the Meiyu front, and heavy rainfall spread all over the northern and middle YRD regions [42]; whereas the main reason for the heavy rain in 2003 was the strong and stable situation of the abnormal western extent of a subtropical high over the Northwest Pacific Ocean [43].
High frequencies of severely and moderately wet events are mainly concentrated in the southeastern and southwestern regions (Figure 4b–c). This means that these regions suffer more frequently from wet events (Figure 4d). The terrain here is dominated by hills and mountains, which increases the frequency of heavy rainfall due to the effect of orographic rain. Another factor that plays a role here is the shorter distance to the tropical oceans, with more frequent suffering from typhoons [44,45].
Meteorological stations with high frequencies of extremely dry events are mainly located in the mid-western and southeastern regions (Figure 4e). According to the statistics, extremely dry events in 1966–1968 and 1979 occurred in most of the regions in the YRD. In addition, an extremely dry period around 2001 occurred in the mid-western regions. Severely and moderately dry events occurred more frequently in parts of the northern and southeastern regions (Figure 4f–g). Accordingly, the northwestern and southeastern regions suffered from wet events more frequently (Figure 4h). All together these results in the different regions should be interpreted in a relative way, comparing one region versus the other, to get an idea of how prone the regions are to drought and flood disasters (Figure 4i).
Based on the same type of wet/dry events at different severity levels, the spatial coverages of the wet and dry events in the YRD were calculated. During the past 60 years, large scale extremely wet events mainly happened in the periods 1963–1964, 1973–1975, 1990–1992, 1998–2000, 2003–2006, 2010 and 2015–2016, especially in the years 1991, 1998 and 2016 (Figure 5a). Meanwhile, large scale extremely dry events mainly happened in the 1960s, the late 1970s and the 2000s. Extremely dry events happened in more than 30% of the meteorological stations in 1968, 1978 and 2004. The severely wet and dry events showed similar temporal variations (Figure 5b). Large scale severely wet events also occurred after the 1990s, whereas the severely dry events mainly concentrated in the 1960s, the late 1970s and the 2000s. In general, the percentage of stations affected by wet and dry events showed increasing and decreasing trends, respectively (Figure 5d). This confirms the findings from the trend analysis that there is a tendency towards more wet climate conditions in the YRD [12,13].
3.3. Spatial and Temporal Modes of SPI-12 and Associations with Climate Oscillations
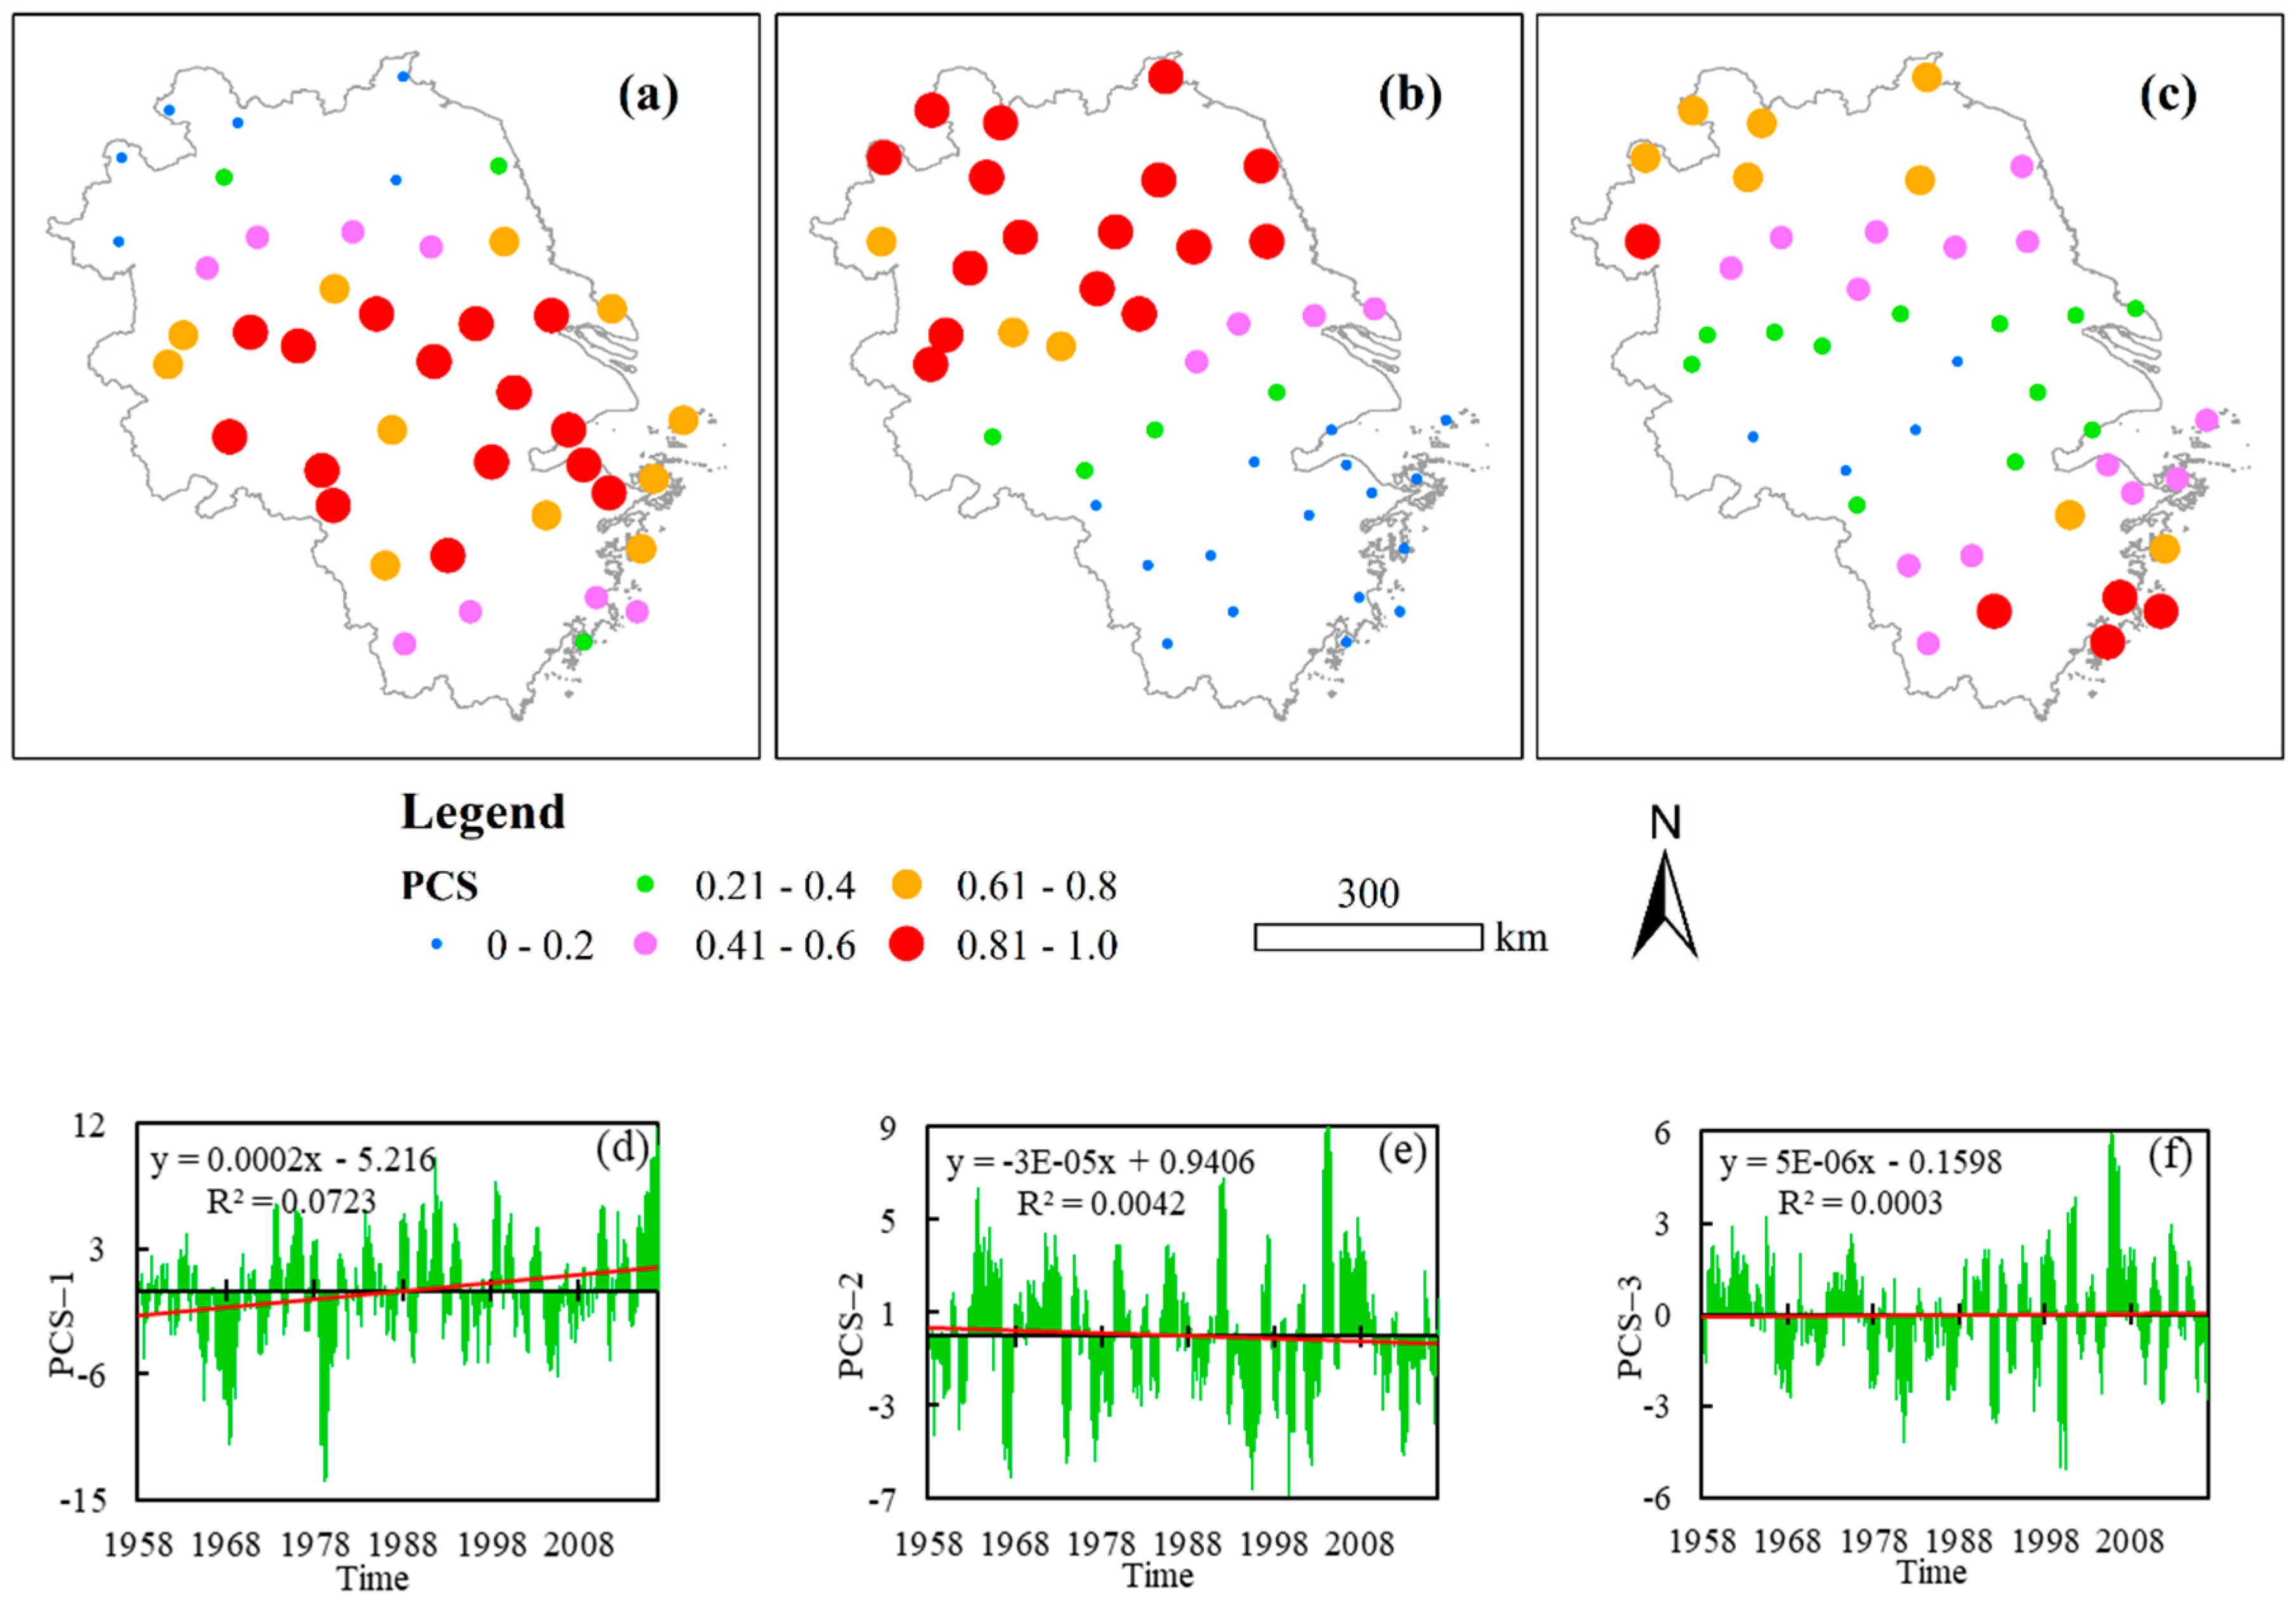
Based on the SPI-12 in 43 meteorological stations from 1957 to 2016, PCA was applied to decompose the spatial and temporal patterns of the SPI-12 series. Table 2 presents the first six rotated principle components. The first three components explain more than 65% of the total variance of the temporal SPI-12 values.
Among these components, the first rotated principle component explains approximately 37.62% of the total variance (Table 2). The values for this component are high in the middle, western and eastern regions, and decrease in the northern and the southern directions (Figure 6a). Temporally, the long-term PCS-1 (scores of the first principal component) show a significant increase with the determination coefficient R equal to 0.27 (p < 0.01), which means an increase in regional SPI-12 from 1957 to 2016 (Figure 6d).
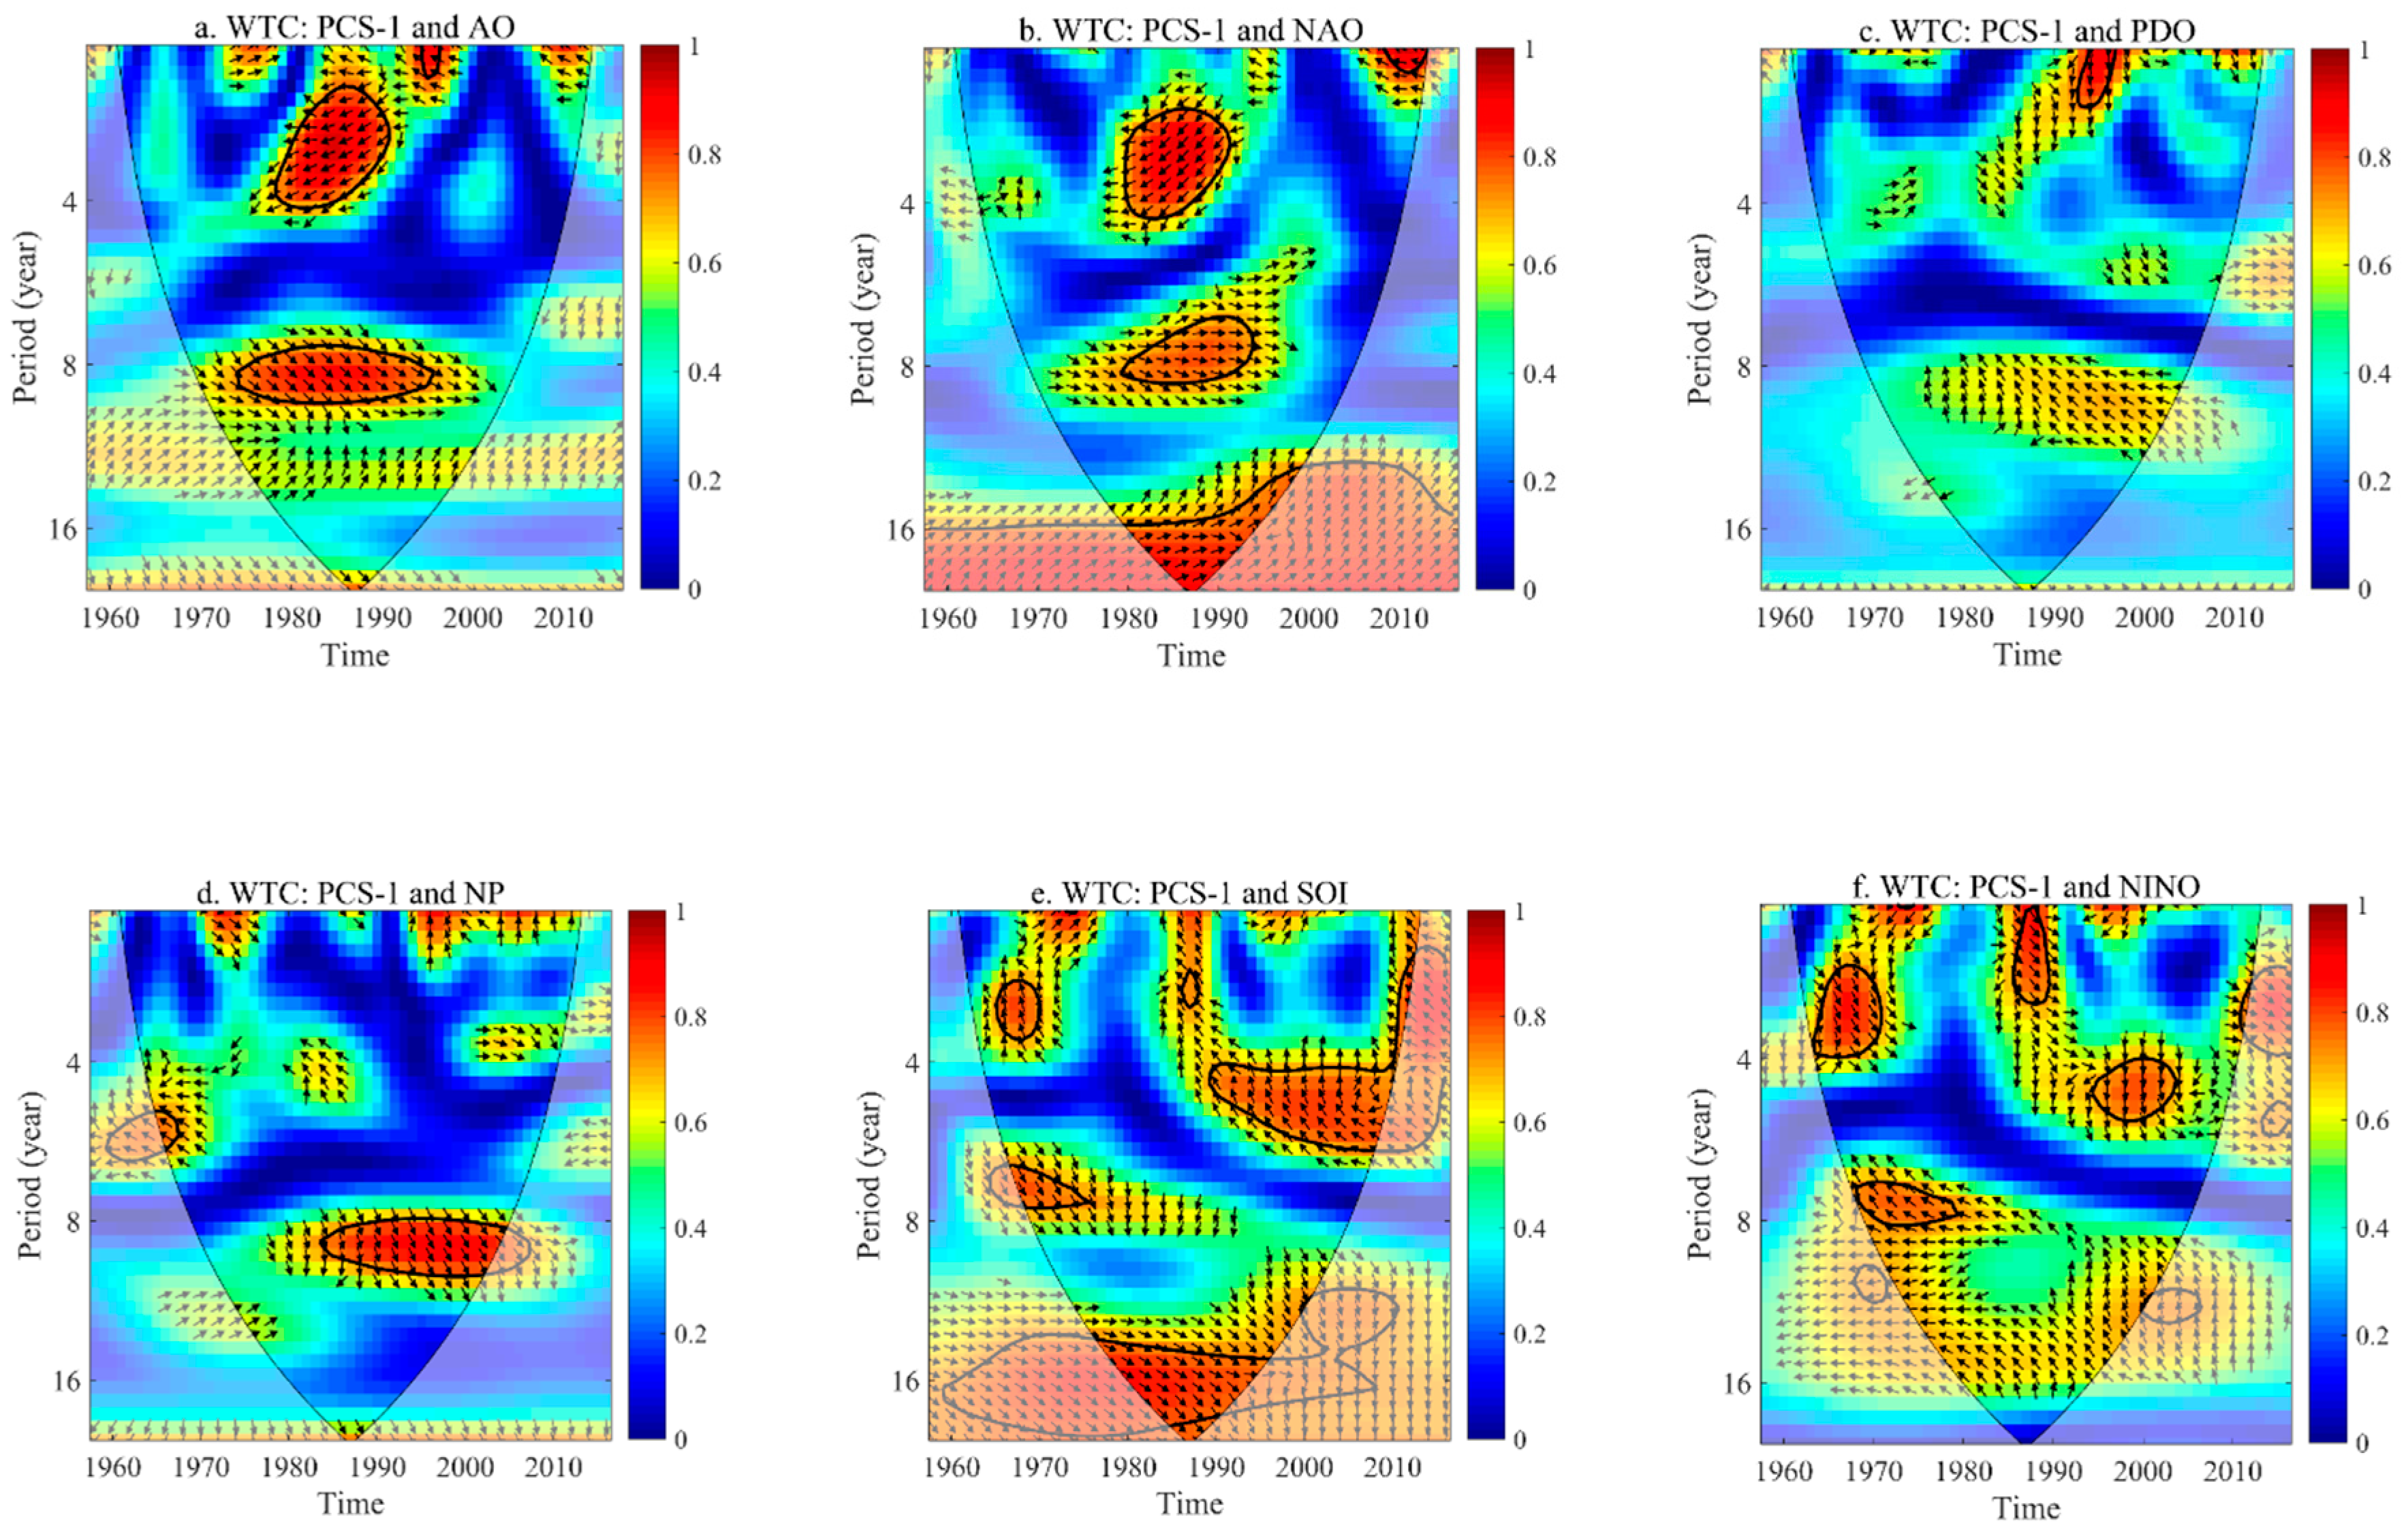
The large-scale climate oscillations considered here are the AO, NAO, PDO, NP, SOI, and NINO and their influence was studied for each sub-region by wavelet coherence analysis (Figure 7, Figure 8 and Figure 9). The wavelet coherence (WTC) between PCS-1 and AO shows the presence of high correlation in the 2–4-years and 8–10-years bands, from the mid-1970s to the mid-1990s (Figure 7a). Whereas the arrows during significant intervals point towards different directions, the WTC between PCS-1 and NAO shows significant WTC values for the 2–4-years and 7–8-years bands around the 1980s (Figure 7b). Moreover, a continuous significant WTC beyond the 16-years band are observed. Compared to other climate oscillations, PDO shows weak relationship with PCS-1, although a high but insignificant 8–12-years band is detected from the mid-1970s to the 2000s (Figure 7c). The WTC between PCS-1 and NP shows significant 6-years and 8–10-years bands around the 1960s and the 1980s–2000s, respectively (Figure 7d). The presence of significant correlations between PCS-1 and SOI are observed in the 2–3-years, 7–8-years, 4–7-years, 2–7-years and 12–24-years bands for the late 1960s, the mid-1960s to 1970s, the 1990s–2000s, the 2010s, and the 1960s–2000s, respectively (Figure 7e). The WTC between PCS-1 and NINO shows several significant bands in short period intervals. These results suggest that PCS-1 changes simultaneously with NAO and SOI in general, though the relative phase relationship is not uniform. This means that the variation of SPI is mainly influenced by NAO and SOI during recent decades in the middle and eastern regions of the YRD.
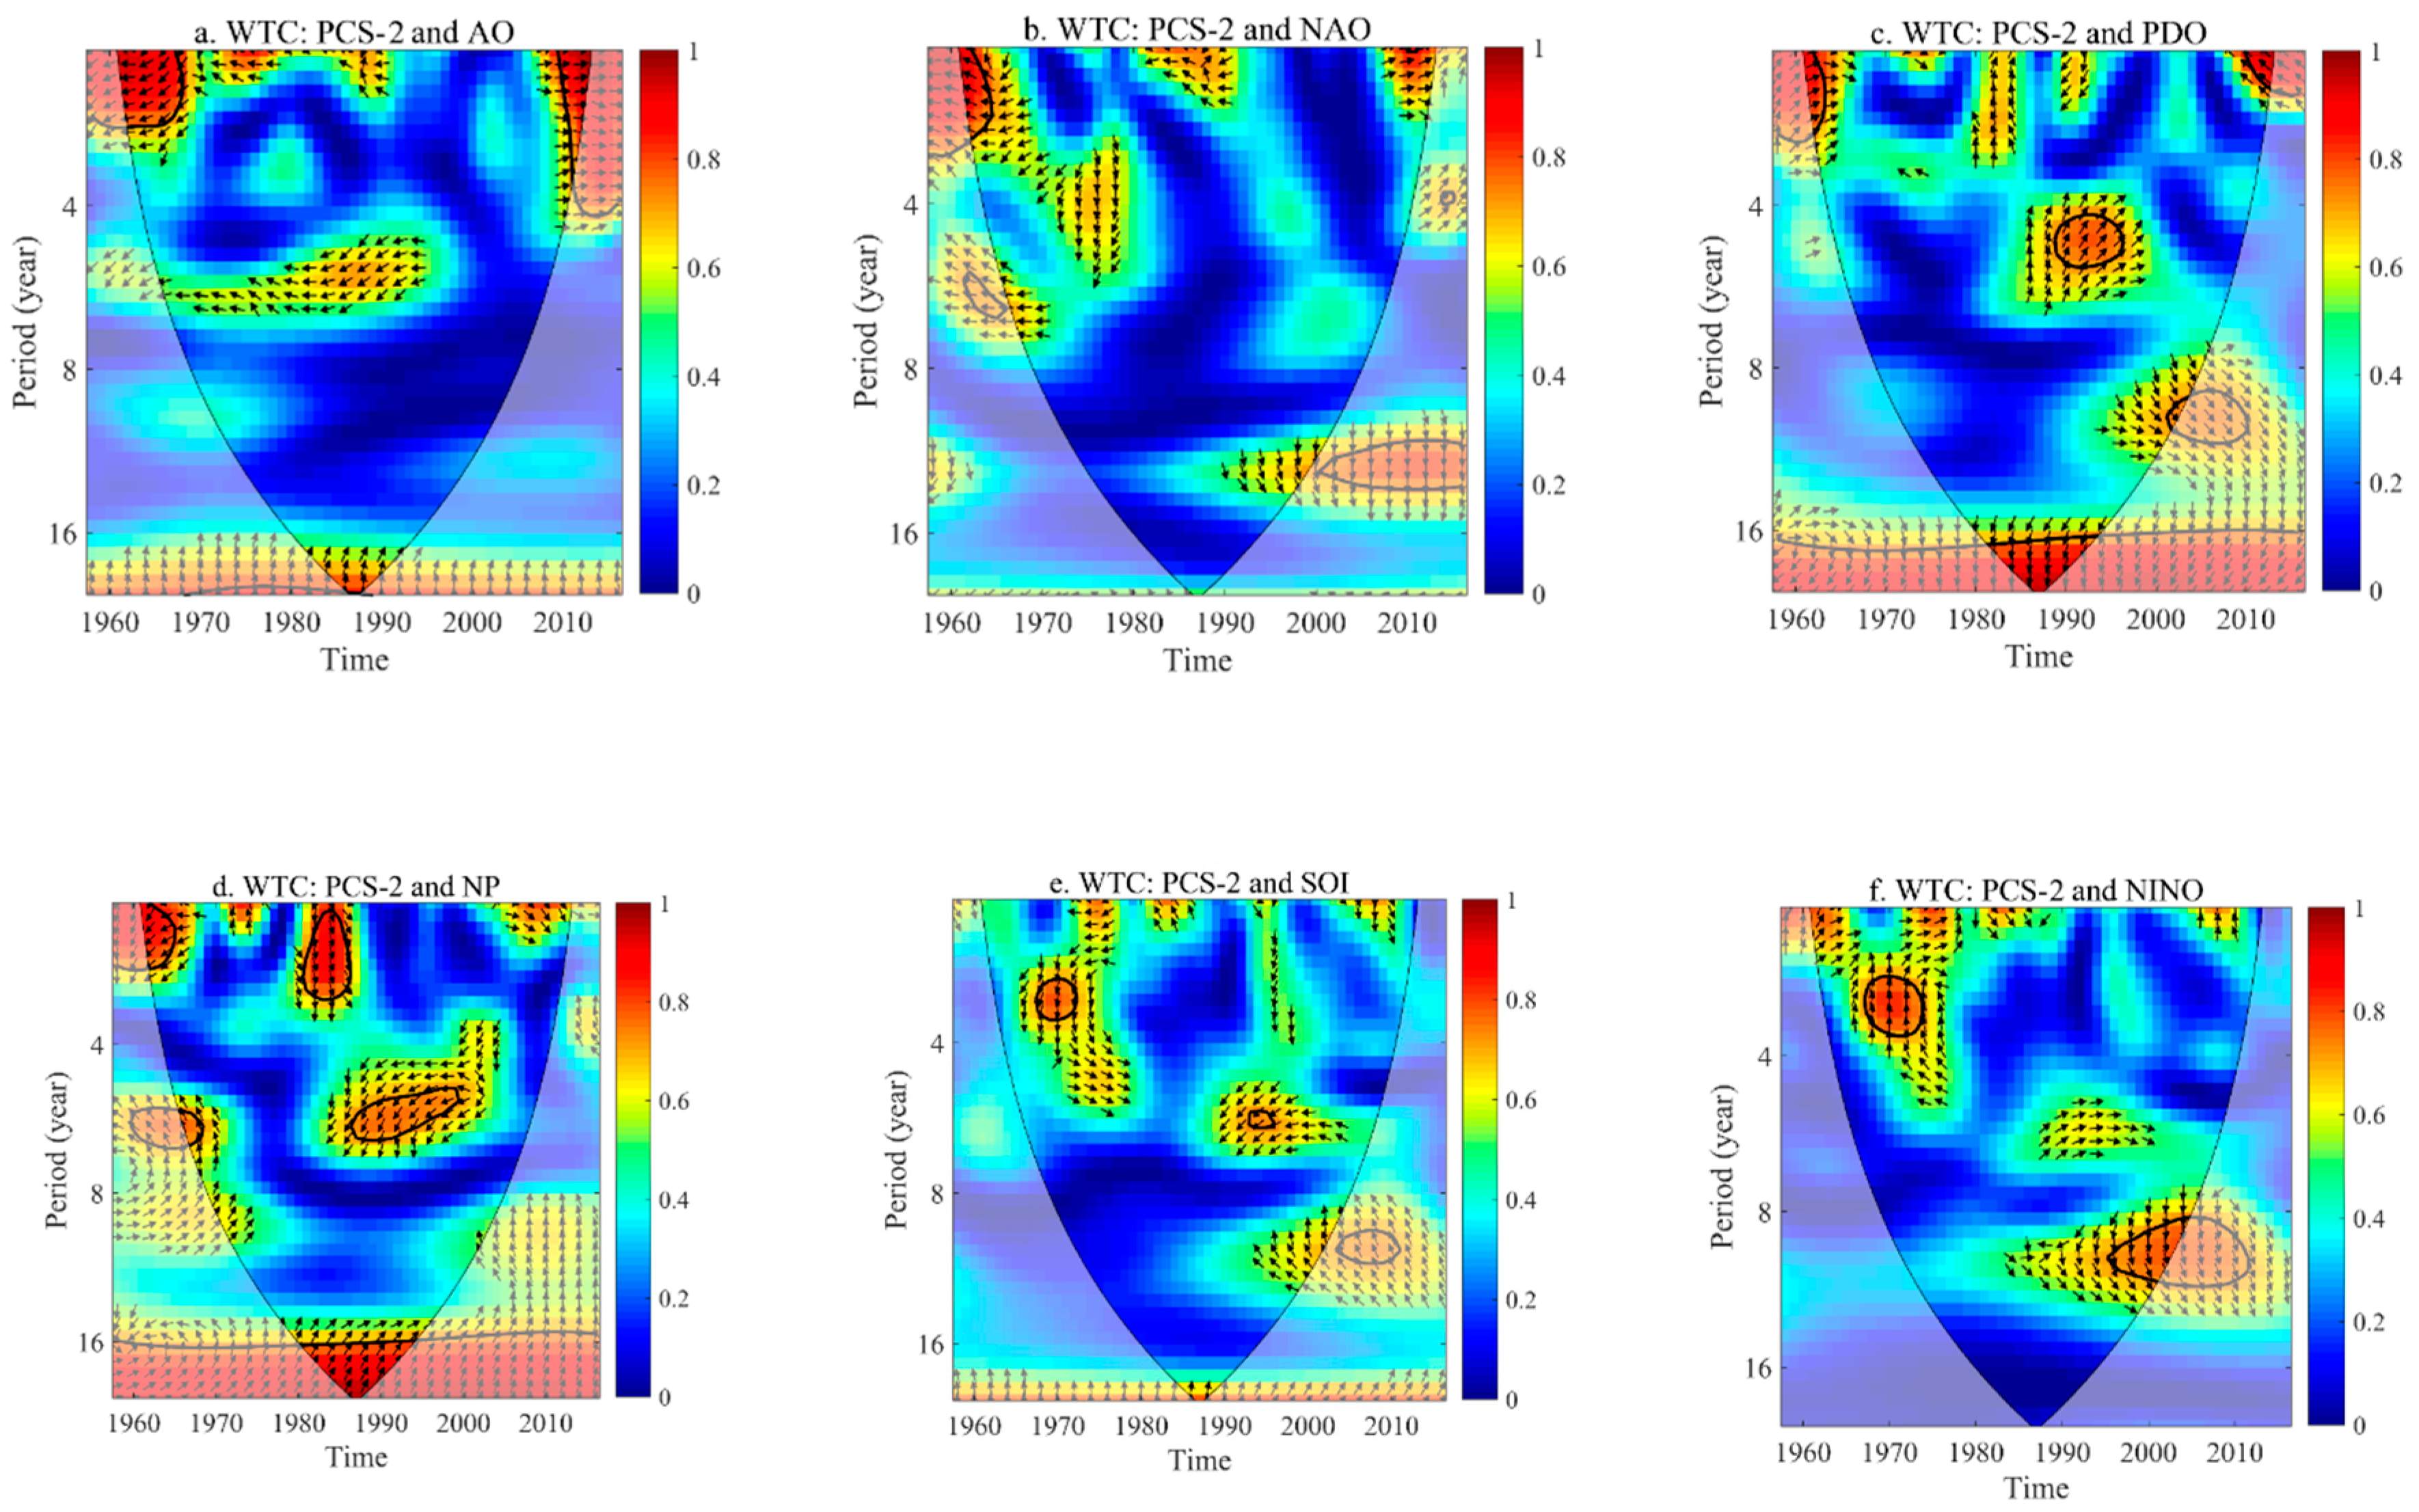
The second component explains 20.95% of the total variance and shows a spatial pattern of higher rotated principle component values in the northern area and lower values in the southern area (Table 2 and Figure 6b). There is a slightly decreasing trend in PCS-2 (Figure 6e). Figure 6e shows significant increases in the 1960s–1980s and the mid-1990s, and significant decreases at the beginning of the 1990s and the 2000s.
From Figure 8, WTCs between PCS-2 and climate oscillations do not show the presence of a continuous significant band, except for PDO and NP. The presence of significant correlation between PCS-2 and AO is only observed in the lower timescale bands in the 1960s and the 2010s (Figure 8a). For the WTC between PCS-2 and NAO, a significant 12–14-years band is detected in the 2000s–2010s (Figure 8b). PDO and NP both present significant WTC values beyond the 16-years band and some short duration lower timescale bands with PCS-2 (Figure 8c,d). SOI and NINO show a similar correlation pattern with PCS-2, with significant values for the 2–4-years and 8–10-years bands in the 1970s and the mid-1990s to the 2000s, respectively (Figure 8e,f).
The third component explains 7.76% of the total variance and shows an almost opposite spatial pattern with the first component, i.e., higher in the northern and southern regions (Table 2 and Figure 6c). Wet climate conditions (SPI values greater than 0) mainly emerge in the periods 1959–1966, 1973–1975, 1998–1991, 1993, 1995, 1998, 2001, 2005–2008, 2011 and 2013 (Figure 6f). Dry climate conditions are seen in the periods 1967–1972, 1977–1987, 1991–1992, 1994, 1997, 1999–2000, 2004, 2009, 2011 and 2015–2016. Significantly decreasing and increasing values of PCS-3 are found during the 1960s–1980s and the 1980s–2000s, respectively.
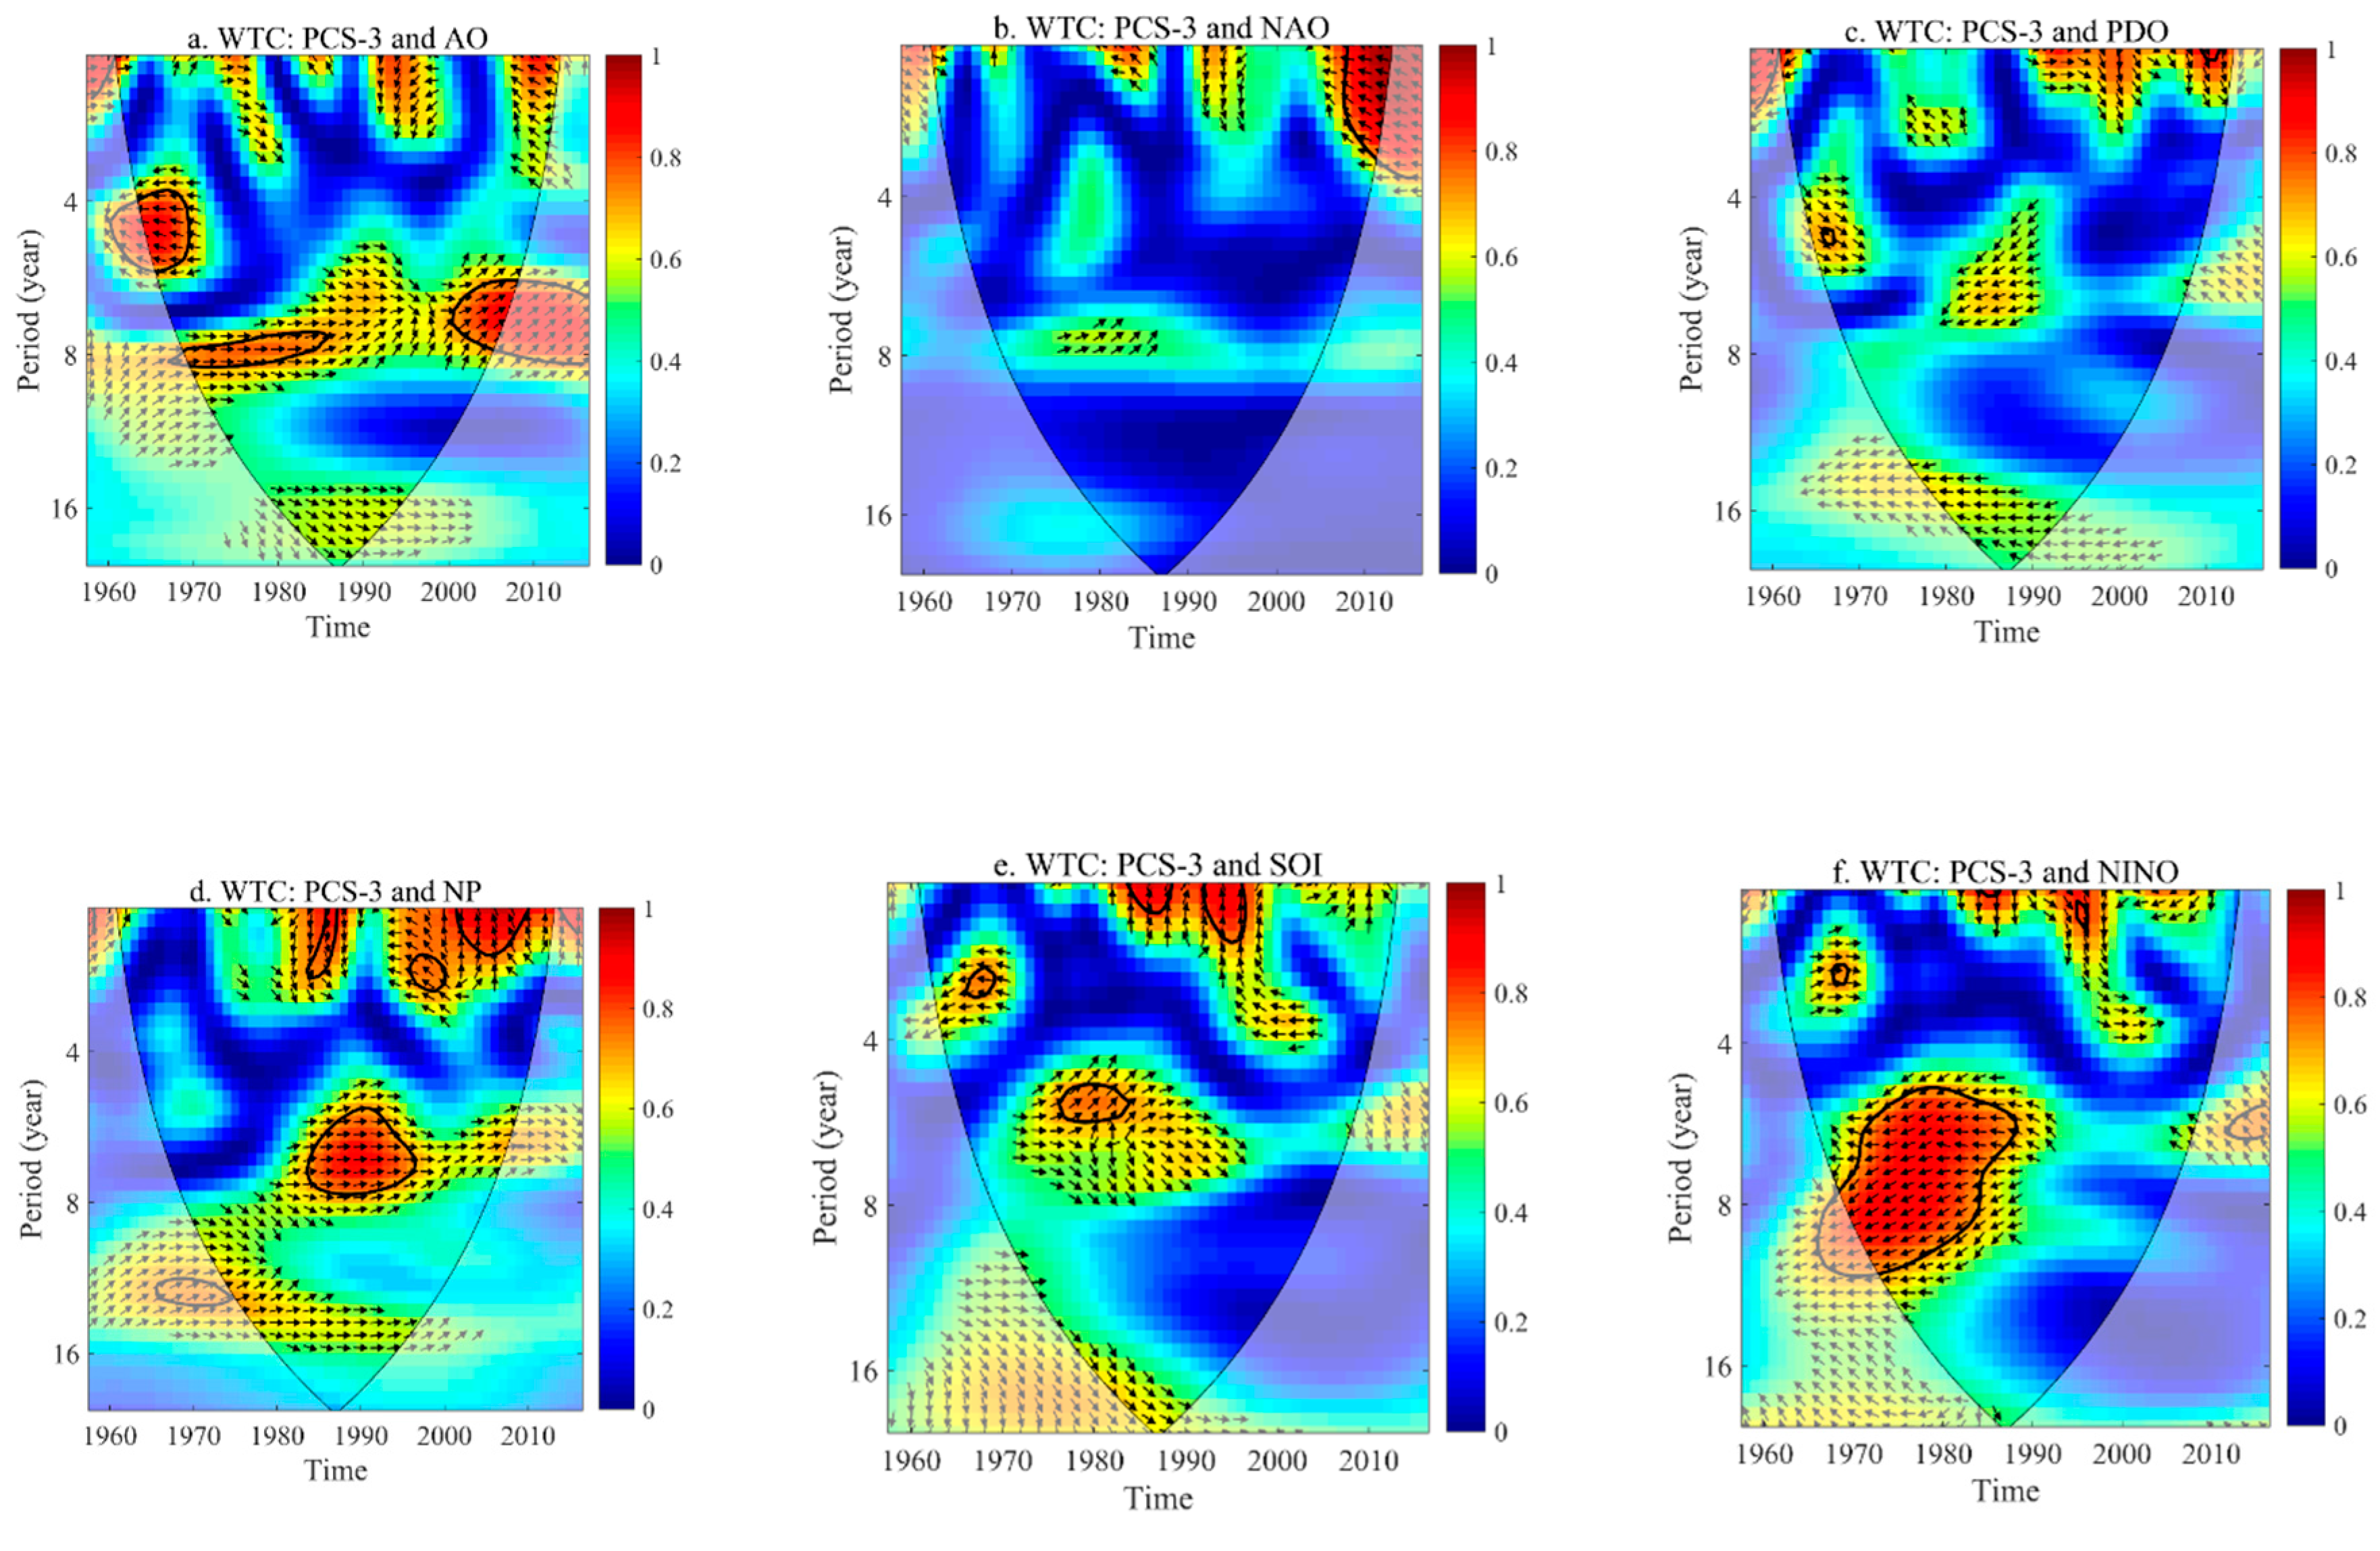
The WTCs between PCS-3 and climate oscillations show no continuous significant bands (Figure 9). Among these oscillations, AO and NINO show much higher correlations with PCS-3 in the 6–8-years bands (Figure 9a,f). NAO, PDO and SOI only show higher correlations for the lower timescale bands at multiple intervals (Figure 9b,c,e). The WTC between PCS-3 and NP shows significant values for the 2–3-years, 6–8-years and 12–14-years bands in the 1980s–2010s, the 1980s–1990s, and the late 1960s–mid-1970s, respectively (Figure 9d).
4. Conclusions
Previous research mainly focused on the temporal modes of climate time series based on linear regression, Man-Kendall trend test and Sen’s slope. Researchers paid little attention to fully understanding spatiotemporal variation patterns in the vulnerable transitional climate zones. In this study, wetness/dryness conditions were evaluated using SPI in the Yangtze River Delta during the period 1957–2016. Then the change trends of SPI-12 and frequencies of wet/dry events were analyzed. In addition, the PCA method was adopted to detect the spatiotemporal patterns of climate tendency. Furthermore, the possible link between climate tendency modes and main large-scale climate oscillations were established. This will help us recognize regional climate tendency and flood/drought events and help with agriculture sustainability and water resources management. The main conclusions of the study are as follows:
- (1)
- After removing the serial correlations in time series of SPI-12, increasing SPI-12 trends were found to dominate in the YRD, except for the northern regions where SPI-12 trends tend to be negative. The meteorological stations with significant increasing trends are mainly located in the southeastern region.
- (2)
- Based on the mapping of distribution patterns of wet/dry event frequencies, meteorological stations with high wetness and dryness frequencies are mainly located in the southern and northwestern regions and part of the southeast regions. Temporally, the climate presents a tendency towards more wet conditions, since large-scale dry events mainly happened in the 1960s–1970s, and wet events in the 1990s and 2010s.
- (3)
- Based on Principal Component Analysis of SPI-12, the whole region could be divided into three main sub-regions. The first sub-region encompasses the eastern, middle and western regions of the YRD, and the SPI-12 here is mainly influenced by NAO and SOI. The SPI-12 in the second sub-region, i.e., the northern regions, is influenced by PDO and NP. In the third sub-region of the southeastern regions, no clear relationship with climate oscillations is found.
Author Contributions
Y.W. and Y.X. conceived the manuscript and analyzed the data; Y.W. wrote the paper; Y.X. proofread the paper. All authors have read and agreed to the published version of the manuscript.
Funding
This research was funded by the National Natural Science Foundation of China under Grant 42001025, 41771032 and 41901026; the Research Program of Ningbo University under Grant of 026-422002842.
Acknowledgments
The authors wish to thank the National Meteorological Information Center of China Meteorological Administration and Earth System Research Laboratory of the United States for offering the meteorological data.
Conflicts of Interest
The authors declare no conflict of interest.
References
- Alexander, L.V.; Zhang, X.; Peterson, T.C.; Caesar, J.; Gleason, B.; Tank, A.M.G.K.; Haylock, M.; Collins, D.; Trewin, B.; Rahimzadeh, F.; et al. Global observed changes in daily climate extremes of temperature and precipitation. J. Geogr. Res. 2006, 111, D05109. [Google Scholar] [CrossRef] [Green Version]
- Groisman, P.Y.; Knight, R.W.; Easterling, D.R.; Karl, T.R.; Hegerl, G.C.; Razuvaev, V.N. Trends in intense precipitation in the climate record. J. Clim. 2005, 18, 1326–1350. [Google Scholar] [CrossRef]
- Gorsuch. Impacts, Adaptation, and Vulnerability. Part B: Regional Aspects. Contribution of Working Group II to the Fifth Assessment Report of the Intergovernmental Panel on Climate Change; Cambridge University Press: Cambridge, UK; New York, NY, USA, 2014. [Google Scholar]
- Allen, M.; Ingram, W.J. Constraints on future changes in climate and the hydrologic cycle. Nature 2002, 419, 224–232. [Google Scholar] [CrossRef] [PubMed]
- Easterling, D.R.; Evans, J.L.; Groisman, P.Y.; Karl, T.R.; Kunkel, K.E.; Ambenje, P. Observed variability and trends in extreme climate events: A brief review. Bull. Am. Meteorol. Soc. 2000, 81, 417–425. [Google Scholar] [CrossRef] [Green Version]
- Xu, C.Y.; Widén, E.; Halldin, S. Modeling hydrological consequences of climate change-progress and challenge. Adv. Atmos. Sci. 2005, 22, 789–797. [Google Scholar] [CrossRef]
- Petroselli, A. A generalization of the EBA4SUB rainfall–runoff model considering surface and subsurface flow. Hydrol. Sci. J. 2020. [Google Scholar] [CrossRef]
- Petroselli, A.; Asgharinia, S.; Sabzevari, T.; Saghafian, B. Comparison of design hydrograph estimation methods for ungauged basins in Iran. Hydrol. Sci. J. 2020, 65, 127–137. [Google Scholar] [CrossRef]
- Pellicani, R.; Parisi, A.; Iemmolo, G.; Apollonio, C. Economic Risk Evaluation in Urban Flooding and Instability-Prone Areas: The Case Study of San Giovanni Rotondo (Southern Italy). Geosciences 2018, 8, 112. [Google Scholar] [CrossRef] [Green Version]
- Mishra, A.K.; Singh, V.P. A review of drought concepts. J. Hydrol. 2010, 391, 202–216. [Google Scholar] [CrossRef]
- Eslamian, S.; Ostad-Ali-Askari, K.; Singh, V.P.; Dalezios, N.R.; Ghane, M.; Yihdego, Y.; Matouq, M. A review of drought indices. Int. J. Constr. Res. Civil Eng. 2017, 3, 48–66. [Google Scholar]
- Wang, Y.; Xu, Y.; Lei, C.; Li, G.; Han, L.; Song, S.; Yang, L.; Deng, X. Spatio-temporal characteristics of precipitation and dryness/wetness in Yangtze River Delta, eastern China, during 1960–2012. Atmos. Res. 2016, 172–173, 196–205. [Google Scholar] [CrossRef]
- Huang, Q.; Zhang, Q.; Singh, V.P.; Gu, X.; Shi, P. Variation of dryness/wetness across China: Changing properties, drought risks, and causes. Glob. Planet. Chang. 2017, 155, 1–12. [Google Scholar] [CrossRef]
- Yao, N.; Li, Y.; Lei, T.; Peng, L. Drought evolution, severity and trends in mainland China over 1961–2013. Sci. Total Environ. 2018, 616–617, 73–89. [Google Scholar] [CrossRef] [PubMed]
- Strzepek, K.; Yohe, G.; Neumann, J.; Boehlert, B. Characterizing changes in drought risk for the United States from climate change. Environ. Res. Lett. 2010, 5, 044012. [Google Scholar] [CrossRef]
- Kumar, M.N.; Murthy, C.S.; Sesha, S.M.V.R.; Roy, P.S. On the use of Standardized Precipitation Index (SPI) for drought intensity assessment. Meteorol. Appl. 2009, 16, 381–389. [Google Scholar] [CrossRef] [Green Version]
- Pai, D.S.; Sridhar, L.; Guhathakurta, P.; Hatwar, H.R. District-wide drought climatology of the southwest monsoon season over India based on standardized precipitation index (SPI). Nat. Hazards 2011, 59, 1797–1813. [Google Scholar] [CrossRef]
- Lloyd-Hughes, B.; Saunders, M.A. A drought climatology for Europe. Int. J. Climatol. 2002, 22, 1571–1592. [Google Scholar] [CrossRef]
- Zarch, M.A.A.; Sivakumar, B.; Sharma, A. Droughts in a warming climate: A global assessment of standardized precipitation index (SPI) and reconnaissance drought index. J. Hydrol. 2015, 526, 183–195. [Google Scholar] [CrossRef]
- Zhai, J.; Su, B.; Krysanova, V.; Vetter, T.; Gao, C.; Jiang, T. Spatial variation and trends in PDSI and SPI indices and their relation to streamflow in 10 large regions of China. J. Clim. 2010, 23, 649–663. [Google Scholar] [CrossRef]
- Xu, K.; Yang, D.; Yang, H.; Li, Z.; Qin, Y.; Shen, Y. Spatio-temporal variation of drought in China during 1961–2012: A climatic perspective. J. Hydrol. 2015, 526, 253–264. [Google Scholar] [CrossRef]
- Zhang, Q.; Li, J.; Singh, V.P.; Bai, Y. SPI-based evolution of drought events in Xinjiang, China. Nat. Hazards 2012, 64, 481–492. [Google Scholar] [CrossRef]
- Zhao, H.; Pan, X.; Wang, Z.; Jiang, S.; Liang, L.; Wang, X.; Wang, X. What were the changing trends of seasonal and annual aridity indexes in northwestern China during 1961–2015? Atmos. Res. 2019, 222, 154–162. [Google Scholar] [CrossRef]
- Darand, M.; Sohrabi, M.M. Identifying drought- and flood-prone areas based on significant changes in daily precipitation over Iran. Nat. Hazards 2017, 90, 1427–1446. [Google Scholar] [CrossRef]
- Zhou, H.; Liu, Y. Spatio-temporal pattern of meteorological droughts and its possible linkage with climate variability. Int. J. Climatol. 2018, 38, 2082–2096. [Google Scholar] [CrossRef]
- He, S.; Gao, Y.; Li, F. Impact of Arctic Oscillation on the East Asian Climate: A review. Earth-Sci. Rev. 2017, 164, 48–62. [Google Scholar] [CrossRef] [Green Version]
- Tabari, H.; Talaee, H.; Some’e, S.; Willems, P. 2014. Possible influences of North Atlantic Oscillation on winter reference evapotranspiration in Iran. Glob. Planet. Chang. 2014, 177, 28–39. [Google Scholar] [CrossRef]
- Xu, Z.Z.; Takeuchi, K.; Ishidaira, H. Correlation between El Niño-Southern Oscillation (ENSO) and precipitation in South-east Asia and the Pacific region. Hydrol. Process. 2004, 18, 107–123. [Google Scholar] [CrossRef]
- Zhong, Y.; Wang, B.; Zou, C.B.; Hu, B.X.; Liu, C.; Hao, Y. On the teleconnection patterns to precipitation in the eastern Tianshan Mountains, China. Clim. Dyn. 2017, 49, 3123–3139. [Google Scholar] [CrossRef]
- Ren, G.; Liu, Y.; Sun, X. Spatial and temporal variability over mainland China: III: Cause for recent trends. Adv. Water Sci. 2016, 27, 327–348. (In Chinese) [Google Scholar]
- Ren, G.; Ren, Y.; Zhan, Y.; Sun, X.; Liu, Y.; Chen, Y.; Wang, T. Spatial and temporal variability over mainland China: II: Recent trends. Adv. Water Sci. 2015, 26, 451–465. (In Chinese) [Google Scholar]
- Duan, Y.; Zhu, K.; Ma, Z.; Yang, Q. Characteristics of precipitation concentration index (PCI) variations and monthly distribution of annual precipitation in China. Chin. J. Atmos. Sci. 2014, 38, 1124–1136. (In Chinese) [Google Scholar]
- Xu, Y.; Xu, Y.; Wang, Y.; Wu, L.; Li, G.; Song, S. Spatial and temporal trends of reference crop evapotranspiration and its influential variables in Yangtze River Delta, eastern China. Theor. Appl. Climatol. 2017, 130, 945–958. [Google Scholar] [CrossRef]
- Liu, Z.; Wang, Y.; Shao, M.; Jia, X.; Li, X. Spatiotemporal analysis of multiscalar drought characteristics across the Loess Plateau of China. J. Hydrol. 2016, 534, 281–299. [Google Scholar] [CrossRef]
- Kendall, M.G. Rank Correlation Methods, 4th ed.; Charles Griffin: London, UK, 1975. [Google Scholar]
- Mann, H.B. Nonparametric tests against trend. Econometrica 1945, 13, 245–259. [Google Scholar] [CrossRef]
- Yue, S.; Wang, C. The Mann–Kendall test modified by effective sample size to detect trend in serially correlated hydrological series. Water Resour. Manag. 2004, 18, 201–218. [Google Scholar] [CrossRef]
- Richman, M.B. Rotation of principal components. J. Clim. 1986, 6, 293–335. [Google Scholar] [CrossRef]
- Xu, Y.; Wu, Y.; Xu, G. Variation of reference evapotranspiration and its teleconnection with multiple large-scale climate oscillation in the Yangtze River Delta, China. Int. J. Climatol. 2019, 39, 2630–2645. [Google Scholar] [CrossRef]
- Xu, Y.; Wu, Y.; Xu, G.; Liu, M. Characteristics of surface humidity and extreme drought/wet events in Yangtze River Delta. J. Nat. Resour. 2017, 32, 1579–1590. (In Chinese) [Google Scholar]
- Liu, S.; Zheng, Y.; Wang, H.; Wu, Q. Analysis of heavy rain in Huaihe River Basin during 28 June to July, 1998. Acta Meteorol. Sinica 2002, 12, 774–779. (In Chinese) [Google Scholar]
- Lu, E.; Ding, Y.; Li, Y. Isentropic potential vorticity analysis and cold air activity during the period of excessively heavy rain over Changjiang-Huaihe River Basin in 1991. Q. J. Meteorol. 1994, 5, 266–274. (In Chinese) [Google Scholar]
- Jiang, H. The characteristics and the cause analyses of vapor transportation in the 2003 Huaihe River rainfall period. Torrential Rain Disasters 2007, 2, 118–124. (In Chinese) [Google Scholar]
- Feng, L.; Luo, G. Analysis on fuzzy risk of landfall typhoon in Zhejiang province of China. Math. Comput. Simulat. 2009, 79, 3258–3266. [Google Scholar] [CrossRef]
- Liu, D.; Pang, L.; Xie, B. Typhoon disaster in China: Prediction, prevention and mitigation. Nat. Hazards 2009, 49, 421–436. [Google Scholar] [CrossRef]
Figure 1.
Location of the study region in eastern China.

Figure 2.
Autocorrelation (a) and partial autocorrelation functions (b) of SPI-12 at three representative stations.
Figure 2.
Autocorrelation (a) and partial autocorrelation functions (b) of SPI-12 at three representative stations.

Figure 3.
Spatial patterns of change trends calculated by MK (a) and MMK (b).

Figure 4.
Spatial patterns of the frequencies (%) for different types of wet/dry events.

Figure 5.
Percentages of stations affected by different types of wet/dry events.

Figure 6.
Spatial and temporal patterns of the first three rotated principal components of SPI-12 (a–c first three rotated loading patterns of the principal components, d–f time series of the corresponding rotated principal component scores (PCS)).
Figure 6.
Spatial and temporal patterns of the first three rotated principal components of SPI-12 (a–c first three rotated loading patterns of the principal components, d–f time series of the corresponding rotated principal component scores (PCS)).

Figure 7.
Wavelet coherence spectrum between PCS-1 and climate oscillations (a–f climate oscillations of AO, NAO, PDO, NP, SOI and NINO, respectively).
Figure 7.
Wavelet coherence spectrum between PCS-1 and climate oscillations (a–f climate oscillations of AO, NAO, PDO, NP, SOI and NINO, respectively).

Figure 8.
Wavelet coherence spectrum between PCS-2 and climate oscillations (a–f climate oscillations of AO, NAO, PDO, NP, SOI and NINO, respectively).
Figure 8.
Wavelet coherence spectrum between PCS-2 and climate oscillations (a–f climate oscillations of AO, NAO, PDO, NP, SOI and NINO, respectively).

Figure 9.
Wavelet coherence spectrum between PCS-3 and climate oscillations (a–f climate oscillations of AO, NAO, PDO, NP, SOI and NINO, respectively).
Figure 9.
Wavelet coherence spectrum between PCS-3 and climate oscillations (a–f climate oscillations of AO, NAO, PDO, NP, SOI and NINO, respectively).


Table 1.
Classification of wet/dry events.
| Range of Standardized Precipitation Index (SPI) Value | Classification |
|---|---|
| ≥2.0 | Extremely wet |
| 1.5 to 2.0 | Severely wet |
| 1.0 to 1.5 | Moderately wet |
| −1.0 to 1.0 | Nearly normal |
| −1.5 to −1.0 | Moderately dry |
| −2.0 to −1.5 | Severely dry |
| ≤–2.00 | Extremely dry |
Table 2.
Percentage of variance explained by the first six rotated principle components for SPI-12.
| Component | Variance (%) | Cumulative Variance (%) |
|---|---|---|
| 1 | 37.62 | 37.62 |
| 2 | 20.95 | 58.57 |
| 3 | 7.76 | 66.33 |
| 4 | 4.25 | 70.58 |
| 5 | 3.52 | 74.10 |
| 6 | 3.04 | 77.14 |
© 2020 by the authors. Licensee MDPI, Basel, Switzerland. This article is an open access article distributed under the terms and conditions of the Creative Commons Attribution (CC BY) license (http://creativecommons.org/licenses/by/4.0/).
Share and Cite
MDPI and ACS Style
Wu, Y.; Xu, Y. Assessing the Climate Tendency over the Yangtze River Delta, China: Properties, Dry/Wet Event Frequencies, and Causes. Water 2020, 12, 2734. https://doi.org/10.3390/w12102734
AMA Style
Wu Y, Xu Y. Assessing the Climate Tendency over the Yangtze River Delta, China: Properties, Dry/Wet Event Frequencies, and Causes. Water. 2020; 12(10):2734. https://doi.org/10.3390/w12102734
Chicago/Turabian StyleWu, Yanfei, and Yu Xu. 2020. "Assessing the Climate Tendency over the Yangtze River Delta, China: Properties, Dry/Wet Event Frequencies, and Causes" Water 12, no. 10: 2734. https://doi.org/10.3390/w12102734
Note that from the first issue of 2016, this journal uses article numbers instead of page numbers. See further details here.