Water Balance for a Tropical Lake in the Volcanic Highlands: Lake Tana, Ethiopia
by
 , , and
Muluken L. Alemu
1,2, 
Abeyou W. Worqlul
3,
Fasikaw A. Zimale
1,
Seifu A. Tilahun
1 and
Tammo S. Steenhuis
1,4,* 1
Faculty of Civil and Water Resources Engineering, Bahir Dar Institute of Technology, Bahir Dar University, P.O. Box 26 Bahir Dar, Ethiopia
2
Ethiopian Construction Works Corporation, P.O. Box 21951/100 Addis Ababa, Ethiopia
3
Texas A&M AgriLife Research, Temple, TX 76502, USA
4
Department of Biological and Environmental Engineering, Cornell University, Ithaca, NY 14853, USA
*
Author to whom correspondence should be addressed.
Water 2020, 12(10), 2737; https://doi.org/10.3390/w12102737
Submission received: 3 September 2020
/
Revised: 22 September 2020
/
Accepted: 24 September 2020
/
Published: 30 September 2020
(This article belongs to the Special Issue Hydrology and Sedimentology of Hilly and Mountainous Landscapes)
Abstract
:Lakes hold most of the freshwater resources in the world. Safeguarding these in a changing environment is a major challenge. The 3000 km2 Lake Tana in the headwaters of the Blue Nile in Ethiopia is one of these lakes. It is situated in a zone destined for rapid development including hydropower and irrigation. Future lake management requires detailed knowledge of the water balance of Lake Tana. Since previous water balances varied greatly this paper takes a fresh look by calculating the inflow and losses of the lake. To improve the accuracy of the amount of precipitation falling on the lake, two new rainfall stations were installed in 2013. The Climate Hazards Group Infrared Precipitation Version two (CHIRPS-v2) dataset was used to extend the data. After reviewing all the previous studies and together with our measurements, it was found that the period of 1990–1995 likely had the most accurate gauged discharge data. During some months in this period, the lake water balance was negative. Since the river inflow to the lake cannot be negative, water was either lost from the lake via the subsurface through faults, or the outflow measurements were systematically underestimated. Based on the evaporation rate of 1650 mm, we found that unaccounted loss was 0.6 km3 a−1, equivalent to 20 cm of water over the lake area each year. This implies the need for reliable rainfall data and improved river discharge measurements over a greater portion of the basin both entering and exiting the lake. Also, integrated hydrological and geologic investigations are needed for a better understanding of the unaccounted water losses and quantifying the amount of subsurface flow leaving the lake.
1. Introduction
Lakes provide a wide range of ecosystem services and are the largest source of freshwater [1]. Permanent changes in lake levels outside normal fluctuations have a disastrous economic and environmental impact [1]. Examples of a decrease in lake levels due to climate change and overexploitation due to irrigation were witnessed in the past in Lake Chad in West Africa, the Aral Sea in central Asia, and to a lesser degree in Lake Haromaya in southern Ethiopia [2,3,4]. Lake levels have been increasing in Lake Victoria with a remarkable jump between 1961 and 1964 due to greatly increased rainfall [5]. In addition, many smaller lakes are extremely sensitive to any decrease or increase in rainfall more than land-use changes [6].
Concern has been raised about the future ecological services of the shallow Lake Tana in the northwestern Ethiopian highlands. Lake level fluctuations directly affect tourism, fisheries, transportation, and the operation of the Tana-Beles and Tis-Abay hydropower plants. Lake Tana is the largest lake in Ethiopia and the third-largest in the Nile Basin [7]. Because of the unique lake fauna with 26 different fish species of which 15 are endemic [8], the lake is registered as a United Nations Educational, Scientific, and Cultural Organization (UNESCO) World Heritage Site.
In 2005, Lake Tana was designated by the Ethiopian government as a growth corridor for enhanced economic development [9,10]. Irrigation during the long dry monsoon was seen as a way to increase agricultural production and to mitigate the impacts of climate stress associated with drought and extreme heat [11]. As part of this initiative, three dams (Koga, Rib, and Megech) for storage of irrigation water have been constructed [12] and two other dams are planned [8]. Eventually, 100,000 ha will be irrigated; also, a tunnel was built for inter-basin water transfer between Lake Tana and the Beles for hydro-electric power generation, and power generation started in May 2010 [13]. Presently, the water quality of the lake has declined significantly due to sediment and nutrient influxes depositing 8 mm of sediment per year in the lake bed [7,14] and water hyacinths began to appear 10 years ago and cover a significant portion of the northeastern shore of the lake [15].
For proper management of the lake level, accurate historic and current streamflow data are needed. Grabham [16] investigated the very first storage capacity of Lake Tana in the early 1920s. In the early 1930s, Cheesman [17] performed a lake reconnaissance and reported that the lake was pristine and had sandy bottoms near the inlets of the major rivers. Except for the outflow data of the lake from 1921–1933 [18,19], published streamflow data were not available until the United States Bureau of Reclamation carried out a major survey of the land and water resources of the Blue Nile basin between 1958 and 1963 [20] and even that data cannot be obtained easily.
Since then, several water balance studies have been published by both hydrologists and geologists (Table 1). The first water balance for Lake Tana was published only 20 years ago by Conway [19] using the outflow data from 1929–1931 and rainfall data for the period 1951–1987 in which lake inflow was not estimated. In the same year, Sutcliffe, et al. [20] confirmed that the only streamflow data that were available for the Blue Nile basin before 1964 were for the outflow of Lake Tana. Subsequent water balances of Lake Tana were made by Kebede, et al. [7] for the period 1960–1992; Aragie [21] for the period 1964–2000; Pelgrum, et al. [22] for the year 2001; SMEC [8] for 1960 to 1995; Gieske, et al. [23] for 1992–2003; Wale, et al. [24] for 1992–2003; Chebud, et al. [25] for 1993–2003; Setegn, et al. [26] for the years 1978 to 2004; Rientjes, et al. [27] for 1994–2003; Tegegne, et al. [28] for 1996–2002; Nigatu [29] for 1994–2004; Duan, et al. [30] for the year 2006; Dessie, et al. [31] for 2012 and 2013; Kebede, et al. [32] for 2002 and 2006; and finally Mamo, et al. [33] for 1995–2009 (Table 1). Dessie et al. [31] used two scenarios: scenario 1 used observed river discharges for most of the rivers and in scenario 2 some of the water balance terms were adjusted to decrease the unaccounted water losses. Aragie [21] overestimated the inflow from the basin with the Soil Conservation Service (SCS) curve number (CN) and adjusted the lake evaporation to close the balance; this water balance will not be further considered.
Omitting the studies in Table 1 where the annual water balance was computed for one year, the annual average precipitation on the lake varied from 1220 mm a−1 [25] to 1451 mm a−1 [7]. The annual average evaporation rate varied from 1248 mm a−1 by [26] to 1789 mm a−1 [24] with the majority of the studies reporting annual average rates above 1600 mm a−1. As expected, the annual average discharge from rivers (both gauged and ungauged catchments) into the lake varied widely from 1162 [7] to 2829 mm a−1 for an 11-year average (1995–2005) [24] and 2349 mm a−1 averaged over 2012 and 2013 in scenario 1 of Dessie et al. [31] whereby the majority of rivers were gauged. The outflow of the Lake Tana to the Blue Nile as measured with the gauging station just downstream of the outlet increased from an average 1207 mm a−1 for the period 1921–1933 to around 1600 mm a−1 for the most recent years (Table 1). Kebede, et al. [32] and Mamo, et al. [33] (both geologists by training) unlike most other studies by hydrologists measured the inflow and outflow using the isotope method on mass balance considerations.
The unaccounted losses in the studies listed in Table 1 were usually small and attributed by the authors to uncertainty in the measurements. Large unaccounted water losses were reported by Kebebe et al. [32] who assumed that 0.45 km3 a−1 (equivalent to 14.7 cm a−1 over the lake surface) was lost as evaporation in the floodplain. Dessie, et al. [31] who measured the discharge in a sizable portion of the basin, could not account for 0.74 km3 a−1 (equivalent to 273 mm a−1) in their scenario 1. They suggested that the irrigation water and evaporation from the flood plain as reasons for unaccounted losses. Setegn, et al. [26] calibrated the Soil and Water Assessment Tool (SWAT) model with the flow data of the gaging station of the four main rivers. They applied the model over the whole basin and ended up with a surplus of 0.5 km3 a−1 (159 mm a−1) indicating that there is an additional loss of water than the runoff simulated by the model. Based on a chemical balance, Mamo, et al. [33] found that a leakage underflow of 0.95 km3 a−1 from Lake Tana occurred via a deep lineament network in the western margin towards the adjacent Beles basin and to a lesser degree through the southern bank to Tis Abay area (Table 1). Isotopic tracing and hydrological data confirmed the mixing of the lake water with the local groundwater [33]. This is the only study that suggested leakage via subsurface flow despite the thick clay layer on the bottom of the lake [32].
As can be seen in Table 1, the inflow from rivers and precipitation are the most uncertain terms in the prediction of the water balance. The streamflow predictions are hampered because only 40% of the Lake Tana basin is gauged consistently (Table 1). Similarly, rainfall amounts are uncertain because of the low density of the rain gauges [27,34,35,36,37]. Gieske et al. [23] expected that the precipitation over the lake was greater than on land. However, this could not be tested because only Wale, et al. [24] and Rientjes, et al. [27] had installed a rain gauge in the middle of Lake Tana at Dek Estifanos Island during their study. All other rainfall amounts on the lake were derived from the land-based station. Wale et al. [24] reported that the average rainfall was 1220 mm a−1which is less than any of the land-based systems (Table 1) opposite to the expectation of Gieske et al. [23]. Rientjes and coworkers [27] reported an average lake rainfall of 1347 mm a−1.
An accurate water balance for the lake is important because the average annual precipitation on the lake is less than the potential evaporation given the current and future irrigation developments. Especially in years with less than average rainfall, the lake potentially may not fill back up to the full capacity such as occurred in 2003. This becomes even more important in light of the recent developments around Lake Tana [13,38]. The planned 100,000 ha irrigation development [13,38] (or 7% of the watershed area) can decrease the inflow to Lake Tana by as much as 7%; since the inflow per unit lake area of the watershed is approximately equal to the additional evaporation of the irrigated area during the dry monsoon phase. In addition, eucalyptus plantation acreage has increased in the Lake Tana basin over the last 10 years [39,40,41]. Eucalyptus patches in the landscape can evaporate up to twice the rate of potential evaporation during the dry season [42] and either draw down the water table farther than without the trees in the Fogera Plain east of Lake Tana [43] or decrease the amount of direct runoff by 50% or more in the uplands [41]. Of interest is that wells in the area with eucalyptus had a greater concentration of dissolved solids than other wells [32] indicating enhanced evaporation by the trees. The objective of this study is, therefore, to improve the accuracy of Lake Tana water balance and its basin through a better understanding of unaccounted water losses, by improving both the calculations of the runoff from the ungauged watersheds and the accuracy of the precipitation on the lake.
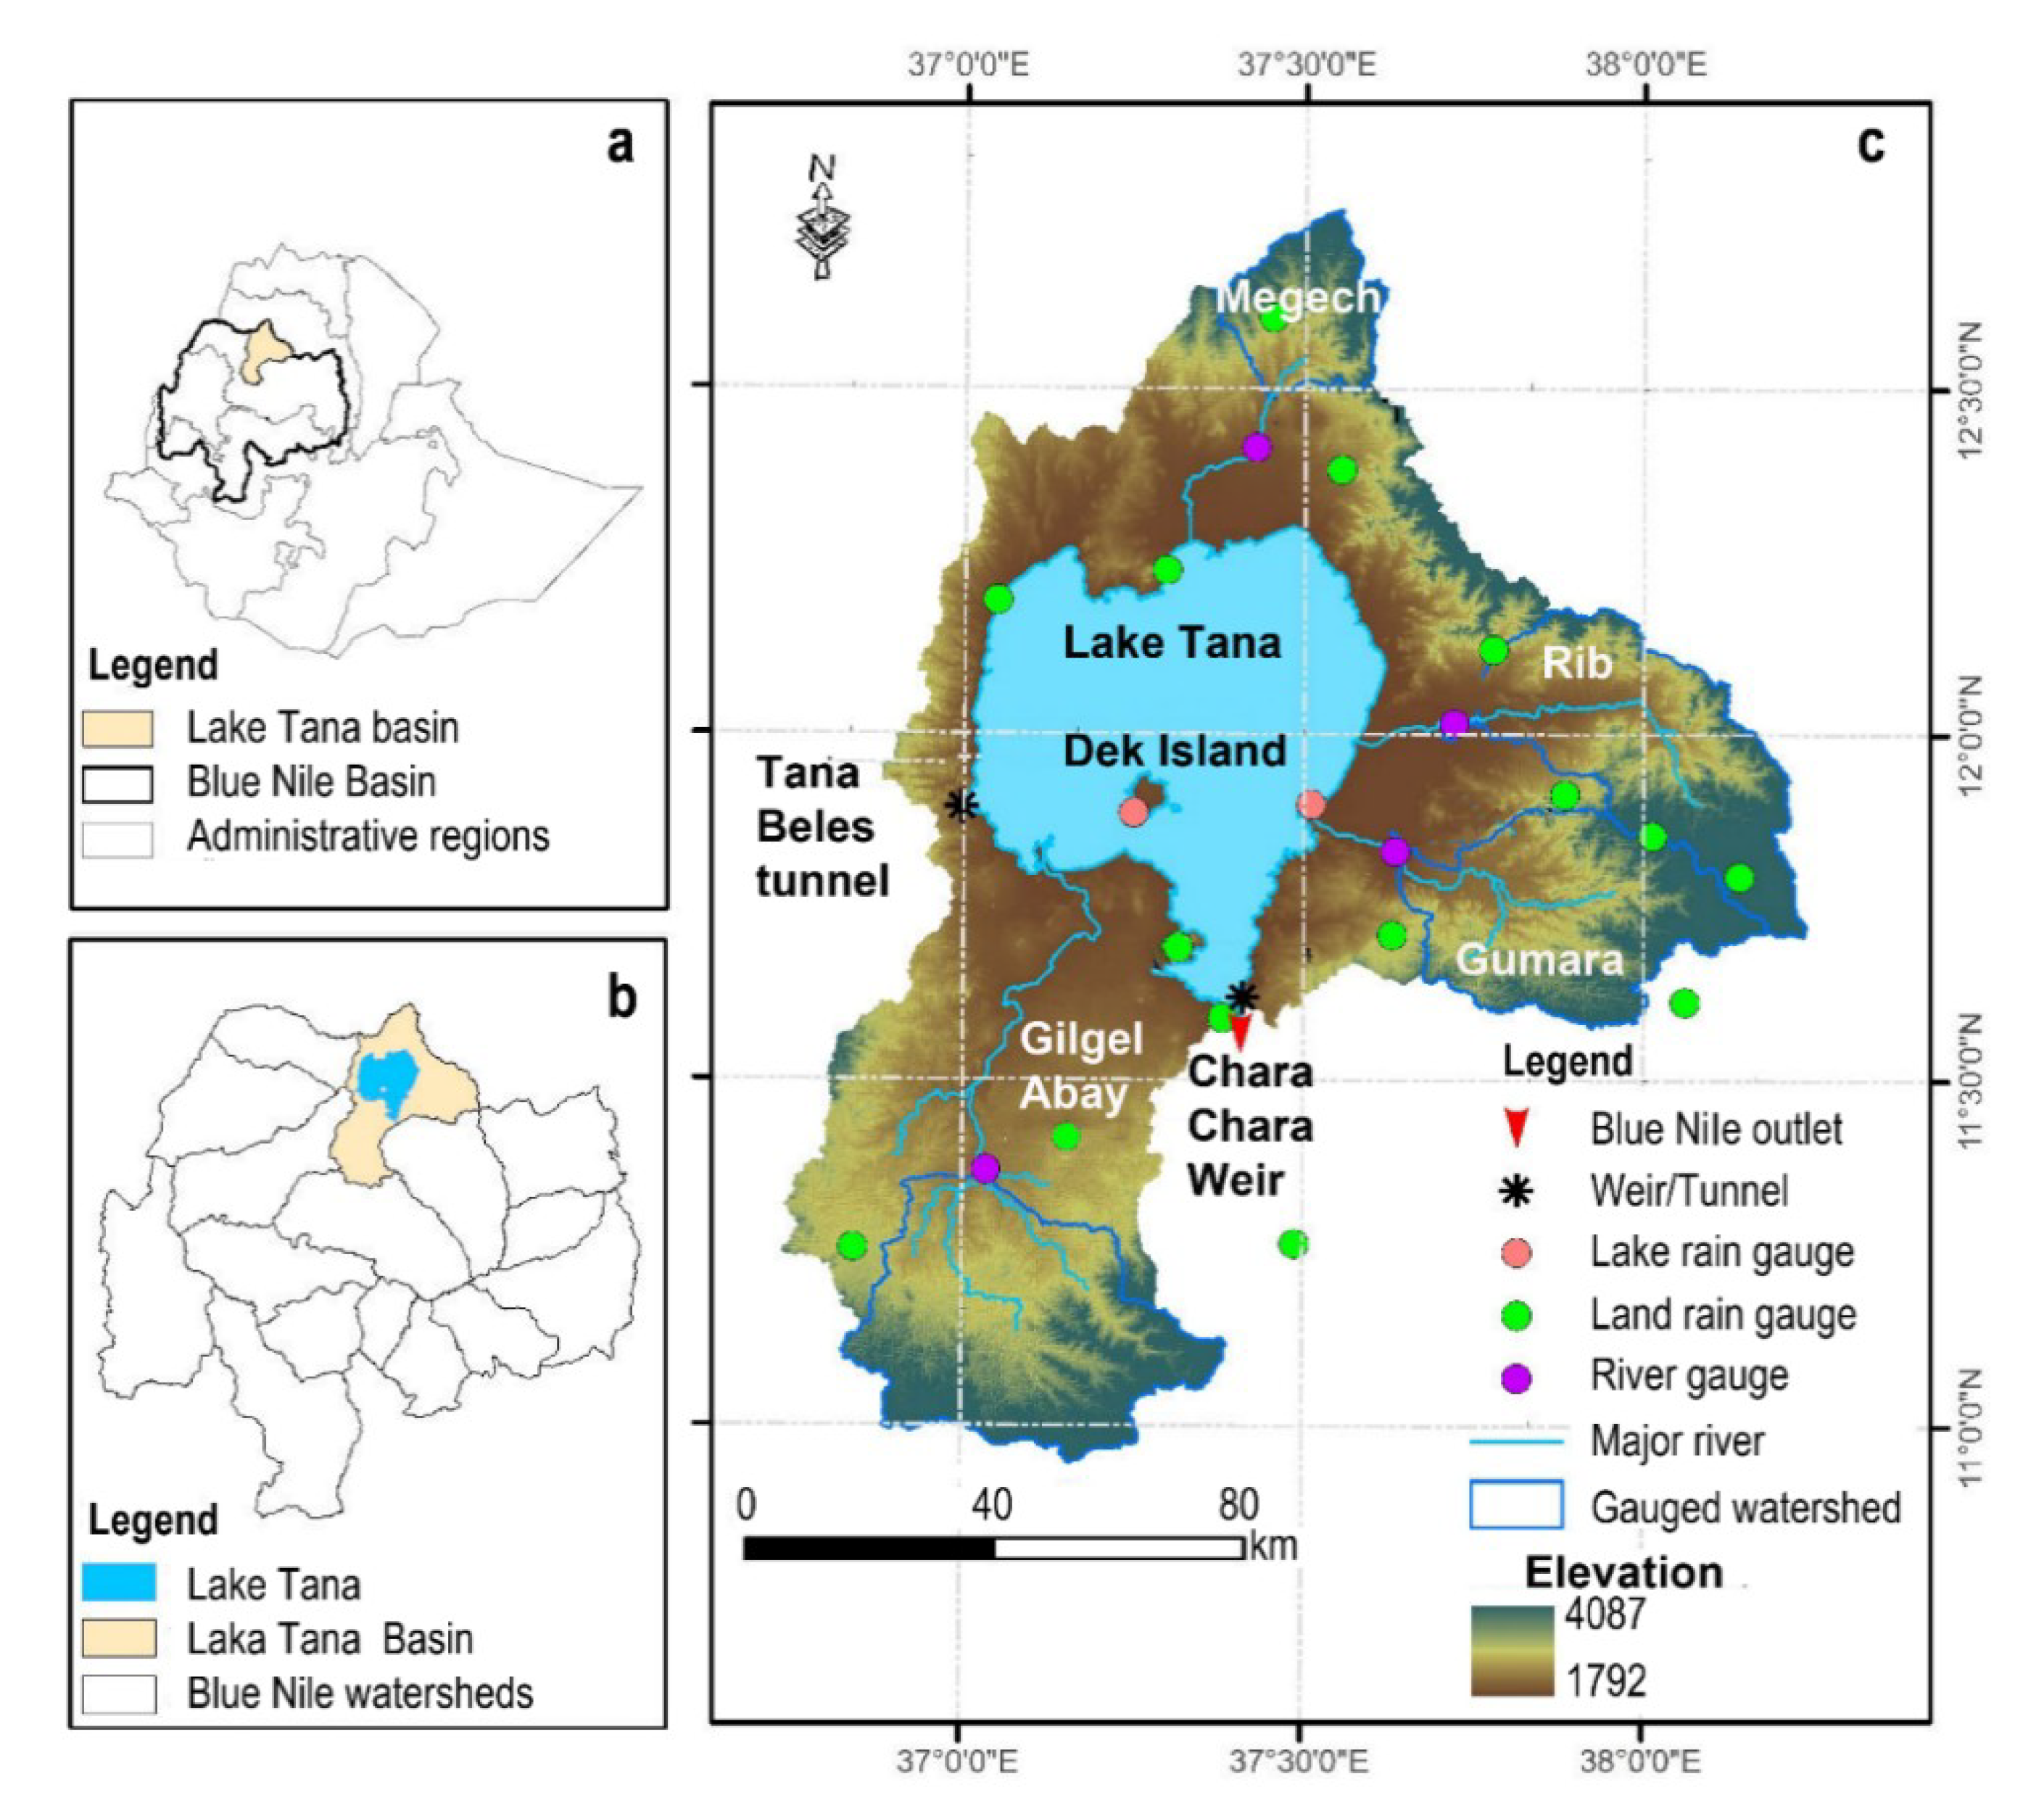
2. Lake Tana and Its Basin
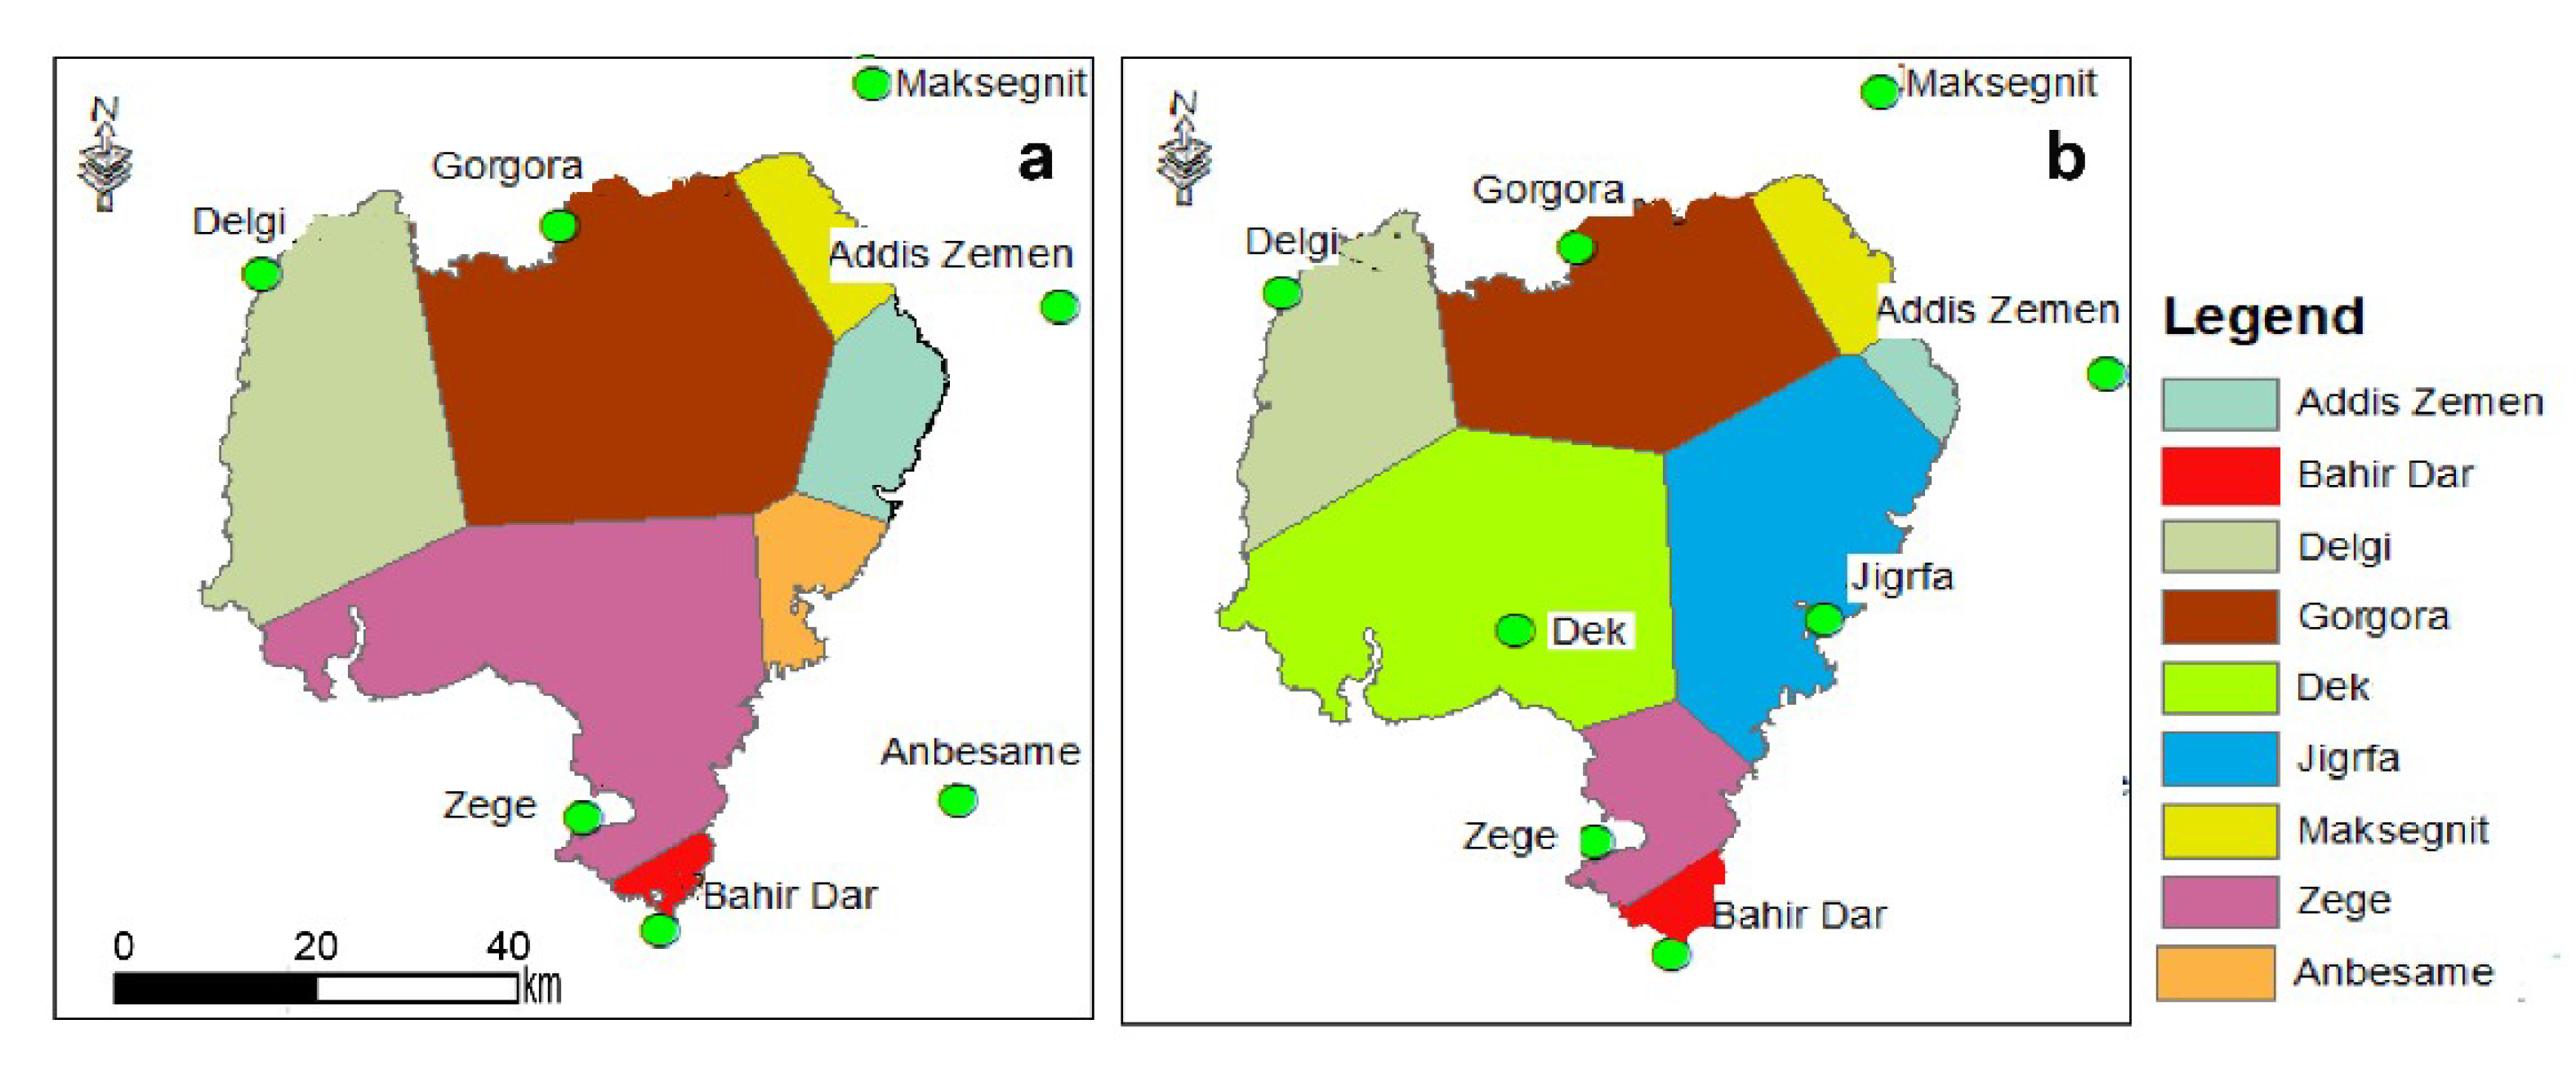
The Lake Tana basin is located in the headwaters of the Blue Nile in northwest Ethiopia. The watershed area is ~15,000 km2 including the lake that covers 20% (Figure 1). Lake Tana serves as a source of income for 3.5 million people, of whom currently 5000 are directly or indirectly involved in fishery activities [8,21]. The lake is used as a natural reservoir for hydroelectric power plants. Currently, most of the water that flowed once through the Blue Nile is diverted to the Beles basin to generate 460 MW of electricity. The 87 MW hydroelectric power plant at the Tis-Isat (Blue Nile Falls) is only used when the lake water is released through the Blue Nile to prevent the lake from exceeding its maximum operational level. The four major rivers that flow into Lake Tana- Gilgel Abay, Gumara, Rib, and Megech contribute about three-quarters of the inflow (Figure 1) [44]. Gilgel Abay entering from the south is the largest river draining 35% of the Lake Tana basin. Gumara and Rib drain each 27% of the basin and enter the lake from the east. Megech river has a drainage area that covers 11% of the basin (Figure 1c). Only the upper portions of these rivers are gauged (Table 2).
The average water level observed for the period from 1990 to 2007 was 1786.17 m a.s.l. Historically, the lowest lake level was 1784.19 m a.s.l. in June 2003, during this period the transportation and tourism were affected. The maximum lake level recorded in October 1998 was 1787.72 m a.s.l. At this level, the flood plains were inundated and affected the settlements around the lake. In 1996, the Chara Chara weir was constructed at the outlet of Lake Tana. The designed maximum lake level is 1787 m a.s.l. and the minimum operation level for hydropower is 1784 m a.s.l. The tunnel for the Tana-Beles Hydropower plant became operational in May 2010.
The mean annual rainfall (1990 to 2007) from the six stations (Bahir Dar, Zege, Addis Zemen, Maksegnit, Gorgora, and Delgi) was 1124 mm. The precipitation decreases towards the north of the lake. Most precipitation falls during the major rainfall season from June to September. The dry phase occurs in the remaining months with minor rainfall during April and May. The mean annual temperature at Bahir Dar (south of Lake Tana) was 20 °C and varies between 13 °C and 27 °C.
3. Data and Methods
3.1. Available Long-Term Hydrological, Meteorological, and Lake-Level Data
The available long-term hydrological, meteorological, and lake-level data were obtained from various sources including the Ethiopian government, web data sources, and literature. The type of data, the period over which the data were available, and the sources are listed in Table 3.
3.1.1. Precipitation
The two new self-recording rain gauge stations were installed on the eastern shores of Lake Tana in Jigrfa, and in the middle of the lake on Dek Island (Figure 1c, marked with an orange sphere). The rain gauges were self-recording and manufactured by Eikelkamp. The data were recorded for the period between May 2013 and December 2014. Daily precipitation data for 13 stations in and near the Lake Tana basin were collected from the Ethiopian National Meteorological Agency (NMA) from 1987 to 2014. The period of observation and the geographic locations of the stations are given in Table S1 as supplementary material. Only six of the stations were representative of the precipitation on the lake.
To obtain missing rainfall data for the two lake-based stations, we used the satellite-based Climate Hazards Group Infrared Precipitation Version two (CHIRPS-v2) that was created in collaboration of scientists at the US Geological Survey (USGS) and the Climate Hazards Group at the University of California, Santa Barbara (CHG, UCSB). The dataset can be downloaded from the Google Earth Engine webpage (https://earthengine.google.com/). CHIRPS-v2 data has a spatial resolution of 0.050 and it is available since 1981. Previous studies in the Lake Tana area found a strong correlation between gauged rainfall and CHIRPS-v2 rainfall data estimate [45,46,47]. After correlating the CHRIPS data with the newly recorded rainfall data (May 2013–December 2014), CHIRPS-v2 data were used to extend the newly established rainfall data to match it with the study period. The procedure is discussed in Section 3.2.2.
3.1.2. River Discharge Data
The runoff data for the four major rivers (Gilgel Abay, Gumura, Rib, and Megech) were collected from the Ethiopian Ministry of Water Irrigation and Energy (MoWIE) for the period 1987 to 2014. Only the upper portions of these rivers were gauged covering approximately 40% of the total land in the basin.
The simulated discharge data for the ungauged parts of the four rivers representing 31% of the basin were generated by Zimale, et al. [44] with the Parameter-efficient distributed (PED) model [44]. The PED model uses rainfall as one of the major input variables and predicts watershed discharge as output. During validation, the PED model predicted the monthly discharge for gauged upper parts of the three largest rivers with Nash–Sutcliffe values of over 80% [44]. According to Zimale et al. [44], the ungauged part of the watershed has similar landscape characteristics as Gilgel Abay. The discharge for the lower ungauged parts of the four major rivers was therefore simulated with the average rainfall and potential evapotranspiration of the ungauged parts and the PED calibrated model parameters of the Gilgel Abay watershed.
3.1.3. Lake Levels
The daily lake-level measurements for the period 1987 to 2014 were obtained from MoWIE for three stations: Bahir Dar, Gorgora port, and Kunzila port. The data from Bahir Dar station were complete over the study period and, therefore, were selected for this study. To check the accuracy of the MoWIE lake level data, we downloaded the data for the period 1992–2020 from Hydroweb (www.legos.obs-mip.fr/fr/soa/hydrologie/hydroweb/StationsVirtuelles/SV_Lakes/Tana.html) [48]. Lake levels in this data set were determined with satellites and thus independent from the lake levels collected by MoWIE.
3.1.4. Outflow by the Blue Nile River
The outflow data of Lake Tana in the Blue Nile were collected for the study period from MoWIE. The station is located at the Blue Nile River six kilometers downstream of the Chara Chara weir. The station has a Neyrpic cableway system and an automatic water-level recorder; records are available from MoWIE since 1960.
3.1.5. Storage Characteristics of Lake Tana
The storage and area characteristics of the lake are needed for calculating the water balance using the lake-level measurements. The relationship of the lake area and volume with the elevation of the recent bathymetric survey by Kebedew, et al. [49] was expressed as third-order polynomial functions with R2 greater than 0.997.
where is the elevation of the lake in m a.s.l, is the area in km2, and V is the volume in km3. The relationships were similar to the results obtained by Ayana [50] and Wale, et al. [24]. Since the lake level only varies between 1785 and 1788 m, we simplified the equation for this range as
Note that the many digits in Equations (3) and (4) are needed because otherwise, the rounding off errors becomes problematic in the calculations.
3.2. Methods and Calculations
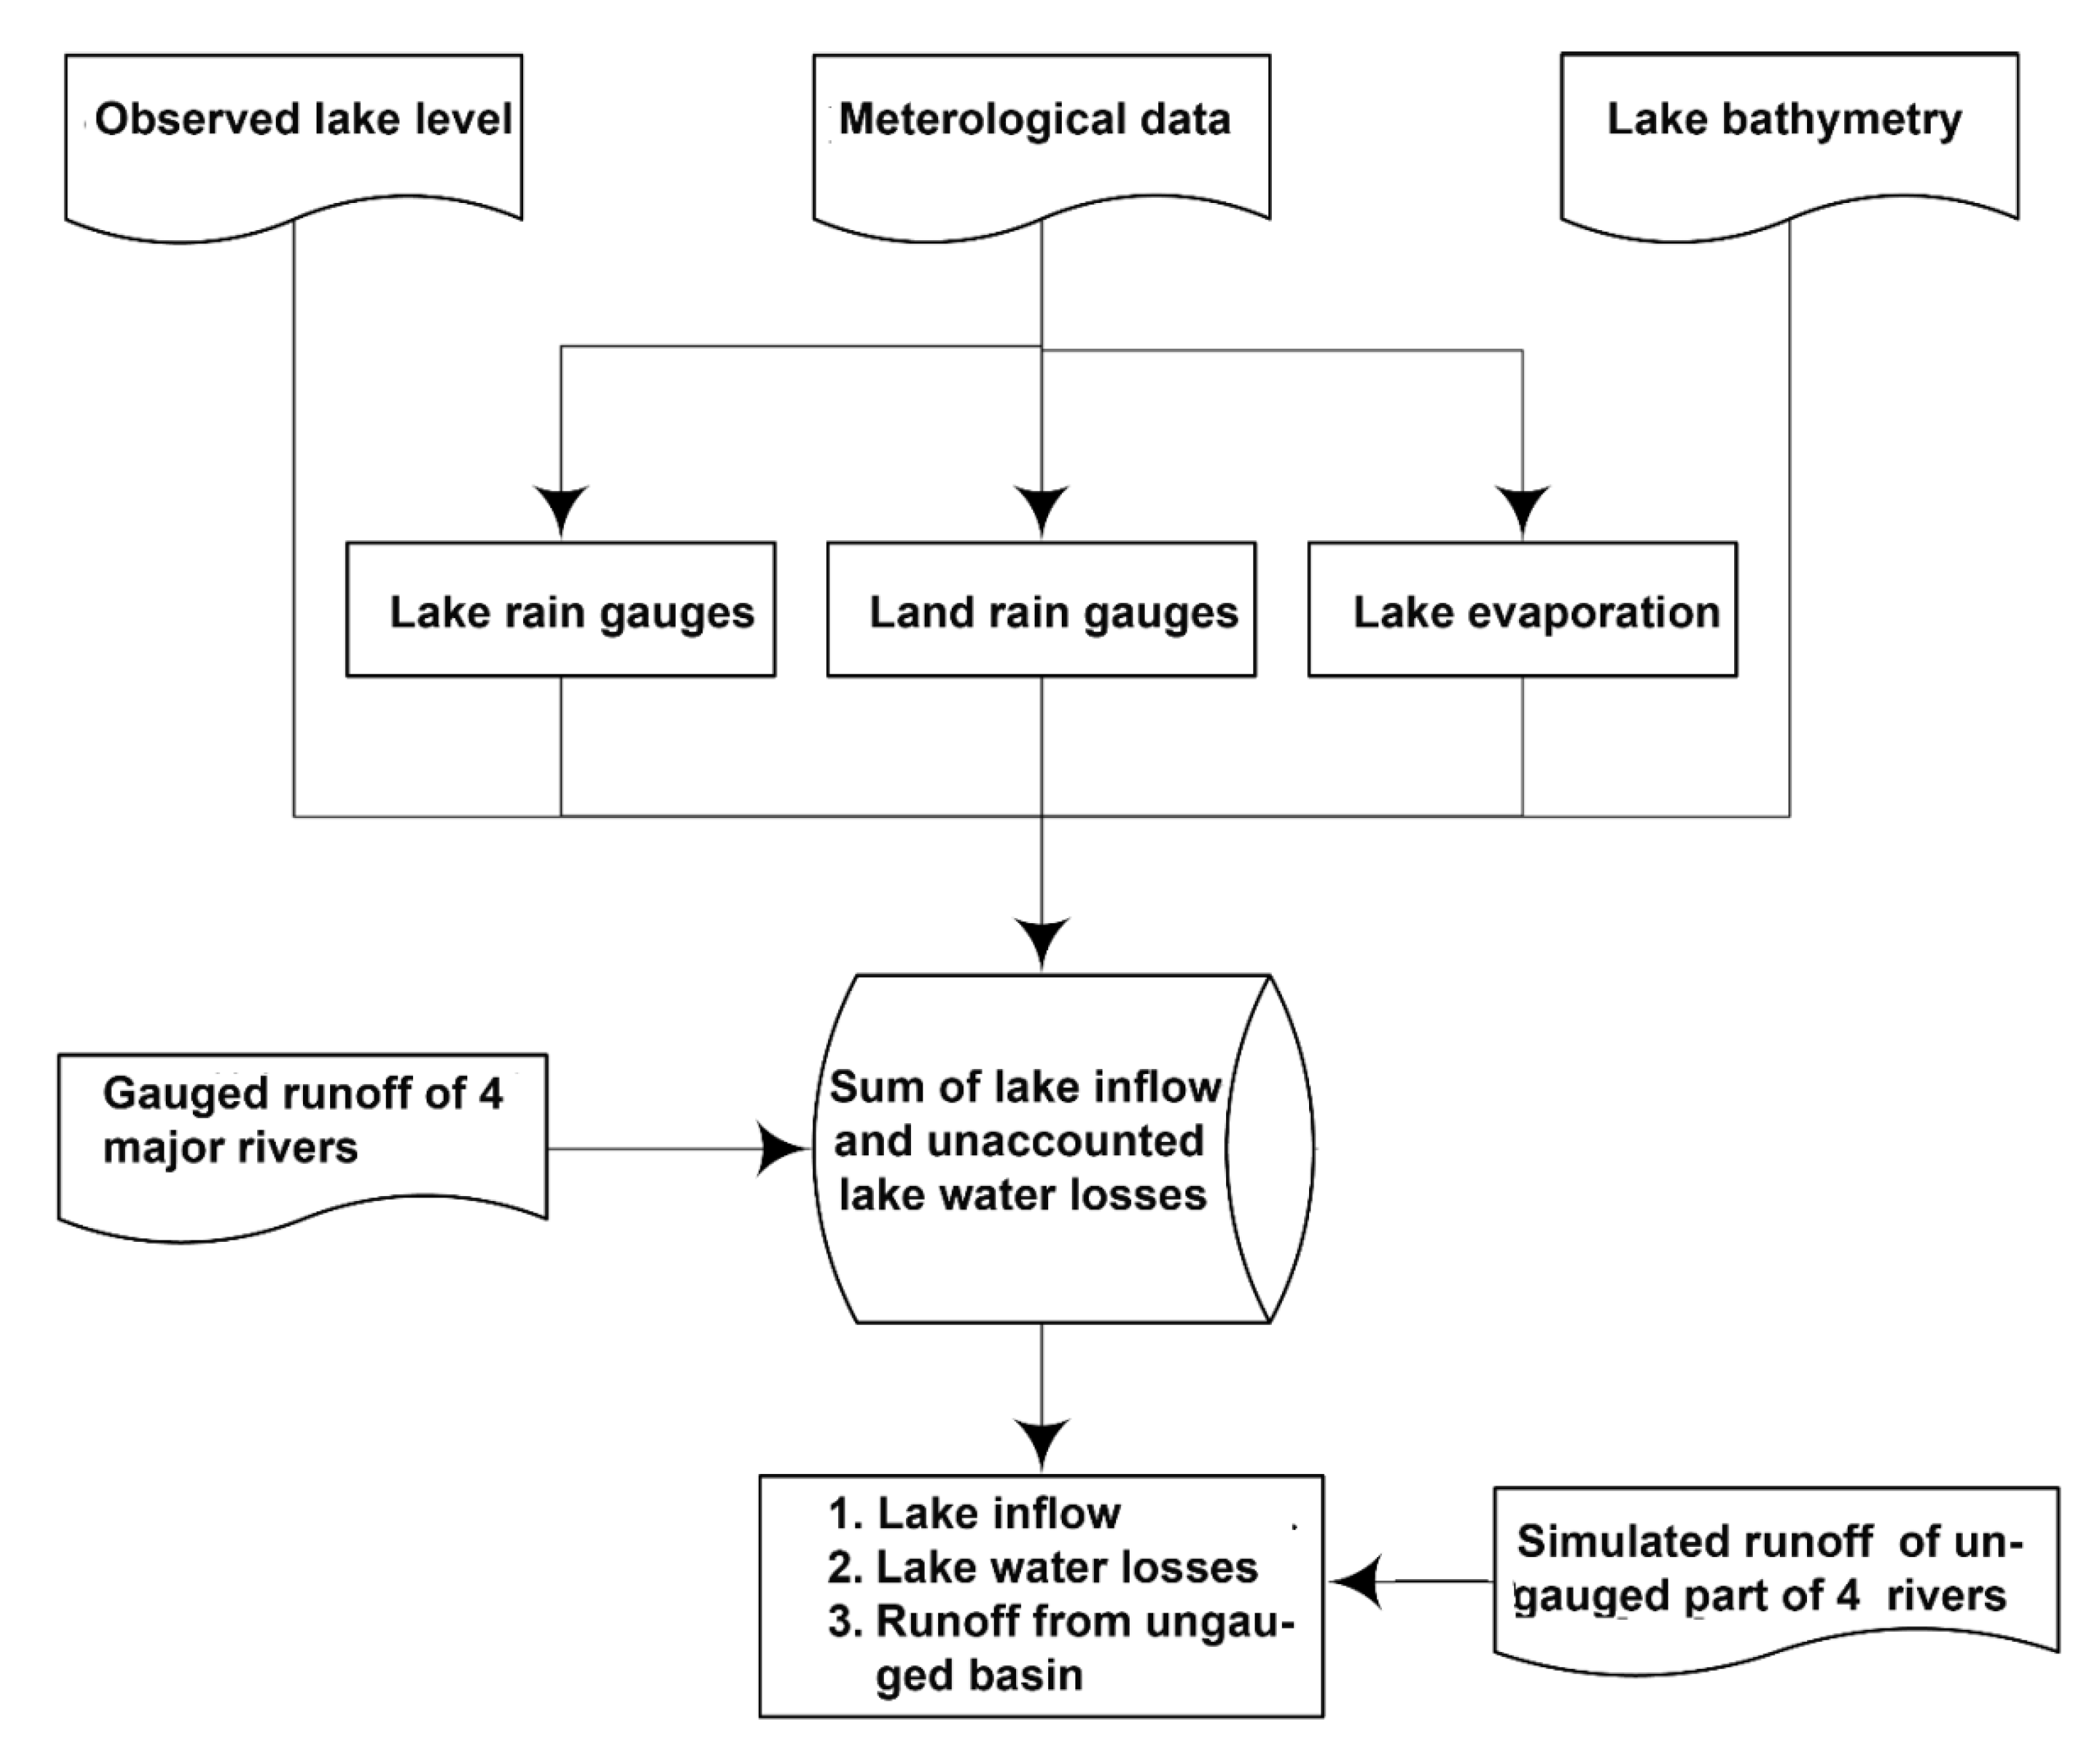
The lake level, rainfall on the lake using land and two stations near the lake, outflow data, and evaporation from the lake were used to calculate the sum of the inflow into the lake and unaccounted water losses from the lake as the rest term in the lake water balance (Figure 2). Then, by regressing the monthly values of the gauged flow of the four major rivers with the sum of the inflow and the unaccounted losses, the inflow and the losses were determined individually (Figure 2). The effect of rainfall spatial distribution on the lake rainfall and water balance was evaluated. Finally, the simulated ungauged flows of the four major rivers were used to provide insight into whether the lower portion of the rivers gained or lost water.
3.2.1. Lake Water Balance
The various components of the Lake Tana water balance are computed for the period 1990 to 2007. This was the only period that all critical variables to calculate the monthly inflow to the lake were without outliers. After 2007, as we will see in the results section, the outflow data provided by MoWIE did not correspond to the inflows and outflows. The inflow components in the Lake Tana included runoff from gauged and ungauged catchments, lake rainfall, and groundwater inflow; the outflow components were lake evaporation, groundwater outflow, and outflow to the Blue Nile. The general water balance equation can be written as:
which can be written as:
where (L3) is the change in storage over ; and (L3T−1) are inflow from gauged and ungauged catchment, respectively; is the groundwater inflow and (L3 T−1) the groundwater outflow; (L3 T−1) surface outflow to the Blue Nile River; (LT−1) open water evaporation; (L2) is the lake area and (LT−1) is the lake precipitation.
3.2.2. Precipitation
Not all of the selected stations had a complete record and missing data were filled by the weighted mean of the nearby stations. To extend in time to the period of 1990 to 2014, the rainfall data of the two newly established lake stations, the CHIRPS-V2 data were extracted from the database. The observed rainfall was linearly regressed with the CHIRPS-V2 precipitation for the lake and the bias determined [51]. The bias-corrected CHIRPS-V2 data were used to extend the newly recorded data.
The Thiessen polygon method was used to determine the relative weight of the various rain gauges to determine the lake precipitation. The weights of the rain gauge station were calculated with and without the newly established stations at Dek Island and Jigrfa. Both rainfall datasets were used to determine the areal rainfall and used as input to the water balance calculations.
The time series of the lake precipitation for the land-based stations was determined as:
and for those that included the two newly established lake stations as:
where (LT−1) is the average precipitation of the lake on day t (T), is the weighting factor for rain gauge station i determined with the Thiessen polygon method (some weights of the stations were zero). The station numbers are listed in Table S1 with the first 13 are land-based and 14 and 15 are the lake-based stations, Dek Island and Jigrfa, and (LT−1) are the bias and the intercept of the CHIRPS-V2 rainfall database for the station i, (LT−1) is the rainfall on day t of the CHIRPS-V2 precipitation record.
3.2.3. Evaporation
Evaporation from the open water body, which is one of the major water balance terms, was calculated by the Penman–Monteith method for the Bahir Dar station by Adem et al. [52] from the monthly temperature sunshine hours, humidity, and wind speed records of Bahir Dar meteorological station. The calculated annual average evaporation rate was 1426 mm a−1. Since this evaporation rate was one of the lowest in Table 1, our analysis of the water balances employed two other evaporation rates as well. Annual evaporation of 1650 mm a−1 was selected [8] that was calculated with the modified Penman–Monteith method [53] using data from the Ethiopian National Meteorological Agency. The evaporation rate of [8] was in the same order as reported by other studies [23,24,28,30] (Table 1). The rate computed by the surface energy balance system (SEBS) algorithm of 1637 mm a−1 using Moderate Resolution Imaging Spectroradiometer (MODIS) land surface products and some ancillary meteorological data was similar as well [54]. In addition, we used an evaporation rate of 1789 mm a−1that was the maximum value reported and was less than pan evaporation [31] (Table 1). The potential evaporation for each month shows a slight variation between years and therefore, evaporation was averaged for each month for all years.
3.2.4. Groundwater Inflow and Outflow
The groundwater inflow to the lake was neglected based on the chemical and isotope studies by Kebede, et al. [32] and Enku, et al. [43] also reported that groundwater inflow is low because the hydraulic gradient in the plains is less than 0.01 and another study by SMEC [8] notes that the 80 m thick clay layer at the bottom of the lake prevents groundwater inflow into the lake.
Despite the 80 m clay layer, Mamo, et al. [33] reports that there was a significant groundwater outflow of 0.95 km3 a−1via deep lineaments network in the western margin and through the southern bank to the Tis Abay area.
3.2.5. Lake Inflow from Rivers and Unaccounted Losses
As described in Section 3.1.2 the available recorded data collected from the MoWIE was only for 40% of the basin, the remaining 60% is ungauged and long-term discharge data were not available. Therefore, we calculated the inflow and the subsurface water outflow as the rest term in the water balance of the lake over almost 18 years from 1990 to May 2007. An initial examination showed that the data collected from 1990 to 2007 did not have any significant outliers.
To calculate the lake inflow from rivers and unaccounted losses of the entire Lake Tans basin, the water balance Equations (5) and (6) were revised to estimate the runoff from ungauged catchment assuming the groundwater flux into the lake was negligible [33] as:
which can be rewritten in terms that are unknown (left-hand side) and that are measured (right-hand side) by:
where L(t) is a loss term (L3T−1) that is referred to as unaccounted losses and includes among others the (L3T−1). The inflow to the lake, , and the unaccounted losses, , can be written as the sum of the gauged streamflow (L3T−1) and the ungauged streamflow :
where (L3T−1) is the discharge of the Gilgel Abay; (L3T−1) is the discharge of the Megech; (L3T−1) is the discharge of the Rib and (L3T−1) is the discharge of the Gumara.
Using a regionalized approach [27] and assuming that the runoff pattern of the ungauged part has similar runoff characteristics but not necessarily the same magnitude, the can be written as:
where is the gauged area of the Gilgel Abay (1656 km2); is the gauged area of the Megech (514 km2); is the gauged area of the Rib (1303 km2) and is the gauged area of the Gumara (1283 km2) (Table 2), is the catchment regionalization factor defined as the ratio of discharge per unit area of the gauged and ungauged. We introduce as the ratio of the ungauged area (excluding the lake’s area) to gauged area i.e.,
According to Table 2, = 1.53. Substituting Equations (12) in Equation (10), we find that:
To determine the regionalization factor α and the loss term, L, we regress the monthly inflow to the lake, , with the monthly gauged flow, . In the case of linear regression:
where is the slope and b is a constant. Combining Equations (14)–(16) and noting that = 1.53, we find that:
Since there is a wide discrepancy in evaporation values in Table 1, we will perform six regressions with the lake evaporation rates of 1426, 1650, and 1789 mm a−1 and with the land-based and lake +land-based rainfall rates.
3.3. Performance Evaluation
The performance of the simulated lake level with the land-based and lake + land-based rainfall dataset was compared with the observed lake level and the performance was evaluated with multiple model performance statistics. The performance indicators were Nash–Sutcliffe efficiency (NSE) [55], coefficient of determination (R2), and root mean square error (RMSE) [56].
4. Results
The spatial average rainfall is presented first, followed by the evaporation and outflow of the lake and, finally, the inflow from the catchment is calculated based on Equation (9a,b) and regressed with the gauged streamflow records (Equation (11)). In the end, we compared the unaccounted losses in the mass balance with other findings in the literature.
4.1. Rainfall on the Lake Surface
The Thiessen polygons are shown in Figure 3. For the land-based rainfall station; the station at the north of Lake Tana (Gorgora) has the greatest weight of 35% followed by Zege (30% south of the lake) and Delgi (25% west of the lake). The rainfall station located east of the lake Addis Zemen (6%) and Maksegnit (5%) had only a small weight (Figure 3a, Table S2). After including the newly established lake stations, the lake-based stations represented 48% with a weight of 30% for Dek Island on the lake and 18% Jigrfa on the eastern shore (Figure 3b, Table S2). Gorgora had the second-highest weight of 20% which was almost half that without the lake-based stations and thus decreasing the effect of the dryer climate north of the lake in calculating the average lake precipitation.
The rainfall data from the newly established lake + land-based stations were extended with a bias-corrected CHIRPS-v2 dataset. The CHIRPS monthly rainfall data was nearly similar to the observed data with correlation coefficients between 0.73 and 0.91 (Figure S1e,f). Consequently, in Equation (8), the bias correction was set as and intercept . For the interest of the reader in the supplementary material, the correlation between some of the observed rainfall of the land-based stations and the CHIRPS-v2 rainfall are shown (Figure S1a–d).
As speculated by Gieske et al. [23], the average monthly rainfall for Jigrfa on the shore and Dek Island in the lake is greater than any of the land-based stations except Zege and Bahir Dar which are located on the southern shores of Lake Tana (Figure 3 and Figure 4). The cumulative rainfall on the lake throughout 1990–2014 calculated based on data from land-based stations was 31.16 m whereas for the lake + land-based stations it was 32.79 m (Figure S2). This results in average precipitation of 1234 mm a−1and 1314 mm a−1, respectively. Thus, including the lake-based stations, the lake rainfall increased by 6%. Monthly precipitation for both the land-based and lake + land-based stations is given in Figure 5. The two other studies that included a station on the island were by Wale, et al. [24] and Rientjes, et al. [27]. Wale, et al. [24] reported an average lake rainfall of 1220 mm a−1 for the period of 1992–2003 with the kriging method and 1290 mm a−1 with the inverse distance method with a power of two giving greater weight to the lake-based station. Rientjes, et al. [27] reported an average rainfall of 1347 mm a−1. Thus, our rainfall amounts (1314 mm a−1) from the lake + land-based stations are similar to these studies. Studies with significantly greater annual precipitation than our mean measurement of precipitation of 1314 mm a−1 took the Bahir Dar weather station as a representative for the lake [7,22] (Table 1). As can be seen from Figure 3, Bahir Dar has the greatest rainfall from all land-based stations. The highest lake rainfall of 1688 mm a−1 (Table 1 [31]) was determined with the Tropical Rainfall Measuring Mission (TRMM) 3B43 dataset [30]. The TRMM 3B43 dataset has been shown to perform poorly in the Lake Tana basin [57].
4.2. Lake Evaporation
Annual evaporation predicted by the Penman–Monteith method with the data of the Bahir Dar weather station was 1428 mm a−1 [25]. The maximum monthly average evaporation was in February and March with 5 mm d−1 and the minimum during the rain phase in July and August with 3 mm d−1. Predictions of 1478 mm a−1 [7] and 1428 mm a−1 [25] using the Penman equation are in agreement (Table 1). Wale, et al. [24] using Penman found an evaporation rate of 1690 mm a−1. The smallest evaporation rate of 1248 mm a−1was found by using SWAT [25]. Rientjes, et al. [27] who used the Penman method in combination with using satellite data to adjust for the greater albedo of the lake during the rain phase, reached an evaporation rate of 1563 mm a−1 (Table 1). The annual evaporation rate estimated by Hargreaves’s method was over 2000 mm a−1 [29] which is greater than the pan evaporation at the Bahir Dar stations of 1945 mm a−1 [31] and, therefore, not realistic. For the same reason, the potential evaporation by Dessie, et al. [31] of 1789 mm a−1seems to be on the high side as well, although they defend their calculation by including a station in the western side of the lake where the temperatures are highest around the lake. Still, as we discussed above, we will use extreme value [31] in our consideration of the fate of the flow in the lake. Finally, it is noteworthy that all references except for [26] in Table 1 agree that the evaporation of the lake is greater than the precipitation.
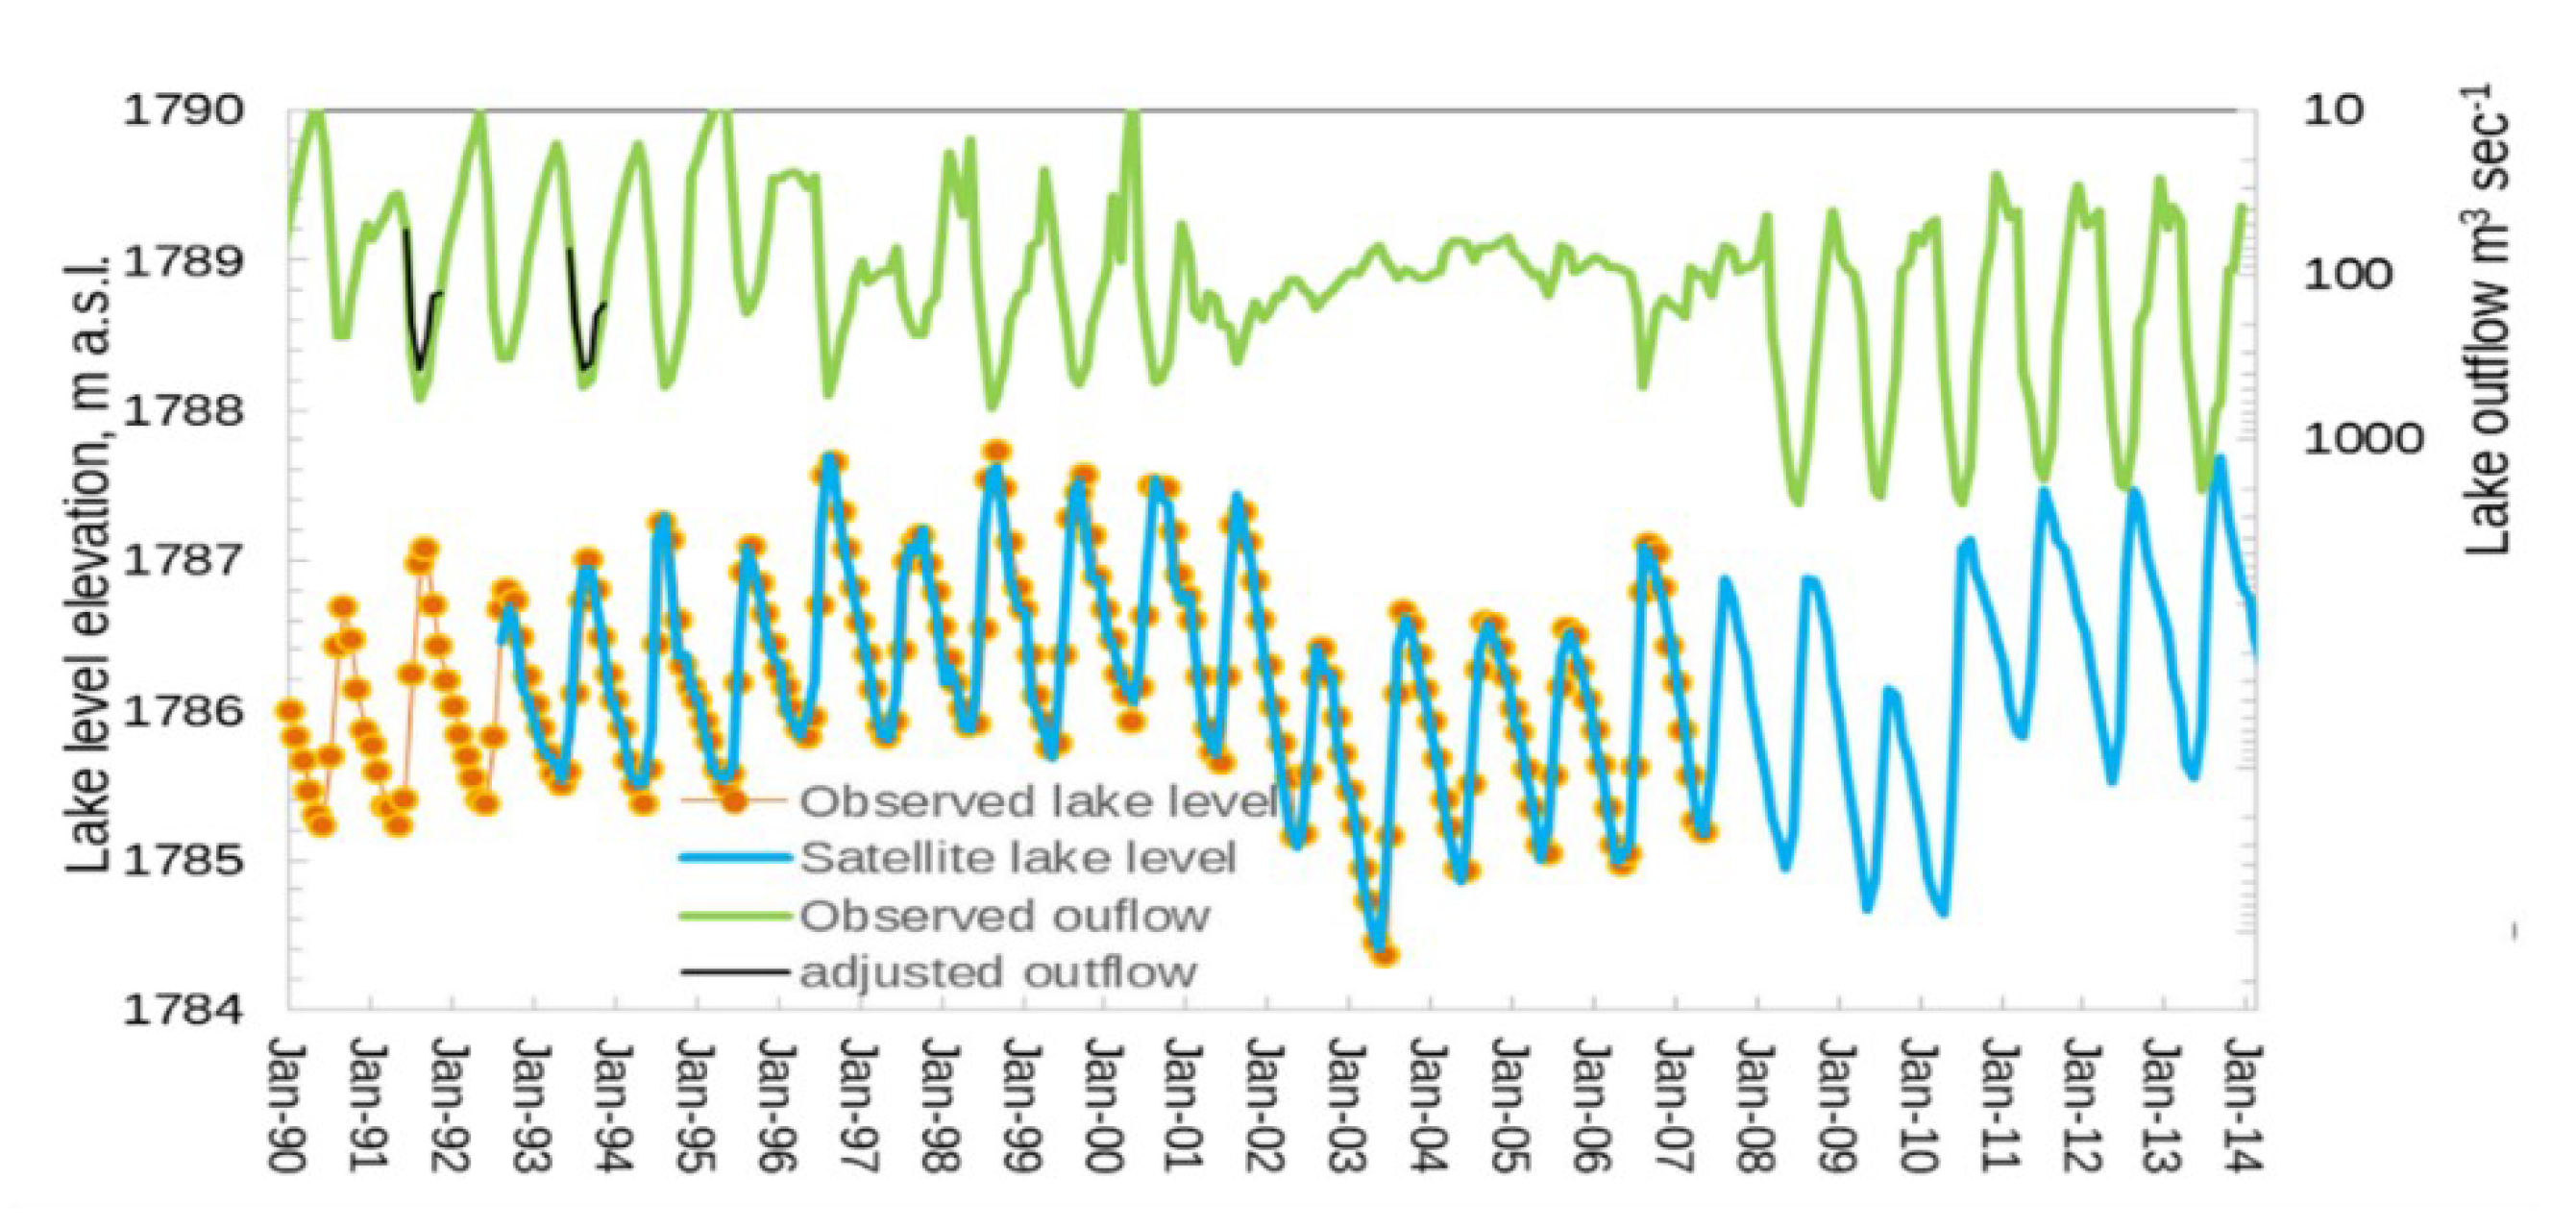
4.3. Lake Level
Accuracy of the lake levels is of paramount importance for the inflow calculations (Equations (5), (6) and (9ab)). We compared the observed lake levels with those downloaded from Hydroweb [49]. As shown in Figure 6, the lake levels agreed well after subtraction of 1.46 m from the Hydroweb data for 1992–2001 and 1.65 m between 2001 and 2007 from the observed lake levels. After 2007, the manually observed lake levels were greater than the satellite observed data set from Hydroweb [49] during the rainy phase. Therefore, they are considered inadequate for water balance and it is not shown in Figure 6. The MoWIE observed lake levels above 1789 m a.s.l (after 2007) would have to indicate that substantial portions of the lake surroundings were flooded.
4.4. Lake Outflow
Before the installation of the Chara Chara weir at the outlet to the Blue Nile in 1996, the outflow increased during the rainy season from June to September (Figure 6). The maximum outflow was usually observed in September (Figure 6). When in May 1996 the Chara Chara weir with two gates started to regulate the flow to Tis Abay-I power station [13], the outflow was not greatly affected (Figure 6). Only after five additional gates were added to the Chara Chara Weir and the Tis Abay-II power station become operational on 1 January 2001, the outflow pattern changed significantly and became more even without the peaks in September and the low flows in May and June. Outflows after 2007 again changed significantly with peak outflows over 1000 m3 s−1 that had not been observed in any of the prior years (Figure 6). Thus, the lake outflows after 2007 were not realistic and were not considered in the water balance study because initial calculations showed that the outflow of the ungauged basin would have been 3 to 4 times greater per unit area than the gauged basin which is unrealistic.
In addition, Gieske, et al. [23] reported that the outflow records were good from 2000 to 2006. In the period from 1990 to 2000, the adjusted outflows for 1993 and 1994 were identical with what was observed (see Figure 6 and noted by [23]). Moreover, the peak flow and the lake level were not always related as would have been expected before the installation of the Chara Chara weir in 1996. Therefore, we adjusted the peak flows in 1992 and 1994 so that lake levels and peak flows agreed (black lines in Figure 6).
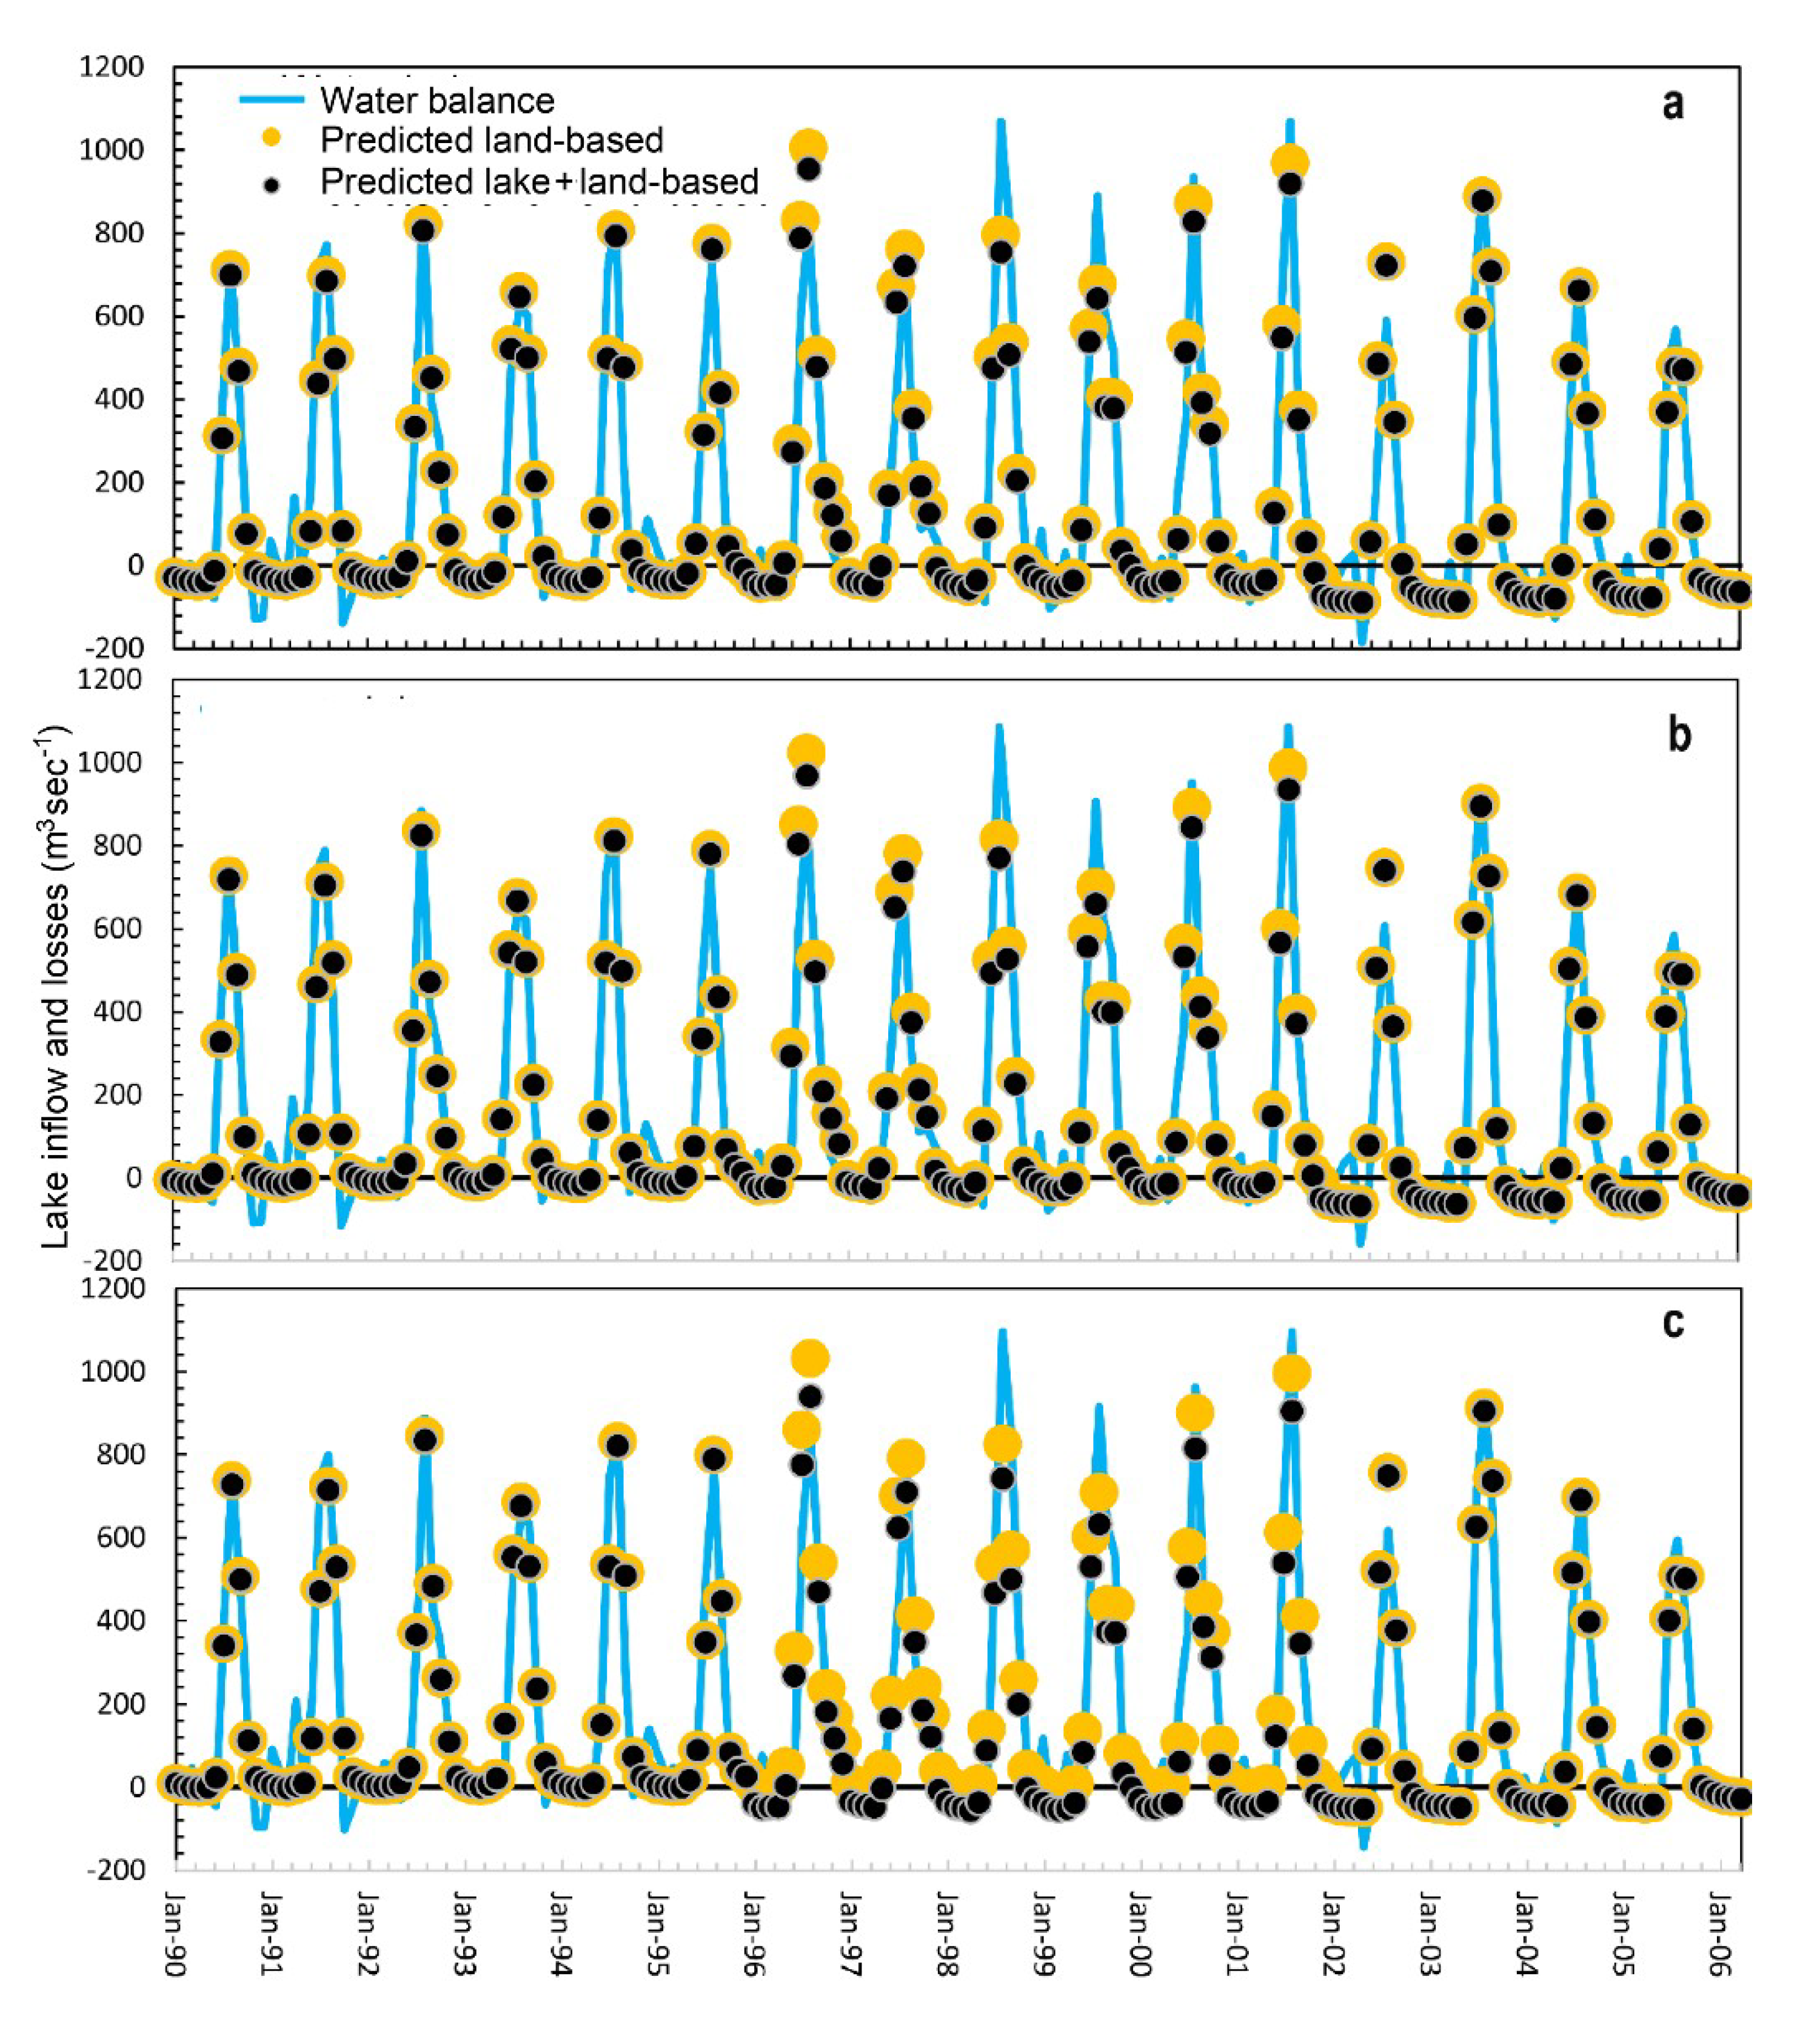
4.5. Inflow to the Lake and Unaccounted Water Losses
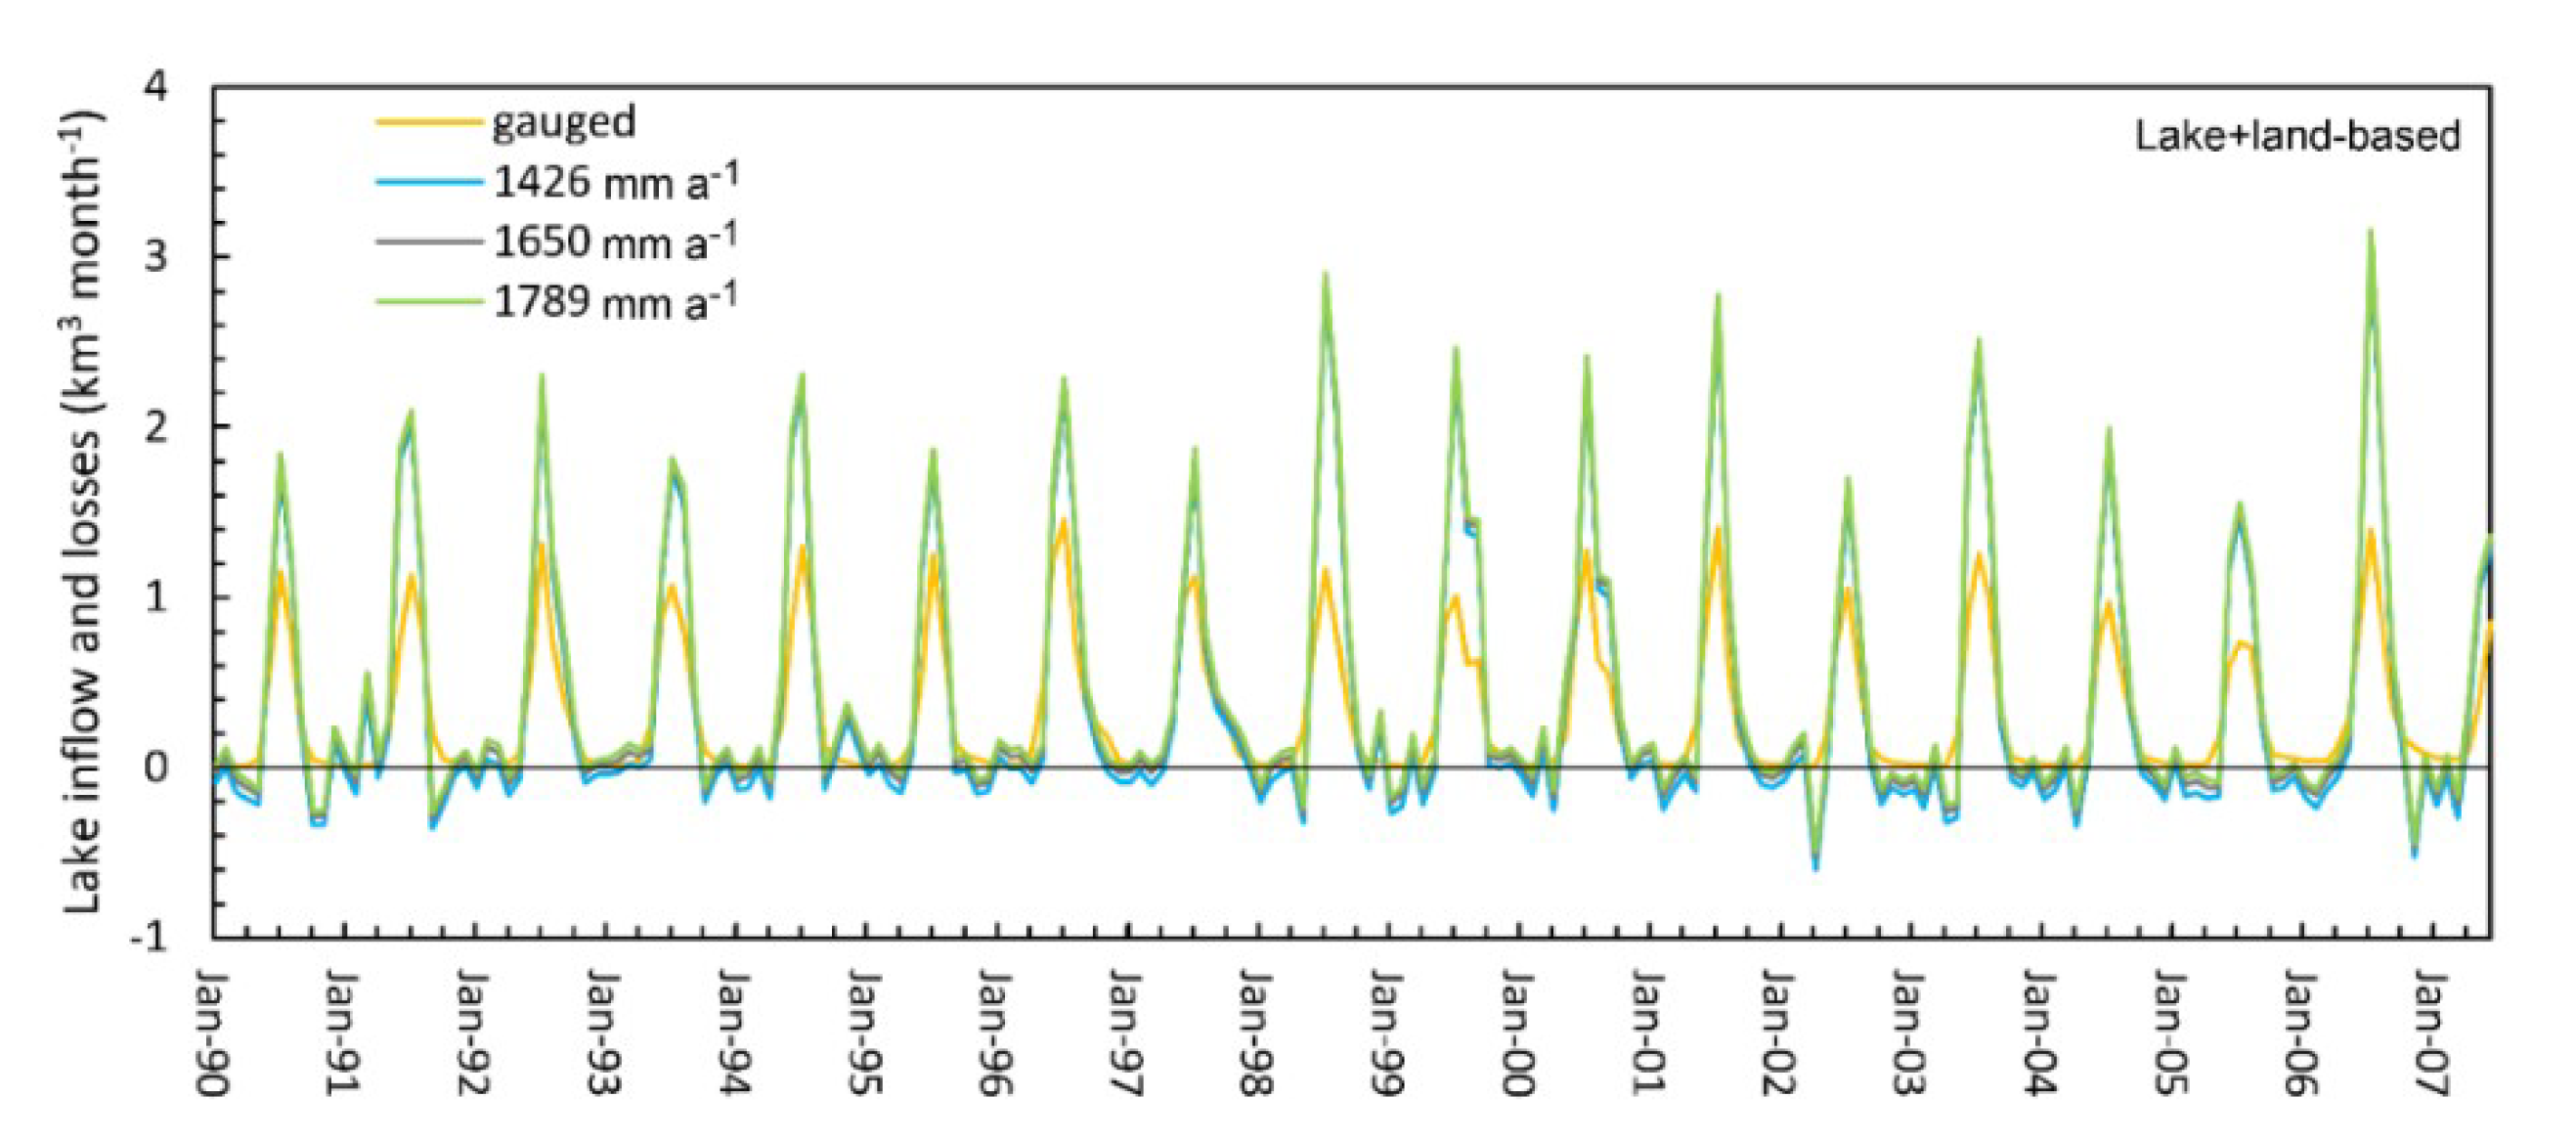
The monthly rate of flows into the lake and unaccounted water losses , corresponding to the three evaporation rates that were calculated with Equation (9b) are shown for the lake + land-based rainfall in Figure 7 (with units in km3 month−1), in Figure S3a for land-based stations in km3 month−1, and Figure S3b,c for both type of rainfalls with units of m3 s−1. The difference in inflow and unaccounted losses for the three evaporation rates are most obvious for the low flows. At the high flows, the same differences exist but are hidden behind each other except where the lines are horizontal, such as in October 1999 and November 2000 in Figure 7 and Figure S3. As expected, the loss is greater for the low evaporation rate than for the higher evaporation rate (i.e., the blue line representing an evaporation rate of 1426 mm a−1 is below the green line for the 1789 mm a−1).
The negative values of the lake flow and losses in Figure 7 and Figure S3 imply that sum of lake inflow and losses is less than the sum of evaporation and outflow minus the precipitation (Equation (9b)). Since the river discharge into the lake cannot be less than zero and even for the highest evaporation rate there are still negative values in the monthly water balance, this indicates, in addition to surface outflow and evaporation, that there was water loss from the lake through subsurface outflow.
Besides the inflow to the lake as shown in Figure 7 and Figure S3, the total flow from the four gauged watersheds is between half to two-thirds of the total inflow into the lake (Figure 7 and Figure S3) while the area of the gauged watershed is only two-fifths of the total watershed of Lake Tana (Table 2).
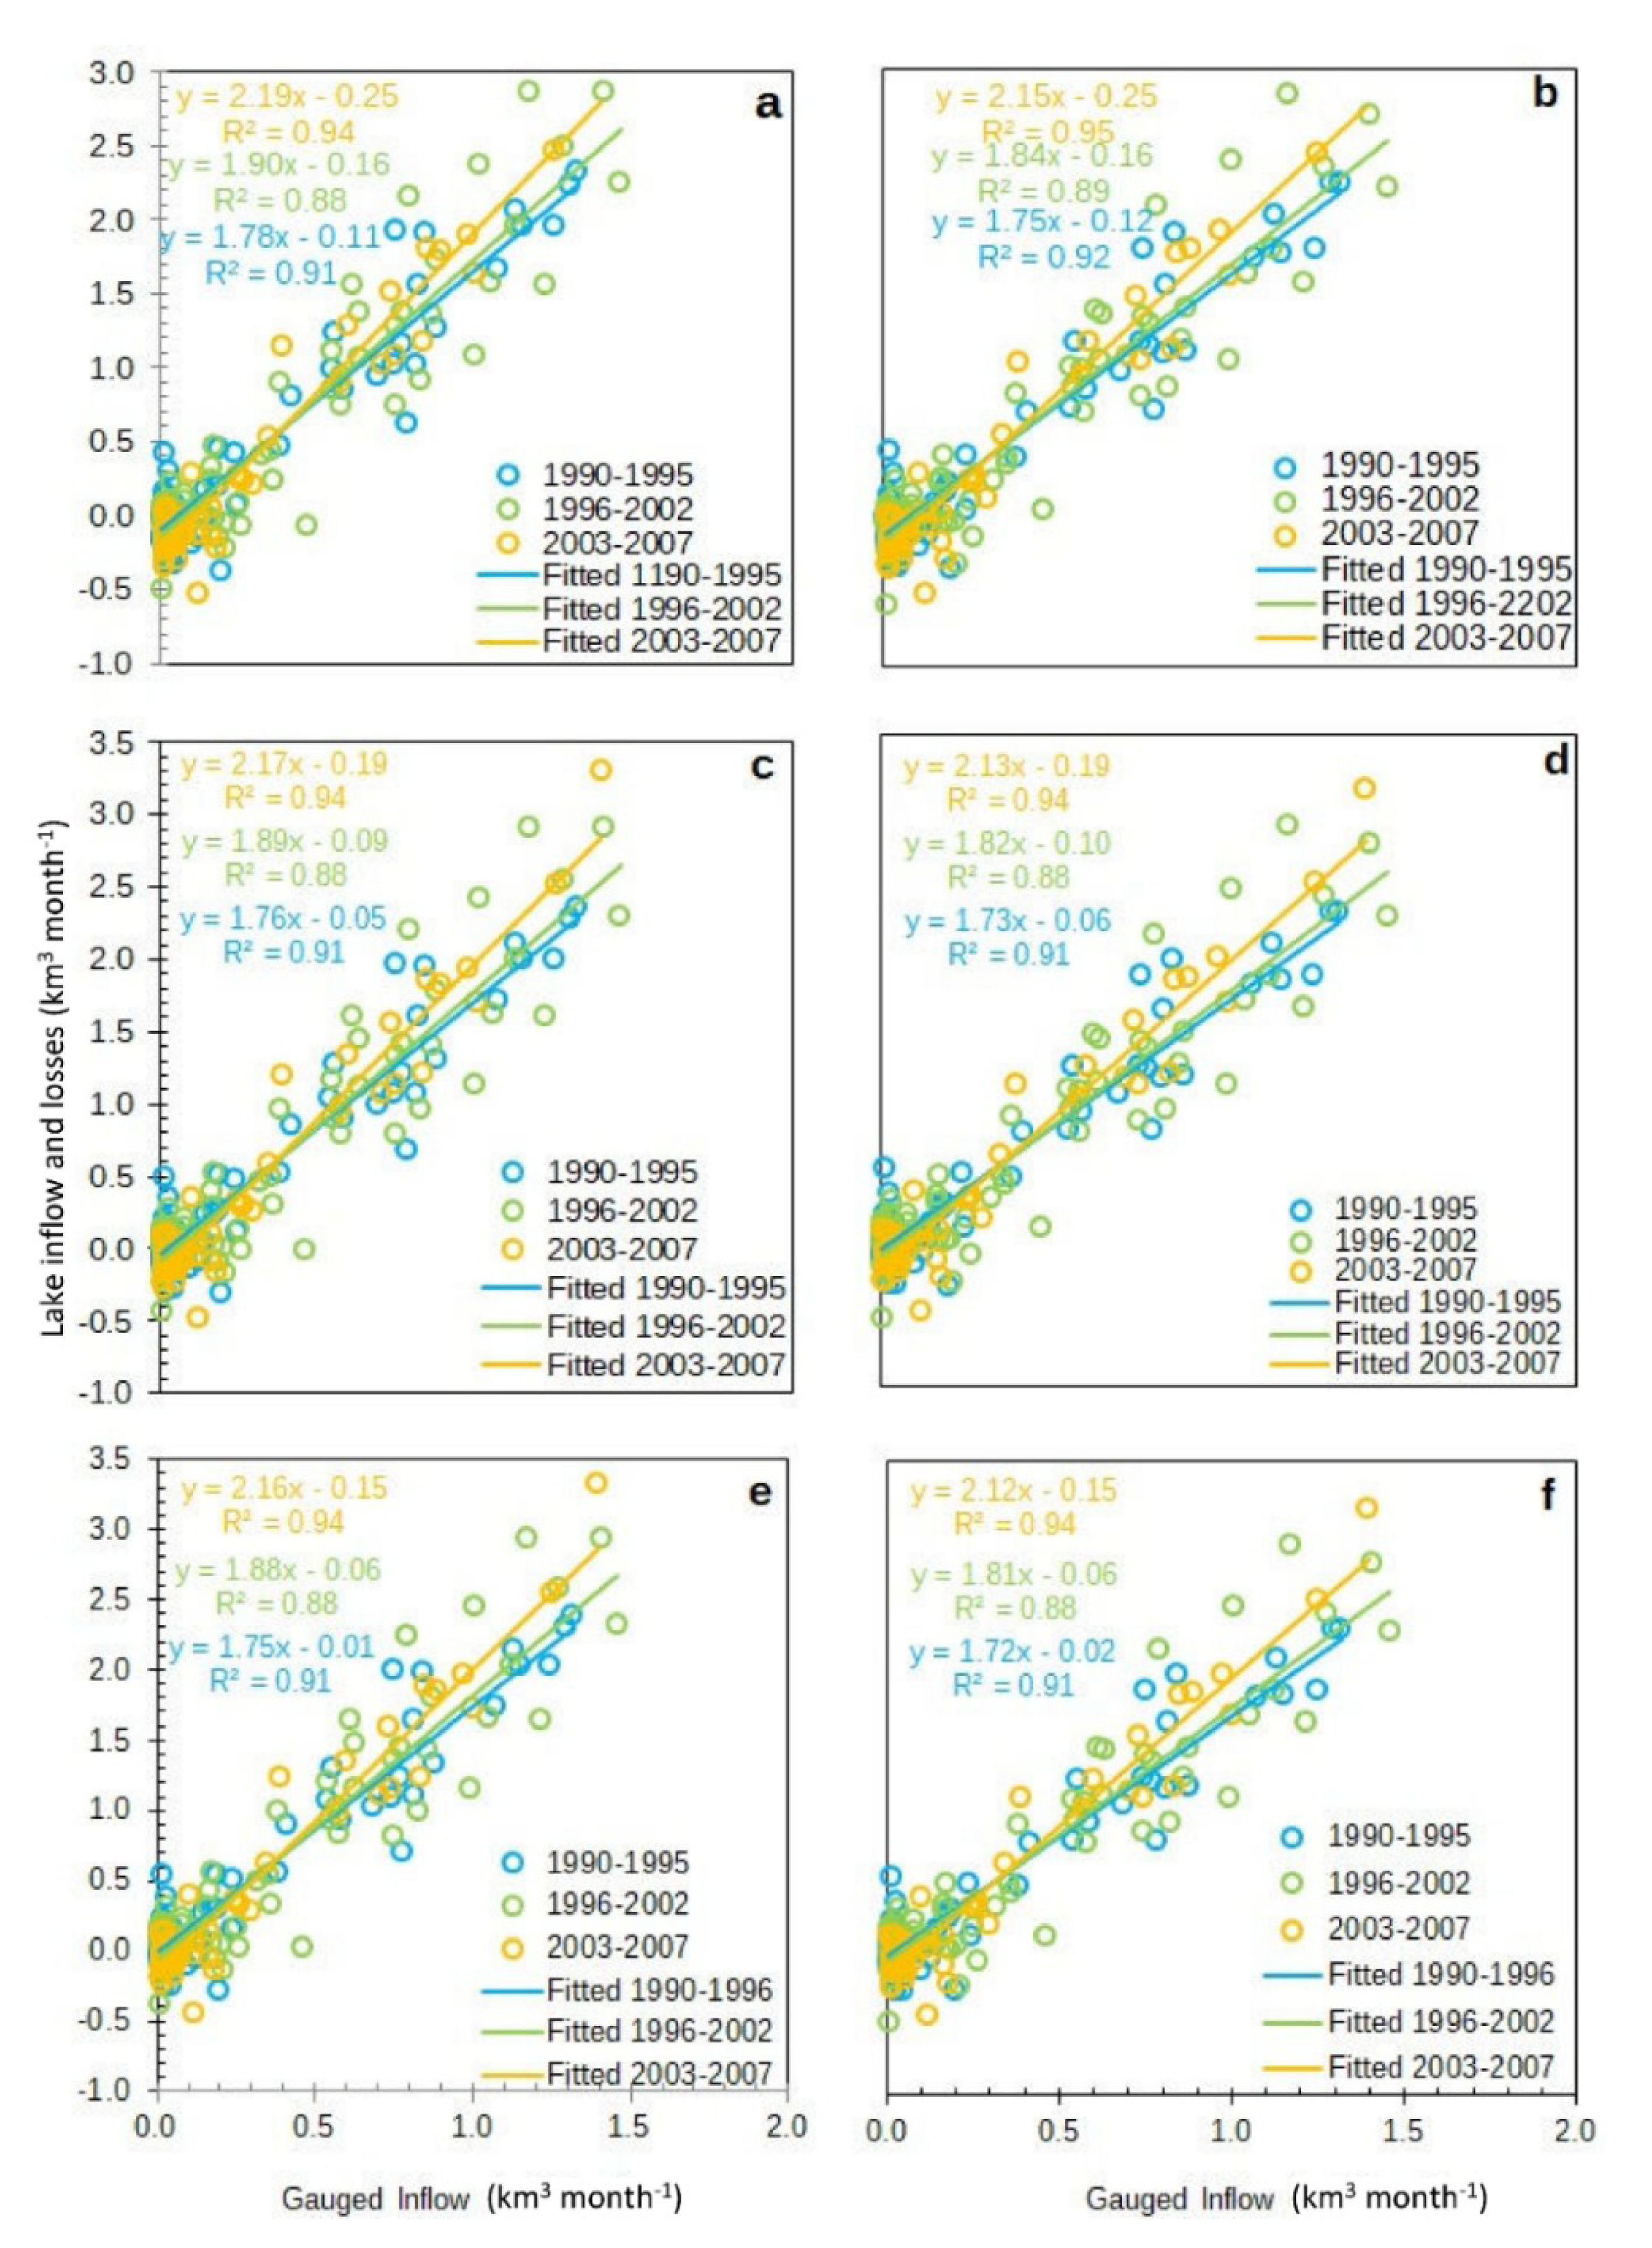
4.6. Regionalization and Unaccounted Loss of Water
In this section, the flow contributed by the ungauged part of the basin and the unaccounted loss of water are determined by regressing the gauged flow from the four major rivers with the sum of inflow and loss (Figure 8) using Equations (16)–(18) for the three evaporation rates of 1426, 1650 and 1789 mm a−1and the land-based and lake + land-based precipitation.
In regressing the data, we found three distinct dates after which the relationship between gauged discharge and lake inflow changed. These were 1 January 1996, 1 January 2003, and 1 June 2007. Therefore, we made separate regression for the periods from 1990–1995; 1996–2002, and 2003–June 2007 (Figure 8 and Figure S3). After May 2007, the outflows of the lake were unrealistically high (Figure 6) and are not further used. The slope (varying between 1.72 and 2.19) and the intercept (varying between −0.01 and −0.25 km3 month−1) with regression coefficients greater than 88% are detailed in Figure 8 and Table S3. In all cases, the high regression coefficients showed that a linear fit is a good approximation. Polynomial regression hardly increased the regression coefficient showing again that a linear fit performs well. Thus, there is a similarity in response to rainfall in the ungauged watershed to the gauged watershed. This does not mean that the runoff per unit area is the same in the two watersheds but only that the response is similar so that when the flow is high in the gauged watershed, so it is in the ungauged watershed.
4.6.1. Regionalization Factor
The regionalization factor α defined as the ratio of flow per unit area of the ungauged to the ungauged basin (Table 4) was calculated with Equation (17) based on the data in Table S3 and Figure 8 that were obtained, as discussed above, from the linear regression of the gauged inflow with the total inflow. Table 4 shows that the runoff and interflow in the ungauged part per unit area are between 50% and 71% of the gauged part. The regionalization factor in Table 4 was for each of the three periods nearly independent of the amount of evaporation and precipitation of the lake, but increased over time and especially from 2003 to May 2007.
Figure 9 compares the inflow to the lake together with the unaccounted water losses calculated with the lake water balance and that obtained from the regression for the three evaporation rates and the two rainfall rates. Interestingly, it shows that the lake inflows minus the losses of water in the lake increase with an increase of evaporation but is minor compared to annual variations.
4.6.2. Gauged and Ungauged Runoff
One of the reasons that the ungauged (lower portion of the basin) contributed less water to the lake per unit area than the upper gauged watersheds is that it rains more on the higher elevations. Another cause could be the abstraction of the water by irrigation [31]. Measurement errors in gauged flow can be a reason, too [32].
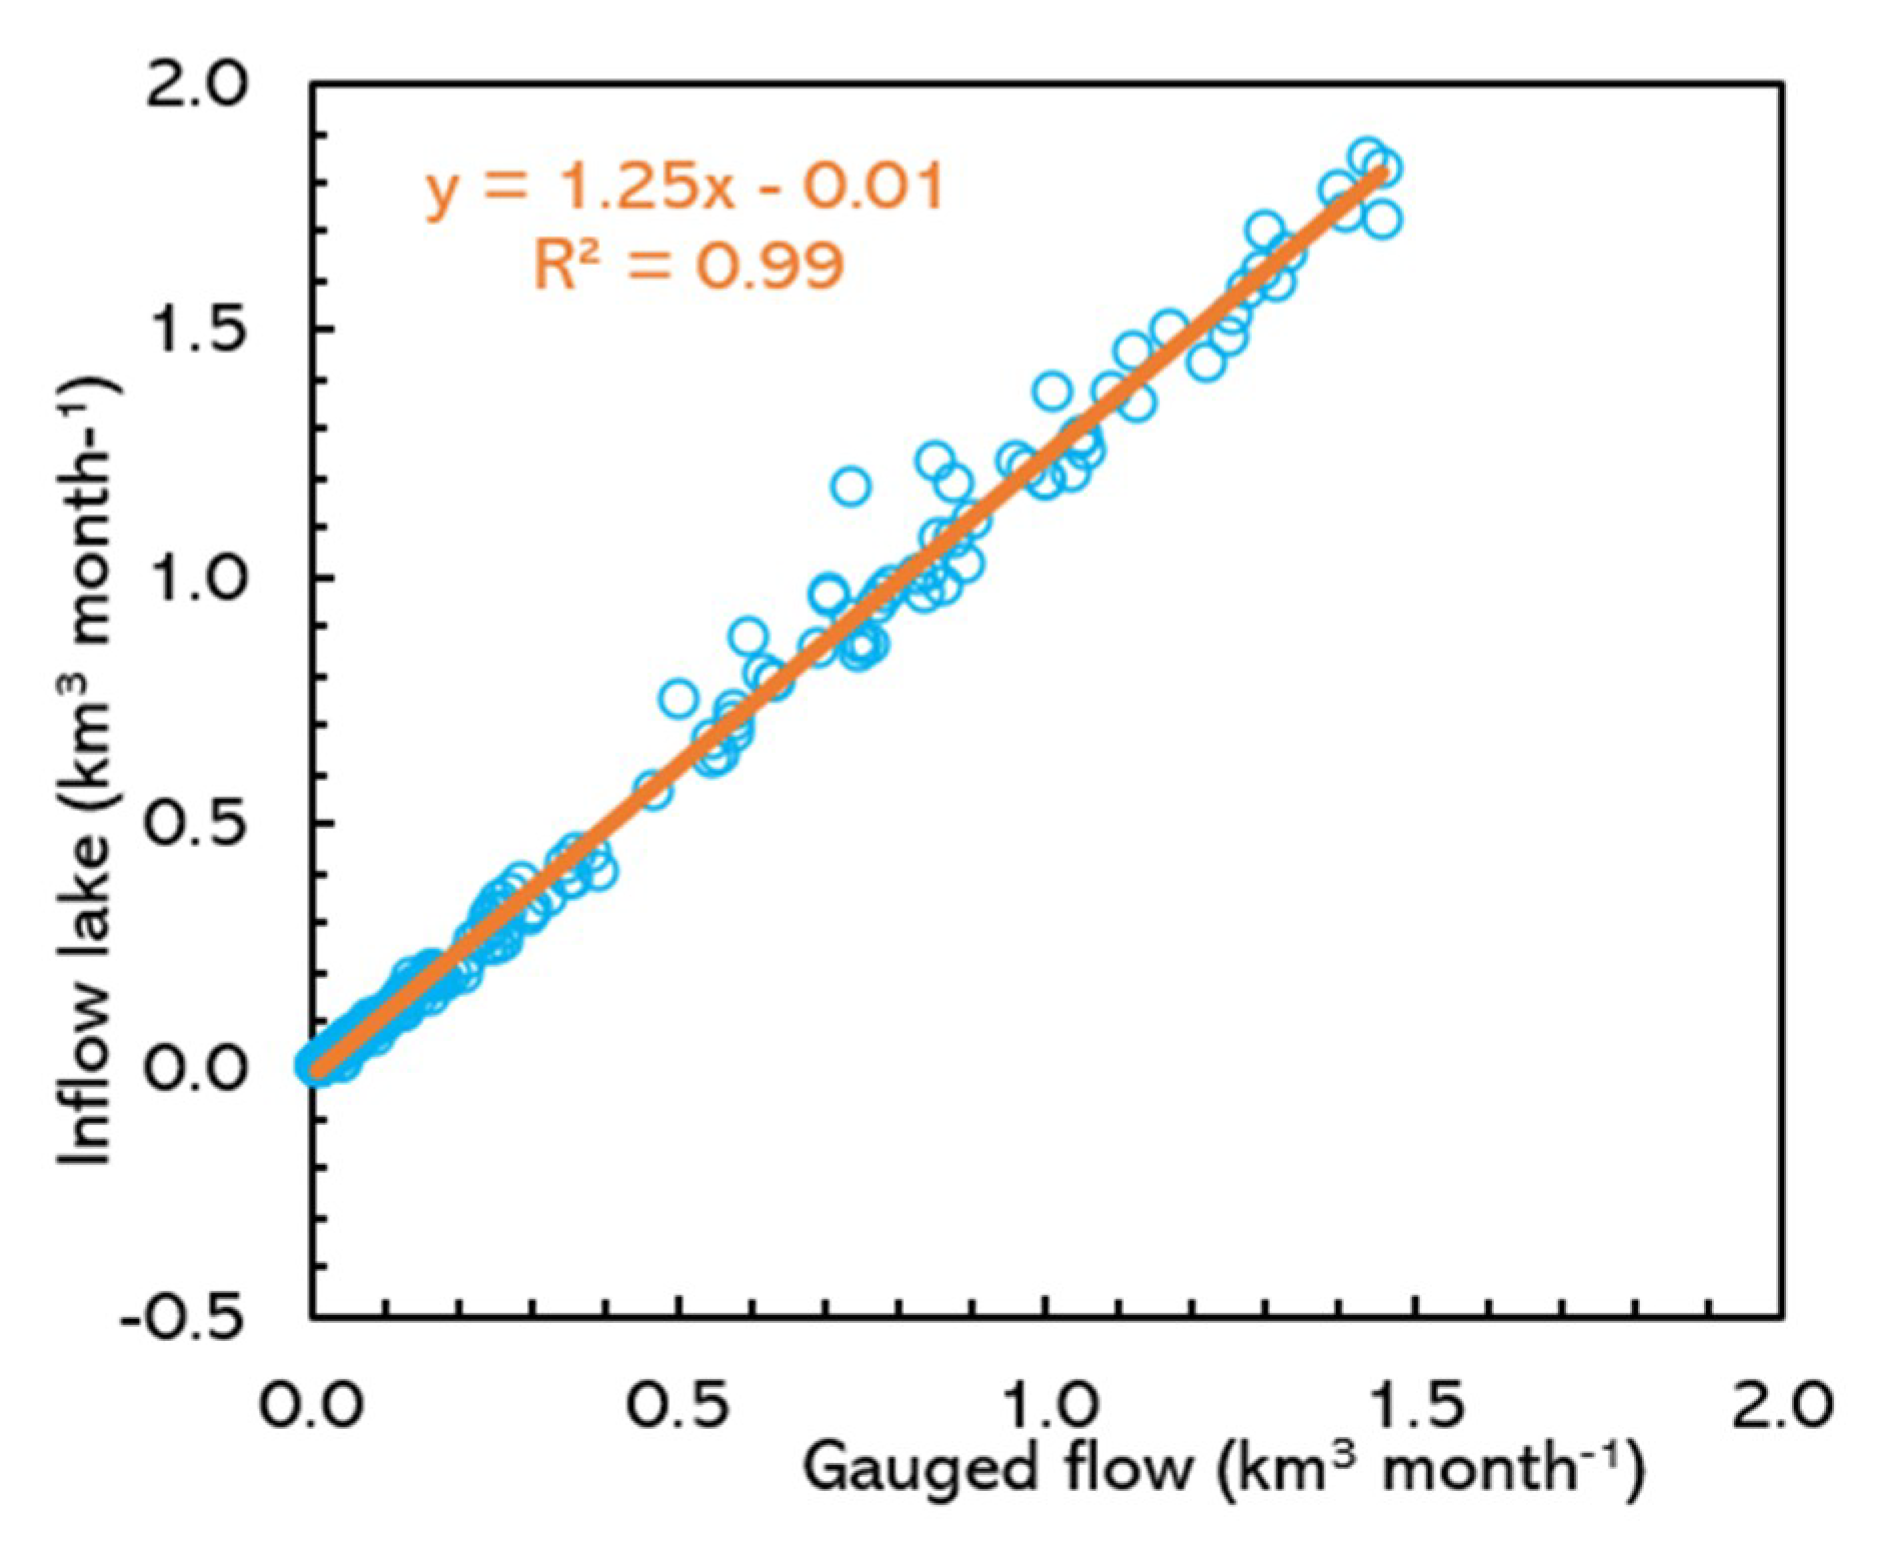
To investigate whether rainfall could be responsible for the decrease in contribution per unit area of the ungauged part of the basin we used the simulated discharges into Lake Tana obtained with the PED model [44]. See Section 3.1.2 for detail. The same procedure was followed in this evaluation as in Section 3.2.5 (Equations (10) through (15)). The total inflow into the lake from the four watersheds (sum of the observed gauged flow and the simulated ungauged flows for the four major rivers Gilgel Abay, Gumara, Rib, and Megech) was regressed with the gauged flow of these four major rivers for the period from 1994–2012 [44]. There was a good linear fit between the total flow and gauged flow for the four river basins (R2 = 0.99, Figure 10). The slope was 1.25 and unlike the regressions in Figure 8, the intercept was close to zero in Figure 10. Using the Equations (12) through (14) with a ratio of ungauged to gauged areas for the four major rivers of β = 0.79 (Table 2) and the slope of the linear regression a = 1.25 (Figure 10), the regionalization constant α was 0.32 (ratio of ungauged to gauged flow to the lake per unit area). This is less than the values in Table 4. Thus, besides precipitation, many springs in the lower ungauged part of the watershed contribute water to the stream. The water in the springs originates from the uplands and flows via faults to lower elevations.
4.6.3. Water Loss in the Lake
The regression of gauged to ungauged flows of the whole basin results (besides the regionalization factor) in the amount of water lost from the lake (Equation (18)) that cannot be accounted for by evaporation and lake outflow (Table 4). The water loss in lake Tana decreases as expected with the evaporation of the lake as a consequence of how the inflow into the Lake is calculated. Table 4 shows that the water loss in the lake for the evaporation rate of 1650 mm a−1 is between 0.7 km3 a−1 in the early 1990s and 2.3 km3 a−1 in the period from 2003 to June 2007 when the lake levels remain at a higher level than in the 1990s. The change in water loss between the periods is unrealistic and will be considered further in the discussion.
4.7. Lake Level
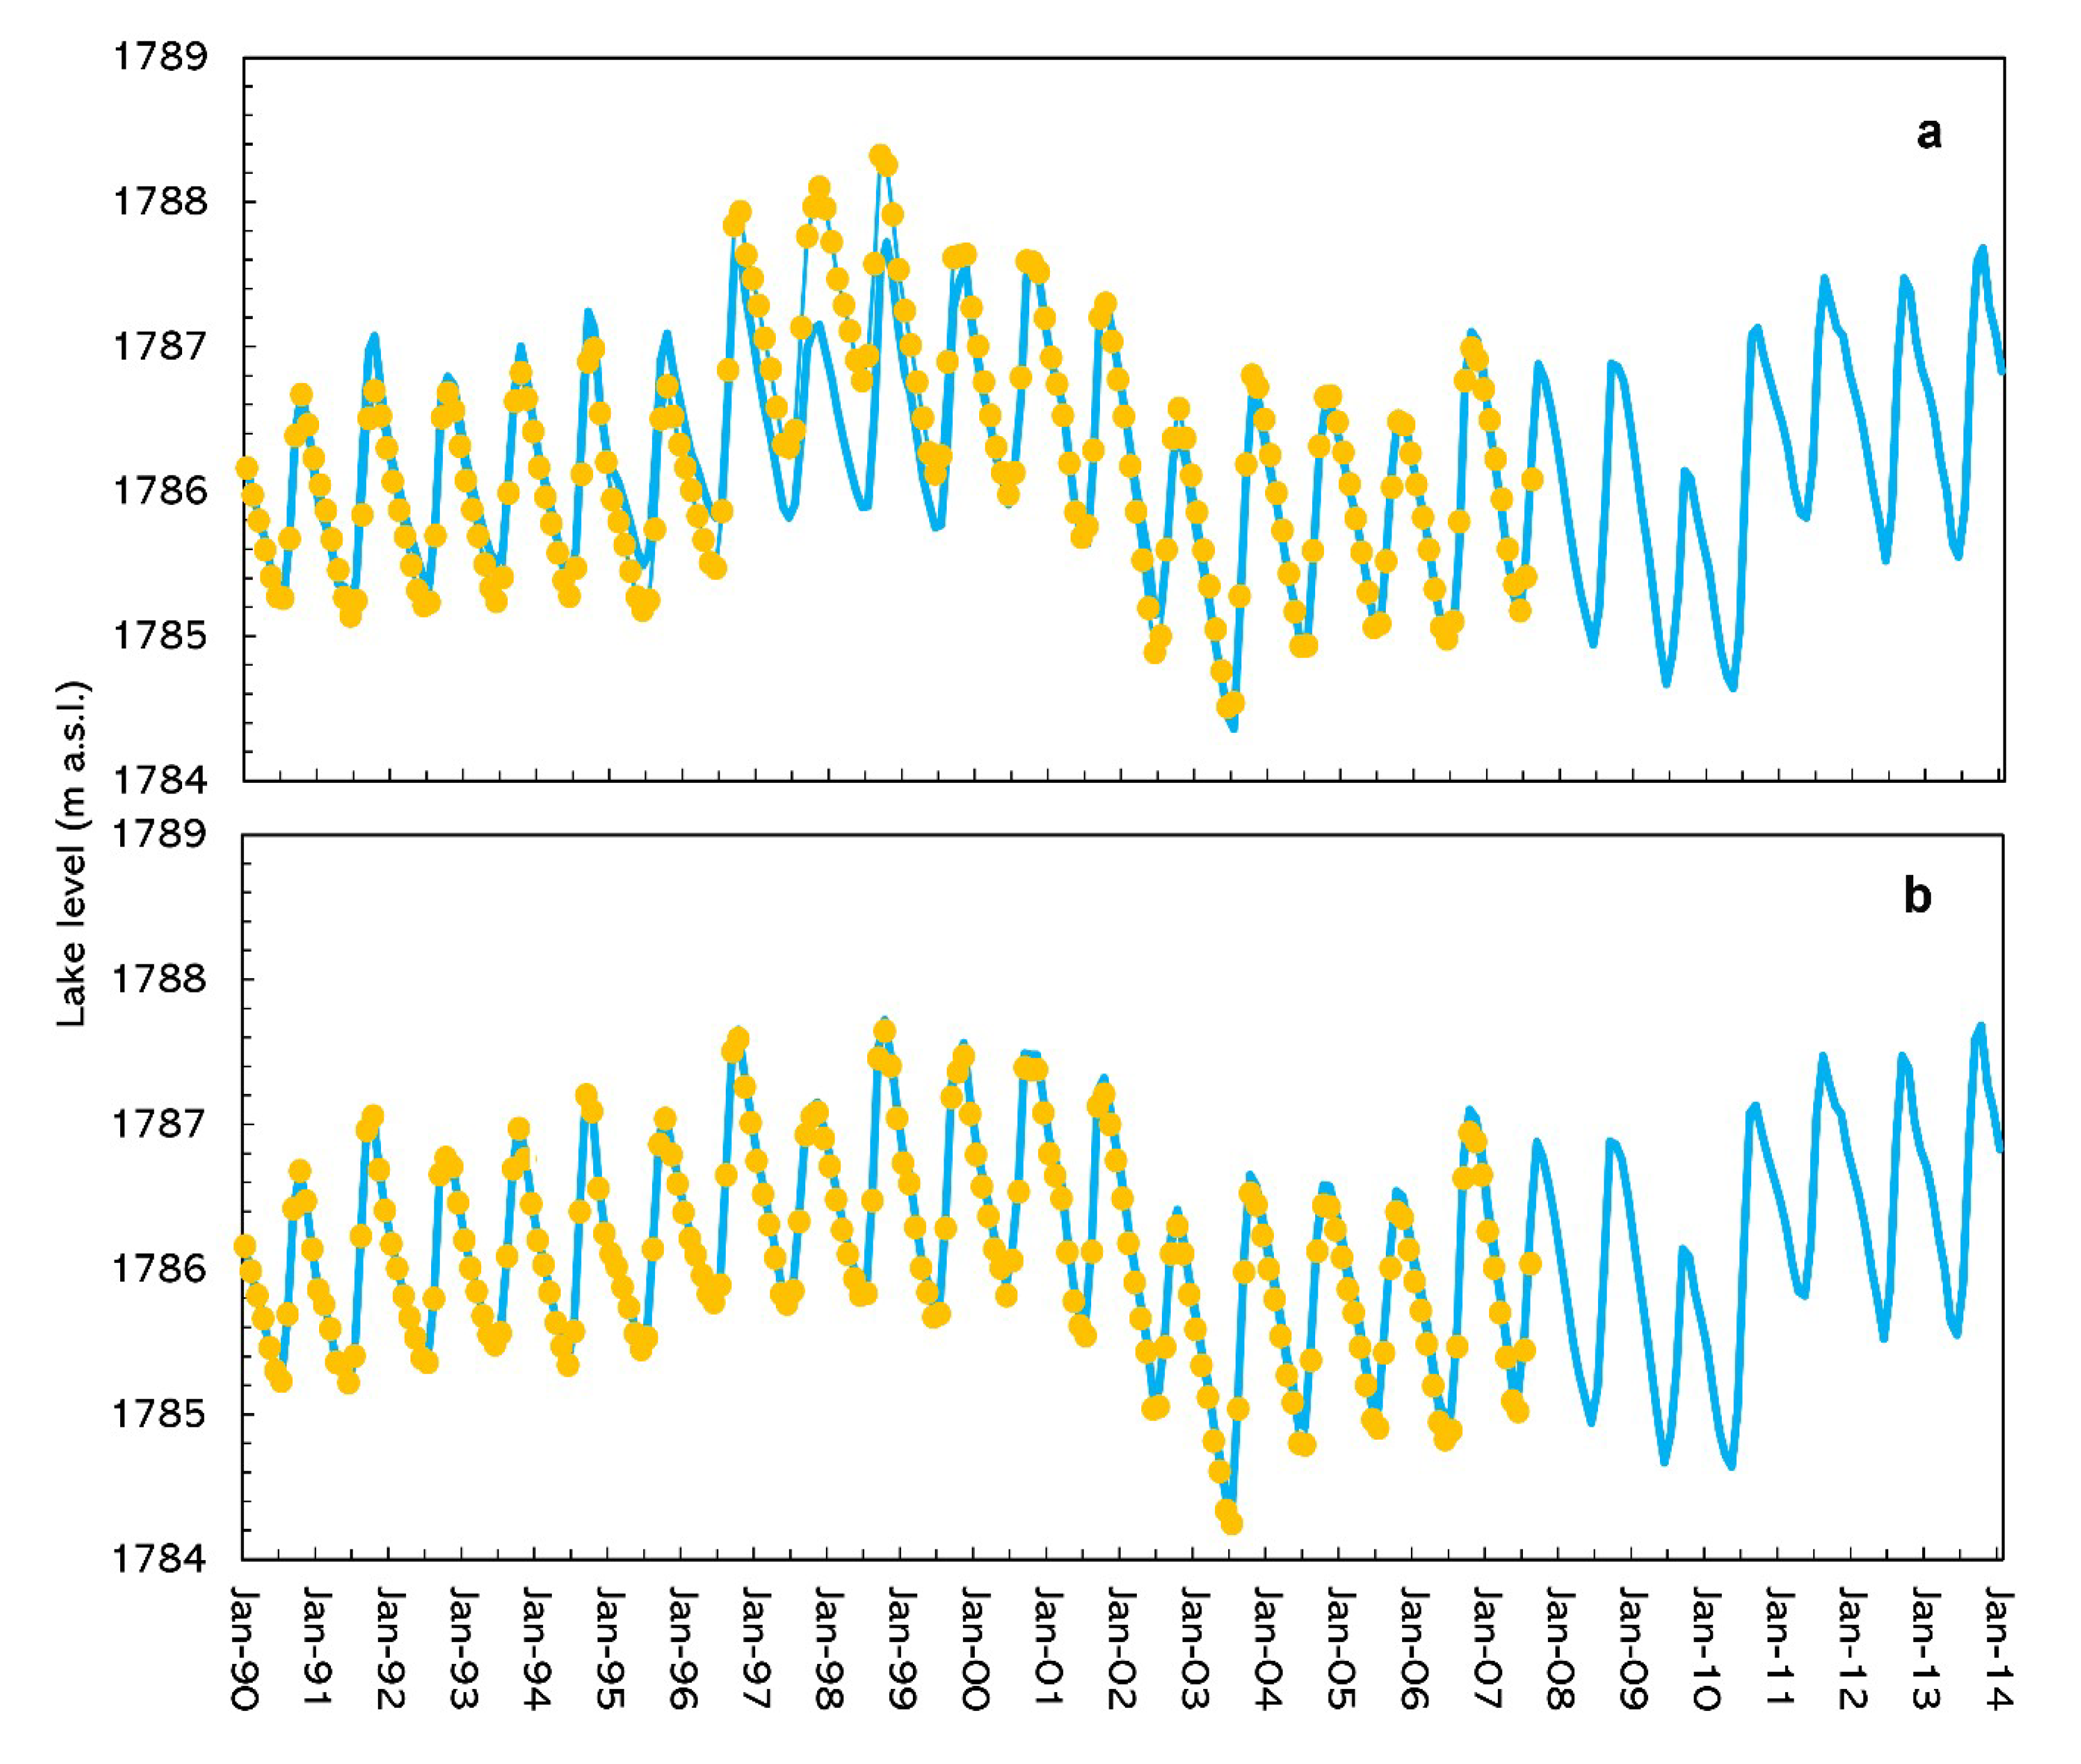
Finally, we will use the predicted inflows and water losses of Lake Tana with Equation (15) with the data in Table 4 on how well the observed lake levels can be simulated (Figure 11 and Figure S5). Comparing Figure 11a (land-based rainfall) and 11b (lake + land-based rainfall) with a lake evaporation rate of 1650 mm a−1 shows that the lake + land-based precipitation fitted the observed lake level closer (NSE greater than 0.90) than the land-based precipitation (NSE just under 0.90, Table S4). The lake level prediction with the 1426 mm a−1 and with the 1789 mm a−1 evaporation rates (Figure S5) are very similar to the results of the 1650 mm a−1 evaporation rate. Note that, strictly defined, the lake level predictions (Figure 11 and Figure S5) are not a proper validation, but only confirm whether the linear regression is valid. If all predicted values were equal to the observed values, there would have been a perfect fit. The less linear the relationship, the poorer the lake-level prediction would be. Thus, interestingly water level prediction based on the rainfall on the lake that was based partly on the stations on the shore and Dek Island was more accurate than only land-based stations (Figure 11 and Figure S5).
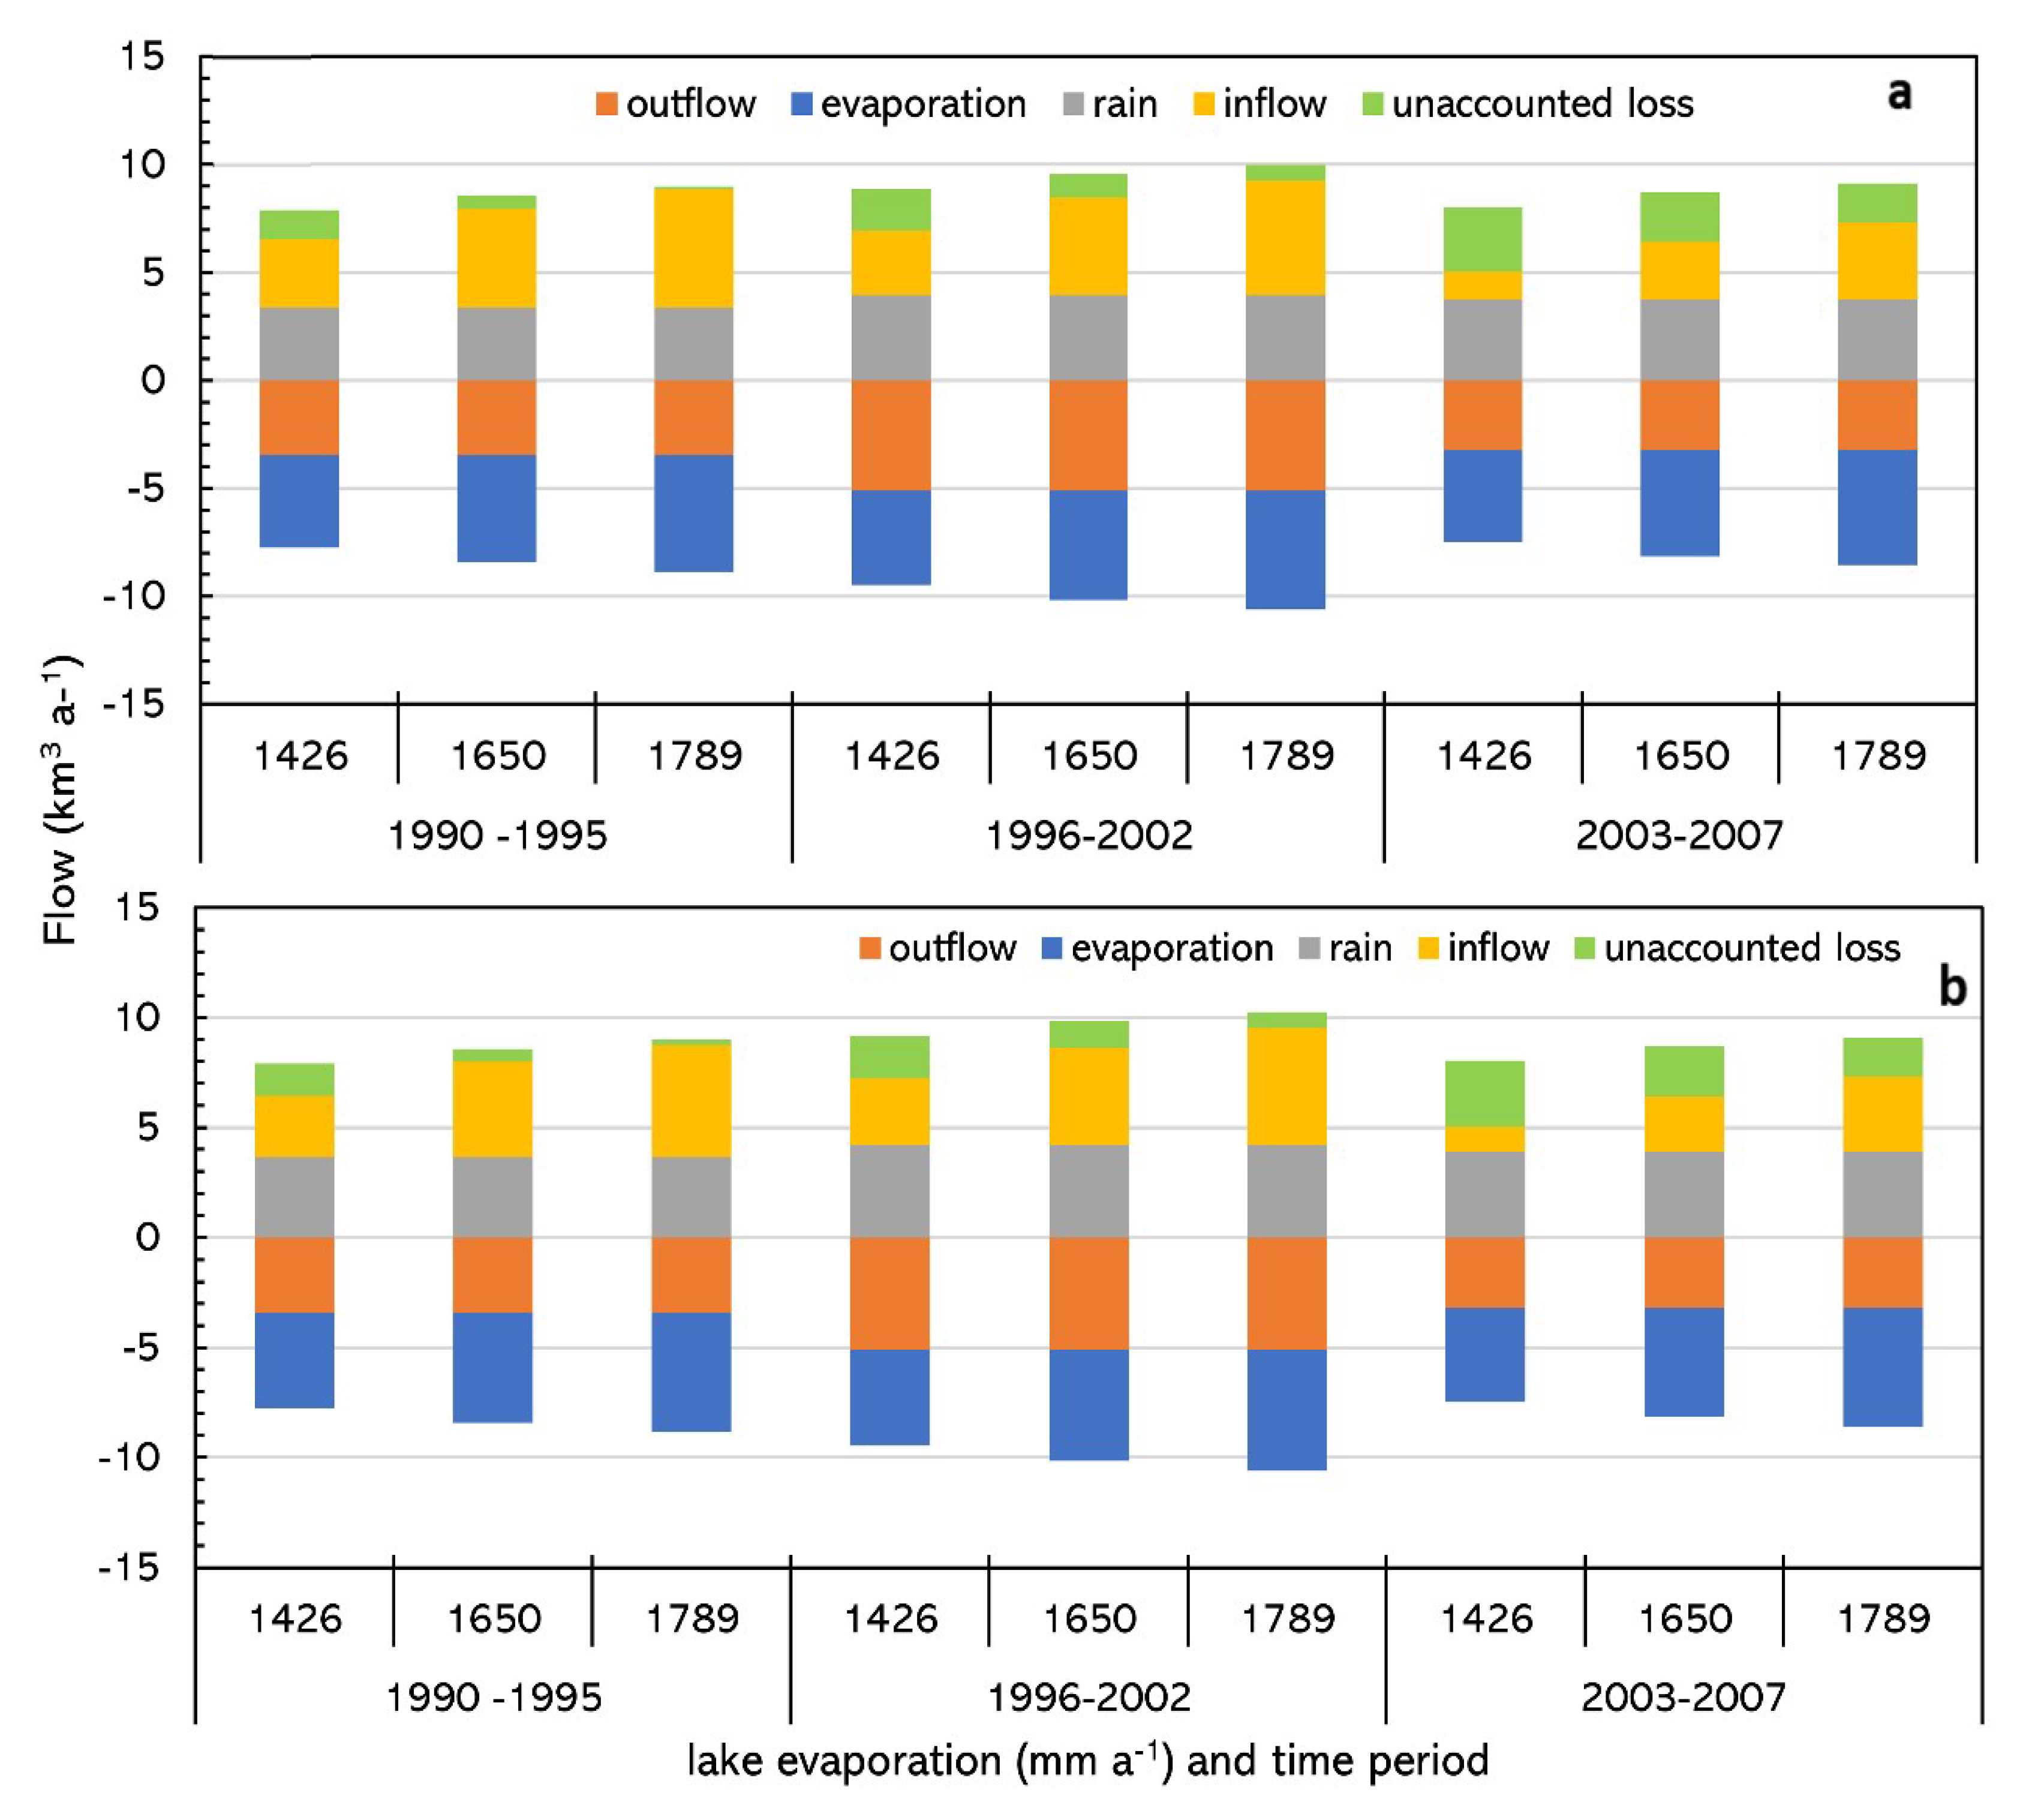
4.8. Lake Water Balance
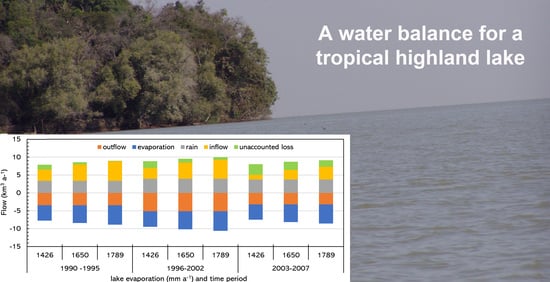
The water balance for the lake is shown in Figure 12 and summarized in Table A1 in the Appendix A. As described before, the evaporation, outflow, and rain are obtained from the responsible government organizations. The “inflow and losses” in Table A1 were obtained as the rest term in the water balance of the lake (Equation (9b)). To differentiate inflow from unaccounted loss in the lake, a linear regression of the “inflow and losses” with the gauged flow for the four major rivers was carried out (Section 4.6). The lake-level change (presented as an annual lake storage change) is due to the difference in lake level at the end and the beginning of each period. The lake level on 1 January 1990, was 1786.10 m a.s.l.; in 1996 the level was 1786.44 m a.s.l.; on 1 January 2003, it was 1785.70 m a.s.l., and on January 2007 it was again 1786.44 m a.s.l. Note the difference in storage between 1786.44 and 1785.70 is just over 2.1 km3 and agrees (within rounding off errors) with the data in Table A1 for 1996–2007 where the storage due to lake-level change loss is divided by the number of years in the period.
For each period (i.e., 1990–1995, 1996–2002, 2003–2006) the inflow, (Qinflow), and the loss, L increases with the lake evaporation rate. For example, in the period from 1990–1995, the evaporation increased from 1426 mm a−1 (or 4.31 km3 a−1) to 1789 mm a−1 (or 5.40 km3 a−1). This is an increase of 1.09 km3 a−1 in evaporation losses. The sum of the inflow and losses increased by the same amount for these evaporation rates during the same period (Figure 12, Table A1). This is, obviously, a consequence of how the inflow and losses are calculated with Equation (9a,b).
The effect of lake rainfall is more complicated. First, the amount of rain on the lake is indirectly related to the amount of rain in the watershed. Thus, the greater amounts of rainfall in the watershed the greater the inflow as shown in Figure 12 in which 1996–2002 was the wettest and had also the greatest amount of inflow. Second, within a particular period the greater the rainfall the lower the inflow as prescribed by Equation (9a,b). This can be shown by comparing Figure 12a,b and Table A1 where the lake + land-based precipitation from 1990–1995 was 0.28 km3 a−1 greater than the land-based precipitation and resulted in a decrease in both inflow and losses by 0.28 km3 a−1 for the three evaporation rates. It is similar to the outflow of the lake where any error is directly reflected in the inflow and losses.
5. Discussion
5.1. Optimal Rainfall and Evaporation Rates
Like many other lakes in developing countries where funding for monitoring the hydrological and meteorological networks is limited, a wide set parameter values for Lake Tana can be chosen in determining the water balance. This results in uncertainties in the water balance beyond that result from the rainfall variability. For example, evaporation rates employed varied from 1426 to 1789 mm a−1. This resulted, as shown in Table A1 and Figure 12, in a variation in the inflow to the lake from 1.14 km3 a−1 to 3.57 km3 a−1 in the period from 2003–2007 for the land-based precipitation. Similar but smaller differences in inflow resulted in the rain gauges chosen for determining the precipitation on the lake (Figure 12, Table A1)
Thus, to obtain the best estimate for lake inflow and unaccounted water losses, the optimal values for lake rainfall and evaporation are needed. Since including rain gauges in and near the lake improves the accuracy of the amount of rain falling on the lake, the rainfall based on a combination of gauges near the lake and the land (i.e., lake + land-based rainfall) is a better representation of the lake rainfall compared to the only land-based stations. Most current studies on lake evaporation based on a full energy balance of the lake with satellite data [27,30,54] agree that Penman understates the lake evaporation and reported evaporation rates ranging from 1563–1688 mm a−1 (Table 1). Thus, water balances with evaporation rates of around 1650 mm a−1 and lake rainfall validated by stations that are either on the Island of the lake or close to the shore are likely the most accurate
5.2. Inflow from Gauged and Ungauged Watersheds of Lake Tana
As noted in the results section, the increase in the ratio α, from an average of 0.48 for 1990–1995 to 0.69 for 2003 (as shown in Table 4) is not physically realistic. We argue that the most likely reason for the increase of α is the increase of the river bed height of the Rib and Gumura in the Fogera Plain by about 4 m [58,59]. This increase occurred between 1971 and 1999 [44,58,59] when the sediment loads increased due to soil degradation and gully formation in the watersheds [60,61]. The reasoning is as follows: the increase in river bed level increased the flooding of the plain and thus the portion of the flow measured at the gauge from the watershed decreased. This is confirmed by [62] who plotted the monthly flows for August and September from 1973 to 2018 for the Gumura river. The monthly flows for August in the Gumara river averaged around 215 m3 s−1 from 1973 to 1990 [62] then decreased in the 20 years from 1990 to 2010 after which the discharge was around 185 m3 s−1 on average. This is a decrease of 30% in monthly flows over 20 years.
By considering the PED model as a mathematical construct that translates rainfall in streamflow, any change in the ratio of the predicted and observed streamflow is caused by external factors other than rainfall [44]. In this way, a decrease in discharge due to the increasing bed level can be demonstrated. In the case of the four major rivers in the Lake Tana watershed, Zimale et al. [44] found that the relationship of the observed daily discharge, , and predicted daily discharge, , for 1994 to 1999 for each of the four major rivers.
and from 2000 to 2009,
Thus, the observed gauged discharge decreased by almost 20% over 15 years. If we assume in Figure 8e,f that gauged flows are under predicted by 20% compared to discharge from 1994 to 1999 the α will decrease by 20% and the resulting value of α that was 0.69 (Table 3) in the period from 2003–2007 will decrease to α = 0.55 for 1994–1999 period. This is in the same order as to the value of α the period of 1995–2002 in Table 4. Using the 30% decrease in flow as reported by Abebe, et al. [62] and assuming that the decrease occurred from 1990 through 2010, the α values for the last period decrease similarly to nearly the same value as in the first period.
In summary, based on this analysis and that in Section 4.6.2 the following two points can be made: (1) streams gain water downstream and the lower runoff per unit area in the downstream portion compared with the gauged upland area is caused by more rain on the higher elevations; (2) the ratio of α = 0.48 for 1990–1995 is the realistic representation of the ratio of runoff per unit area of ungauged and gauged watersheds.
5.3. Unaccounted Losses of Lake Water
While the sum of total inflow and (unaccounted) losses was determined as the rest term in the mass balance of the lake independently of the gauged flows, the split between inflow and unaccounted losses depends on the linear regression of gauged flow and the sum of the lake inflow and losses (Equations (15)–(18), Figure 8). The main difference in the runoff between the gauged upland and ungauged downstream is caused mainly by the differences in rainfall in the basin as discussed in Section 5.2. Since we used linear regression, the intercept with the Y-axis depends on the slope of the line. Thus, the greater the slope, the greater the loss is. This is one of the reasons that the unaccounted losses increased from 1990–2006 for a particular lake evaporation rate (Figure 12, Table A1). Since the increase in slope was caused by the inaccurate gauged flow of the Gumura and Rib due to the increase in river bed over time (Section 5.1), the unaccounted losses from 1990 to 1995 are the most accurate (Figure 12, Table A1) especially since that is the time the river bed increase started. In Section 5.2, we argued that the lake evaporation rates in the order of 1650 mm a−1 were most likely correct. This resulted in an unaccounted loss of around 0.6 km3 a−1. This is equivalent to a water depth of approximately 20 cm of the lake each year. It should, however, be noted that any error in the observed lake outflow will directly affect the unaccounted loss (Section 4.8 and Section 5.1).
Although the amount of unaccounted loss varies greatly in Table 1, all but two studies showed a loss of water. This study is in agreement because monthly water balances are negative which would mean if there were no water losses in the lake, the flow from the rivers would be negative which is impossible. In the two year study of Dessie, et al. [31], measurements for the river flows from most of the basin show losses equivalent to 12.5 cm depth of the lake (or 0.38 km3 a−1) using the high evaporation rate of 1789 mm a−1 (Table 1, scenario 2 [31]). This is in the same order as the unaccounted loss in this study which is 0.24 km3 a−1 for the same evaporation rate as [31] for the period of 1990–1995.
There are different explanations for these unaccounted losses. Kebede, et al. [32] and Dessie, et al. [31] argued the unaccounted evaporation loss of the plains around Lake Tana equal to 0.5 km3 a−1 are responsible for the unaccounted losses. However, this would not explain the negative monthly values during the low flow period, because although the additional evaporation occurs during the dry period, the plains are not hydrologically connected with the lake [43]. During the rain phase, the plains are re-saturated, and thus the evaporation during the dry phase decrease the flow at that time. As argued above this would increase the slope of the regression line but cannot explain the monthly negative losses during the low flow period.
Dessie et al. [31] argued that irrigation is the cause of unaccounted losses. This could be certainly the case in the current time, but the main push for irrigation was only made starting from the year 1998 with the consideration of the basin as a growth corridor [9] and this cannot, therefore, explain the losses in the period from 1990–1996.
Measurement errors are mentioned often as well. Dessie et al. [31], for example, increased the outflow of the lake in his scenario 2 to reduce the unaccounted losses. Although measurements certainly are one of the largest uncertainties, the measurement errors in outflow need to be in the order of 20% for changing the loss to surplus.
Finally, Mamo et al. [33] suggested that subsurface flow from the lake could explain the unaccounted loss. Although the conventional wisdom is that 60 m deep layer of sediment on the bottom of the lake prevent any seepage, water moving preferentially through the clay layer to the faults would not be impossible given theoretically flow lines tend to concentrate and form pipes [63,64]. Flow via faults is extensive in the Lake Tana basin [65,66]. Pipes have been found in the uplands in the periodically saturated vertisols as well and have been considered as one of the causes of gully formation [67]. Other studies that have reported groundwater in or outflow of lakes through faults were in Ethiopia (Lake Hayq and Ardibo [68], Lake Beseka [69]) in Japan (the crater lake system of Kusatsu-Shirane volcano [70]) and finally the Caspian Sea [71].
6. Conclusions
Lakes are the largest source of surface freshwater. Therefore, it is surprising, that while according to the Science Citation Index [72] thousands of studies have been published on the water and nutrient balances of lakes, a relatively small number of studies (<50) have examined the water balance of lakes in the highlands. An even smaller number of studies investigated the significance of inflow and outflow through faults in the world [33,68,69,70,71].
Lake Tana is one of these highland lakes in the Ethiopian highlands. Lake Tana is a natural reservoir that supplies water for multiple purposes including ecology in the Lake and the surrounding, environmental flow, domestic water supply, irrigation (upstream and downstream of the lake), hydropower, navigation, recreation, and tourism. However, the water balance is too uncertain to guide the basin development plan for the coming 20 to 30 years. Previous calculations of the water balance varied widely in rainfall, evaporation, inflow, and outflow. Despite these differences, almost all studies showed that there were losses of water in the Lake Tana basin that could not be accounted for. Therefore, we took a fresh look at the water balance of Lake Tana. Since precipitation was considered one of the terms that varied the most between the numerous studies, we installed two stations of which one was in the lake and one on the shore. We found that the precipitation was greater on the lake than on the land. We confirmed that the water balance for Lake Tana and its basin does not close and water is lost other than through the outlets of the lake and likely via subsurface flow paths.
Much of the methodology developed in this paper was necessitated by the lack of a well-defined and accurate data set for the components of the water balance. Mainly based on the consistency between the various hydrological and meteorological measurements taken over a 100-year period, we found that streamflow data from 1990 to 1995 were likely the most accurate, lake evaporation of around 1600–1650 mm a−1 was the best estimate, and including rainfall stations provided more accurate precipitation on the lake. Based on these findings, we found a loss of 0.6 km3 a−1 of water (equivalent to a depth of 20 cm over the entire lake) that most likely left the lake via subsurface flow through faults. This “unaccounted” loss of water is consistent with most other studies on the water balance of Lake Tana.
There is an urgent need to verify and quantify more accurately the loss of water from the lake via groundwater through faults by fully integrating hydrological and geological studies. In this study, the loss of water from Lake Tana is only inferred from monthly water balances. It still should be further investigated by isotope studies than confirm the preliminary findings of Mamo, et al. [33]. Also, the efforts made to improve the evaporation and discharge data direct measurement of evaporation in the lake and monitoring of river discharges close to the lake (as started by Dessie et al. [13,31]) should be continued. This is especially important because of the future planned irrigation projects that will decrease the inflow to Lake Tana. Lake core studies have shown that Lake Tana dried up several times [73]. This might happen again if, in the future, rainfall decreases, evaporation increases and irrigation in the Lake Tana basin expands beyond what is currently planned.
Supplementary Materials
The following are available online at https://www.mdpi.com/2073-4441/12/10/2737/s1: Table S1: Length of record and spatial coordinates of the data for 13 rainfall stations in and near the Lake Tana basin, Table S2: Percentage weights based on Thiessen polygon method for the rainfall station for calculating the Lake Tana rainfall, Table S3: Slope intercept and R2 for the linear regression of monthly gauged discharge and the inflow to and water loss from Lake Tana, Table S4: Performance evaluation results with three parameters for the land-based and lake + land-based precipitation and evaporations 1426 mm a−1, 1650 mm a−1 and 1789 mm a−1. Figure S1: Long-term average monthly rainfall of the eight stations used for calculating the precipitation of Lake Tana, Figure S2: Cumulative areal rainfall estimated using the previous six stations and previous station plus two newly established stations, Figure S3: Comparison of Lake inflow and losses based on land-based (a,b) and lake + land-based (c,d) rainfall corresponding to three evaporation values, Figure S4: Regression of lake inflow and losses with the discharge (m3 s−1) of the four gauged watersheds Gilgel Abay, Gumara, Rib and Megech for precipitation based on land-based rain gauges (a,c,e), lake + land-based rain gauge (b,d,f) and lake evaporation rates of 1426 mm a−1 (a,b); 1650 mm a−1 (c,d) and 1789 mm a−1 (e,f), and Figure S5: Water-level prediction of Lake Tana with rainfall based on land-based stations (a,b), lake + land-based stations (c,d) corresponding to evaporations 1426 mm a−1 (a,c), and 1789 mm a−1 (b,d).
Author Contributions
M.L.A. contributed to conceptualization, data collection, data analysis, writing the original draft manuscript, and improving the manuscript based on the comments and suggestions of the coauthors. A.W.W. was directly involved with the computational aspects of the study and with the review and editing of the manuscript. F.A.Z., S.A.T., and T.S.S. supervised the study and aided in the various aspect of the study including checking the results and editing of the manuscript. All authors have read and agreed to the published version of the manuscript.
Funding
External funds were not used for this research
Acknowledgments
The authors acknowledge the efforts of the local people for their help during the installation of and protecting the rain gauges. We thank the Faculty of Civil and Water Resources Engineering, Bahir Dar Institute of Technology for providing the automatic rain gauges and covering the financial expenses for renting boats during data collection. We are grateful to the Lake Tana Subbasin Organization, Abay Basin Development Office, Hydrology and Water Quality, and Research and Development Directorates under the Ministry of Water, Irrigation and Energy, and National Meteorological Agency of Ethiopia, Bahir Dar branch office for making the various data available. Finally, we than the Ethiopian Construction Design and Supervision Works Corporation for facilitating the research by allowing the first author to collect the data and encouraging the research.
Conflicts of Interest
The authors declare no conflict of interest.
Appendix A

Table A1.
Mass balance and calculated inflow and unaccounted losses for Lake Tana for three periods from 1 January 1990–30 May 2007 for three evaporation rates, observed for land-based and lake + land-based precipitation, observed outflow.
Table A1.
Mass balance and calculated inflow and unaccounted losses for Lake Tana for three periods from 1 January 1990–30 May 2007 for three evaporation rates, observed for land-based and lake + land-based precipitation, observed outflow.
| Units | 1990–1995 | 1996–2002 | 2003–2007 | ||||||||
|---|---|---|---|---|---|---|---|---|---|---|---|
| Evaporation | mm a−1 | 1426 | 1650 | 1789 | 1480 | 1650 | 1789 | 1426 | 1650 | 1789 | |
| land based | evaporation | km3 a−1 | −4.31 | −4.98 | −5.40 | −4.35 | −5.04 | −5.46 | −4.27 | −4.94 | −5.35 |
| outflow | km3 a−1 | −3.44 | −3.44 | 3.44 | −5.12 | −5.12 | −5.12 | −3.22 | −3.22 | −3.22 | |
| rain | km3 a−1 | 3.40 | 3.40 | 3.40 | 3.95 | 3.95 | 3.95 | 3.75 | 3.75 | 3.75 | |
| Inflow + loss | km3 a−1 | 4.49 | 5.17 | 5.59 | 5.21 | 5.89 | 6.32 | 4.28 | 4.95 | 5.37 | |
| inflow | km3 a−1 | 3.17 | 4.57 | 5.47 | 3.29 | 4.81 | 5.60 | 1.28 | 2.67 | 3.57 | |
| unaccounted loss | km3 a−1 | 1.32 | 0.60 | 0.12 | 1.92 | 1.08 | 0.72 | 3.00 | 2.28 | 1.80 | |
| lake level change | km3 a−1 | 0.14 | 0.14 | 0.14 | −0.31 | −0.31 | −0.31 | 0.55 | 0.55 | 0.55 | |
| Lake + land based | evaporation | km3 a−1 | −4.31 | −4.98 | −5.40 | −4.35 | −5.04 | −5.46 | −4.27 | −4.94 | −5.35 |
| outflow | km3 a−1 | −3.44 | −3.44 | −3.44 | −5.12 | −5.12 | −5.12 | −3.22 | −3.22 | −3.22 | |
| rain | km3 a−1 | 3.64 | 3.64 | 3.64 | 4.23 | 4.23 | 4.23 | 3.89 | 3.89 | 3.89 | |
| Inflow +loss | km3 a−1 | 4.25 | 4.93 | 5.35 | 4.93 | 5.61 | 6.04 | 4.14 | 4.81 | 5.23 | |
| inflow | km3 a−1 | 2.81 | 4.33 | 5.11 | 3.01 | 4.41 | 5.32 | 1.14 | 2.53 | 3.43 | |
| unaccounted loss | km3 a−1 | 1.44 | 0.60 | 0.24 | 1.92 | 1.20 | 0.72 | 3.00 | 2.28 | 1.80 | |
| lake level change | km3 a−1 | 0.14 | 0.14 | 0.14 | −0.31 | −0.31 | −0.31 | 0.55 | 0.55 | 0.55 | |
References
- Rodionov, S.N. Caspian Sea Level and Anticipated Global Warming. In Global and Regional Climate Interaction: The Caspian Sea Experience; Springer: Berlin/Heidelberg, Germany, 1994; pp. 154–195. [Google Scholar]
- Coe, M.T.; Foley, J.A. Human and natural impacts on the water resources of the Lake Chad basin. J. Geophys. Res. Atmos. 2001, 106, 3349–3356. [Google Scholar] [CrossRef]
- Micklin, P. The Aral sea disaster. Annu. Rev. Earth Planet. Sci. 2007, 35, 47–72. [Google Scholar] [CrossRef] [Green Version]
- Tsegaye, K. Action, inaction and environmental destruction: Socionatural determinants of the disappearance of Lake Alemaya (Haromaya), eastern Ethiopia. East. Ethiop. 2014, 3, 361–369. [Google Scholar] [CrossRef]
- Nicholson, S.E. Historical fluctuations of Lake Victoria and other lakes in the northern Rift Valley of East Africa. In Environmental Change and Response in East African Lakes; Springer: Berlin/Heidelberg, Germany, 1998; pp. 7–35. [Google Scholar]
- Steenhuis, T.S.; Hrnčíř, M.; Poteau, D.; Luna, E.J.R.; Tilahun, S.A.; Caballero, L.A.; Guzman, C.D.; Stoof, C.R.; Šanda, M.; Yitaferu, B. A saturated excess runoff pedo transfer function for vegetated watersheds. Vadose Zone J. 2013, 12. [Google Scholar] [CrossRef]
- Kebede, S.; Travi, Y.; Alemayehu, T.; Marc, V. Water balance of Lake Tana and its sensitivity to fluctuations in rainfall, Blue Nile basin, Ethiopia. J. Hydrol. 2006, 316, 233–247. [Google Scholar] [CrossRef]
- SMEC I. Hydrological study of the Tana-Beles sub-basins. In Surface Water Investigation; MOWR: Addis Ababa, Ethiopia, 2008. [Google Scholar]
- Alemayehu, T.; McCartney, M.; Kebede, S. Simulation of water resource development and environmental flows in the Lake Tana subbasin. In Improved Water and Land Management in the Ethiopian Highlands: Its Impact on Downstream Stakeholders Dependent on the Blue Nile, Proceedings of the Intermediate Results Dissimination Workshop held at the International Livestock Research Center (ILRI), Addis Ababa, Ethiopia, 5–6 February 2009; International Water Management Institure: Colombia, Sri Lanka, 2009. [Google Scholar] [CrossRef]
- Worqlul, A.W.; Collick, A.S.; Rossiter, D.G.; Langan, S.; Steenhuis, T.S. Assessment of surface water irrigation potential in the Ethiopian highlands: The Lake Tana Basin. Catena 2015, 129, 76–85. [Google Scholar] [CrossRef]
- Burney, J.A.; Naylor, R.L.; Postel, S.L. The case for distributed irrigation as a development priority in sub-Saharan Africa. Proc. Natl. Acad. Sci. USA 2013, 110, 12513–12517. [Google Scholar] [CrossRef] [Green Version]
- Legesse, S.A. Environmental protection in the Lake Tana basin. In Social and Ecological System Dynamics; Springer: Berlin/Heidelberg, Germany, 2017; pp. 433–452. [Google Scholar]
- Dessie, M.; Verhoest, N.E.; Adgo, E.; Poesen, J.; Nyssen, J. Scenario-based decision support for an integrated management of water resources. Int. J. River Basin Manag. 2017, 15, 485–502. [Google Scholar] [CrossRef]
- Alemu, M.L.; Geset, M.; Mosa, H.M.; Zemale, F.A.; Moges, M.A.; Giri, S.K.; Tillahun, S.A.; Melesse, A.M.; Ayana, E.K.; Steenhuis, T.S. Spatial and temporal trends of recent dissolved phosphorus concentrations in Lake Tana and its four main tributaries. Land Degrad. Dev. 2017, 28, 1742–1751. [Google Scholar] [CrossRef]
- Abera, B.; KIbret, M.; Van Echelpoel, W.; Kahsay, A.; Zelalem, W.; Ayalew, D.; Adgo, E.; Nyssen, J.; Goethals, P.; Verleyen, E. Physical and chemical limnology of Lake Tana and its tributary rivers. In Institutional University Cooperation with Bahir Dar University-Year 3 Joint Steering Committee Meeting-Excursion Guide; Bahir Dar University; Bahir Dar Ethiopia, & VLIR-UOS: Brussels, Ethiopia, 2019; pp. 10–12. [Google Scholar]
- Grabham, G.W. Report of the Mission to Lake Tana 1920–1921; Government Press: Cairo, Egypts, 1925. [Google Scholar]
- Cheesman, R.E. Lake Tana and the Blue Nile: An Abyssinian Quest; Macmillan and Co.: London, UK, 1936. [Google Scholar]
- Hurst, H.; Philips, P. The Nile Basin. In Ten-Day Mean and Monthly Mean Discharges of the Nile and Its Tributaries; Ministry of Public Works, Physical Department: Cairo, Egypt, 1933; Volume IV. [Google Scholar]
- Conway, D. The climate and hydrology of the Upper Blue Nile River. Geogr. J. 2000, 166, 49–62. [Google Scholar] [CrossRef] [Green Version]
- Sutcliffe, J.V.; Parks, Y.P. The Hydrology of the Nile; IAHS Press: Wallingford, UK, 1999. [Google Scholar]
- Aragie, M.A. Reservoir Operation and Establishment of Reservoir Rule for Lake Tana. Master’s Thesis, Faculty of Technology, Addis Ababa University, Addis Ababa, Ethiopia, 2005. [Google Scholar]
- Pelgrum, H.; Bastiaanssen, W. Remote Sensing Studies of the Tana-Bales Sub Basins; Water Watch Remote Sensing Services. University of Twente Faculty of Geo-Information and Earth Observation (ITC): Enschede, The Netherlands, 2006. [Google Scholar]
- Gieske, A.; Rientjes, T.; Haile, A.T.; Worqlul, A.W.; Asmerom, G.H. Determination of Lake Tana evaporation by the combined use of SEVIRI, AVHRR and IASI. In Proceedings of the 2008 EUMETSAT Meteorological Satellite Conference, Darmstadt, Germany, 8–12 September 2008. [Google Scholar]
- Wale, A.; Rientjes, T.; Gieske, A.; Getachew, H. Ungauged catchment contributions to Lake Tana’s water balance. Hydrol. Process. Int. J. 2009, 23, 3682–3693. [Google Scholar] [CrossRef]
- Chebud, Y.A.; Melesse, A.M. Modelling lake stage and water balance of Lake Tana, Ethiopia. Hydrol. Process. Int. J. 2009, 23, 3534–3544. [Google Scholar] [CrossRef]
- Setegn, S.G.; Srinivasan, R.; Dargahi, B. Hydrological modelling in the Lake Tana Basin, Ethiopia using SWAT model. Open Hydrol. J. 2008, 2, 49–62. [Google Scholar] [CrossRef] [Green Version]
- Rientjes, T.; Perera, B.; Haile, A.; Reggiani, P.; Muthuwatta, L. Regionalisation for lake level simulation-the case of Lake Tana in the Upper Blue Nile, Ethiopia. Hydrol. Earth Syst. Sci. 2011, 15, 1167. [Google Scholar] [CrossRef]
- Tegegne, G.; Hailu, D.; Aranganathan, S.M. Lake Tana reservoir water balance model. Int. J. Appl. Innov. Eng. Manag. 2013, 2, 474–478. [Google Scholar]
- Nigatu, Z.M. Hydrological Impacts of Climate Change on Lake Tana’s Water Balance; University of Twente Faculty of Geo-Information and Earth Observation (ITC): Enschede, The Netherlands, 2013. [Google Scholar]
- Duan, Z.; Gao, H.; Ke, C. Estimation of lake outflow from the poorly gauged Lake Tana (Ethiopia) using satellite remote sensing data. Remote Sens. 2018, 10, 1060. [Google Scholar] [CrossRef] [Green Version]
- Dessie, M.; Verhoest, N.E.; Pauwels, V.R.; Adgo, E.; Deckers, J.; Poesen, J.; Nyssen, J. Water balance of a lake with floodplain buffering: Lake Tana, Blue Nile Basin, Ethiopia. J. Hydrol. 2015, 522, 174–186. [Google Scholar] [CrossRef]
- Kebede, S.; Admasu, G.; Travi, Y. Estimating ungauged catchment flows from Lake Tana floodplains, Ethiopia: An isotope hydrological approach. Isot. Environ. Health Stud. 2011, 47, 71–86. [Google Scholar] [CrossRef]
- Mamo, S.; Ayenew, T.; Berehanu, B.; Kebede, S. Hydrology of the Lake Tana Basin, Ethiopia: Implication to Groundwater-Surface Waters Interaction. J. Environ. Earth Sci. 2016, 6, 54–66. [Google Scholar]
- Segond, M.-L.; Wheater, H.S.; Onof, C. The significance of spatial rainfall representation for flood runoff estimation: A numerical evaluation based on the Lee catchment, UK. J. Hydrol. 2007, 347, 116–131. [Google Scholar] [CrossRef]
- Kizza, M.; Westerberg, I.; Rodhe, A.; Ntale, H.K. Estimating areal rainfall over Lake Victoria and its basin using ground-based and satellite data. J. Hydrol. 2012, 464, 401–411. [Google Scholar] [CrossRef]
- Ba, M.B.; Nicholson, S.E. Analysis of convective activity and its relationship to the rainfall over the Rift Valley lakes of East Africa during 1983–90 using the Meteosat infrared channel. J. Appl. Meteorol. 1998, 37, 1250–1264. [Google Scholar] [CrossRef]
- Cheung, W.H.; Senay, G.B.; Singh, A. Trends and spatial distribution of annual and seasonal rainfall in Ethiopia. Int. J. Climatol. J. R. Meteorol. Soc. 2008, 28, 1723–1734. [Google Scholar] [CrossRef]
- Belete, M.A. Modeling and Analysis of Lake Tana Sub Basin Water Resources Systems, Ethiopia. Ph.D. Thesis, Faculty of Agricultural and Environmental Sciences, Rostock University, Rockstock, Germany, 2014. [Google Scholar]
- Chanie, T.; Collick, A.S.; Adgo, E.; Lehmann, C.J.; Steenhuis, T.S. Eco-hydrological impacts of Eucalyptus in the semi humid Ethiopian Highlands: The Lake Tana Plain. J. Hydrol. Hydromech. 2013, 61, 21–29. [Google Scholar] [CrossRef] [Green Version]
- Dagnew, D.C.; Guzman, C.D.; Zegeye, A.D.; Tibebu, T.Y.; Getaneh, M.; Abate, S.; Zemale, F.A.; Ayana, E.K.; Tilahun, S.A.; Steenhuis, T.S. Impact of conservation practices on runoff and soil loss in the sub-humid Ethiopian Highlands: The Debre Mawi watershed. J. Hydrol. Hydromech. 2015, 63, 210–219. [Google Scholar] [CrossRef] [Green Version]
- Mhiret, D.A.; Dagnew, D.C.; Alemie, T.C.; Guzman, C.D.; Tilahun, S.A.; Zaitchik, B.F.; Steenhuis, T.S. Impact of Soil Conservation and Eucalyptus on Hydrology and Soil Loss in the Ethiopian Highlands. Water 2019, 11, 2299. [Google Scholar] [CrossRef] [Green Version]
- Enku, T.; Melesse, A.M.; Ayana, E.K.; Tilahun, S.A.; Abate, M.; Steenhuis, T.S. Groundwater use of a small Eucalyptus patch during the dry monsoon phase. Biologia 2020, 75, 853–864. [Google Scholar] [CrossRef]
- Enku, T.; Melesse, A.M.; Ayana, E.K.; Tilahun, S.A.; Abate, M.; Steenhuis, T.S. Groundwater evaporation and recharge for a floodplain in a sub-humid monsoon climate in Ethiopia. Land Degrad. Dev. 2017, 28, 1831–1841. [Google Scholar] [CrossRef]
- Zimale, F.A.; Moges, M.A.; Alemu, M.L.; Ayana, E.K.; Demissie, S.S.; Tilahun, S.A.; Steenhuis, T.S. Budgeting suspended sediment fluxes in tropical monsoonal watersheds with limited data: The Lake Tana basin. J. Hydrol. Hydromech. 2018, 66, 65–78. [Google Scholar] [CrossRef] [Green Version]
- Fenta, A.A.; Yasuda, H.; Shimizu, K.; Ibaraki, Y.; Haregeweyn, N.; Kawai, T.; Belay, A.S.; Sultan, D.; Ebabu, K. Evaluation of satellite rainfall estimates over the Lake Tana basin at the source region of the Blue Nile River. Atmos. Res. 2018, 212, 43–53. [Google Scholar] [CrossRef]
- Appelhans, T.; Nauss, T. Spatial patterns of sea surface temperature influences on East African precipitation as revealed by empirical orthogonal teleconnections. Front. Earth Sci. 2016, 4, 3. [Google Scholar] [CrossRef] [Green Version]
- Goshime, D.W.; Absi, R.; Ledésert, B. Evaluation and bias correction of CHIRP rainfall estimate for rainfall-runoff simulation over Lake Ziway watershed, Ethiopia. Hydrology 2019, 6, 68. [Google Scholar] [CrossRef] [Green Version]
- Crétaux, J.-F.; Jelinski, W.; Calmant, S.; Kouraev, A.; Vuglinski, V.; Bergé-Nguyen, M.; Gennero, M.-C.; Nino, F.; Del Rio, R.A.; Cazenave, A. SOLS: A lake database to monitor in the Near Real Time water level and storage variations from remote sensing data. Adv. Space Res. 2011, 47, 1497–1507. [Google Scholar] [CrossRef]
- Kebedew, M.G.; Kibret, A.A.; Tilahun, S.A.; Belete, M.A.; Zimale, F.A.; Steenhuis, T.S. The Relationship of Lake Morphometry and Phosphorus Dynamics of a Tropical Highland Lake: Lake Tana, Ethiopia. Water 2020, 12, 2243. [Google Scholar] [CrossRef]
- Ayana, E.K. Validation of Radar Altimetry Lake Level Data and It’s Application in Water Resource Management. Master’s Thesis, University of Twente, Enschede, The Netherlands, 2007. [Google Scholar]
- Worqlul, A.W.; Ayana, E.K.; Maathuis, B.H.; MacAlister, C.; Philpot, W.D.; Leyton, J.M.O.; Steenhuis, T.S. Performance of bias corrected MPEG rainfall estimate for rainfall-runoff simulation in the upper Blue Nile Basin, Ethiopia. J. Hydrol. 2018, 556, 1182–1191. [Google Scholar] [CrossRef]
- Adem, A.A.; Aynalem, D.W.; Tilahun, S.A.; Steenhuis, T.S. Predicting reference evaporation for the Ethiopian highlands. J. Water Resour. Prot. 2017, 9, 1244. [Google Scholar] [CrossRef] [Green Version]
- Allen, R.G.; Pereira, L.S.; Raes, D.; Smith, M. Crop Evapotranspiration-Guidelines for Computing Crop Water Requirements-FAO Irrigation and Drainage Paper 56; FAO: Rome, Italy, 1998. [Google Scholar]
- Zimale, F.A. Estimation of Water Balance Components Using Remote Sensing Products in the Upper Blue Nile, Lake Tana Sub Basin. Master’s Thesis, Arba Minch University, Arba Minch, Ethiopia, 2009. [Google Scholar]
- Nash, J.E.; Sutcliffe, J.V. River flow forecasting through conceptual models part I—A discussion of principles. J. Hydrol. 1970, 10, 282–290. [Google Scholar] [CrossRef]
- Burt, J.E.; Barber, G.M.; Rigby, D.L. Elementary Statistics for Geographers; Guilford Press: New York, NY, USA, 2009. [Google Scholar]
- Worqlul, A.; Collick, A.; Tilahun, S.; Langan, S.; Rientjes, T.; Steenhuis, T. Comparing TRMM 3B42, CFSR and ground-based rainfall estimates as input for hydrological models, in data scarce regions: The Upper Blue Nile Basin, Ethiopia. Hydrol. Earth Syst. Sci. Discuss. 2015, 12, 2081–2112. [Google Scholar] [CrossRef]
- Abate, M.; Nyssen, J.; Moges, M.M.; Enku, T.; Zimale, F.A.; Tilahun, S.A.; Adgo, E.; Steenhuis, T.S. Long-Term Landscape Changes in the Lake Tana Basin as Evidenced by Delta Development and Floodplain Aggradation in Ethiopia. Land Degrad. Dev. 2017, 28, 1820–1830. [Google Scholar] [CrossRef]
- Abate, M.; Nyssen, J.; Steenhuis, T.S.; Moges, M.M.; Tilahun, S.A.; Enku, T.; Adgo, E. Morphological changes of Gumara River channel over 50 years, upper Blue Nile basin, Ethiopia. J. Hydrol. 2015, 525, 152–164. [Google Scholar] [CrossRef]
- Zegeye, A.D.; Langendoen, E.J.; Guzman, C.D.; Dagnew, D.C.; Amare, S.D.; Tilahun, S.A.; Steenhuis, T.S. Gullies, a critical link in landscape soil loss: A case study in the subhumid highlands of Ethiopia. Land Degrad. Dev. 2018, 29, 1222–1232. [Google Scholar] [CrossRef]
- Zegeye, A.D.; Langendoen, E.J.; Stoof, C.R.; Tilahun, S.A.; Dagnew, D.C.; Zimale, F.A.; Guzman, C.D.; Yitaferu, B.; Steenhuis, T.S. Morphological dynamics of gully systems in the subhumid Ethiopian Highlands: The Debre Mawi watershed. Soil 2016, 2, 443–458. [Google Scholar] [CrossRef] [Green Version]
- Abebe, W.B.; Tilahun, S.A.; Moges, M.M.; Wondie, A.; Derseh, M.G.; Nigatu, T.A.; Mhiret, D.A.; Steenhuis, T.S.; Camp, M.V.; Walraevens, K. Hydrological foundation as a basis for a holistic environmental flow assessment of tropical highland rivers in ethiopia. Water 2020, 12, 547. [Google Scholar] [CrossRef] [Green Version]
- Nieber, J.L.; Sidle, R.C. How do disconnected macropores in sloping soils facilitate preferential flow? Hydrol. Process. 2010, 24, 1582–1594. [Google Scholar] [CrossRef]
- Wilson, G.V.; Nieber, J.L.; Sidle, R.C.; Fox, G.A. Internal erosion during soil pipeflow: State of the science for experimental and numerical analysis. Trans. ASABE 2013, 56, 465–478. [Google Scholar] [CrossRef]
- Adem, A.A.; Gashaw, A.; Aynalem, D.W.; Tilahun, S.A.; Mekuria, W.; Azeze, M.; Steenhuis, T.S. Hydrogeology of Volcanic Highlands Affect Prioritization of Land Management Practices. Water 2020, 12, 2702. [Google Scholar] [CrossRef]
- Adem, A.A.; Aynalem, D.W.; Tilahun, S.A.; Mekuria, W.; Azeze, M.; Steenhuis, T.S. Runoff response and the associated soil and nutrient loss in two northwestern Ethiopian highland watersheds. In Proceedings of the International Conference on the Advancement of Science and Technology (ICAST-CWRE-2017), Bahar Dar, Ethiopia, May 2017; pp. 30–35. [Google Scholar]
- Addisie, M.B.; Ayele, G.K.; Gessess, A.A.; Tilahun, S.A.; Zegeye, A.D.; Moges, M.M.; Schmitter, P.; Langendoen, E.J.; Steenhuis, T.S. Gully head retreat in the sub-humid Ethiopian Highlands: The Ene-Chilala catchment. Land Degrad. Dev. 2017, 28, 1579–1588. [Google Scholar] [CrossRef]
- Demlie, M.; Ayenew, T.; Wohnlich, S. Comprehensive hydrological and hydrogeological study of topographically closed lakes in highland Ethiopia: The case of Hayq and Ardibo. J. Hydrol. 2007, 339, 145–158. [Google Scholar] [CrossRef]
- Kebede, S.; Zewdu, S. Use of Rn-222 and delta O-18-delta H-2 isotopes in detecting the origin of water and in quantifying groundwater inflow rates in an alarmingly growing lake, ethiopia. Water 2019, 11, 2591. [Google Scholar] [CrossRef] [Green Version]
- Hirayama, Y.; Okawa, A.; Nakamachi, K.; Aoyama, T.; Okada, Y.; Oi, T.; Hirose, K.; Kikawada, Y. Estimation of water seepage rate in the active crater lake system of Kusatsu-Shirane volcano, Japan, using FDNPP-derived radioactive cesium as a hydrological trace. J. Environ. Radioact. 2020, 218, 106257. [Google Scholar] [CrossRef]
- Ozyavas, A.; Khan, S.D. The driving forces behind the Caspian Sea mean water level oscillations. Environ. Earth Sci. 2012, 65, 1821–1830. [Google Scholar] [CrossRef]
- Web of Science. Web of Science Core Collection Clarivate. Available online: https://clarivate.com/webofsciencegroup/solutions/webofscience-platform/ (accessed on 27 September 2020).
- Lamb, H.F.; Bates, C.R.; Bryant, C.L.; Davies, S.J.; Marshall, M.H.; Huws, D.G.; Roberts, H.M.; Toland, H. 150,000-year palaeoclimate record from northern Ethiopia supports early, multiple dispersals of modern humans from Africa. Sci. Rep. 2018, 8, 1077. [Google Scholar] [CrossRef] [PubMed] [Green Version]
Figure 1.
Maps of (a) Ethiopia with the Lake Tana basin in yellow; (b) Blue Nile basin with the Lake Tana basin in yellow and Lake Tana in blue; and (c) elevation map of the Lake Tana basin with two lake rainfall measuring stations, 13 rain land based stations within the Lake Tana basin.
Figure 1.
Maps of (a) Ethiopia with the Lake Tana basin in yellow; (b) Blue Nile basin with the Lake Tana basin in yellow and Lake Tana in blue; and (c) elevation map of the Lake Tana basin with two lake rainfall measuring stations, 13 rain land based stations within the Lake Tana basin.

Figure 2.
Flow diagram representing the computational methods.

Figure 3.
Thiessen polygon for rainfall stations around Lake Tana: (a) land-based rainfall (seven land based stations, (b) lake + land-based (six land stations and two lake stations—Dek Island and Jigrfa).
Figure 3.
Thiessen polygon for rainfall stations around Lake Tana: (a) land-based rainfall (seven land based stations, (b) lake + land-based (six land stations and two lake stations—Dek Island and Jigrfa).

Figure 4.
Long term average monthly rainfall for 1990–2014 of the eight stations used in calculating the precipitation for Lake Tana.
Figure 4.
Long term average monthly rainfall for 1990–2014 of the eight stations used in calculating the precipitation for Lake Tana.

Figure 5.
Monthly precipitation for Lake Tana for six land-based weather stations and eight “lake + land”-based weather stations consisting of the Jigrfa station on the east shore and a station on Dek island plus six land-based stations. Figure 3 shows the location of the rainfall stations.
Figure 5.
Monthly precipitation for Lake Tana for six land-based weather stations and eight “lake + land”-based weather stations consisting of the Jigrfa station on the east shore and a station on Dek island plus six land-based stations. Figure 3 shows the location of the rainfall stations.

Figure 6.
Observed and adjusted satellite lake levels [48] and observed and adjusted outflow from the Lake Tana.
Figure 6.
Observed and adjusted satellite lake levels [48] and observed and adjusted outflow from the Lake Tana.

Figure 7.
Observed monthly gauged flow of the four major rivers and rate of inflow and losses of Lake Tana calculated with Equation (6) using three evaporation rates 1426, 1650, and 1789 mm a−1.
Figure 7.
Observed monthly gauged flow of the four major rivers and rate of inflow and losses of Lake Tana calculated with Equation (6) using three evaporation rates 1426, 1650, and 1789 mm a−1.

Figure 8.
Regression of lake inflow and losses with the discharge of the four gauged watersheds -Gilgel Abay, Gumara, Rib, and Megech for precipitation based on land-based rain gauges (a,c,e) and lake + land-based rain gauge (b,d,f) and lake evaporation rates of 1426 mm a−1 (a,b); 1650 mm a−1 (c,d) and 1789 mm a−1 (e,f).

Figure 9.
Inflows and water losses of Lake Tana and the surroundings determined with the water balance and predicted with the regression equation for land-based and lake + land-based for three evaporation rates (a) 1426 mm a−1; (b)1650 mm a−1; and (c)1789 mm a−1.
Figure 9.
Inflows and water losses of Lake Tana and the surroundings determined with the water balance and predicted with the regression equation for land-based and lake + land-based for three evaporation rates (a) 1426 mm a−1; (b)1650 mm a−1; and (c)1789 mm a−1.

Figure 10.
Regression of monthly gauged discharge vs. the simulated inflow of lake Tana for the four major rivers basins. The data (blue open circles) are taken from [44]. The best-fit line is orange.
Figure 10.
Regression of monthly gauged discharge vs. the simulated inflow of lake Tana for the four major rivers basins. The data (blue open circles) are taken from [44]. The best-fit line is orange.

Figure 11.
Water-level predictions (yellow dots) for Lake Tana for an evaporation rate of 1650 mm a−1; (a) rainfall based on land-based rainfall stations; (b) rainfall partly based on the lake and the land + lake-based rainfall stations. The blue line is the observed lake water level.
Figure 11.
Water-level predictions (yellow dots) for Lake Tana for an evaporation rate of 1650 mm a−1; (a) rainfall based on land-based rainfall stations; (b) rainfall partly based on the lake and the land + lake-based rainfall stations. The blue line is the observed lake water level.

Figure 12.
Water balance for Lake Tana for (a) land-based precipitation; (b) lake and land-based precipitation. See Figure 3 for the location for the locations of the stations. Table A1 lists the numerical values for each component of the water balance.

Table 1.
A review of the previous studies on Lake Tana water balance components.
| Study Period | Evaporation mm a−1 | Precipitation mm a−1 | Inflow mm a−1 | Outflow mm a−1 | Loss mm a−1 | Remarks | ||
|---|---|---|---|---|---|---|---|---|
| Start | End | |||||||
| Conway [19] | 1921 | 1931 | 1236 | |||||
| Sutcliffe et al. [20] | 1921 | 1933 | 1207 | |||||
| Kebede et al. [7] | 1960 | 1992 | 1478 | 1451 | 1162 | 1113 | 22 | |
| Aragie [20] | 1964 | 2000 | 2634 | 1224 | 2594 | 1184 | 0 | SCS CN |
| Pelgrum et al. [22] | 2001 | 1588 | 1541 | 1616 | 1499 | 70 | satellite | |
| SMEC [8] | 1960 | 1995 | 1650 | 1260 | 1622 | 1231 | 1 | fitted |
| Gieske et al. [23] | 1992 | 2003 | 1671 | 1255 | 1770 | 1348 | 19 | fitted |
| Wale et al. [24] | 1992 | 2003 | 1690 | 1220 | 2160 | 1520 | 170 | HBV |
| Chebud et al. [25] | 1960 | 2003 | 1428 | 1198 | 1458 | 1679 | −451 | |
| Setegn et al. [26] | 1978 | 2004 | 1248 | 1375 | 1312 | 1280 | 159 | SWAT |
| Rientjes et al. [27] | 1994 | 2003 | 1563 | 1347 | 1781 | 1480 | 85 | Satellite |
| Tegegne et al. [28] | 1996 | 2002 | 1618 | 1291 | 2119 | 1725 | 67 | SWAT |
| Nigatu [29] | 1994 | 2003 | 2041 | 1274 | 2186 | 1520 | −101 | baseline |
| Duan et al. [30] | 2006 | 1688 | 1652 | 2226 | 1566 | 191 | TRMM | |
| Dessie et al. [31], scenario 1 | 2012 | 2013 | 1789 | 1330 | 2349 | 1618 | 273 | observed |
| Dessie et al. [31], scenario 2 | 2012 | 2013 | 1789 | 1330 | 2201 | 1618 | 125 | adjusted |
| Kebede et al. [32] | n.a.* | 1600 | 1216 | 1715 | 1172 | 147 | Isotopes | |
| Mamo et al. [33] | 1995 | 2005 | 1544 | 1315 | 2829 | 1552 | 945 | Isotopes |
* not available.
Table 2.
The watershed areas of the four main rivers in the Lake Tana basin for the upper gauged part and the lower ungauged part, the area for the remaining ungauged watersheds that are drained by smaller rivers and area of Lake Tana.
Table 2.
The watershed areas of the four main rivers in the Lake Tana basin for the upper gauged part and the lower ungauged part, the area for the remaining ungauged watersheds that are drained by smaller rivers and area of Lake Tana.
| No | Area (km2) | |||
|---|---|---|---|---|
| Gauged | Ungauged | Total | ||
| 1 | Gilgel Abay | 1656 | 2065 | 3721 |
| 2 | Gumara | 1283 | 485 | 1768 |
| 3 | Rib | 1303 | 711 | 2014 |
| 4 | Megech | 514 | 476 | 990 |
| 5 | Remaining watersheds | 3529 | 3529 | |
| 6 | Lake | 3060 | ||
| Total | 4756 | 7266 | 15,082 | |
Table 3.
Hydrometeorological input data, source, and time duration.
| Data | Period | Source |
|---|---|---|
| Climate data | 1990–2014 | Eth. National Meteorological Agency |
| Lake rainfall | 2013 and 2014 | Observed by the first author |
| CHIRPS-v2 rainfall | 1990–2014 | Climate Hazards Group Infrared Precipitation Version two |
| Gauged streamflow | 1990–2014 | Eth. Ministry of Water Irrigation and Energy |
| Ungauged Simulated streamflow | 1994–2012 | Literature |
| Outflow from the Lake | 1990–2014 | Eth. Ministry of Water Irrigation and Energy |
| Lake Evaporation | 1960–2006 | Literature |
| Lake level | 1990–2014 | Eth. Ministry of Water Irrigation and Energy |
| Lake level | 1992–2020 | Hydroweb (website) |
Table 4.
Regionalization factor α (defined at the ratio of runoff per unit area of the ungauged watershed and the gauged watershed in the Lake Tana basin and the unaccounted loss of water in the Lake and surrounding areas for three time periods).
Table 4.
Regionalization factor α (defined at the ratio of runoff per unit area of the ungauged watershed and the gauged watershed in the Lake Tana basin and the unaccounted loss of water in the Lake and surrounding areas for three time periods).
| Land-Based | Lake + Land-Based | |||||||
|---|---|---|---|---|---|---|---|---|
| Evaporation (mm a−1) | 1426 | 1650 | 1789 | 1426 | 1650 | 1789 | ||
| 1990–1995 | reg. factor α | 0.50 | 0.50 | 0.49 | 0.48 | 0.47 | 0.46 | |
| water loss | km3 a−1 | 1.32 | 0.60 | 0.12 | 1.44 | 0.72 | 0.24 | |
| 1996–2002 | reg. factor α | 0.61 | 0.61 | 0.60 | 0.56 | 0.56 | 0.55 | |
| water loss | km3 a−1 | 1.92 | 1.08 | 0.72 | 1.92 | 1.20 | 0.72 | |
| 2003–2007 | reg. factor α | 0.71 | 0.70 | 0.69 | 0.69 | 0.69 | 0.68 | |
| water loss | km3 a−1 | 3.00 | 2.28 | 1.80 | 3.00 | 2.28 | 1.80 | |
© 2020 by the authors. Licensee MDPI, Basel, Switzerland. This article is an open access article distributed under the terms and conditions of the Creative Commons Attribution (CC BY) license (http://creativecommons.org/licenses/by/4.0/).
Share and Cite
MDPI and ACS Style
Alemu, M.L.; Worqlul, A.W.; Zimale, F.A.; Tilahun, S.A.; Steenhuis, T.S. Water Balance for a Tropical Lake in the Volcanic Highlands: Lake Tana, Ethiopia. Water 2020, 12, 2737. https://doi.org/10.3390/w12102737
AMA Style
Alemu ML, Worqlul AW, Zimale FA, Tilahun SA, Steenhuis TS. Water Balance for a Tropical Lake in the Volcanic Highlands: Lake Tana, Ethiopia. Water. 2020; 12(10):2737. https://doi.org/10.3390/w12102737
Chicago/Turabian StyleAlemu, Muluken L., Abeyou W. Worqlul, Fasikaw A. Zimale, Seifu A. Tilahun, and Tammo S. Steenhuis. 2020. "Water Balance for a Tropical Lake in the Volcanic Highlands: Lake Tana, Ethiopia" Water 12, no. 10: 2737. https://doi.org/10.3390/w12102737
Note that from the first issue of 2016, this journal uses article numbers instead of page numbers. See further details here.