A Modified HYDRUS Model for Simulating PFAS Transport in the Vadose Zone


1
Arclight Research & Consulting, LLC, Golden, CO 80401, USA
2
Department of Environmental Sciences, University of California, Riverside, CA 92521, USA
3
Civil & Environmental Engineering Department, Hydrologic Science and Engineering Program, Hydrologic Science & Engineering Program, ReNuWit—The Urban Water Engineering Research Center, Colorado School of Mines, Golden, CO 80401, USA
*
Author to whom correspondence should be addressed.
Water 2020, 12(10), 2758; https://doi.org/10.3390/w12102758
Submission received: 26 August 2020
/
Revised: 28 September 2020
/
Accepted: 29 September 2020
/
Published: 3 October 2020
(This article belongs to the Special Issue Contaminant Transport and Fate)
Abstract
:The HYDRUS unsaturated flow and transport model was modified to simulate the effects of non-linear air-water interfacial (AWI) adsorption, solution surface tension-induced flow, and variable solution viscosity on the unsaturated transport of per- and polyfluoroalkyl substances (PFAS) within the vadose zone. These modifications were made and completed between March 2019 and May 2019, and were implemented into both the one-dimensional (1D) and two-dimensional (2D) versions of HYDRUS. Herein, the model modifications are described and validated against the available literature-derived PFAS transport data (i.e., 1D experimental column transport data). The results of both 1D and 2D example simulations are presented to highlight the function and utility of the model to capture the dynamic and transient nature of the temporally and spatially variable interfacial area of the AWI () as it changes with soil moisture content () and how it affects PFAS unsaturated transport. Specifically, the simulated examples show that while AWI adsorption of PFAS can be a significant source of retention within the vadose zone, it is not always the dominant source of retention. The contribution of solid-phase sorption can be considerable in many PFAS-contaminated vadose zones. How the selection of an appropriate function can impact PFAS transport and how both mechanisms contribute to PFAS mass flux to an underlying groundwater source is also demonstrated. Finally, the effects of soil textural heterogeneities on PFAS unsaturated transport are demonstrated in the results of both 1D and 2D example simulations.
1. Introduction
This paper presents a robust vadose-zone numerical model that can simulate the transport and reactions of per- and polyfluoroalkyl substances (PFAS) under dynamic vadose zone conditions. Such modeling is useful for the characterization of PFAS fate and for implementing vadose zone and groundwater remedial activities. The underlying model is the popular HYDRUS code [1], and the PFAS modifications were developed as part of a U.S. Department of Defense-funded research project [2]. PFAS are a group of emerging environmental contaminants that have become ubiquitous in the environment [3,4,5,6]. When released at the ground surface, PFAS will percolate into and accumulate within the surficial soils and the underlying vadose zone. There are a number of recent field investigations that have shown that the vadose zone can serve as a long-term sink for PFAS and a long-term source of contamination to underlying groundwater resources [7,8,9,10,11]. Whether by the historic use of PFAS-containing aqueous film-forming foams (AFFF) for fire suppression, leaching from unlined landfills, or leaching from biosolids applied to agricultural or reclaimed land, PFAS contaminants entering the soil environment will first need to transport through a vadose zone before contacting the groundwater. Therefore, it is important to understand and characterize the mechanisms of PFAS transport in the vadose zone to better assess the fate of PFAS released to the subsurface. It is also important to include these mechanisms in unsaturated flow and transport models to better assist risk-assessment and future remedial investigations and remedial actions.
Many PFAS of specific environmental concern are surface-active agents (or surfactants), with their molecular structure consisting of both an ionic hydrophilic moiety (i.e., tail-group or hydrophile) and hydrophobic moiety (i.e., head-group or hydrophobe). As surfactants, these chemicals will seek out and accumulate at environmental interfaces. When released into the soil environment, the primary interfaces in play include air–water interfaces (AWI) within the water-unsaturated soil matrix and soil–water interfaces where PFAS can additionally associate with the solid phase. At firefighting training sites where AFFF solutions were applied, entrapped residual fuels and solvents within the vadose zone environment can provide an additional interface for PFAS accumulation. Here, we limit our presentation to soil and AWI adsorption as primary uptake and retention processes.
Research has shown that PFAS adsorption to natural soils and sediments can occur as a result of both hydrophobic and electrostatic processes [12,13,14,15,16,17,18,19,20,21]. Generally, in soils with greater organic carbon fraction (foc), sorption appears to be governed by hydrophobic interactions, particularly for PFAS with larger hydrophobe size or molar volumes [15,16,19]. Electrostatic contributions to sorption within natural geomedia are generally more important for cationic and zwitterionic PFAS [21], but are generally less significant for anionic PFAS [18]. However, electrostatic contributions to sorption on mineral surfaces can also change depending on changes in solution and surface chemistry [13,14,20]. PFAS sorption can be both non-linear and rate-limiting, further complicating the overall sorptive process and, ultimately, the retention of these compounds during transport in the vadose zone.
Recent research has demonstrated that AWI adsorption can be a significant source of retention for PFAS during unsaturated transport [2,22,23,24,25,26,27]. The degree of retention in the vadose zone is, in part, dependent on the specific surface activity of the PFAS, which generally increases with the size of the PFAS hydrophobe and the structure of the hydrophile (e.g., carboxylate vs. sulfonate) [2,23,25,26,28]. The degree of PFAS retention is also dependent on the area of the AWI () within the vadose zone soil matrix, which is, in turn, dependent on the soil moisture content () [2,22,23,24,25]. PFAS retention increases as decreases (i.e., in response to an increasing ). One can then imagine the degree of variability in adsorption and retention that can occur when PFAS is present in the vadose zone during natural cycles of moisture infiltration, drainage, and evapotranspiration. Moisture contents, and therefore , are also dependent on soil texture (i.e., percentages of clay, silt, and sand particles) and soil hydraulic properties, which further complicates PFAS unsaturated transport for texturally heterogeneous vadose zones. AWI adsorption is concentration-dependent and non-linear with increasing concentration. As a result, PFAS retardation during transport will decrease with increasing pore-water concentration, owing to the change in slope of the AWI adsorption isotherms for these compounds [2,23,25,27]. AWI adsorption and retention is also dependent on the ionic strength of the pore-water [2,24,25,27]. Additional complexities for AWI adsorption of PFAS have been identified and are currently being characterized, including potential kinetic limitations and non-ideal competitive/preferential adsorption processes when PFAS are present as complex mixtures [29].
Given that PFAS transport in the vadose zone is dependent on a number of inter-related and non-linear interphase mass transfer processes, it has become clear that the analytical models used to describe PFAS transport based on calculated retardation factors have limited utility for actual site applications. Here, we demonstrate the utility of the HYDRUS unsaturated flow and solute transport simulator that was recently modified to include the transport of PFAS in the vadose zone [2]. Modifications were made to the one-dimensional (1D) and two-dimensional (2D) versions of HYDRUS. HYDRUS was modified to include air–water interfacial adsorption as a source of retention during transient variably saturated flow, but also retains its original capabilities with regard to simulating the effects of solid-phase sorption (i.e., linear and non-linear sorption models) as a concurrent source of PFAS retention. The modified model also retains its original nonequilibrium contaminant flow and transport capabilities (e.g., mobile/immobile water, dual-porosity models, and dual-permeability models) and soil sorption kinetics modeling capabilities (e.g., one- and two-site kinetics and two-site sorption models). Another model was presented in the very recent literature [30] that includes the same important PFAS transport mechanisms presented by [2]. However, the modified HYDRUS model presented in this paper, which was completed in May 2019 and first reported in July 2019 [2], has the additional ability to simulate scenarios of PFAS transport that are important for actual site evaluations (e.g., complex spatially variable source term/strength scenarios, structured and texturally heterogenous flow and transport domains, 2D representations).
2. Materials and Methods (Numerical Model Modifications)
2.1. Implementing AWI Adsorption
The partial differential equation governing the 1D nonequilibrium transport of PFAS during transient water flow in a variably saturated rigid porous medium is as follows
where , and are the solute concentrations in the liquid (ML−3), solid (MM−1), and AWI (M L−2) phases, respectively: is the water content (-), is the soil bulk density (ML−3), is the area of the AWI (L2L−3), is the dispersion coefficient (L2T−1) for the liquid phase, is the volumetric flux density (LT−1), and S is a term representing various reactions possible within HYDRUS, such as solute degradation and root uptake of solute. HYDRUS assumes a equilibrium or nonequilibrium interaction between the solution () and sorbed () concentrations, and equilibrium interaction between the solution () and AWI () concentrations of the solute in the soil system. The adsorption isotherm relating and is described by a generalized nonlinear equation of the form
where (for linear sorption, L3M1, for Freundlich sorption L3𝛽M−𝛽), 𝛽(-) and 𝜂 (for non-Freundlich sorption L3M−1, for Freundlich sorption L3𝛽M−𝛽) are empirical coefficients. The Freundlich, Langmuir, and linear adsorption equations are special cases of (3).
The dependence of the interfacial adsorbed concentration (, ML−2) on the solution concentration (, ML−3) is modeled using the Langmuir adsorption isotherm
where is the maximum surface concentration (i.e., at the solubility limit) (ML−2), is the Langmuir coefficient (L3M−1) for AWI adsorption. Note that the second term in (5) is present only if can vary in time, such as when it depends on temperature or ionic strength. AWI adsorption is considered instantaneous and reversible, in keeping with the assumptions of the Langmuir isotherm equation. However, alternative models are being considered for implementation, including surface adsorption kinetic models for the AWI adsorption of PFAS when present as complex mixtures.
The dependence of on is calculated directly from the soil–water retention curves (SWRC) using the approach described by [31,32] as
where is the capillary pressure (ML−1T−2), is the air–water surface tension (MT−2), is the saturated water content (-), is the density of water (ML−3), is the gravitational acceleration (LT−2), and is the pressure head (L). The magnitude of increases with decreasing and approaches the geometric surface area of the porous media as approaches .
2.2. Surface Tension-Driven Flow
At elevated concentrations, surface tension reduction due to the AWI adsorption of surface-active contaminants can reduce solution surface tension and contribute to the unsaturated flow of water and transport of contaminants in the vadose zone. The primary impact of surface-active solutes on unsaturated water flow is through the dependence of h on surface tension [33]
where is the contact angle (-), is the surface tension (MT−2), is the solution density (ML−3), g is the gravitational acceleration (LT−2), and r is the equivalent circular pore radius (L). The Langmuir-Szyskowski equation is used to model the dependence of surface tension on solute concentration [34,35]
where a (ML−3) and b (-) are constants determined by fitting (9) to measured surface tension isotherms for the compound of interest and is the surface tension at concentration . The van Genuchten (VG) equation for the soil water retention curve in terms of the capillary pressure is [36]
where S is the effective saturation (-), and a (L−1), n (-), and m (-) are empirical VG parameters. The capillary pressure of the target liquid is then scaled by as
where is the pressure head scaling factor. It is important to note that the concentration of the surface-active solute needs to be great enough to cause a sufficient reduction in surface tension to cause changes in capillary pressure gradients to initiate surface-tension-driven flow. For PFAS of current environmental significance, solution concentrations in excess of 10 mg/L are generally needed before the effects of surface tension on unsaturated flow would be noticeably contributive. AFFF solution concentrations of just 50 mg/L or greater are needed for tension flow effects to contribute to infiltration of AFFF solutions [2].
HYDRUS was also modified to account for changes in solution viscosity as a function of solute concentration. This modification was made to support simulating AFFF solutions following soil surface application during fire training activities. The viscosity of these solutions can be greater than that of water, which will reduce unsaturated hydraulic conductivities during infiltration within the vadose zone. Validating model predictions of the effects of tension-driven flow and changes in viscosity await the results of physical transport experiments that has been proposed as a part of future research. Here, we limit our presentation to PFAS transport for solution concentrations in which the effects of surface tension and viscosity are negligible.
3. Results and Discussion
3.1. Model Validation
Validating the HYDRUS model modifications requires experimental data with which to compare model predictions. Further, the experimental dataset should be representative of the scale of interest and test the same transport-dependent variables used by the model to provide additional confidence in the model predictions. At present, there is a limited number of published unsaturated transport data for PFAS that could be used to validate the performance of the modified model [23,24,37]. Only Lyu et al. [23] provide experimental results (i.e., transport breakthrough profiles) for 1D unsaturated transport PFAS where both and were experimental variables, with perfluorooctanoic acid (PFOA) as the representative PFAS. Therefore, the data presented by Lyu et al. [23] were selected to validate our model modifications at the 1D column-scale. Relevant experimental parameters derived from Lyu et al. [23] are provided in Table 1.
3.1.1. Dependence on PFOA Unsaturated Transport
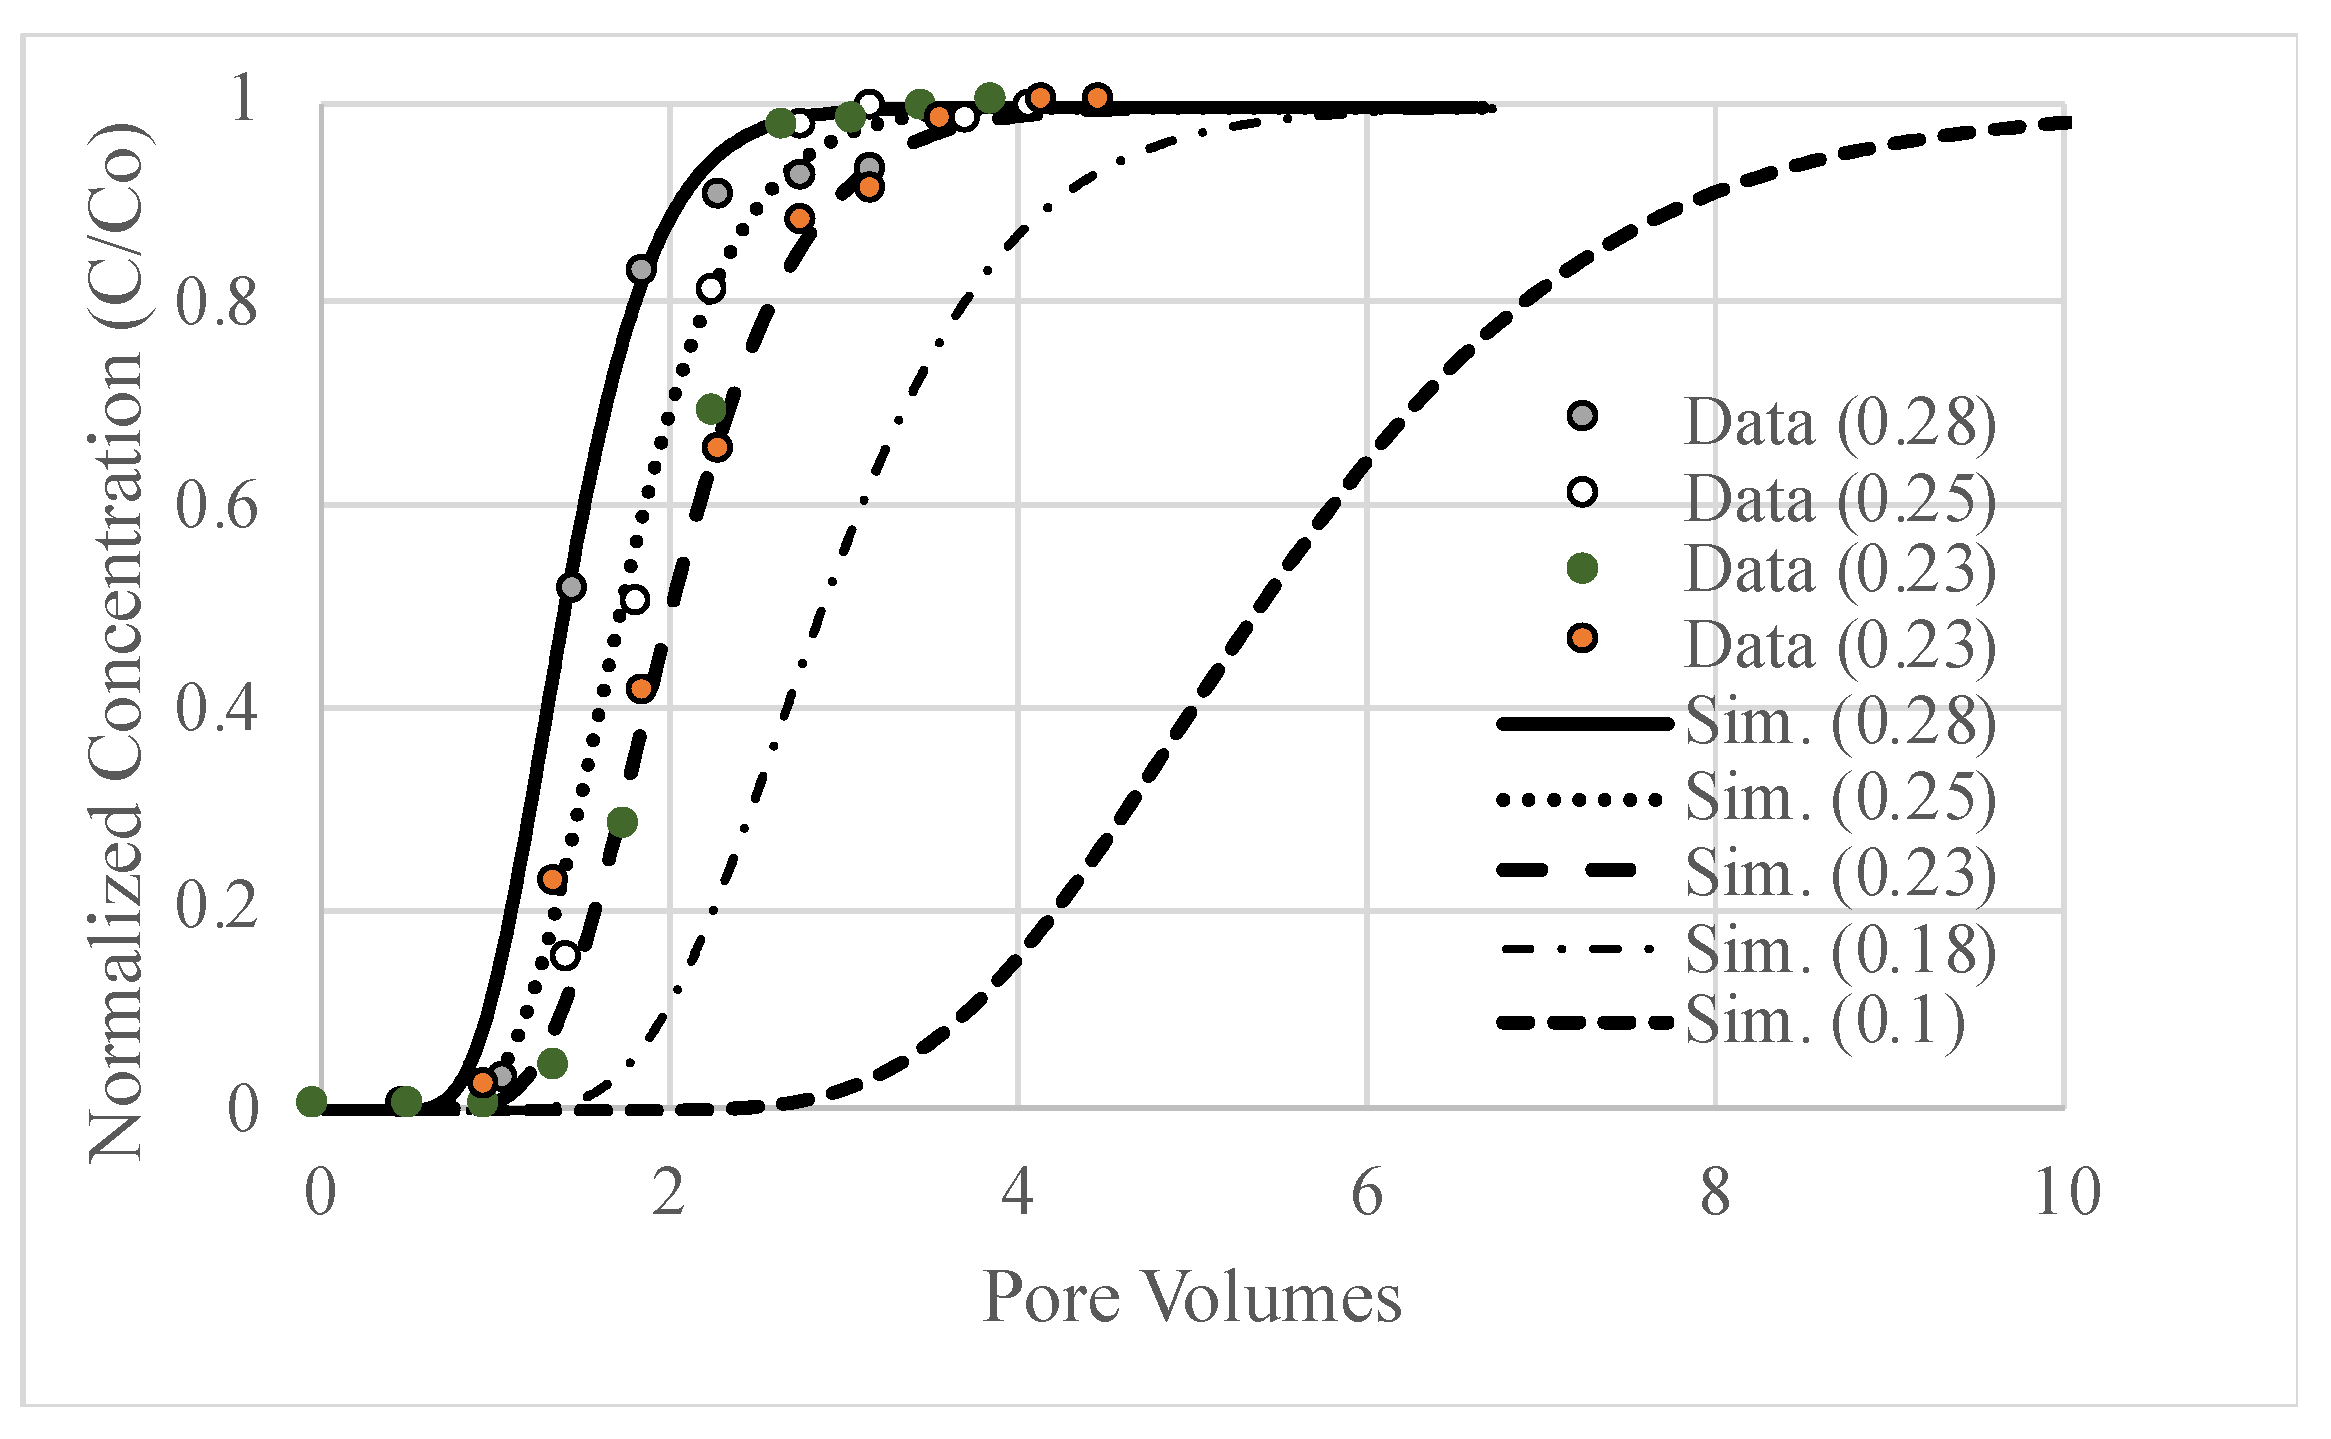
During unsaturated flow and transport, PFAS retention is inversely dependent on changes in and directly dependent on the magnitude of . The Lyu et al. [23] dataset provides 1D breakthrough curve results for PFAS transport in a model quartz sand at three different values (i.e., 0.28, 0.25 and 0.23). Each vertical column experiment was performed at a constant and flow rate.
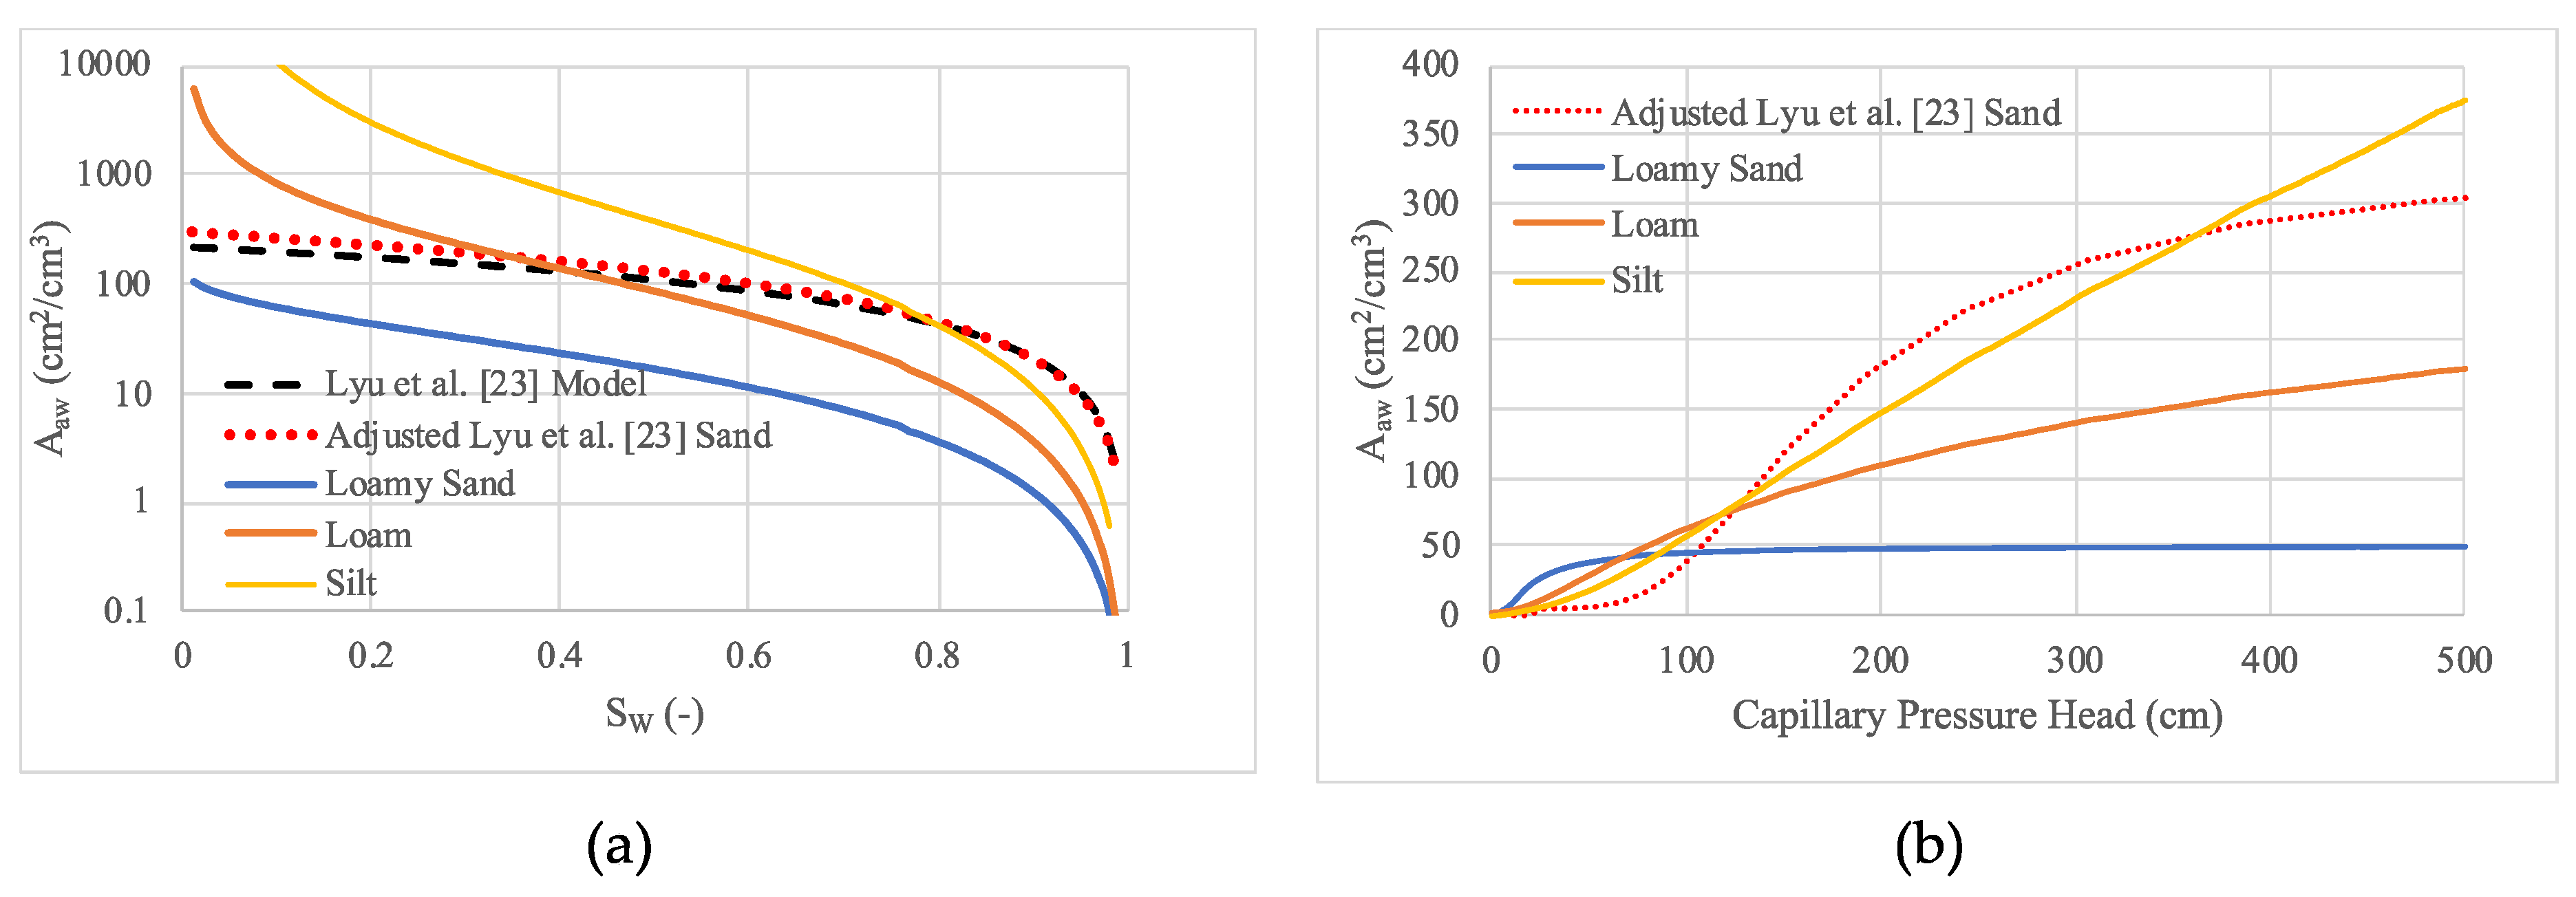
The simulations were performed for a constant upper and lower flow boundary conditions, and a concentration flux and zero-concentration gradient as upper and lower transport boundary conditions, respectively. Lyu et al. [23] described the dependence for the test sand using the following linear relationship: , where is the assigned maximum value for the 0.35 mm sand (i.e., 216 cm2/cm3) used in this comparison, and is the water saturation (i.e., ). To match this linear dependence with our model, the VG equation parameters (specifically and ) were adjusted. Likewise, the saturated hydraulic conductivity () was adjusted to match the water flux used in the experiment. The resulting function for the linear model is provided in Figure 1.
The use of the linear relationship provided by Lyu et al. [23] resulted in a slight underprediction of the experimental breakthrough profiles (data not shown) that increased with decreasing . To compensate, and values in the VG model were adjusted until predicted breakthrough profiles matched the experimental data for the = 0.28 dataset ( = 0.008 cm−1; = 3.2, which, combined with the VG equation parameters in Table 1, provides the relationship shown in Figure 1). Thereafter, the VG parameters were not altered for simulations at the remaining conditions. As shown in Figure 2, the simulated results matched the experimental data quite well for all moisture conditions considered. The odd tailing observed in the = 0.28 dataset is most likely the result of some kind of measurement error, as this did not occur at the other moisture conditions. Simulated breakthrough profiles for lower soil moisture contents are also provided in Figure 2. These results indicate that the simulator is appropriately representing the soil moisture dependence on the retention of PFOA observed for these column tests. The increased retention reflects the increase in interfacial area with decreasing soil moisture, consistent with the moisture-dependence model used. The increased dispersion observed with decreasing moisture reflects the effects of the 0.7 cm value for longitudinal dispersivity that was determined by fitting the higher moisture cases.
3.1.2. Dependence on PFOA Unsaturated Transport
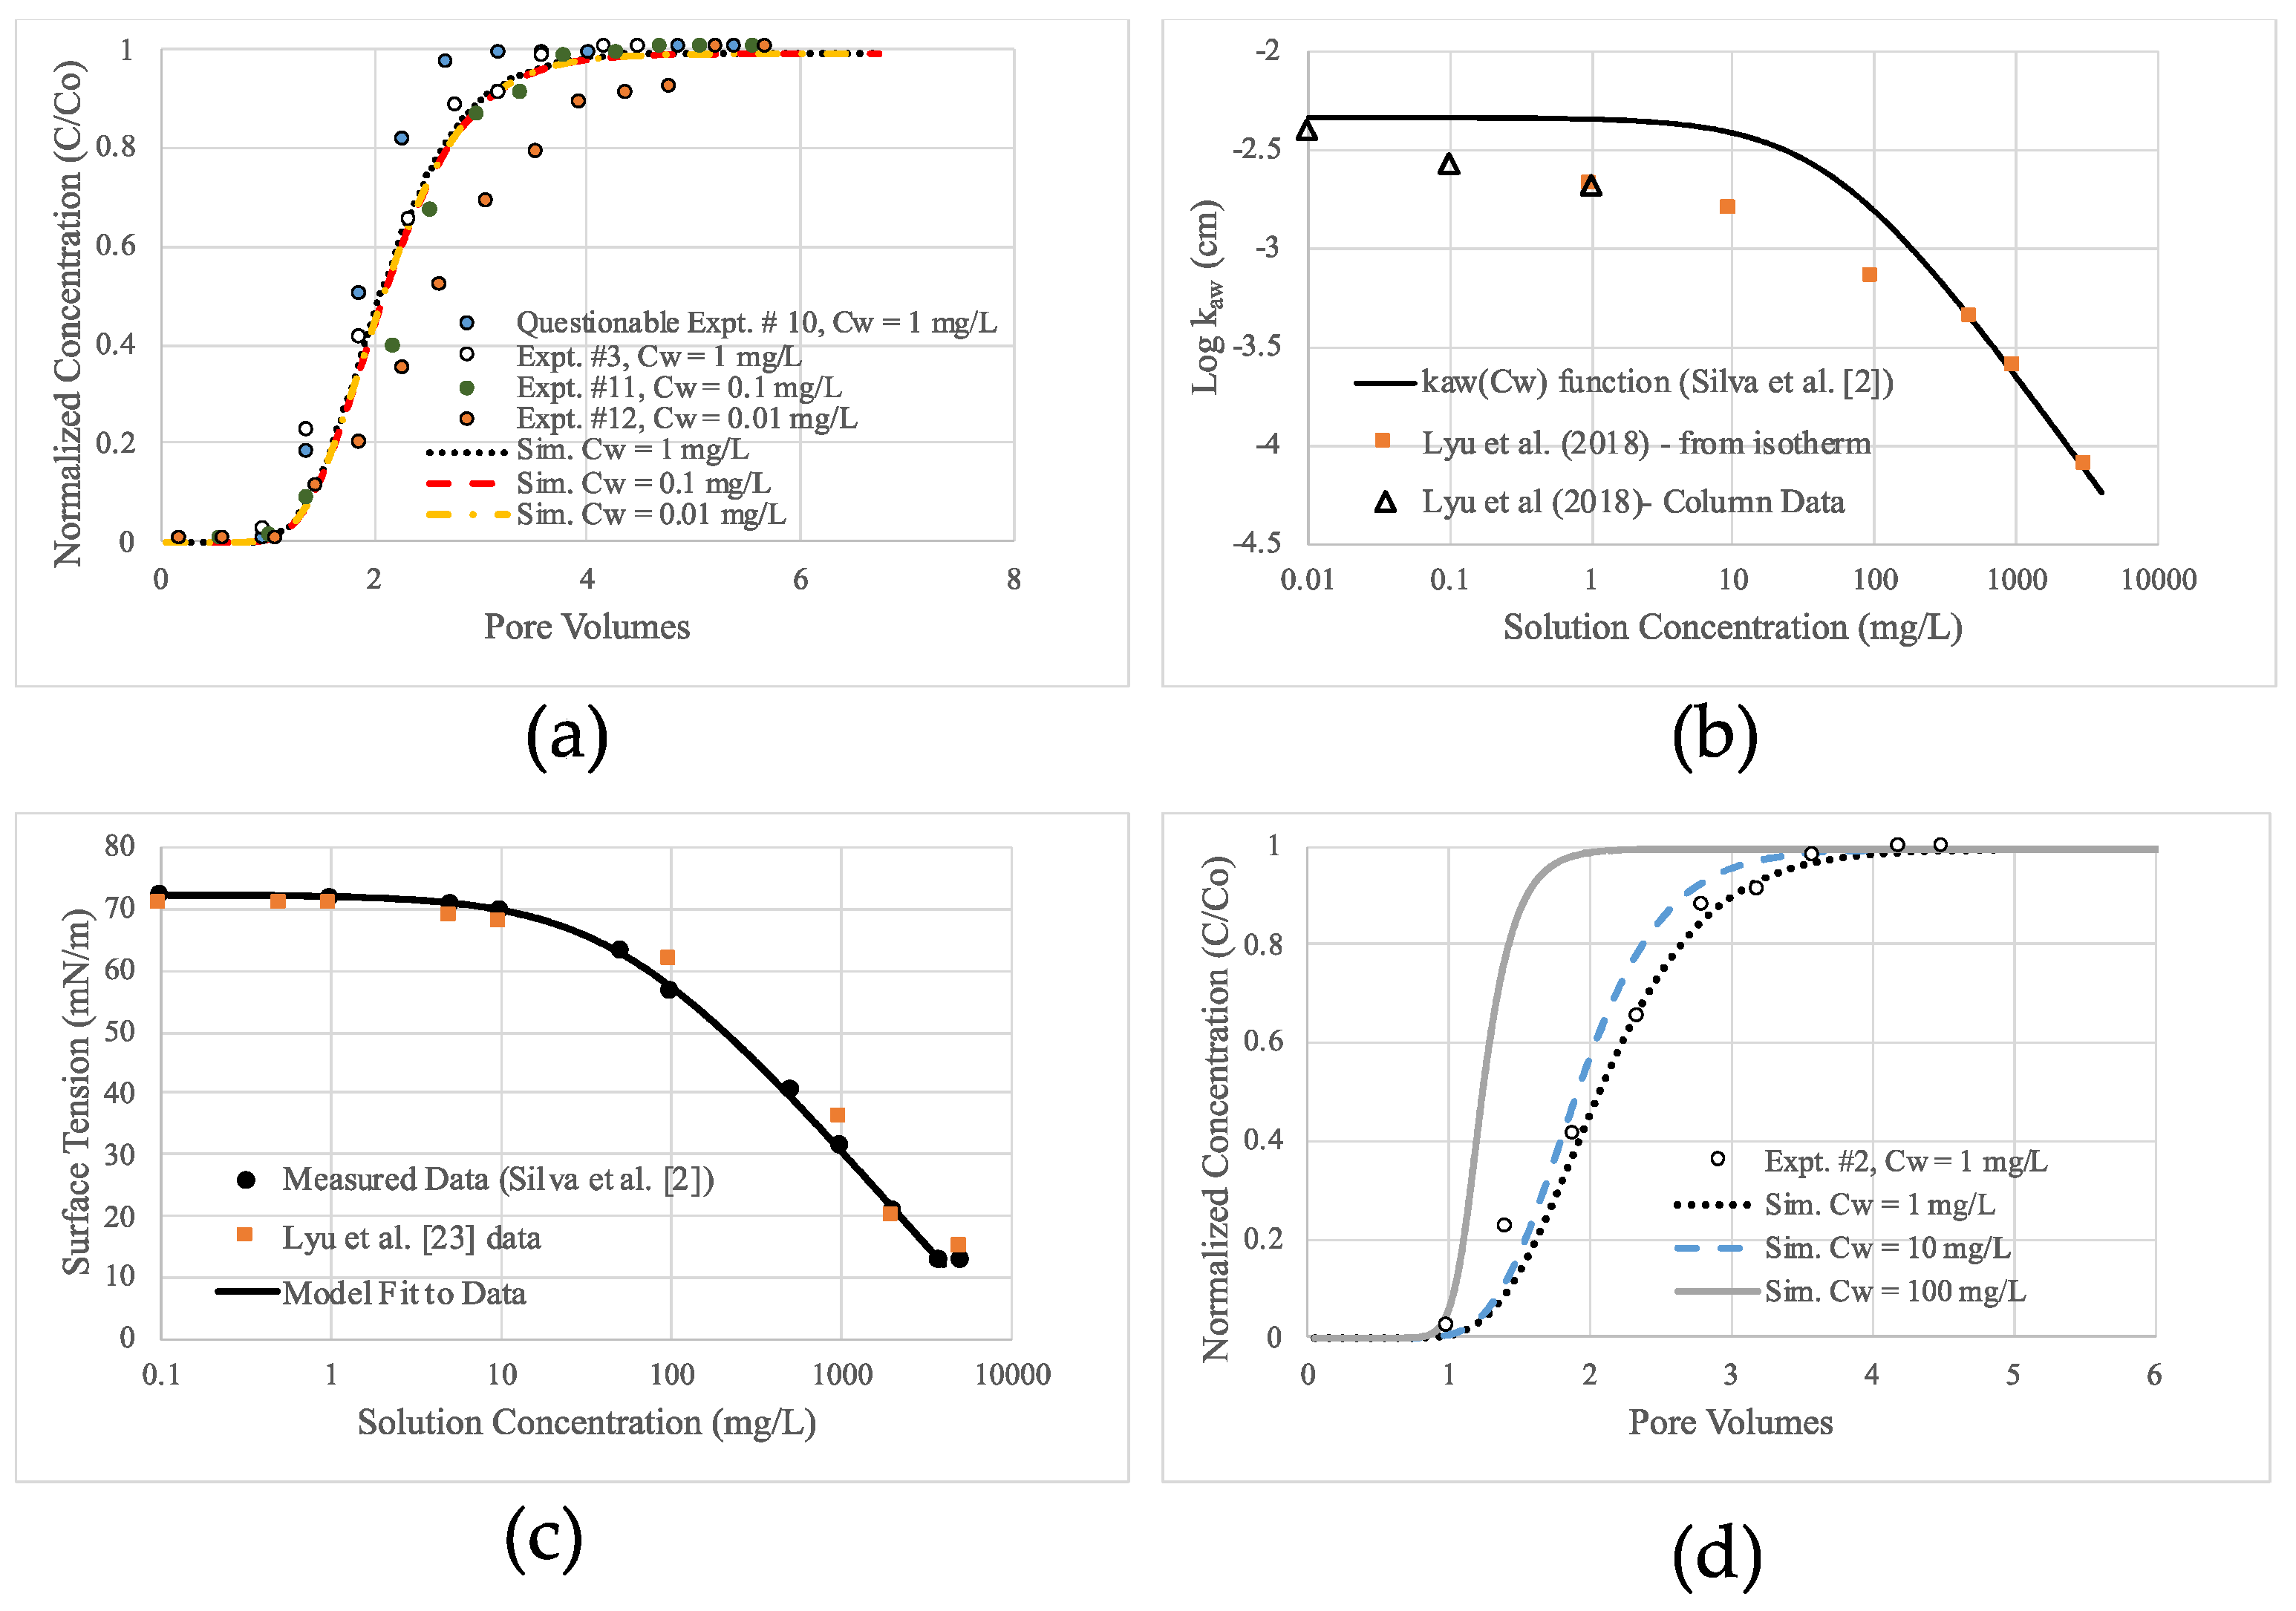
To date, Lyu et al. [23] have also presented the only experimental transport data for PFAS in which is a test variable. The data are reproduced here in Figure 3a and represent the results of PFOA transport in unsaturated sand columns ( = 0.23;. = 0.68) for = 1 mg/L, 0.1 mg/L, and 0.01 mg/L. The experimental data show increased retention of PFOA with decreasing , within this range of values.
However, as shown in Figure 3a, the simulated results using the modified HYDRUS model did not exhibit a change in retardation within this range of concentrations. The reason for this, as shown in Figure 3b, is because of the difference between the experimental and simulated dependence of the PFOA AWI adsorption coefficient () on . The simulated relationship is calculated from surface tension isotherms for PFOA measured as a part of our previous work [2] and, as shown in Figure 3b, is independent of within this lower range of concentration. This lack of dependence on at lower solution concentrations (i.e., < 1 mg/L) has been reported elsewhere for PFOA and other PFAS (e.g., [2,24,29,30]). However, the relationship provided by Lyu et al. exhibits an increasing dependence on within this lower concentration range, which is unusual given that the surface tension isotherms produced in our work and presented by Lyu et al. [23] coincide within this lower range of (Figure 3c). The slope of the surface tension isotherm, in both cases, are essentially the same and should provide the same values (via , where R is the gas constant and T is temperature), resulting in the same transport retention for PFOA. Therefore, the representativeness of these lower concentration experimental breakthrough profiles is questionable. AWI adsorption and retention of PFAS is highly dependent on the relationship and it can be difficult to maintain a constant condition, and thus , within a column of unsaturated sand throughout a given transport experiment. Perhaps changes in within the column during these experiments is the cause of the variability in PFOA breakthrough at these lower concentrations.
In the absence of additional published concentration dependent PFAS transport data, this model validation is not complete. However, we do observe that the simulated retention of PFOA is accurately tracking the dependence for that solute. As demonstrated in Figure 3d, under the condition of a constant and , PFOA retention is shown to decrease with increasing in response to the decrease in .
3.2. Example Simulation—1D Transport, Transient Flow Condition, Homogeneous Profile
Moving beyond the experimental column-scale simulations, a 1D numerical model was prepared to simulate vertical downward transport of PFAS leaching from an established source zone. The source zone in the model was designed to represent the continued production of PFAS from the degradation of precursor chemicals related to AFFF applications, with PFOA and perfluorooctane sulfonate (PFOS) as representative PFAS. The depth of the domain was 500 cm, and it was discretized to have a higher density of finite element nodes at the top of the domain. A time-variable atmospheric boundary condition was established at the top of the domain (z = 0 cm), and a constant pressure head (h) boundary was assigned at the base of the domain to represent a static water table (i.e., h = 0 @ z = 500 cm). The annual precipitation and evapotranspiration dataset used in this example simulation (Figure 4) was obtained from Jacques et al. [38] and provides a daily variable precipitation and potential evapotranspiration record representing a wet climate with an average annual precipitation of 76 cm. All precipitation was treated as rainfall (i.e., no distinction was made between rain and snow). This annual dataset was repeated to represent atmospheric conditions for each additional simulation year. Capillary hysteresis effects were not considered.
For the transport model, the top boundary was designed to represent PFAS leaching from a one-meter thick surface source zone via infiltrating soil water. Mathematically, this was implemented by assigning PFOA and PFOS mass in the solid phase to each node within the top 100 cm, leached via zero-order production to the aqueous phase. A concentration flux boundary was applied to the top of the domain, and a zero-concentration gradient boundary was applied to the base of the domain. A pore-water concentration of 1 mg/L was also applied to the source zone as an initial condition. The zero-order production rate was assigned to allow the assigned atmospheric precipitation to reduce the pore-water concentration by half its initial value during the first 15 simulated years. Thereafter the source term was allowed to stabilize. This formulation represents the realistic condition of a diminishing source term [39], as infiltrating water initially reduced the source strength and simulates the continued production of PFAS due to degradation of precursor chemicals. While much higher than current regulatory limits, 1 mg/L is a reasonable source zone strength based on calculated pore-water concentrations from reported soil concentrations [29].
The loam soil and loamy sand were selected in this example based on the differences in their potential for AWI adsorption, as demonstrated by the differences in their functions (Figure 1). VG equation parameters for these soil textures were median values for each texture as formulated by Carsel and Parrish [40] and are presented here in Table 2. Given the importance of accurately representing the dependence when simulating the unsaturated transport of interfacially adsorbing compounds, a significant amount of work has been performed in this regard in recent years (e.g., [31,41,42,43,44,45,46,47,48,49]). Both linear and non-linear relationships have been developed to describe the dependence and the significant variability observed in the magnitudes of the values have been considered to be largely dependent on the measurement method [50]. The linear relationships have been described as being more representative for the transport of dissolved surface-active compounds, as these have been shown to be consistent with microtomography measurements that appear to characterize values that are more closely related to bulk fluid flow [48,49]. The approach selected in this work was to directly calculate changes in from the changes in moisture content based on changes in capillary pressure calculated during the simulation, as guided by the VG equation. In this way, the dependence is dynamically coupled with the transient water flow. Ultimately, the most appropriate model for various conditions will continue to be a matter of ongoing debate. Fortunately, our modified HYDRUS model has the flexibility to represent both SWRC-dependent and linear models [2]. The dependence of on the capillary pressure head () were provided in Figure 1 as an example of the coupling of to the SWRC.
Additional soil and solute parameters used in these simulations are provided in Table 3. These include media bulk densities (), solute dispersivities (), solute diffusivities (), linear sorption coefficients (), values, and values for each PFAS solute. Diffusivities were derived from the recent work of Schaefer et al. [51]. values were the interpolated values provided by Guelfo and Higgins [15]. Linear solid-phase sorption was assumed in these simulations based on the lower solution PFAS concentrations used. The simulations were run using a daily time step for boundary conditions for 25 years.
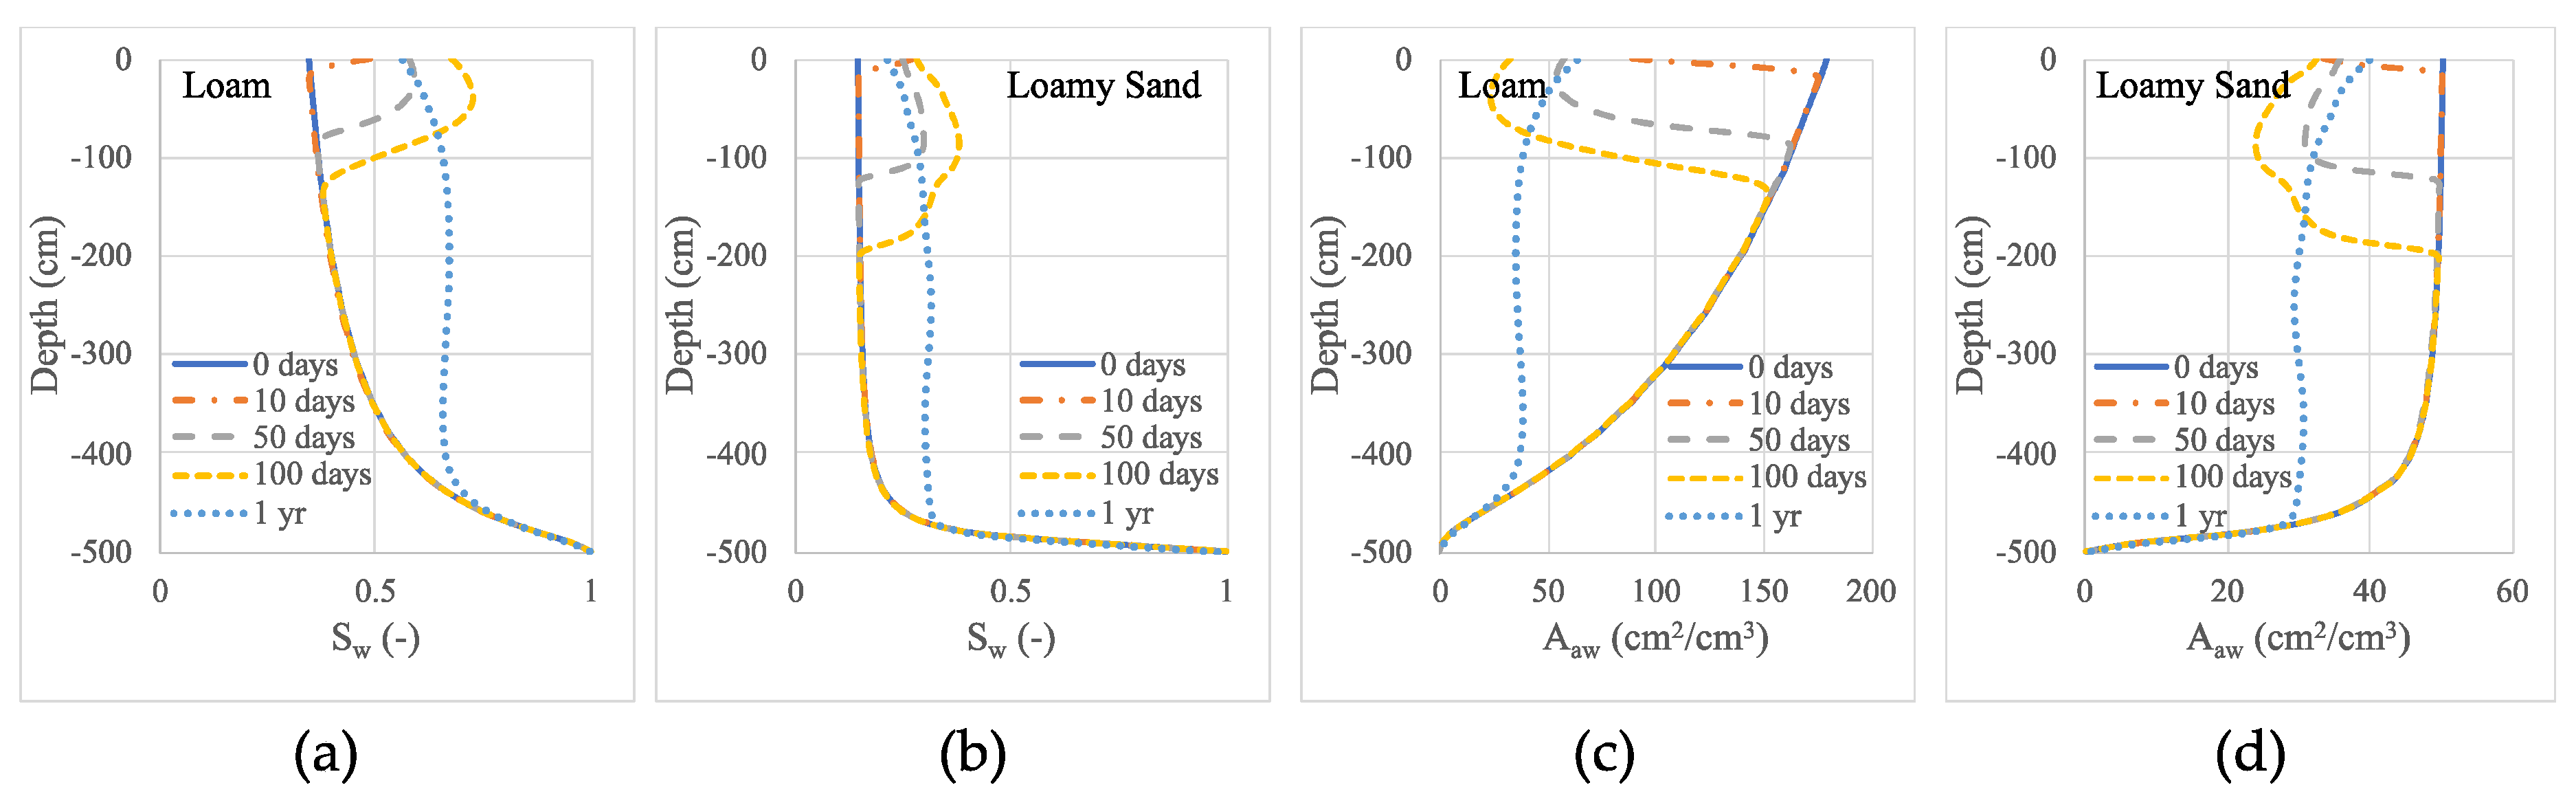
Figure 5 demonstrates the change in the temporal position of the infiltrating wetting front and the corresponding change in for both the loam and sandy loam media considered. Note that for the loam, small changes in soil moisture result in larger variations in in response to the increased slope of the relationship (Figure 1) relative to that for the sandy loam. Still transient (i.e., transient precipitation input) but steady flow conditions are established after approximately one simulated year.
Simulated solution concentration profiles for both PFOA and PFOS in both soils are provided in Figure 6. These profiles represent the unsaturated transport of PFOA and PFOS leaching from a 100 cm “source zone” within a 500-cm-deep homogeneous vadose zone. Solid-phase sorption and AWI adsorption are the only sources of retention considered and the results are presented to demonstrate the rate of transport in the absence and presence of AWI adsorption (i.e., solid-phase sorption is always considered).
Within the loam soil, the transport of both PFOA and PFOS is only slightly more retarded when the contribution of AWI adsorption is considered (i.e., additive retention processes), indicating that solid-phase sorption is the dominant retention process in this system. Using the Environmental Protection Agency’s health advisory levels for PFOA and PFOS [52], PFOS arrived at the water table after 32.2 years at a concentration of 70 ng/L () when both sorption and AWI adsorption occurred. With sorption alone (no AWI adsorption), arrival occurred at 30.8 years, which indicates that 96% of the total retardation of PFOS was due to solid-phase sorption. Likewise, solid-phase sorption accounted for 97% of the total retention of PFOA within the loamy soil vadose zone, with a of 4.6 years when both retention mechanisms occur compared to 4.5 years for sorption alone. Therefore, the primary reason for the observed differences in PFOA and PFOS transport retardation within the loam soil is the difference in the magnitude of values. The factor limiting the contribution of AWI adsorption to the overall retention in this case is the significant reduction in in this system in response to increased soil moisture during infiltration (Figure 6). A summary table of values for all simulated systems is provided as Table 4.
For the loamy sand vadose zone, additive retention is again observed for both PFOA and PFOS when both sorption and AWI adsorption occur. As observed for the loam soil, additive retention is more pronounced for PFOS than for PFOA. Using the same approach performed for the loam soil results, 82% of the total retention of PFOA was due to solid-phase sorption alone ( = 1.4 years for the sorption only case versus 1.7 years when both sorption and AWI adsorption were considered). For PFOS, 69% of the total retention was due to solid-phase sorption alone ( = 6.5 years for the sorption only case versus 9.3 years when both sorption and AWI adsorption were considered). In the loamy sand vadose zone, the reductions in was much smaller than in the loam system, and the contribution of AWI adsorption to total retardation was more significant.
These results demonstrate that AWI adsorption is not always the dominant contributor to retention within the vadose zone at PFAS source areas. This is in contrast to recent research demonstrating AWI adsorption contributed 50–99% of PFAS retardation during unsaturated transport [23,24,30] and is generally consistent with the trends in the foc-AWI adsorption nomograph presented by Brusseau [53]. It is clear that the differences in these results are, in part, related to the differences in porous media hydraulic properties and the differences in the magnitude of solid-phase sorption associated with these media. However, function attributed to a particular soil texture also plays a significant role in the AWI adsorption contribution to retardation during unsaturated transport. In the interest of providing a comparison of results, the function and other relevant soil properties developed for the quartz sand used by Lyu et al. [23] (hereafter referred to as the “model sand”) was again employed. was assigned a value of 712 cm/d, which is the median value for sand provided by the Carsel and Parrish [40] database. The specific of the model sand is very similar to that of the Accusand media used by Guo et al. [30].
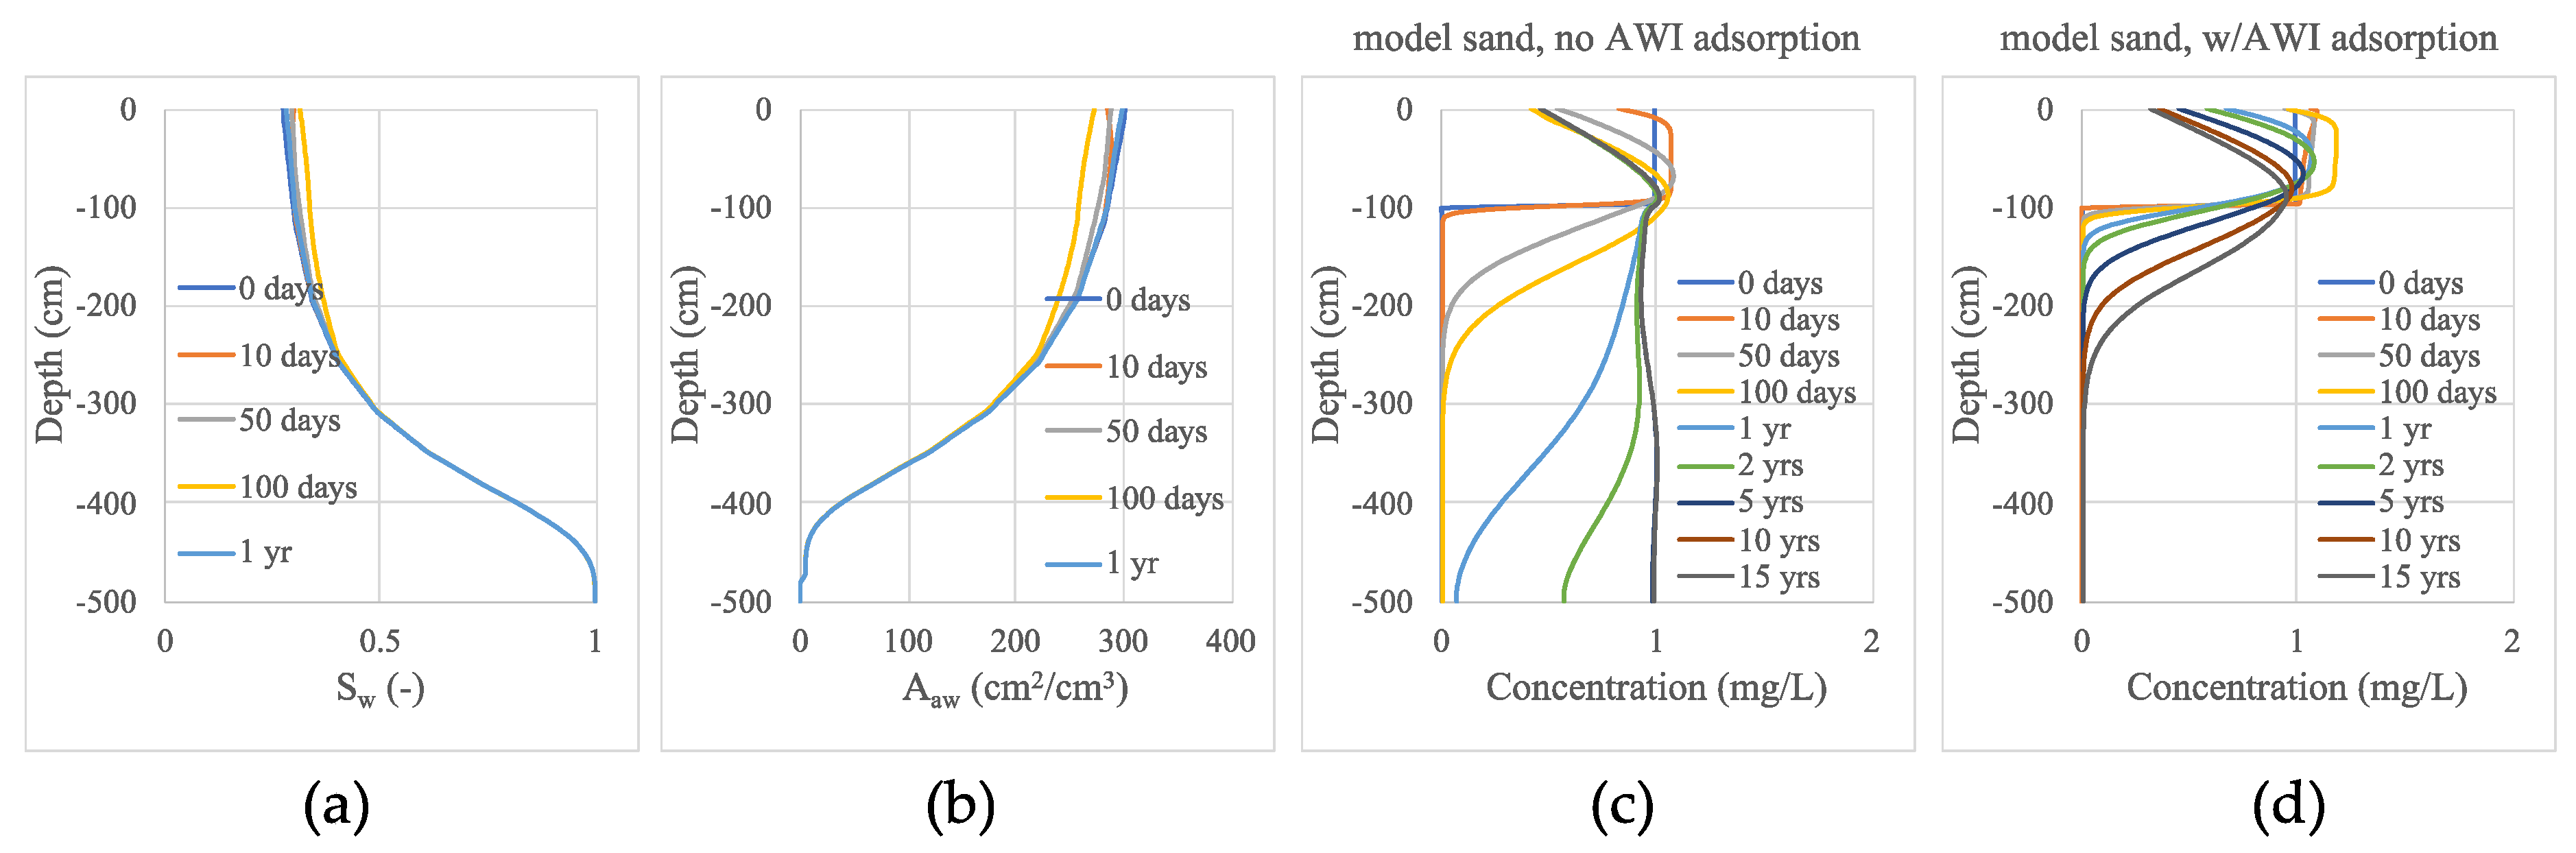
The simulated results for PFOS unsaturated transport in the model sand vadose zone are provided in Figure 7. Given the relatively high saturated hydraulic conductivity () and reduced capillarity for this sand, which results in a highly drainable profile, soil moisture and did not change significantly throughout these simulations. Here, the significant contribution of AWI adsorption to the overall retention of PFOS is very clear. In the absence of AWI adsorption, PFOS arrives at the water table (i.e., ) in 0.5 years compared to the of 13.6 years required when both solid-phase sorption and AWI adsorption are contributing to retention (i.e., a 96% contribution from AWI adsorption alone).
Interestingly, the early time pore-water concentration profiles for the loam soil show an increase in pore-water concentrations above the initial 1 mg/L assigned within the simulated source area. This increase is due to interfacial phenomena; the early time increase in soil moisture within the simulated source area results in a corresponding decrease in as the applied precipitation infiltrates. As decreases, PFOA and PFOS mass associated with the AWI partitions back into the aqueous phase, locally increasing pore-water concentrations. This result is consistent with the instantaneous and reversible adsorption and desorption assumed by the Langmuir model used to describe adsorption at the AWI.
The contribution of solid-phase sorption and AWI adsorption to PFAS retardation can be described using the following retardation factor () equation [44]
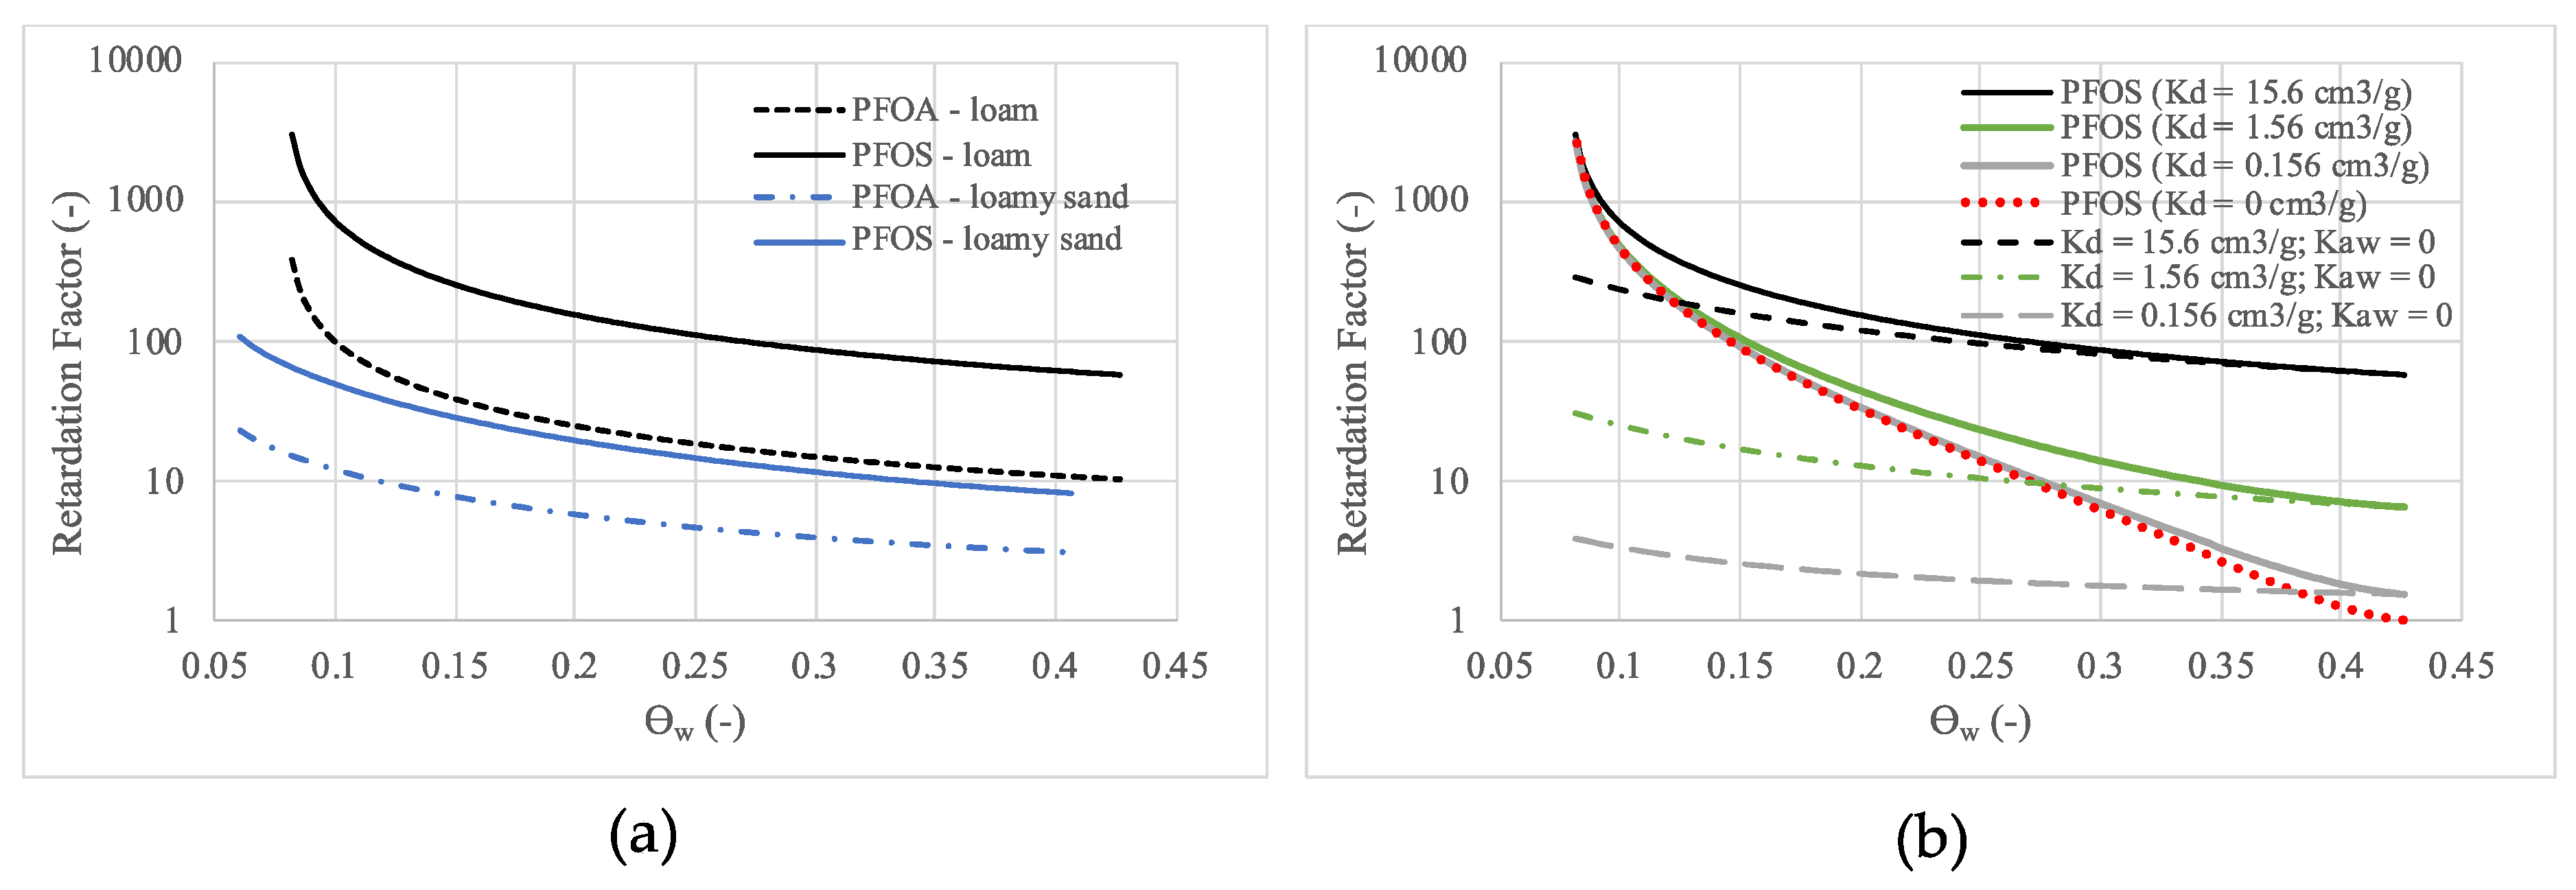
Equation (13) can then be used to help clarify the interpretation of the simulated results and was used to prepare the calculated trends provided in Figure 8 that shows changes in with changes in the key transport variables (i.e., , , and ). Figure 8a shows the dependence of on for the loam and loamy sand. Figure 8b shows the effect of decreased solid-phase sorption on values for PFOS in the loam soil, with and without AWI adsorption. Note that the slope of the relationship for each soil in Figure 8a mirrors those in Figure 8b when AWI adsorption is not considered (i.e., = 0). This shows the dominance of solid-phase sorption in these simulated systems, as described for the simulated results. Figure 8b also shows how the contribution of AWI adsorption is increased when solid-phase sorption is decreased and how, in these cases, the overall is reduced. As approaches , approaches zero and approaches the value for the sorption-only condition. As approaches , approaches its maximum value for the loam and, in turn, approaches the same maximum value regardless of the value assumed, showing the dominance of AWI adsorption when is very low.
As shown in Figure 9, both PFOA and PFOS achieve a similar quasi-steady-state mass flux to the water table (i.e., averaging between 1.5 and 2 mg/day/m2) in response to the applied source term in all cases, with PFOS in the loam soil requiring greater than 50 years to achieve this condition. The oscillating variability observed in the mass flux plot reflects the variable precipitation applied at ground surface, including the delay due to transport from the surface to the water table (see Figure 5). The degree of variability in solute mass flux increases as the solute concentration increases, in response to the variability in water flux. The time needed to achieve this steady-state mass flux condition varies between the simulated systems. PFOA is the less surface-active and less sorbing solute, and thus requires less time to reach this steady-state condition.
The significance of the modified HYDRUS simulator in assisting PFAS decision-making lies in the ability to perform these types of calculations for a variety of PFAS, at a variety of field sites, under varying climatic conditions, for a variety of source-term characterizations, given the required flow and transport parameters and a requisite source strength function (e.g., the relationship between the existing PFAS precursor mass and the mass flux of PFAS leaving a shallow source area). However, given the significant differences in arrival times and mass flux calculations demonstrated in these simulated systems, it is clear that model assumptions can have significant practical implications for evaluating PFAS transport and backtracking exposure to humans via groundwater, which underscores the need to account for all significant transport processes and appropriately model these processes.
3.3. Example Simulation–1D PFAS Transport, Transient Flow Condition, Layered Profile
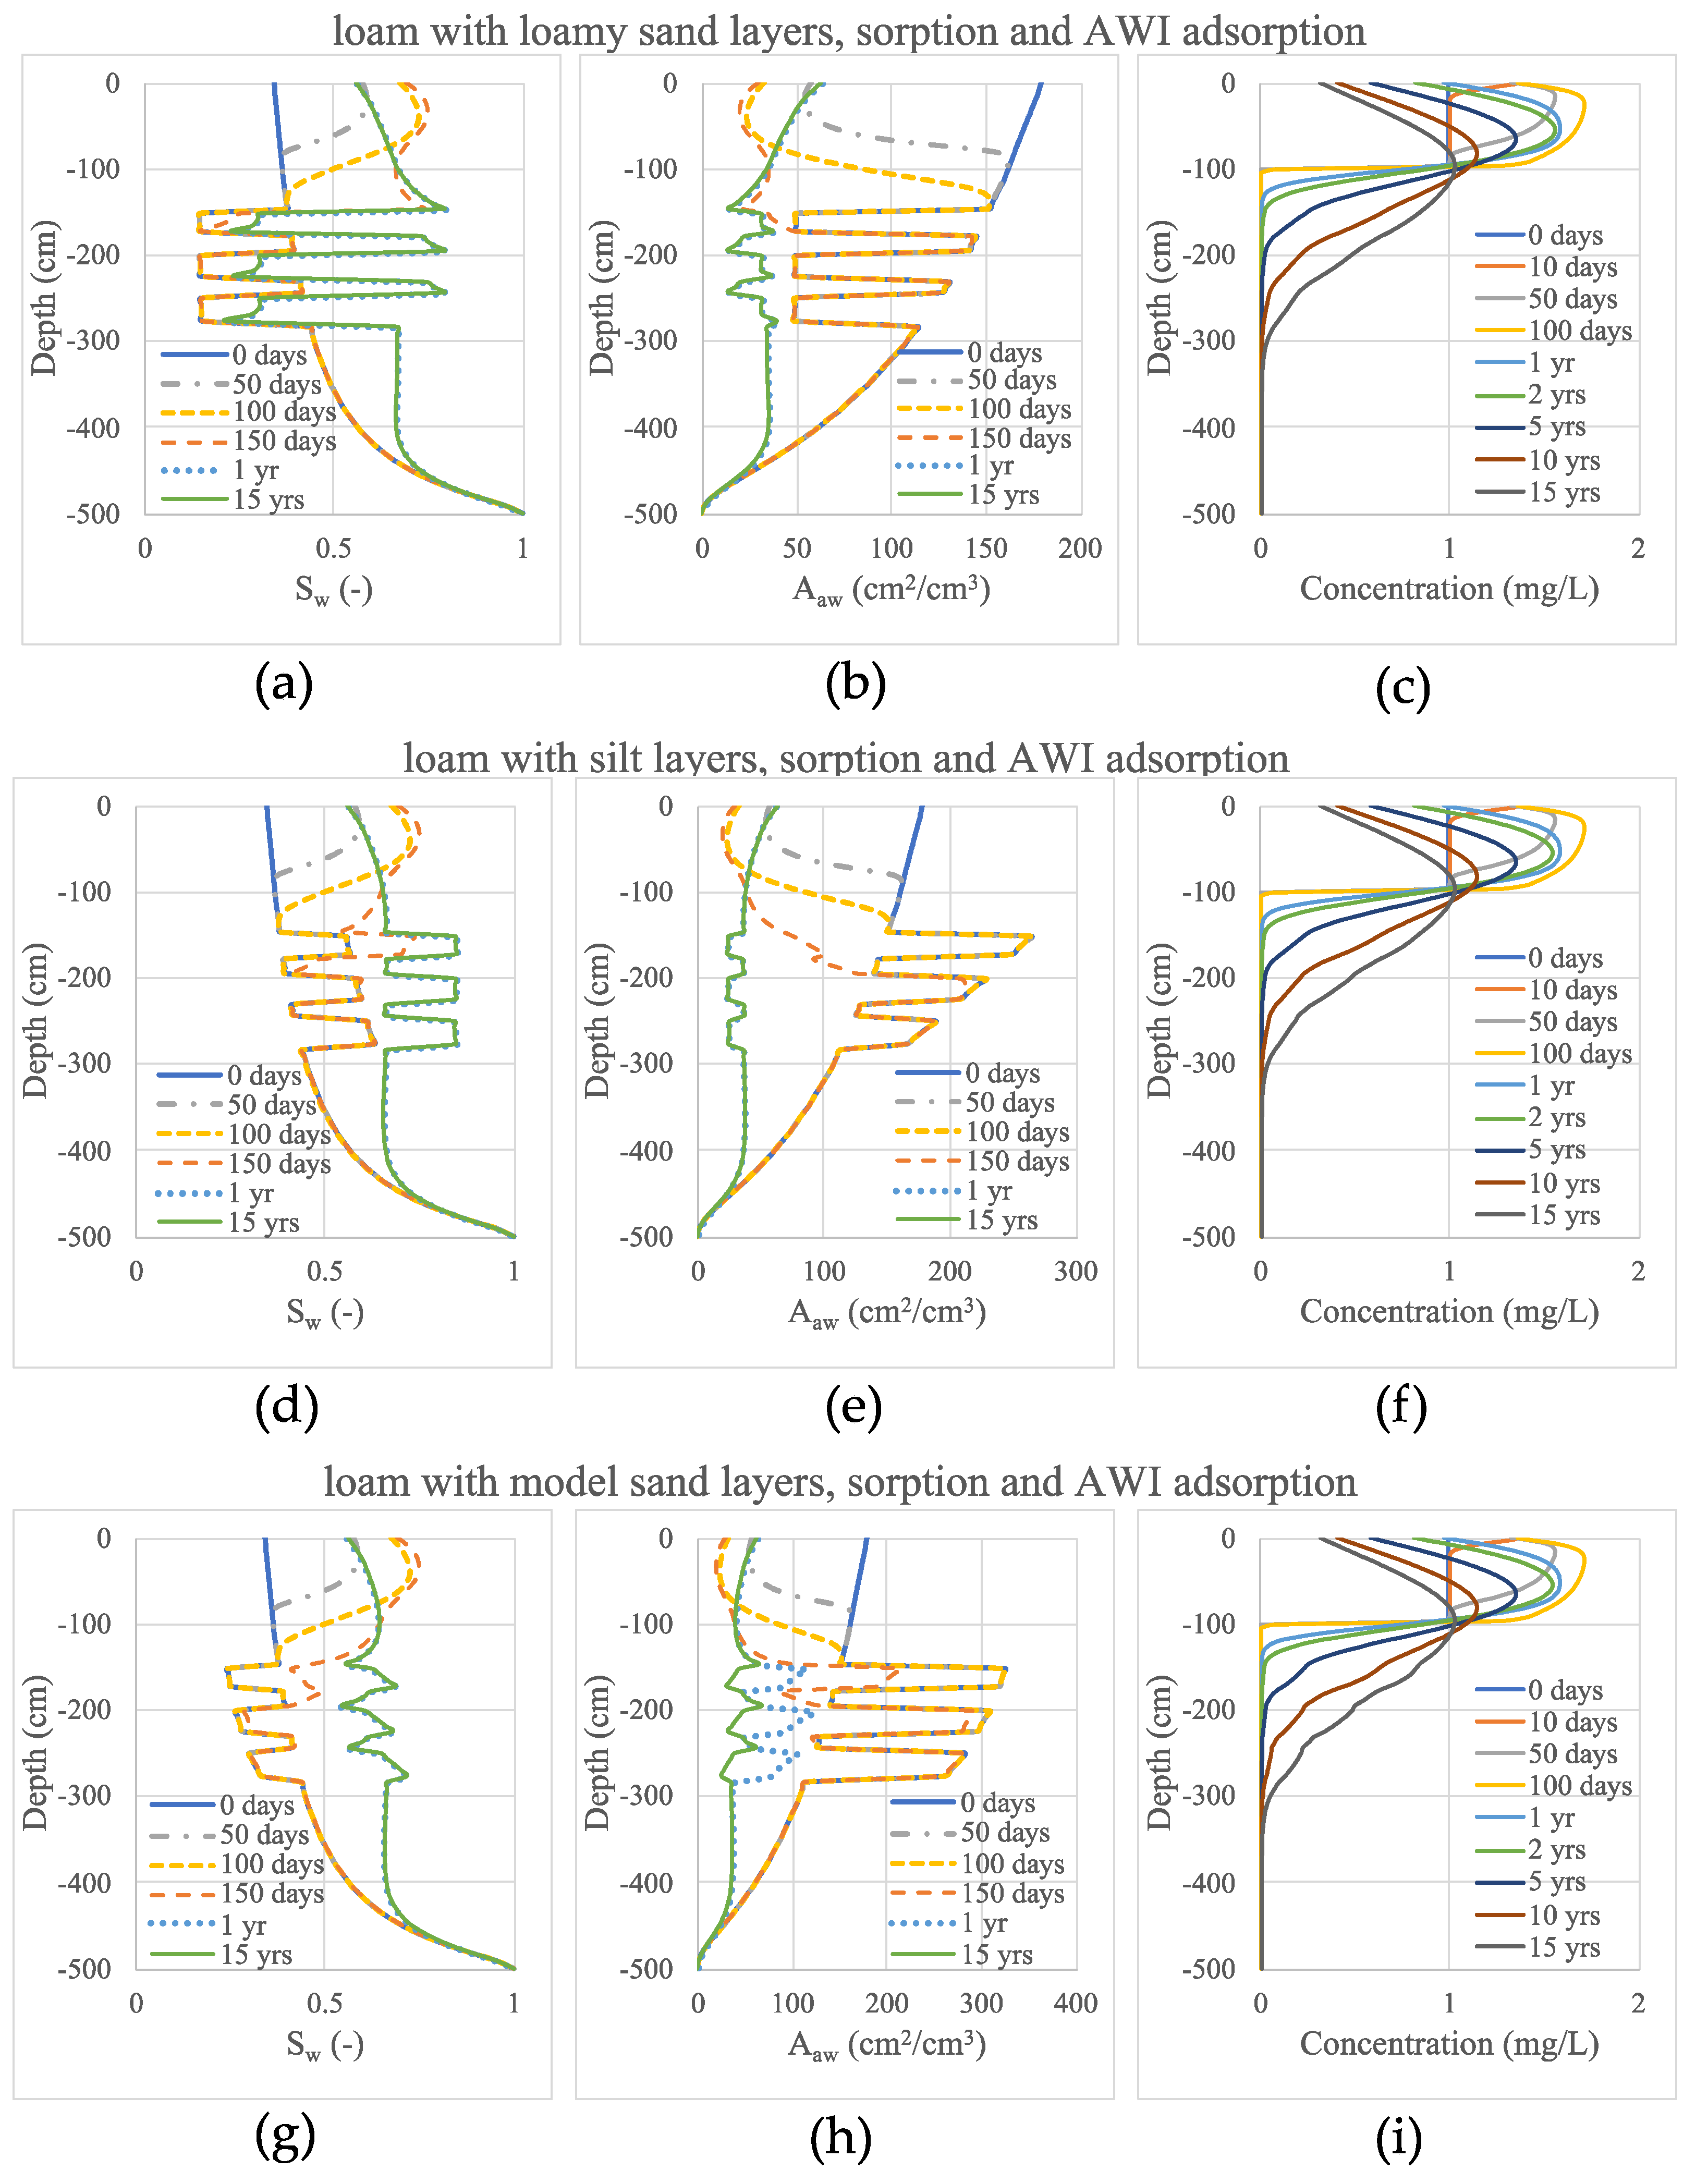
In this example, the modified HYDRUS-1D model is used to demonstrate the effects of layered heterogeneity structure on the vertical transport of PFAS, again using PFOA and PFOS as representative PFAS. The same simulation domain, and initial and boundary conditions used in the previous simulations were again employed. Likewise, the same properties and parameters for loam, loamy sand, and model sand were employed. Additionally, silt was considered, having the VG parameters presented in Table 2. For the purposes of this example, silt soil was assumed to share the same for PFOS as loamy sand. The soil texture profile in all cases consisted of the loamy soil used in the previous example, into which three 25-cm-thick layers of alternative soil textures were added. These layers consisted of loamy sand, silt, and model sand, representing a potentially wide range of variation in between individual simulations. The results of these simulations are provided in Figure 10.
The results of these simulations indicate that the presence of the layers increased the rate of PFOS transport in all cases, compared to PFOS transport within the homogeneous loam soil (Figure 6, w/AWI adsorption case). (both sorption and AWI adsorption) values for the loamy sand, silt, and model sand layer cases are 28.9, 28.3, and 24.3 years, respectively. Note also that the concentration profiles and depth of transport after 15 simulated years are nearly identical, regardless of the soil textural category selected to represent the layers. As was the case in the previous example, solid-phase sorption of PFOS within the base loam media dominated PFOS retention in these systems. Sorption within the base loam media dominates to the degree that it marginalizes the effects of AWI adsorption due to changes in soil moisture within the layers. This is best observed in the -depth profiles (Figure 10b,e,h), where in each case a similar profile is established at about the first simulated year, which reflects the establishment of a quasi-steady-state flow condition.
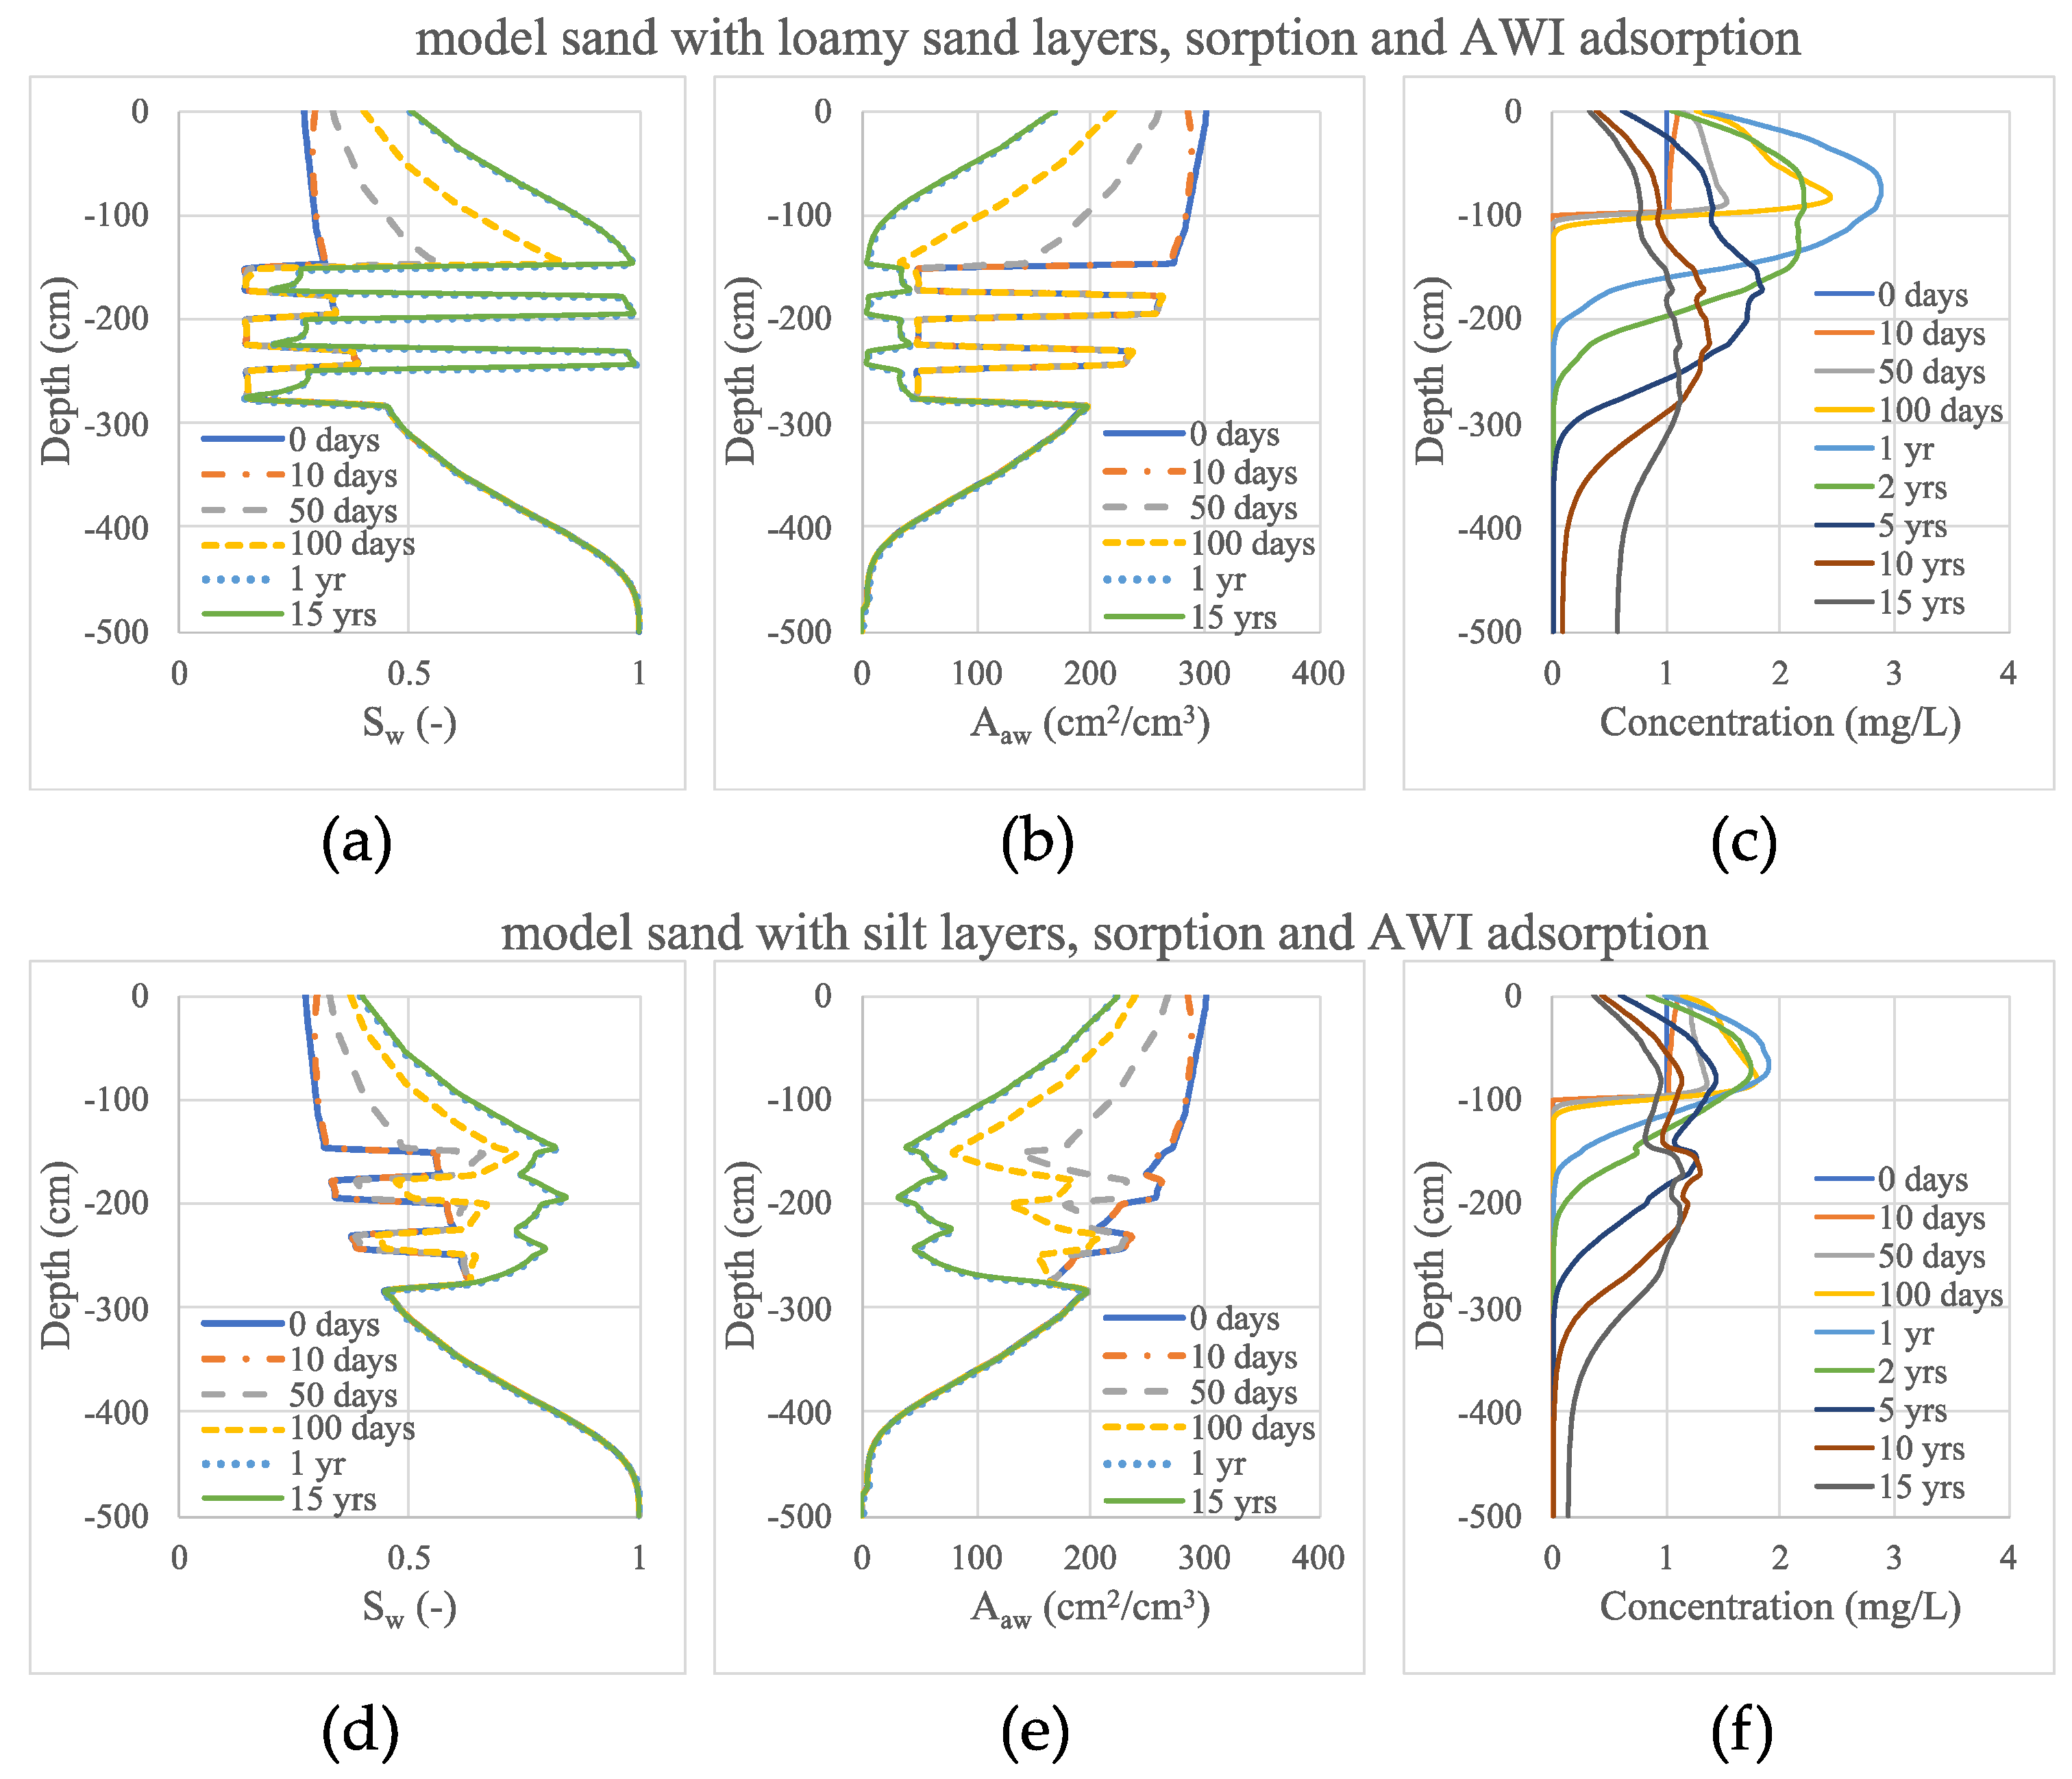
To better demonstrate the contribution of AWI adsorption, additional simulations were performed using the model sand as the base media and including loamy sand and silt layers. The results of these simulations are provided in Figure 11. When sorption is not the dominant retention process, the effect of the layers on the transport of PFOS is more pronounced. The presence of the layers in both vadose zone systems accelerates the transport of PFAS considerably, compared to the homogeneous model sand vadose zone (Figure 7). (both sorption and AWI adsorption) values for the loamy sand and silt layer cases are 4.9 and 6.6 years, respectively. A steady flow condition was achieved within the first year, as was the case for the layered loam vadose zones. However, in these cases, significant increases in soil moisture occur above the first layer and within the layers that significantly reduce and the contribution of AWI adsorption to total retention. The increases in soil moisture also increase the unsaturated hydraulic conductivities above and within the layers. The net result is faster transport of PFOS in these layered systems compared to that for the homogeneous model sand system. Note in Figure 7 that soil moisture and values do not change significantly in response to the same applied atmospheric boundary conditions. This allows AWI adsorption to dominate in the homogeneous model sand system. These results again highlight the potential significance of solid-phase sorption on PFAS-unsaturated transport and the need to accurately account for solid-phase sorption in these types of simulations.
3.4. Example Simulation–2D Simulation
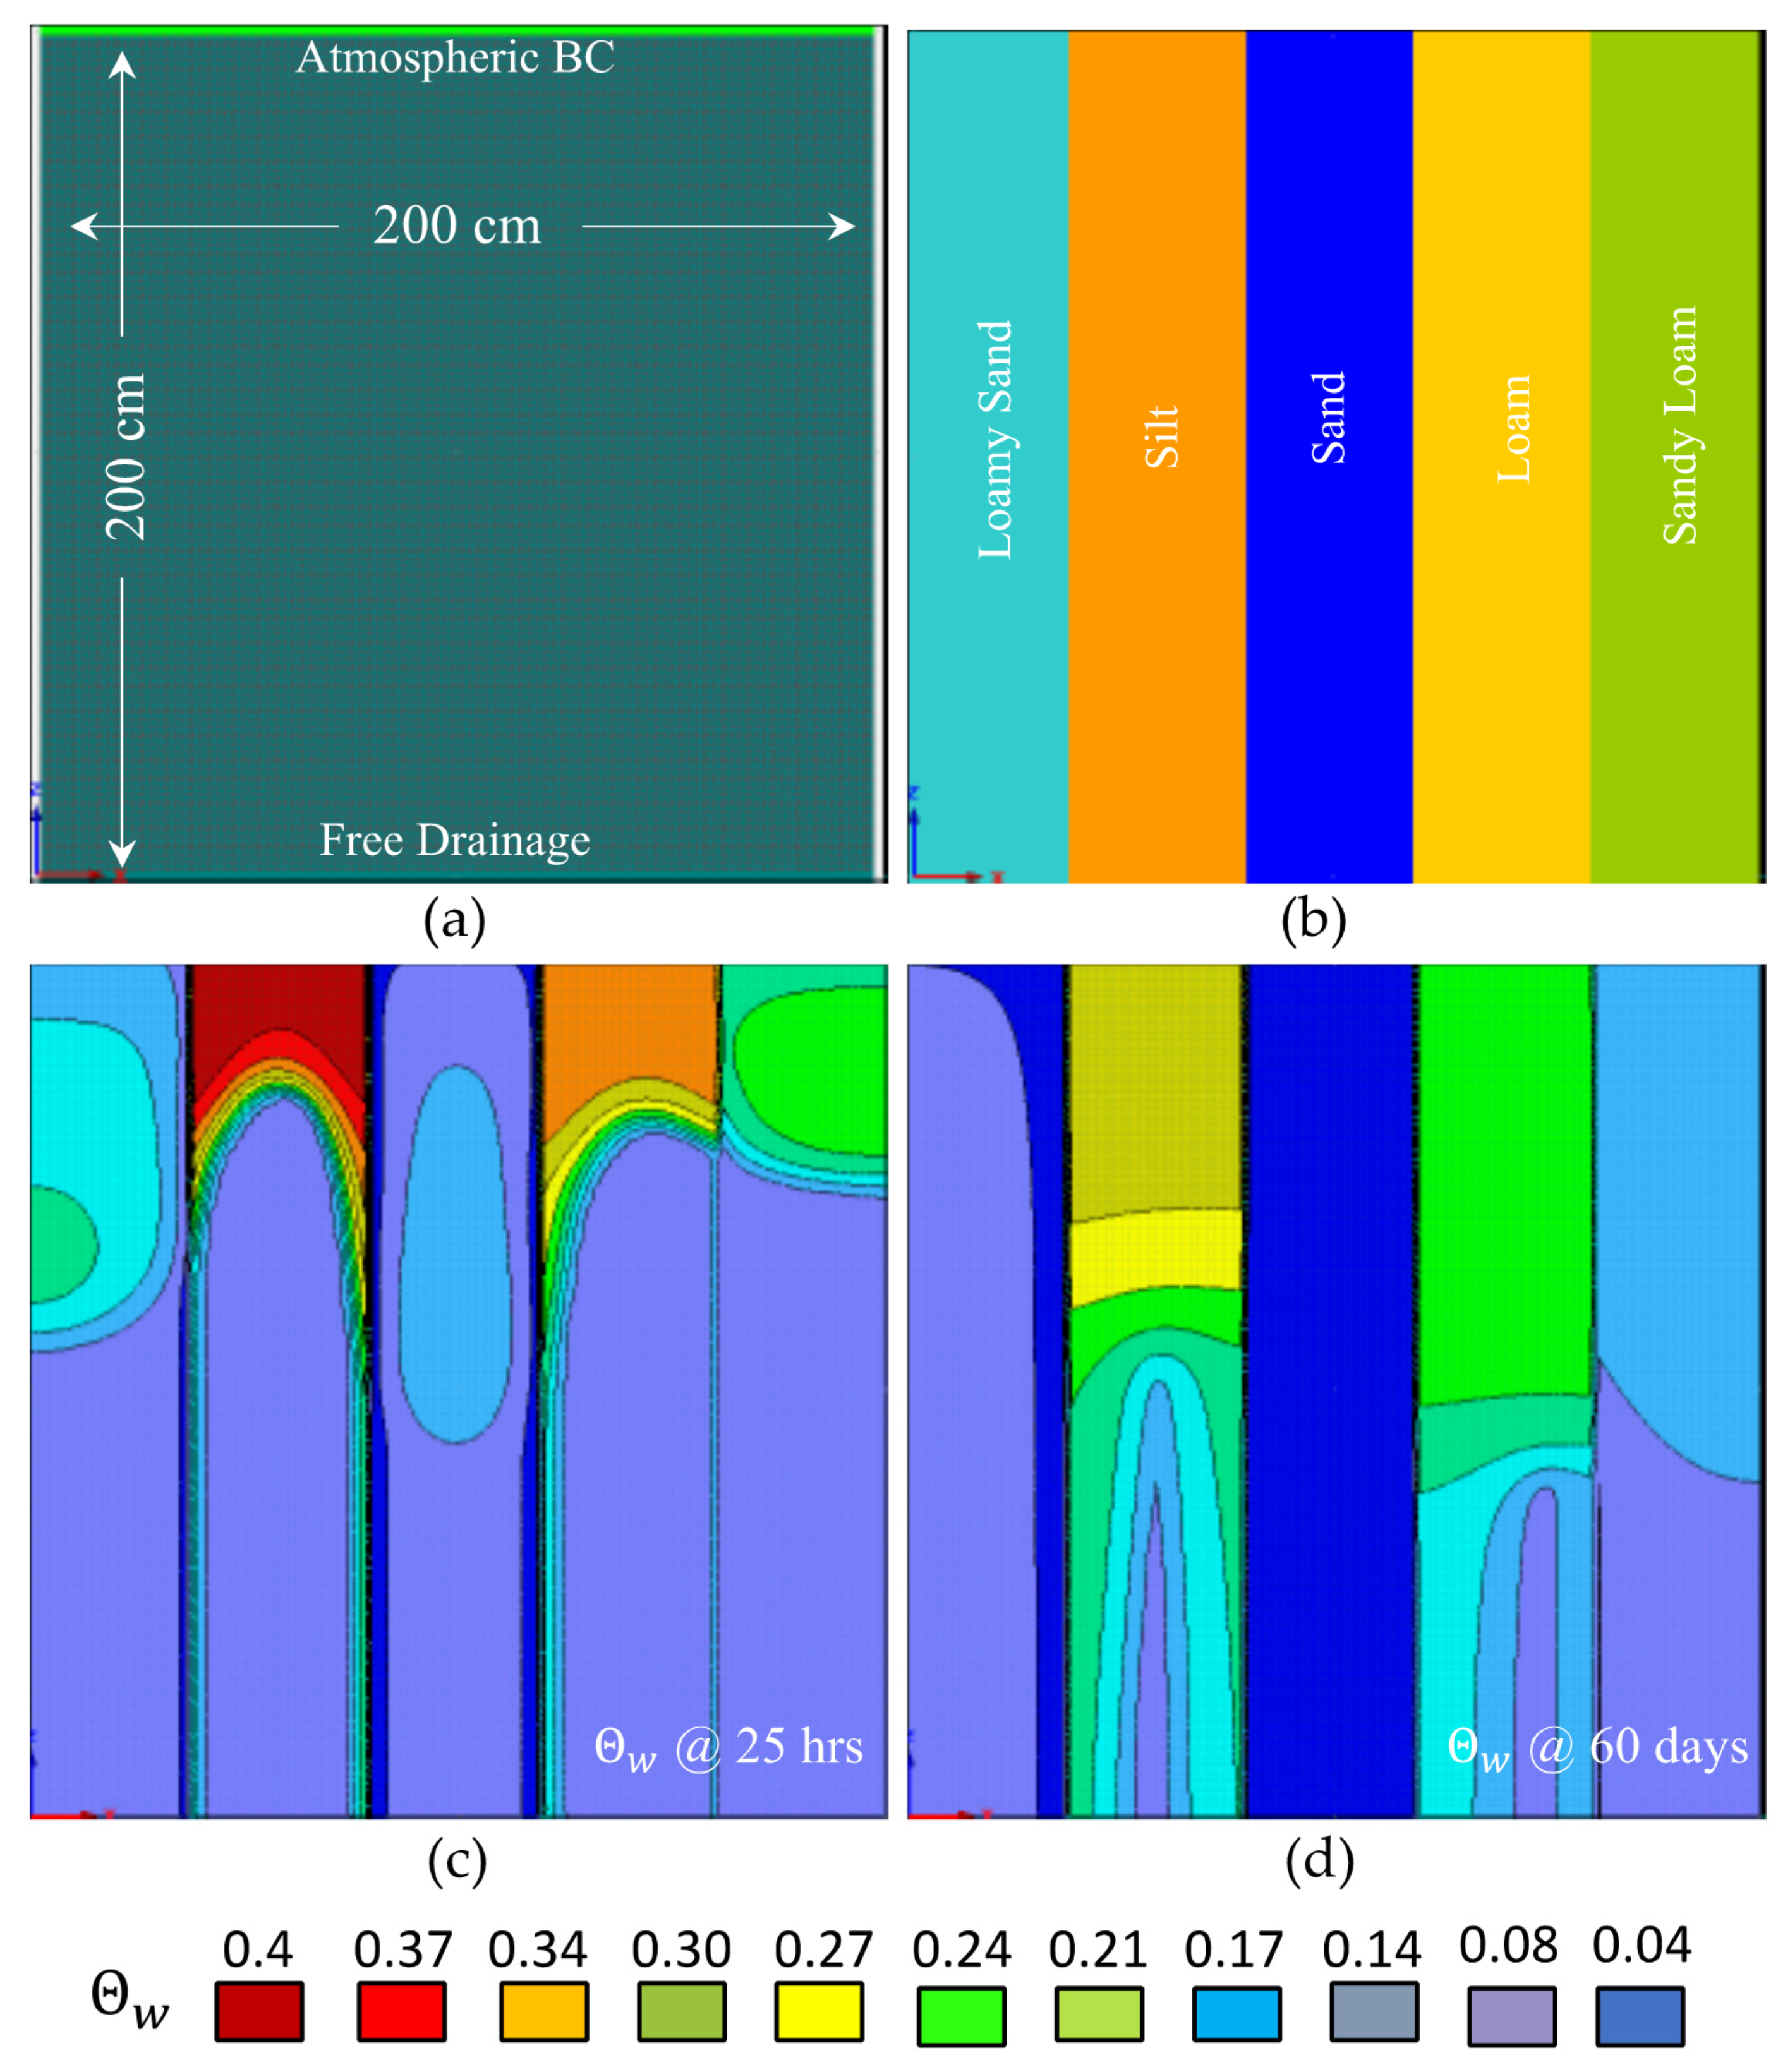
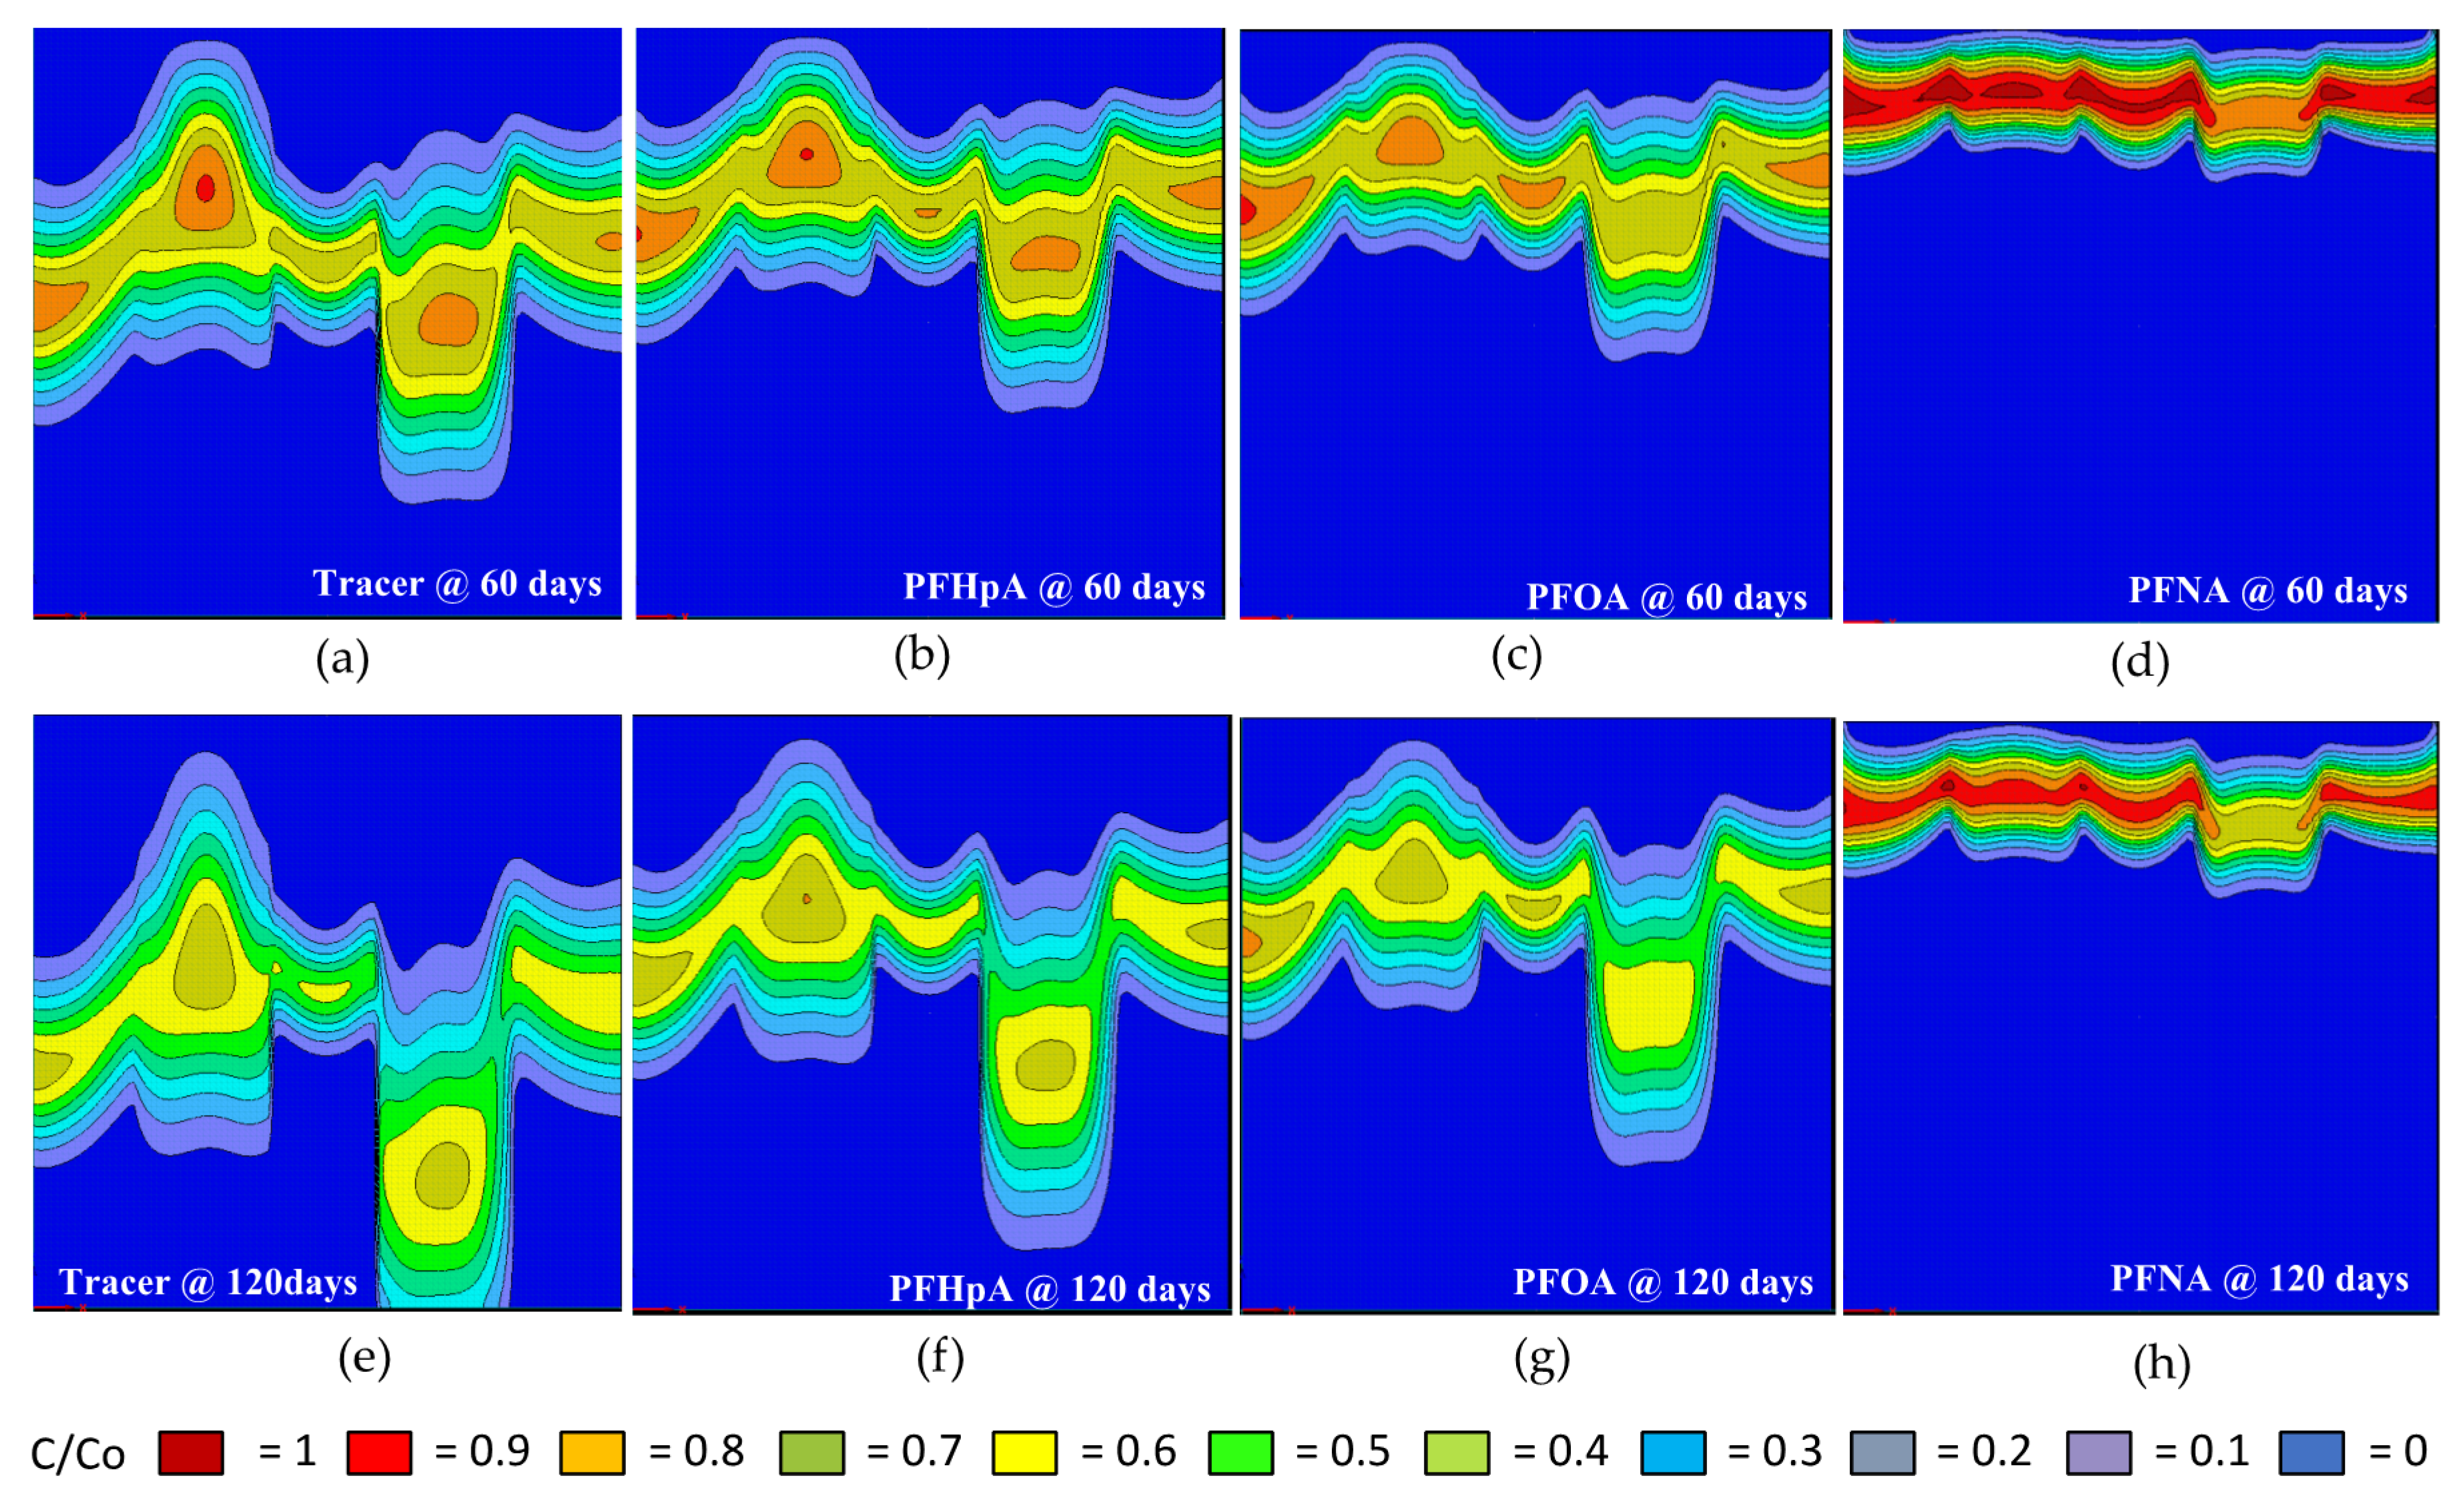
It is important to consider that solute transport times predicted by 1D models can be overestimated because they do not account for the lateral spreading of wetting and concentration fronts. For this reason, AWI adsorption was also incorporated into the HYDRUS-2D model [54]. As a purely demonstrative example, a simple 2D simulation domain was constructed to simulate PFAS transport in the texturally heterogeneous system shown in Figure 11. The system was chosen primarily to illustrate different transport regimes, but could also represent simplified, horizontally variable soil domains in the shallow vadose zone (i.e., fluvial depositions). Hydraulic properties for five different soil textures were selected, each adhering to a separate function determined by the model. The VG model parameters for different soil textures were provided in Table 2. As was done in the initial example, a time-variable flow boundary condition (i.e., the atmospheric boundary with surface runoff) was established at the top of the domain (z = 0 cm), and a constant pressure head boundary condition was assigned at the base of the domain to establish a static water table (i.e., h = 0 @ z = 200 cm). A PFAS source zone was established within the top 15 cm of the soil profile and a concentration of 1 mg/L was the initial condition within this source zone for perflluorohexanoic acid (PFHpA), PFOA, and perfluorononanoic acid (PFNA) as representative PFAS, as well as a non-reactive tracer for comparison. In the interest of highlighting the effects of AWI adsorption, solid-phase sorption was not considered in this example. Water was introduced at the upper boundary of the domain in a series of 0.5 cm/hour water application events, each lasting 5 h. A total of seven events were simulated, starting at 100 h into the simulation and reoccurring every 300 h thereafter. and values for PFHpA and PFNA were 1330, 51,300, 5.83 10−6, and 5.1 10−6 mol/m2, respectively [29]. The total simulation time was 120 days. The simulated change in within this 2D system is shown in Figure 12. An example of the simulated results of PFAS transport is presented in Figure 13.
These results again demonstrate the modified HYDRUS model’s ability to capture the dynamic, transient, and heterogeneous nature of the function and its effect on PFAS AWI adsorption. These results also demonstrate the increased transport retardation for PFAS of greater surface activity, where surface activity increases with increasing size of the PFAS hydrophobe (i.e., increasing fluorocarbon chain length in this case for these homologous perfluorocarboxylic acids). PFNA is the most surface-active PFAS in this example (the right vertical panels in Figure 13). In addition to AWI adsorption, the retention of these surface-active solutes is shown to be hydraulically limited in some cases. The coarser textured media (e.g., sands) have a greater capacity to conduct fluids but remains low in these media and does not change significantly during the applied infiltration events because pores do not need to fill as much to conduct fluids. is near the maximum for these soil textures and therefore PFAS retention is maximal. PFAS transport is therefore primarily limited by AWI adsorption.
For the finer soil textures, the water application rate is closer to their respective values but is overall less conductive. values are higher, reducing the . However, the magnitude of for these finer textured soils is considerably greater than those of the sandy media at the same moisture content. Therefore, PFAS transport within the finer textured media is limited by both AWI adsorption and hydraulic limitations.
The loam soil appears to provide a favorable combination of hydraulic properties and values that combine to enhance the rate of transport relative to the other porous media categories used in this example. The existence of a favorable hydraulic conductivity-() condition suggests that this modified simulator could be potentially used to develop site screening metrics based on soil textural classifications to support PFAS contaminant risk assessments. To our knowledge, this is the first 2D model result presented for PFAS vadose zone transport that includes the effects of AWI adsorption within unsaturated porous media.
4. Conclusions and Implications
The HYDRUS unsaturated flow and contaminant transport model was modified to include the effects of AWI adsorption of PFAS and its dependence on solution concentration. HYDRUS was also modified to account for changes in solution surface tension and viscosity, properties important when simulating the release of AFFF solutions or when PFAS concentrations are high enough to impact capillary pressures. The mathematical modifications made to the model (i.e., the dependence of PFAS retention on as it relates to changes in , and the concentration dependence on AWI adsorption) were validated against available PFAS transport data derived from the literature. There is a need, however, for additional PFAS transport data to further validate the current model modifications and future modifications. Example simulations were performed to demonstrate the function and utility of the modified HYDRUS model for evaluating PFAS transport in the vadose zone. The results of the example simulations presented demonstrate that:
- While AWI adsorption of PFAS can be a significant source of retention within the vadose zone, it is not always the dominant source of retention. The contribution of solid-phase sorption can be considerable in many PFAS-contaminated vadose zones. These results highlight the need for additional research aimed at developing practical models to represent PFAS associations with the solid phase. Such models would include both hydrophobic and electrostatic contributions and the effect of variable pore-water solution chemistry on solid-phase interactions for PFAS;
- The selection of an appropriate or function is also important to accurately account for AWI adsorption of PFAS during unsaturated transport. The current modified HYDRUS model calculates directly from the user-defined SWRCs. In this way the dependence is dynamically coupled with the transient water flow;
- The accuracy of simulated predictions of PFAS mass flux or mass discharge from a vadose zone source to an underlying groundwater resource is highly dependent not only on accurately representing atmospheric inputs and outputs and the complexities of unsaturated flow transport within the system of interest, but also on accurately representing the PFAS source term and source strength function. A representative and realistic diminishing source term was used in this work. However, a more comprehensive source term model (e.g., one that specifically models PFAS generation from the degradation of precursor chemicals) could improve the accuracy of mass flux predictions;
- The presence of textural heterogeneity, as layers of soil with different texture, was shown to accelerate the unsaturated transport of PFOS compared to simulated transport within homogeneous vadose zones composed of the same base media. For the loam soil, solid-phase sorption dominated the overall retention of PFOS and largely mitigated the effects of heterogeneity. Still, PFOS arrival at the water table within the layered heterogeneous cases occurred 3–7 years faster than was calculated for the homogeneous case. In contrast, PFOS arrival within a model sand vadose zone containing layered heterogeneities was accelerated by a factor of 2–3, compared to the homogeneous case (Table 4). AWI adsorption was the dominant retention mechanism for the model sand. Increases in unsaturated hydraulic conductivity and significantly reduced values above and within the layered structure, in response to a significant increase in soil moisture within this same location, resulted in the observed transport acceleration. It is important to note that these 1-D systems can allow for greater increases in soil moisture in vertically heterogeneous systems than would be observed under field conditions, due to the lack of lateral flow. As a result, the rates of transport can be artificially high under certain conditions;
- Finally, the results of the heterogeneous 2D simulations demonstrate the ability of the modified HYDRUS model to capture the dynamic nature of PFAS transport during transient flow conditions in the presence of textural heterogeneities. The simulated results also indicate the potential for an optimal conductivity- condition that can maximize PFAS transport in vadose zones where AWI adsorption is the dominant retention mechanism. For simulating field-scale transport of contaminants in heterogeneous vadose zones, simulations performed in 2D are often preferable because 2D models allow for the lateral spreading of infiltrating fluids, and therefore generally provide more representative transport predictions. This is particularly true of surface-active solutes like PFAS for which AWI adsorption is a consideration.
The current modified HYDRUS model treats AWI adsorption as a non-linear equilibrium process with adsorption and desorption at the AWI occurring instantaneously (i.e., no kinetic effects). However, kinetic adsorption/reorganization effects at the AWI were observed in our research [2], particularly for PFAS mixtures, during surface tension measurements for PFAS mixtures where equilibrium tension values were achieved over the course of several hours. This is significant because PFAS contamination typically occurs as a complex mixture of components [55]. Incorporating these effects into a future version of the modified HYDRUS model has been proposed as a part of future research and will further improve the accuracy model predictions and the overall utility of the model to assist PFAS site evaluations and risk assessments.
Additionally, while the current modified HYDRUS model can simulate the transport of multiple PFAS components, it does not account for interactions between individual PFAS components and its effect on adsorption at the AWI. Our previous research has demonstrated that intermolecular interactions at the AWI between individual PFAS components in a mixture can be considered negligible at low concentrations (i.e., <1 mg/L) [2,29]. Therefore, the current model modifications are appropriate for this lower concentration range, which is representative of PFAS contamination at many sites, and at nearly all documented sites where a definitive PFAS source area has been identified. However, as pore-water PFAS concentrations increase (i.e., within a source zone), the potential for inter-molecular interaction at the AWI increase. As discussed in a recent publication [29], the adsorbed composition of PFAS at the AWI can change, as the more surface-active PFAS components are preferentially retained during transport in the vadose zone. Preferential adsorption and the reorganization of adsorbed components at the AWI is the most likely cause of the observed kinetics effects discussed in the preceding paragraph. Developing mathematical models to describe this phenomenon and incorporating these relationships into the simulator is additionally being proposed as a component of future research.
Author Contributions
Conceptualization, J.A.K.S.; methodology, J.A.K.S., J.Š. and J.E.M.; software, J.Š.; validation, J.A.K.S.; formal analysis, J.A.K.S., J.Š. and J.E.M.; investigation, J.A.K.S. and J.E.M.; resources, J.A.K.S.; writing—original draft preparation, J.A.K.S.; writing—review and editing, J.A.K.S., J.Š. and J.E.M.; visualization, J.A.K.S.; supervision, J.A.K.S.; project administration, J.A.K.S.; funding acquisition, J.A.K.S. All authors have read and agreed to the published version of the manuscript.
Funding
The original research performed to develop the model used in this publication was funded by the U.S. Department of Defense, through the Strategic Environmental Research and Development Program (SERDP), Project ER18-1389, Grant No.: W912HQ-18-C-OO76. The results and conclusions presented herein are those of the authors and do not necessarily represent those of the United States Government, and no endorsement of the described technology is implied.
Acknowledgments
The authors acknowledge GSI North America, Inc. who administered the original investigation contract while the lead author and principal investigator of SERDP Project ER18-1389 was employed by GSI. We also thank the anonymous reviewers for their help in improving our presentation.
Conflicts of Interest
The authors declare no conflict of interest.
References
- Šimůnek, J.; van Genuchten, M.T.; Šejna, M. Development and applications of the HYDRUS and STANMOD software packages and related codes. Vadose Zone J. 2008, 7, 587–600. [Google Scholar] [CrossRef] [Green Version]
- Silva, J.A.K.; McCray, J.E.; Martin, W.A. Final Report: Baseline Data Acquisition and Numerical Modeling to Evaluate the Fate and Transport of PFAS within the Vadose Zone. SERDP Project ER18-1389. Available online: https://www.serdp-estcp.org/Program-Areas/Environmental-Restoration/Contaminated-Groundwater/Emerging-Issues/ER18-1389 (accessed on 10 September 2020).
- Berger, U.; Jamberg, U.; Kallenborn, R. Perfluorinated alkylated substances (PFAS) in the European Nordic environment. Organohalogen Compd. 2004, 66, 3996–4002. [Google Scholar]
- United States Environmental Protection Agency (USEPA). Long-Chain Perfluorinated Chemicals (PFCs) Action Plan; U.S. Environmental Protection Agency: Washington, DC, USA, 2009.
- Ahrens, L.; Bundschuh, M. Fate and effects of poly- and perfluoroalkyl substances in the aquatic environment: A review. Environ. Toxicol. Chem. 2014, 33, 1921–1929. [Google Scholar] [CrossRef] [PubMed]
- Sharma, B.M.; Bharat, G.K.; Tayal, S.; Larssen, T.; Becanova, J.; Karaskova, P.; Whitehead, P.G.; Futter, M.N.; Butterfield, D.; Nizzetto, L. Perfluoroalkyl substances (PFAS) in river and ground/drinking water of the Ganges River basin: Emission and implications for human exposure. Environ. Pollut. 2016, 208, 704–713. [Google Scholar] [CrossRef] [PubMed]
- Filipovic, M.; Woldegiorgis, A.; Norström, K.; Bibi, M.; Lindberg, M.; Österås, A.-H. Historical usage of aqueous film forming foam: A case study of the widespread distribution of perfluoroalkyl acids from a military airport to groundwater, lakes, soils and fish. Chemosphere 2015, 129, 39–45. [Google Scholar] [CrossRef]
- Xiao, F.; Simcik, M.F.; Halbach, T.R.; Gulliver, J.S. Perfluorooctane sulfonate (PFOS) and perfluorooctanoate (PFOA) in soils and groundwater of a US Metropolitan area: Migration and implications for human exposure. Water Res. 2015, 72, 64–74. [Google Scholar] [CrossRef]
- Weber, A.K.; Barber, L.B.; LeBlanc, D.R.; Sunderland, E.M.; Vecitis, C.D. Geochemical and hydrologic factors controlling subsurface transport of poly- and perfluoroalkyl substances, Cape Cod, Massachusetts. Environ. Sci. Technol. 2017, 51, 4269–4279. [Google Scholar] [CrossRef]
- Anderson, R.H.; Adamson, D.T.; Stroo, H.F. Partitioning of poly-and perfluoroalkyl substances from soil to groundwater within aqueous film-forming foam source zones. J. Contam. Hydrol. 2019, 220, 59–65. [Google Scholar] [CrossRef]
- Hoisœter, A.; Pfaff, A.; Breedveld, G.D. Leaching and transport of PFAS from aqueous film-forming foam (AFFF) in the unsaturated soil at a firefighting training facility under cold climate conditions. J. Contam. Hydrol. 2019, 222, 112–122. [Google Scholar] [CrossRef]
- Higgins, C.P.; Luthy, R.G. Modeling sorption of anionic surfactants onto sediment materials: An a priori approach for perfluoroalkyl surfactants and linear alkylbenzene sulfonates. Environ. Sci. Technol. 2007, 41, 3254–3261. [Google Scholar] [CrossRef]
- Tang, C.Y.; Fu, Q.S.; Gao, D. Effect of solution chemistry on the adsorption of perfluorooctane sulfonate onto mineral surfaces. Wat. Res. 2010, 44, 2654–2662. [Google Scholar] [CrossRef] [PubMed]
- Jeon, J.; Kannan, K.; Lim, B.J.; An, K.G.; Kim, S.D. Effects of salinity and organic matter on the partitioning of perfluoroalkyl acid (PFAs) to clay particles. J. Environ. Monit. 2011, 13, 1803–1810. [Google Scholar] [CrossRef] [PubMed]
- Guelfo, J.L.; Higgins, C.P. Subsurface transport potential of perfluoroalkyl acids at aqueous film-forming foam (AFFF)-impacted sites. Environ. Sci. Technol. 2013, 47, 4164–4171. [Google Scholar] [CrossRef] [PubMed]
- Milinovic, J.; Lacorte, S.; Vidal, M.; Rigol, A. Sorption behavior of perfluoroalkyl substances in soils. Sci. Tot. Environ. 2015, 511, 63–71. [Google Scholar] [CrossRef] [PubMed]
- Du, Z.; Deng, S.; Bei, Y.; Huang, Q.; Wang, B.; Huang, J.; Yu, G. Adsorption behavior and mechanism of perfluorinated compounds on various adsorbents—A review. J. Hazard. Mater. 2014, 274, 443–454. [Google Scholar] [CrossRef]
- Hellsing, M.S.; Josefsson, S.; Hughes, A.V.; Ahrens, L. Sorption of perfluoroalkyl substances to two types of minerals. Chemosphere 2016, 159, 385–391. [Google Scholar] [CrossRef]
- Pereira, H.C.; Ullberg, M.; Kleja, D.B.; Gustafsson, J.P.; Ahrens, L. Sorption of perfluoroalkyl substances (PFASs) to an organic soil horizon—Effect of cation composition and pH. Chemosphere 2018, 207, 183–191. [Google Scholar] [CrossRef]
- Zhi, Y.; Liu, J. Sorption and desorption of anionic, cationic and zwitterionic polyfluoroalkyl substances by soil organic matter and pyrogenic carbonaceous materials. Chem. Eng. J. 2018, 346, 682–691. [Google Scholar] [CrossRef]
- Xiao, F.; Jin, B.; Golovko, S.A.; Golovko, M.Y.; Xing, B. Sorption and desorption mechanisms of cationic and zwitterionic per- and polyfluoroalkyl substances in natural soils: Thermodynamics and hysteresis. Environ. Sci. Technol. 2019, 53, 11818–11827. [Google Scholar] [CrossRef]
- Brusseau, M.L. Assessing the potential contributions of additional retention processes to PFAS retardation in the subsurface. Sci. Total. Environ. 2018, 613–614, 176–185. [Google Scholar] [CrossRef]
- Lyu, Y.; Brusseau, M.L.; Chen, W.; Yan, N.; Fu, X.; Lin, X. Adsorption of PFOA at the air-water interface during transport in unsaturated porous media. Environ. Sci. Technol. 2018, 52, 7745–7753. [Google Scholar] [CrossRef] [PubMed]
- Brusseau, M.L.; Van Glubt, S. The influence of surfactant and solution composition on PFAS adsorption at fluid-fluid interfaces. Water Res. 2019, 161, 17–26. [Google Scholar] [CrossRef] [PubMed]
- Silva, J.A.K.; Martin, W.A.; Johnson, J.L.; McCray, J.E. Evaluating air-water and NAPL-water interfacial adsorption and retention of perfluorocarboxylic acids with the vadose zone. J. Contam. Hydrol. 2019, 223, 103472. [Google Scholar] [CrossRef] [PubMed]
- Schaefer, C.E.; Culina, V.; Nguyen, D.; Field, J. Uptake of poly- and perfluoroalkyl substances at the air-water interface. Environ. Sci. Technol. 2019, 53, 12442–12448. [Google Scholar] [CrossRef] [PubMed]
- Costanza, J.; Arshadi, M.; Abriola, L.M.; Pennell, K.D. Accumulation of PFOA and PFOS at the air-water interface. Environ. Sci. Technol. Lett. 2019, 6, 487–491. [Google Scholar] [CrossRef]
- Kissa, E. Fluorinated Surfactants and Repellents, Surfactant Science Series, 97; Marcel Dekker: New York, NY, USA, 2001. [Google Scholar]
- Silva, J.A.K.; Martin, W.A.; McCray, J.E. Air-water interfacial adsorption coefficients for PFAS when present as a multi-component mixture. J. Contam. Hydrol. 2020. in review. [Google Scholar]
- Guo, B.; Zeng, J.; Brusseau, M.L. A mathematical model for the release, transport, and retention of per- and polyfluoroalkyl substances (PFAS) in the vadose zone. Wat. Resour. Res. 2020, 56, e2019WR026667. [Google Scholar] [CrossRef]
- Bradford, S.A.; Leij, R.J. Estimating interfacial areas for multi-fluid soil systems. J. Contam. Hydrol. 1997, 27, 83–105. [Google Scholar] [CrossRef]
- Bradford, S.A. Modeling the release of E. coli D21g with transients in water content. Water Resour. Res. 2015, 51, 3303–3316. [Google Scholar] [CrossRef] [Green Version]
- Bear, J. Dynamics of Fluids in Porous Media; Dover Publications, Inc.: New York, NY, USA, 1972. [Google Scholar]
- Adamson, A.W.; Gast, A.P. Physical Chemistry of Surfaces; John Wiley & Sons, Inc.: New York, NY, USA, 1997. [Google Scholar]
- Henry, E.J.; Smith, J.E.; Warrick, A.W. Surfactant effects on unsaturated flow in porous media with hysteresis: Horizontal column experiments and numerical modeling. J. Hydrol. 2001, 245, 73–88. [Google Scholar] [CrossRef]
- van Genuchten, M.T. A closed-form equation for predicting the hydraulic conductivity of unsaturated soils. Soil. Sci. Soc. Am. J. 1980, 44, 892–898. [Google Scholar] [CrossRef] [Green Version]
- Brusseau, M.L. Simulating PFAS transport influenced by rate-limited multi-process retention. Wat. Res. 2020, 168, 115179. [Google Scholar] [CrossRef] [PubMed]
- Jacques, D.; Šimůnek, J.; van Genuchten, R. Tutorial 4. Water Flow and Solute Transport in a Layered Soil Profile. Available online: https://www.pc-progress.com/Downloads/Tutorials/Tutorial_H1D_4.pdf (accessed on 14 February 2020).
- National Research Council (NRC). Contaminants in the Subsurface: Source Zone Assessment and Remediation; The National Academies Press: Washington, DC, USA, 2005. [Google Scholar] [CrossRef]
- Carsel, R.F.; Parrish, R.S. Developing joint probability distributions of soil water retention characteristics. Water Resour. Res. 1988, 24, 755–769. [Google Scholar] [CrossRef] [Green Version]
- Kakare, M.V.; Fort, T. Determination of the air-water interfacial area in wet “unsaturated” porous media. Langmuir 1996, 12, 2041–2044. [Google Scholar] [CrossRef]
- Kim, H.; Annable, M.D.; Rao, P.S.C. Determination of effective air-water interfacial area in partially saturated porous media using surfactant adsorption. Water Resour. Res. 1997, 33, 2705–2711. [Google Scholar] [CrossRef]
- Silva, J.A.K. Retention Processes Affecting VOC Vapor Transport in Water-Unsaturated Porous Media. Master’s Thesis, University of Arizona, Tucson, AZ, USA, 1997. [Google Scholar]
- Kim, H.; Rao, P.S.C.; Annable, M.D. Gaseous tracer technique for estimating air-water interfacial areas and interface mobility. Soil Sci. Soc. Am. J. 1999, 63, 1554–1560. [Google Scholar] [CrossRef]
- Anwar, A.H.M.F.; Bettahar, M.; Matsubayashi, U. A method for determining air-water interfacial area in variably saturated porous media. J. Contam. Hydrol. 2000, 43, 129–146. [Google Scholar] [CrossRef]
- Schaefer, C.E.; Dicarlo, D.A.; Blunt, M.J. Experimental measurement of air-water interfacial area during gravity drainage and secondary imbibition in porous media. Water Resour. Res. 2000, 36, 885–890. [Google Scholar] [CrossRef]
- Silva, J.A.K.; Bruant, R.G.; Conklin, M.H.; Corley, T.L. Equilibrium Partitioning of Chlorinated Solvents in the Vadose Zone, Low foc Geomedia. Environ. Sci. Technol. 2002, 36, 1613–1619. [Google Scholar] [CrossRef]
- Brusseau, M.L.; Peng, S.; Schnaar, G.; Costanza-Robinson, M.S. Relationships among air-water interfacial area, capillary pressure, and water saturation for a sandy porous medium. Water Resour. Res. 2006, 42, W03501. [Google Scholar] [CrossRef] [Green Version]
- Costanza-Robinson, M.S.; Harrold, K.H.; Lieb, R.M. X-ray microtomography determination of air-water interfacial area-water saturation relationships in sandy porous media. Environ. Sci. Technol. 2008, 42, 2949–2956. [Google Scholar] [CrossRef] [PubMed]
- Costanza-Robinson, M.S.; Brusseau, M.L. Air-water interfacial areas in unsaturated soils: Evaluation of interfacial domains. Water Resour. Res. 2002, 38, 1195–1211. [Google Scholar] [CrossRef]
- Schaefer, C.E.; Drennan, D.M.; Tran, D.N.; Garcia, R.; Christie, E.; Higgins, C.P.; Field, J.A. Measurement of aqueous diffusivities for perfluoroalkyl acids. J. Environ. Eng. 2019, 145, 06019006. [Google Scholar] [CrossRef]
- United States Environmental Protection Agency (USEPA). Fact Sheet: PFOA & PFOS Drinking Water Heath Advisories. Available online: https://www.epa.gov/ground-water-and-drinking-water/supporting-documents-drinking-water-health-advisories-pfoa-and-pfos (accessed on 2 September 2020).
- Brusseau, M.L. Estimating the relative magnitudes of adsorption to solid-water and air/oil-water interfaces for per-and polyfluoroalkyl substances. Environ. Pollut. 2019, 254, 113102. [Google Scholar] [CrossRef] [PubMed]
- Šimůnek, J.; van Genuchten, M.T.; Šejna, M. Recent developments and applications of the HYDRUS computer software packages. Vadose Zone J. 2016, 15, 1–25. [Google Scholar] [CrossRef] [Green Version]
- Baduel, C.; Mueller, J.F.; Rotander, A.; Corfield, J.; Gomez-Ramos, M.-J. Discovery of novel per- and polyfluoroalkyl substances (PFASs) at a fire fighting training ground and preliminary investigation of their fate and mobility. Chemosphere 2017, 185, 1030–1038. [Google Scholar] [CrossRef] [Green Version]
Figure 1.
(a) and (b) functions for media categories used in this work.

Figure 2.
Experimental and simulated PFOA breakthrough profiles. Experimental data from [23]. Numbers in parentheses are the values.
Figure 2.
Experimental and simulated PFOA breakthrough profiles. Experimental data from [23]. Numbers in parentheses are the values.

Figure 3.
Experimental and simulated results for PFOA transport in water-unsaturated sand: (a) Experimental and simulated breakthrough profiles at different , (b) comparison of relationshps, (c) comparison of PFOA surface tension isotherms, (d) retention dependence on provided by the modified HYDRUS simulator. All experimental data reproduced from the work of Lyu et al. [23] unless otherwise noted.

Figure 4.
Time-variable atmospheric data. Negative values indicate input to simulation domain.

Figure 5.
Illustration of the temporal changes in soil moisture and air-water interfacial area during the application of the modified HYDRUS simulator: (a) change in with depth for the loam; (b) change in with depth for the loamy sand; (c) change in with depth for the loam; (d) change in with depth for the loamy sand.

Figure 6.
Simulated PFOA (left four figures) and PFOS (right four figures) concentration profiles for unsaturated flow: (a,b) PFOA transport within loam, without and with air–water interfacial (AWI) adsorption; (c,d) PFOS transport within loam, without and with AWI adsorption; (e,f) PFOA transport within loamy sand, without and with AWI adsorption; (g,h) PFOS transport within loamy sand, without and with AWI adsorption. Solid phase sorption included in all cases.

Figure 7.
Simulated response and concentration profiles for the transport of PFOS leaching from a source area within a quartz sand vadose zone: (a) temporal change in ; (b) temporal change in ; (c) PFOS concentration profiles for solid-phase sorption but no AWI adsorption; PFOS concentration profiles for case where both solid-phase sorption and AWI adsorption occur.

Figure 8.
Calculated retardation factors for PFAS: (a) PFOA and PFOS retardation in the loam and loamy sand, (b) trends in PFOS retardation for the loam soil as and vary ( = 0 cases are without AWI adsorption).
Figure 8.
Calculated retardation factors for PFAS: (a) PFOA and PFOS retardation in the loam and loamy sand, (b) trends in PFOS retardation for the loam soil as and vary ( = 0 cases are without AWI adsorption).

Figure 9.
Pore-water concentration and mass flux of PFAS at the water table: (a) PFOS within loam; (b) PFOA within loam; (c) PFOS within loamy sand; (d) PFOA within loamy sand. Negative flux indicates flow out of the bottom of the simulation domain.
Figure 9.
Pore-water concentration and mass flux of PFAS at the water table: (a) PFOS within loam; (b) PFOA within loam; (c) PFOS within loamy sand; (d) PFOA within loamy sand. Negative flux indicates flow out of the bottom of the simulation domain.

Figure 10.
Simulated results of PFOS unsaturated transport within a layered heterogeneous vadose zone (loamy sand, silt, and model sand layers in a loam vadose zone): (a) change in with depth for the loamy sand layered system; (b) change in with depth for the loamy sand layered system; (c) PFOS transport within the loamy sand layered system; (d) change in with depth for the silt layered system; (e) change in with depth for the silt layered system; (f) PFOS transport within the silt layered system; (g) change in with depth for the model sand layered system; (h) change in with depth for the model sand layered system; (i) PFOS transport within the model sand layered system.

Figure 11.
Simulated results of PFOS-unsaturated transport within a layered heterogeneous vadose zone (loamy sand and silt layers in a model sand vadose zone): (a) change in with depth for the loamy sand layered system; (b) change in with depth for the loamy sand layered system; (c) PFOS transport within the loamy sand layered system; (d) change in with depth for the silt layered system; (e) change in with depth for the silt layered system; (f) PFOS transport within the silt layered system.

Figure 12.
Boundary conditions (a), heterogeneity structure (b), and simulated temporal changes in at 25 h (c) and 60 days (d) for the 2D simulations.
Figure 12.
Boundary conditions (a), heterogeneity structure (b), and simulated temporal changes in at 25 h (c) and 60 days (d) for the 2D simulations.

Figure 13.
2D-simulated transport of PFCAs under periodic water application at the upper boundary: (a and e) non-reactive tracer at 60 and 120 days; (b and f) PFHpA at 60 and 120 days; (c and g) PFOA at 60 and 120 days; (d and h) PFNA at 60 and 120 days. AWI adsorption is the only source of retention. Concentrations as relative concentration (C/Co) where initial concentrations (Co) were 1 mg/L for each solute.


Table 1.
Experimental Parameters derived from Lyu et al. [23].
Table 1.
Experimental Parameters derived from Lyu et al. [23].
| Parameter | Units | Value |
|---|---|---|
| Column Length | cm | 15 |
| Darcy Velocity (q) | cm hr−1 | 8.32 |
| Column Pore Volume | cm3 | 24.3 |
| Sand Bulk Density () | g cm−3 | 1.5 |
| Residual Moisture Content () | (-) | 0.078 |
| Saturated Moisture Content () | (-) | 0.33 |
| PFOA Linear Sorption Coefficient () | cm3 g−1 | 0.08 |
Note: cm is centimeters, g is grams, hr is hours.
| Media Category | l | |||||
|---|---|---|---|---|---|---|
| sand | 0.045 | 0.43 | 0.145 | 2.68 | 713 | 0.5 |
| loamy sand | 0.057 | 1.41 | 0.124 | 2.28 | 350 | 0.5 |
| sandy loam | 0.065 | 0.41 | 0.075 | 1.89 | 106 | 0.5 |
| loam | 0.078 | 0.43 | 0.036 | 1.56 | 25 | 0.5 |
| silt | 0.034 | 0.46 | 0.016 | 1.37 | 6 | 0.5 |
Note: and are shape parameters, l is the tortuosity parameter in the conductivity function, all other parameters were previously defined. d is days.
Table 3.
Additional Model Parameters.
| Parameter | Loam | Loamy Sand |
|---|---|---|
| (g cm−3) | 1.33 | 1.65 |
| (cm) | 35 | 35 |
| (PFOA, cm2d−1) | 0.47 | 0.47 |
| (PFOS, cm2d−1) | 0.47 | 0.47 |
| (PFOA, cm3 g−1) | 1.99 | 0.57 |
| (PFOS, cm3 g−1) | 15.6 | 2.62 |
| (PFOA, cm3 mol−1) | 6667 | 6667 |
| (PFOS, cm3 mol−1) | 136983 | 136983 |
| (PFOA, mol cm−2) | 5.54 × 10⁻⁷ | 5.54 × 10⁻⁷ |
| (PFOS, mol cm−2) | 3.50 × 10⁻⁷ | 3.50 × 10⁻⁷ |
Table 4.
Simulated PFAS arrival times to groundwater at 70 ng/L for soil systems considered.
| Simulation No. 1 | Soil System | PFAS | ta,70—Years (Sorption and AWI Adsorption) | ta,70—Years (Sorption Only) |
|---|---|---|---|---|
| 1 | loam | PFOS | 32.2 | 30.8 |
| 2 | loam | PFOA | 4.6 | 4.5 |
| 3 | loamy sand | PFOS | 9.3 | 6.5 |
| 4 | loamy sand | PFOA | 1.7 | 1.4 |
| 5 | model sand | PFOS | 13.6 | 0.5 |
| 6 | loam/loamy sand layers | PFOS | 28.9 | 26.2 |
| 7 | loam/silt layers | PFOS | 28.3 | 26.9 |
| 8 | loam/model sand layers | PFOS | 25.3 | 24.8 |
| 9 | model sand/loamy sand layers | PFOS | 4.9 | 1.6 |
| 10 | model sand/silt layers | PFOS | 6.6 | 1.5 |
1 in order presented.
© 2020 by the authors. Licensee MDPI, Basel, Switzerland. This article is an open access article distributed under the terms and conditions of the Creative Commons Attribution (CC BY) license (http://creativecommons.org/licenses/by/4.0/).
Share and Cite
MDPI and ACS Style
Silva, J.A.K.; Šimůnek, J.; McCray, J.E. A Modified HYDRUS Model for Simulating PFAS Transport in the Vadose Zone. Water 2020, 12, 2758. https://doi.org/10.3390/w12102758
AMA Style
Silva JAK, Šimůnek J, McCray JE. A Modified HYDRUS Model for Simulating PFAS Transport in the Vadose Zone. Water. 2020; 12(10):2758. https://doi.org/10.3390/w12102758
Chicago/Turabian StyleSilva, Jeff Allen Kai, Jiří Šimůnek, and John E. McCray. 2020. "A Modified HYDRUS Model for Simulating PFAS Transport in the Vadose Zone" Water 12, no. 10: 2758. https://doi.org/10.3390/w12102758
Note that from the first issue of 2016, this journal uses article numbers instead of page numbers. See further details here.