Institutional Framework for Modeling Water Availability and Allocation


Department of Civil and Environmental Engineering, Texas A&M University, College Station, TX 77843, USA
Water 2020, 12(10), 2767; https://doi.org/10.3390/w12102767
Submission received: 3 September 2020
/
Revised: 28 September 2020
/
Accepted: 1 October 2020
/
Published: 4 October 2020
(This article belongs to the Special Issue Feature Papers of Water Resources Management, Policy and Governance)
Abstract
:Effective water resources management requires assessments of water availability within a framework of complex institutions and infrastructure employed to manage extremely variable stream flow shared by numerous, often competing, water users and diverse types of use. The Water Rights Analysis Package (WRAP) modeling system is fundamental to water allocation and planning in the state of Texas in the United States. Integration of environmental flow standards into both the modeling system and comprehensive statewide water management is a high priority for continuing research and development. The public domain WRAP software and documentation are generalized for application any place in the world. Lessons learned in developing and implementing the modeling system in Texas are relevant worldwide. The modeling system combines: (1) detailed simulation of water right systems, interstate compacts, international treaties, federal/state/local agreements, and operations of storage and conveyance facilities, (2) simulation of river system hydrology, and (3) statistical frequency and reliability analyses. The continually evolving modeling system has been implemented in Texas by a water management community that includes the state legislature, planning and regulatory agencies, river authorities, water districts, cities, industries, engineering consulting firms, and university researchers. The shared modeling system contributes significantly to integration of water allocation, planning, system operations, and research.
1. Introduction
Effective water allocation and management requires an understanding of the reliabilities at which various quantities of water can be provided under various conditions. Modeling and analysis strategies for quantifying capabilities for supplying water needs are explored in this paper based on the experience of the Texas water management community in developing and applying a legislatively mandated water availability modeling system to support statewide planning and water allocation. The modeling system has been expanded and improved continually over the past twenty years to address evolving water management strategies and issues. Current research, development, and implementation priorities include incorporation of legislatively mandated environmental flow standards in both the modeling system and actual water management. The Brazos River Basin represents the inaugural application of the latest version of the modeling system with expanded features added to incorporate environmental flow standards and serves as a case study to illustrate the concepts and issues discussed in this paper.
The river/reservoir system simulation and frequency/reliability analysis methods presented in this paper are implemented in a comprehensive, flexible modeling system developed at Texas A&M University (TAMU) called the Water Rights Analysis Package (WRAP) [1,2,3,4,5,6]. The public domain software package is generalized for application anywhere in the world and has been employed in various other countries and states but not to the same extent as its application in Texas. A water availability modeling (WAM) system maintained by the Texas Commission on Environmental Quality (TCEQ) consists of WRAP and input datasets for all of the river basins of Texas [7,8].
Generalized computer modeling systems have played increasingly important roles in various aspects of water resources planning and management throughout the world over the past several decades [9,10]. The term “generalized” is used here to mean that the software is designed to be applied to real-world systems of various configurations at different locations by professional practitioners other than the original model developers. Generalized models should be thoroughly tested, clearly documented, and conveniently accessible. Wurbs [11], Lababie [12], Rani and Moreira [13], Lund et al. [14], and many others provide reviews of the massive literature on modeling multiple-purpose river/reservoir system operations. Most of the numerous river basin management models reported in the literature are not generalized.
Wurbs [15,16] reviews the literature on modeling reservoir/river system management and compares WRAP with other generalized modeling systems, focusing specifically on HEC-ResSim [17], RiverWare [18], and MODSIM [19]. RiverWare is marketed by the Center for Advanced Decision Support for Water and Environmental Systems (CADSWES) for a licensing fee. CADWES also provides consulting services to support application of RiverWare. HEC-ResSim, MODSIM, and WRAP software and documentation can be downloaded free-of-charge from their websites. HEC-ResSim, developed at the U.S. Army Corps of Engineers (USACE) Hydrologic Engineering Center (HEC), is applied nationwide to support operations of USACE multiple-purpose reservoir system operations, particularly flood control operations. MODSIM, developed at Colorado State University, is based on linear programming and has been applied to river/reservoir systems in many countries including systems operated by the U.S. Bureau of Reclamation in the United States. WRAP provides particular flexibility for modeling prior appropriation water rights permit systems and other institutional water allocation mechanisms. WRAP is designed for efficient modeling and analysis of large complex river systems with many hundreds of reservoirs and water users [15,16].
Expanded capabilities for assessing water availability and supply reliability have been essential to recent improvements in water management in Texas. Strategies and methods employed in Texas are applicable worldwide. Various issues that are still not fully resolved in Texas are also important in other regions of the world. The objective of this paper is to employ the Texas experience to outline water availability and allocation assessment practices proven to be effective and to highlight key complexities that have been successfully addressed along with needs for further advances. Computer-based modeling and analysis are integrated with water allocation and management.
2. Water Resources Planning, Allocation, and Management in Texas
The geographic, climatic, hydrologic, and economic diversity that spans the state of Texas combined with high population growth and progressive water management practices makes Texas an excellent laboratory for investigating water management strategies and assessment tools that are generally applicable throughout the United States and the world. Motivated by continually intensifying demands on limited water resources, the state has implemented an array of strategies over the past twenty years that have greatly improved water management [8,20,21]. Greatly expanded water availability modeling capabilities have provided essential decision support.
The 682,000 km2 area of Texas (Figure 1) is comprised of 15 major river basins and eight coastal basins located between the major rivers. Mean annual precipitation increases from west to east across Texas from 20 to 145 cm. The population increased from 3,060,000 people in 1900 to 20,950,000 in 2000, to 25,390,000 in 2010 and 29,700,000 in 2020, and is projected by the Texas Water Development Board (TWDB) to increase to 46,360,000 by 2060 [20]. Declining groundwater supplies combined with population growth are resulting in intensified demands on surface water resources [8,20].
Ground and surface water each currently provide about half of the total water supply in Texas, with a shift toward less groundwater. Groundwater is used throughout the state, though agricultural irrigation supplied from the Ogallala Aquifer in northwest Texas accounts for the largest portion of the groundwater use. Groundwater rights in Texas have been based on the common law rule allowing landowners to pump unlimited quantities of water from under their land [8,21,22]. Most land in Texas is privately owned. Increased regulation of groundwater is evolving over time primarily through the establishment of local groundwater conservation districts. The 102 diverse groundwater districts established to date cover all or part of 184 of the 254 counties of the state. These districts encourage water conservation, protect water quality, and to a limited but growing extent regulate pumping.
This paper focuses on water in streams and reservoirs. Surface water is owned by the state. A state agency, the TCEQ, regulates the diverse use of surface water by numerous users.
Allocation of stream flow in Texas evolved over several centuries of rule by Spain, Mexico, the Republic of Texas, and the State of Texas into an unmanageable assortment of diverse water rights based on various versions of the riparian and prior appropriation doctrines [22]. The waters of the Rio Grande are allocated between the U.S. and Mexico by a 1944 treaty. The economy of the Lower Rio Grande Valley is based on irrigated agriculture. A severe drought during 1950–1957 motivated massive lawsuits that resulted in judicial allocation of rights to use the Texas share of the Rio Grande. The Water Rights Adjudication Act of 1967 initiated a 25-year process of consolidating the numerous water rights for the remainder of Texas into a permit system. Texas participates with neighboring states shown in Figure 1 in interstate compacts for the following rivers and effective dates: Rio Grande—1939, Pecos—1948, Canadian—1952, Sabine—1954, and Red—1980. All of these surface water allocation schemes are reflected in the water rights system and simulated in the water availability model (WAM) system maintained by the Texas Commission on Environmental Quality (TCEQ).
Surface water rights are granted by a state license, or permit, which allows the holder to divert a specified amount of water annually at a specific location, for a specific purpose, and to store water in reservoirs of specified capacity. Any organization or person may submit an application to the TCEQ for a new water right or to change an existing water right at any time. The TCEQ will approve the permit application if unappropriated water is available, existing water rights are not impaired, efficient water conservation will be practiced, and proposed actions are consistent with regional water plans. A permit holder does not own surface water but only a right to use the water. However, water rights can be sold, leased, or transferred. Such transfers are encouraged but require TCEQ permit approval.
Water management occurs within an institutional setting that includes laws enacted by the Texas Legislature that are implemented collaboratively by government agencies, private industry, stakeholders, consulting engineering firms, university researchers, and the general public. Several legislatively mandated programs have motivated or necessitated advances in water availability modeling capabilities to support water planning, development, allocation, and management.
Omnibus water management legislation enacted by the Texas Legislature as its 1997 Senate Bill 1 (SB1) authorized a statewide and regional water planning process and creation of the WAM system to support planning and water allocation [7]. The Texas Water Development Board (TWDB) has been conducting statewide planning since the 1950s. The 1997 SB1 created a structured planning strategy that emphasizes local and regional participation. Sixteen regional water plans developed by planning groups supported by the TWDB and consulting firms and a consolidated statewide plan developed by TWDB staff in collaboration with the water management community are updated in a five-year planning cycle with a 50-year future planning horizon [20]. Reports documenting the 2002, 2007, 2012, and 2017 water plans are available at the TWDB website [23]. Work on the updated 2022 regional and statewide plans is progressing.
The 2001 Senate Bill 2 created the Texas Instream Flow Program to advance the science of environmental flows and associated management strategies [24]. The 2007 Senate Bill 3 (SB3) created a process for establishing environmental flow standards (EFS) based on best currently available science and incorporating these standards in the WAM System [25]. Periodic updates to flow standards are anticipated with advances in instream flow science and management strategies. Integration of SB3 environmental flow standards (EFS) in water management and water availability modeling is a major focus of continuing efforts to expand WRAP and the Texas WAM system.
The flow of rivers in Texas, like other regions throughout the world, is characterized by great variability that includes the extremes of intense floods and severe multiple-year droughts combined with seasonal and continuous fluctuations [26]. Large reservoir storage capacities are essential for managing flow variability and uncertainties regarding future water availability. Numerous water users share limited stream flow and reservoir storage that is used for a diversity of purposes. Multiple-purpose, multiple-reservoir system operations are fundamental to effective water management. Preserving the vitality of riverine ecosystems while supplying water, electrical energy, and other needs of growing populations and economies is a global challenge [27,28,29,30] as well as a legislatively mandated requirement in Texas [25].
3. Water Rights Analysis Package (WRAP) and Water Availability Modeling (WAM) System
The monthly version of the WRAP modeling system is routinely applied in Texas with simulation input datasets from the WAM system maintained by the TCEQ. The generalized WRAP combined with a simulation input dataset for a particular river basin is called a water availability model (WAM). Model users modify the Texas WAM system datasets to reflect water use requirements, proposed projects, and management strategies of interest. For applications outside of Texas, model users develop their own input datasets for river/reservoir systems of interest. Input datasets range from small and simple to extremely large and complex. The monthly WRAP has been routinely applied for many years while continually being expanded and improved. Integration of SB3 EFS into the WAMs and comprehensive water management has motivated development of daily modeling capabilities that are now transitioning from research and development to implementation.
3.1. Evolution of the WRAP Modeling System
Software, manuals, datasets for examples in the manuals, and other information are available free-of-charge at the TAMU WRAP website [31], which links with the TCEQ WAM website. The manuals [1,2,3,4,5,6] are published as technical reports by the Texas Water Resources Institute (TWRI) of the Texas A&M University (TAMU) System. Other WRAP-related technical reports are also available at the TWRI website [32]. The reference manual [1] includes a Bibliography of WRAP-Related Publications that lists 18 M.S. theses and ten Ph.D. dissertations by TAMU graduate students and many reports and journal and conference papers.
The predecessor to WRAP, called TAMUWRAP, was developed in a project funded by a federal/state cooperative research program administered by the U.S. Department of Interior and TWRI with the Brazos River Authority (BRA) serving as a nonfederal sponsor [1,33]. The modeling system has been continually improved and expanded since its implementation in the TCEQ WAM System [7]. The TCEQ has sponsored WRAP research and development at TAMU continuously during 1997–2003 and 2005–2021, concurrently with other WRAP-related research projects funded by other agencies. Development of methods incorporated in WRAP and research studies at TAMU using WRAP to explore various water management issues have been funded by the TCEQ, TWDB, TWRI, BRA, Texas Advanced Technology Program, U.S. Army Corps of Engineers, U.S. Department of Energy, National Institute for Environmental Global Change, and other agencies [1].
The components of WRAP routinely applied with Texas WAM datasets are based on a monthly computational time step. The May 2019 WRAP software and manuals accessible at the WRAP website expand the monthly modeling system to also include daily modeling capabilities with monthly-to-daily naturalized flow disaggregation, flow routing, forecasting, flood control reservoir operations, and instream flow standards with subsistence, base, and high-pulse flow components.
A driving motivation for the daily modeling system is the 2007 Senate Bill 3 (SB3) requirement that environmental flow standards (EFS) be established and incorporated in the TCEQ WAM system [25]. As of late 2020, SB3 EFS have been incorporated in developmental daily versions of the Brazos, Trinity, and Neches WAMs to compute daily instream flow targets that are summed to monthly targets for incorporation in the WRAP input dataset for the monthly models [34,35,36]. These daily WAM datasets and detailed technical reports are available at the TAMU WRAP website [31].
3.2. Texas Water Availability Modeling (WAM) System
The WAM System was created pursuant to the 1997 SB1 by the TCEQ, TWDB, other partner agencies, and contractors consisting of consulting engineering firms and university researchers [7]. Authorized use and current use scenario versions of 20 WRAP simulation input datasets covering all Texas river basins, an array of other information, and a link to the TAMU WRAP website are accessible at the TCEQ WAM website [37].
The TCEQ is the lead agency in maintaining the WAM System along with administrating the water rights permit system and interstate river basin compacts. Water right permit applicants, or their consultants, are required by the TCEQ to apply the WAMs to assess water supply reliabilities of proposed actions and the impacts on the reliabilities of all other water users. TCEQ staff apply the modeling system in evaluating permit applications. The TCEQ usually has over 200 water right permit applications under review at any time. Many are proposed modifications to existing permits.
The TWDB and 16 regional planning groups apply the WAMs in the regional and statewide planning process established by the 1997 SB1. River authorities and other entities apply the WAMs in operational planning studies and other endeavors. The modeling system has also been applied in U.S. Army Corps of Engineers (USACE) regulatory activities, environmental flow studies, project feasibility studies, university research studies, and other water management endeavors.
The 15 major river basins and eight coastal basins of Texas are modeled as 20 WAMs, with three WAMs containing two adjoining basins. Activities of numerous water management entities operating over 3400 dams/reservoirs and other constructed facilities in accordance with treaties between the U.S. and Mexico, five interstate compacts, two water right permit systems with 6200 active permits, federal water supply contracts, and other institutional arrangements are simulated.
Authorized and current use scenario datasets are available at the TCEQ WAM website for each of the 20 WAMs. The authorized use scenario is based on the premise that all water right permit holders use the full amounts to which they are legally entitled, subject to water availability. Many permits include projected future water needs. The current use scenario represents actual recent water use. The TWDB has developed WAM datasets representing projections of future water needs.
The modeling system contributes greatly to water management and continues to be expanded to address various issues. Modeling support for establishing SB3 EFS is currently a priority research, development, and implementation focus, along with improving capabilities for water management during drought and more efficiently updating simulation input datasets.
4. Modeling and Analysis Methodologies
WRAP simulates capabilities of river/reservoir systems in meeting specified water management, regulation, and use requirements for given sequences of naturalized stream flows and reservoir net evaporation less precipitation rates. A specified scenario of water management is combined with natural historical hydrology. Since the future is unknown, historical hydrology is used to statistically capture the hydrologic characteristics of a river basin. The water management and use scenario might be actual current water use, projected future conditions, the premise that all permit holders use their full authorized amounts, or some other scenario of interest. Simulation results are organized in optional formats including tabulations and plots of entire time sequences, summary tables, water budgets, frequency relationships, and various types of reliability indices. Water management capabilities are expressed in terms of the likelihood (reliability) of meeting water supply targets or portions thereof and stream flow and reservoir storage frequency relationships.
The WRAP modeling system includes executable computer programs that perform the functions outlined as follows.
- WinWRAP is a user interface for managing programs and data files within Microsoft Windows.
- Development of Hydrology Input Data for the Simulation Model:
- Program HYD described by the Hydrology Manual [4] develops and updates SIM input files of monthly naturalized stream flows and reservoir net evaporation-precipitation rates.
- Program DAY documented by the Daily Manual [5] is used to calibrate routing parameters and otherwise compile daily hydrology input data for SIMD.
- The Hydrologic Engineering Center (HEC) Data Storage System Visual Utility Engine (DSS-Vue) [38] is used to compile, analyze, and manage times series datasets.
- Simulation of the River/Reservoir Water Management/Allocation/Use System:
- Tracking Salinity through the River/Reservoir System:
- Post-Simulation Analyses of Simulation Results:
- HEC-DSSVue [38] reads HYD, SIM, SIMD, TABLES, and SALT DSS input and output files containing time series of hydrology input or simulation results, prepares plots, and performs mathematical and statistical analyses and other data management functions.
The well-established but still evolving WRAP simulation model SIM performs water accounting computations using a monthly time step. SIMD is a recently developed expanded version of SIM that performs the simulation computations using a daily time step. The daily SIMD maintains all capabilities of the monthly SIM while incorporating additional features for monthly-to-daily disaggregation of stream flows and water use targets, flow routing, forecasting, flood control reservoir operations, and tracking high-pulse flows defined by environmental flow standards.
The USACE Hydrologic Engineering Center (HEC) Data Storage System (DSS) has been fully integrated in WRAP for managing time series data. The latest versions of the WRAP programs create, read, and store data in DSS files. The DSS interface HEC-DSSVue [38] is an integral component of WRAP. The HEC of the USACE developed and maintains several generalized modeling systems that are extensively used by government agencies, engineering firms, and universities throughout the United States and abroad. HEC-DSS and its HEC-DSSVue interface are shared by HEC models and have also been incorporated in other non-HEC modeling systems, including WRAP.
4.1. SIM and SIMD Simulation Models
The spatial configuration of a river system is defined in the simulation model by a set of control points, with the next downstream control point being specified for each control point. All reservoirs, water supply diversions, return flows from surface and groundwater supply sources, hydroelectric power plants, instream flow requirements, and other system components are assigned control point locations. Essentially, any configuration of stream tributaries and conveyance systems may be modeled. The 20 WAMs contain over 12,000 control points of which about 500 are primary. The term “primary” control point refers to a site, usually a stream flow gauge, at which naturalized stream flows are stored in the WAM input datasets. Naturalized flows at primary control points are developed by adjusting observed flows to remove the effects of human water development and use. Naturalized flows at all other control points are computed in the simulation based on the naturalized flows at the primary control points and watershed parameters contained in the WAM datasets.
Regulated and unappropriated flows are computed in the simulation for all control points. Regulated flows represent the stream flows hypothetically occurring when historical naturalized flow sequences are repeated with the water use scenario reflected in the WAM. Unappropriated flows are the stream flows still remaining after all water rights in the WAM are allocated their appropriate shares to supply their storage and use targets. Unappropriated flows may be less than regulated flows due to instream flow requirements and appropriations by senior water rights at downstream sites.
The term “water right” is used in WRAP to refer to a set of water use requirements and associated constructed facilities and operating rules designed to supply the water use requirements. Many water right permits are modeled simply as WRAP water rights. However, a complicated actual water right permit may be simulated with multiple “model water rights”. Water use requirements and facilities that are not associated with water right permits are also modeled as “model water rights”. Flexibility is provided for simulating complicated water supply, hydropower, and instream flow target-setting criteria and reservoir system operating rules.
Texas, like most states in the western half of the United States, has a water rights system based on the prior appropriation doctrine [21,22]. Priorities are based on dates specified in the 6200 permits reflecting when the right was initially established. Most of the water rights in the WAMs reflect this priority system. However, the generalized WRAP simulation model includes flexible capabilities that include various options for assigning priorities. Subordination agreements that circumvent water right priorities are modeled. One WRAP option assigns priorities in upstream-to-downstream sequencing, modeling the riparian doctrine common in the eastern half of the U.S.
The monthly SIM and daily SIMD simulation computations are performed in a water rights priority sequence that is embedded within a computational time step loop. SIM/SIMD execution begins with reading and organizing input data. Water rights are sorted into priority order based on priority numbers and/or other user-defined options. Naturalized flows provided as input at primary control points are distributed to all other sites within the simulation based on watershed parameters. For each sequential month or day, water accounting computations are performed as each set of water use requirements (water right) is considered in priority order. Water allocation and management are modeled by accounting procedures within the water rights priority loop.
SIM or SIMD simulation results include time series of any of the computed variables. SIM generates only monthly quantities, while SIMD produces daily quantities and monthly summations of the daily quantities. The model-user selects the control points, water rights, and reservoirs for which simulation results are recorded. The simulation results time series variables include: naturalized, regulated, and unappropriated flows, stream flow depletions, and return flows for each selected control point; channel losses and channel loss credits for each selected control point representing the reach below the control point; storage volume, surface elevation, net evaporation, inflows, releases, diversions, and hydroelectric energy at each reservoir; diversion targets and shortages, return flows, available stream flows, stream flow depletions, and storage for each selected water supply right; hydropower targets, firm energy produced, secondary energy produced, energy shortages, and storage for each hydroelectric right, and flow target and shortage for each instream flow right.
The simulation model can be executed in either conventional long-term analysis or short-term conditional reliability modeling (CRM) modes. In the long-term simulation mode normally employed, a specified water management/use scenario is combined with naturalized flows and net reservoir evaporation rates covering the entire hydrologic period-of-analysis in a single simulation. The results are used to generate water supply reliability and stream flow and reservoir storage metrics without reference to present storage contents. In the short-term CRM mode, the hydrologic input is divided into multiple sequences. The simulation is automatically repeated with each hydrologic sequence starting with the same specified initial storage condition. Tables of frequency and reliability metrics from the simulation results are computed with program TABLES. For example, in a CRM analysis, the estimated probabilities of reservoir storage contents reaching various levels any specified number of months in the future conditioned upon specified initial storage levels can be computed [1,2,40].
The simulation model also has options that involve automated repetitions of the complete long-term simulation. A dual simulation option is useful in modeling multiple rights with different priorities associated with the same reservoir system. Another option sets reservoir storage contents at the beginning of a second simulation equal to the storage at the end of an initial simulation.
The TCEQ WAM System is appropriately and effectively constructed based on a monthly computational time step, which is generally optimal for most WAM applications. However, daily computations are needed to model reservoir operations during floods and to incorporate SB3 environmental flow standards (EFS), particularly high-flow pulse components, in the WAMs. The primary differences between daily SIMD and monthly SIM simulation models are as follows.
Flow rates that vary continuously over time in the real world are modeled as volumes occurring during discrete time intervals. Variability is reduced with a larger flow rate averaging time interval. Maximum flood peaks are lowered and minimum flows during low flow periods increase. Monthly flows are less variable than daily flows. Reliabilities of rights with large reservoir storage capacities are less sensitive to time step. Differences are more pronounced for rights with minimal or no storage.
Outflow equals inflow with no attenuation in a monthly SIM simulation whenever a reservoir conservation (water supply and hydropower) pool is full. SIMD simulates flood control operations of any number of reservoirs based on allowable flows at any number of downstream control points. High-flow pulses are also tracked in daily modeling of environmental flow standards.
SIMD disaggregates monthly naturalized flows based on patterns defined by inputted daily flow hydrographs while maintaining the original monthly volumes. Water supply diversions, return flows, reservoir releases, and storage refilling result in changes in stream flows at downstream locations. Flow changes propagate through the stream system in the same month in SIM. Routing in SIMD refers to the downstream propagation of these changes to stream flow. A lag and attenuation routing method is employed in SIMD. A reverse routing algorithm is also applied to replicate the effects of routing in the procedure for forecasting flow availability.
Flow forecasting makes daily computations in SIMD much more complicated than a monthly simulation. Senior water users may be adversely affected by actions of upstream junior users occurring one or more days earlier. Likewise, flood control reservoir operations are based on making no releases that contribute to flows exceeding maximum non-damaging flow limits at downstream gauges that may be located several days of flow travel time below the dam. For each day of the SIMD simulation, the final simulation is preceded by a forecast simulation covering a future forecast period that generates stream flow availability information for that current day.
4.2. Water Availability and Supply Reliability Metrics
The programs TABLES and HEC-DSSVue are used to organize SIM or SIMD simulation results in various user-specified formats, including time series plots or tabulations of selected variables, water budgets, statistical summaries, and various types of frequency relationships and reliability indices.
Options employing either relative counts or probability distribution functions are employed in TABLES and HEC-DSSVue to develop frequency relationships. Relative frequency is expressed by Equation (1) or Equation (2), where m is the rank and N is the sample size. The sample size N is the number of days, months, or years in the period-of-analysis and the rank m is the number of periods during the simulation that a particular flow, storage, or other quantity is equaled or exceeded.
Frequency analyses can be performed with WRAP for any time series variable, including any of the numerous simulation input and simulation results variables, variables derived therefrom, or other variables. Equation (1) is commonly applied with stream flow and reservoir storage quantities. With a 1940–2017 period-of-analysis, N is 936 for monthly or 28,490 for daily series of flow or storage quantities and 78 for annual series of July (or any specific month) flow or storage volume. Frequency formula, options Equations (1) and (2) are usually applied for the typically large values of N in WRAP analyses. The log-normal or log-Pearson type III probability distribution options are often applied with annual series generated in a daily SIMD simulation study, such as the minimum or maximum daily stream flow or reservoir storage volume in each year or the minimum or maximum 7-day, 30-day, or any other period stream flow in each year.
The terms “target”, “demand”, “need”, and “requirement” are used interchangeably and may refer to either water supply for municipal, industrial, agricultural, or other types of water use or hydroelectric energy generation. Volume and period reliabilities provide concise metrics for measuring capabilities for meeting water supply diversion and hydroelectric energy generation requirements. Volume reliability (RV) is the ratio of volume of water supplied or energy produced (v) to the target (V), converted to a percentage, Equation (3). Period reliability is the percentage of the total number of periods of the simulation during which the specified target is either fully supplied or at least a specified percentage of the target is supplied. Period reliability (RP) is computed by TABLES from the results of a SIM or SIMD simulation, such as Equation (4), where n denotes the number of periods (days, months, years) during the simulation for which a specified percentage of the demand target is met, and N is the total number of periods considered.
RP is an expression of the percentage of time that the full demand target or a specified percentage of the demand target can be supplied. Equivalently, RP represents the likelihood or probability of the target being met in any randomly selected month or year. Reliabilities may be tabulated with the WRAP program TABLES for all or selected individual water rights, the aggregation of all rights associated with individual control points or reservoirs, or user-selected groups of water rights.
A shortage volume in a particular month is the water supply diversion target less the simulated actual diversion as constrained by water availability. Program TABLES creates an optional vulnerability and resiliency table that includes the maximum monthly shortage, average sum of consecutive shortages, maximum number of consecutive shortages, and other shortage indices.
For new water right permits or amendments to existing permits, TCEQ criteria require that an agricultural irrigation right supply at least 75% of the proposed diversion target and at least 75% of the time computed on both a monthly and annual basis. Reliabilities of 100% are required for approval of new municipal water right permits. Existing reliabilities of senior rights are protected. Many older water rights do not meet the reliability criteria imposed on applicants for new or amended permits.
5. Brazos River Basin and Brazos Water Availability Model (WAM)
The monthly SIM or daily SIMD simulation model combined with an input dataset for the Brazos River Basin (Figure 1 and Figure 2) and adjoining San Jacinto-Brazos Coastal Basin is called a Brazos WAM. Monthly Brazos WAM authorized and current use datasets are available at the TCEQ WAM website along with monthly datasets for all Texas river basins. A daily Brazos WAM authorized use scenario dataset available at the TAMU WRAP website reflects recently expanded modeling capabilities. A detailed technical report [34] documenting development of the daily Brazos WAM and investigation of various modeling issues is available at both the WRAP and TWRI websites. Daily Trinity and Neches WAM datasets and reports [35,36] can also be downloaded from the WRAP website [31]. Conversion of other monthly WAMs to daily are planned over the next several years.
5.1. Brazos River Basin and Adjoining Brazos-San Jacinto Coastal Basin
The Brazos River Basin encompasses an area of 119,000 square kilometers (km2), with 111,000 km2 in Texas and 8000 km2 in New Mexico. The TCEQ WAM System combines the Brazos River Basin and adjoining San Jacinto-Brazos Coastal Basin in the same dataset. This coastal basin located south of the City of Houston between the Brazos and San Jacinto River Basins has a watershed area of 3000 km2. Much of the water use from diversions from the Brazos River regulated by reservoirs shown in Figure 2 occur in the coastal plain south of Houston. Mean annual precipitation varies from 48 cm in the upper Brazos River Basin which lies in the high plains to 115 cm in the lower basin in the coastal region. The San Jacinto-Brazos Coastal Basin has a mean annual precipitation of 118 cm.
Mean daily observed flow rates at the U.S. Geological Survey (USGS) gauges near the cities of Waco and Richmond during January 1900 through July 2020 and October 1922 through July 2020 respectively, are plotted as Figure 3 and Figure 4. The daily mean flows plotted in these figures reflect large long-term means but tremendous temporal variability in daily, monthly, and annual flows. The many water quantity and quality parameters included in the National Water Information System (NWIS) maintained by the U.S. Geological Survey (USGS) includes daily stream flows at 28,288 gauges, which include 1044 gauges in Texas [41]. Observed flows at 72 USGS gauges including the flows of Figure 3 and Figure 4 were used in the compilation of naturalized stream flow data for the Brazos WAM.
5.2. Water Management in the Brazos River Basin and Adjoining Coastal Basin
The Brazos River Basin contains 673 reservoirs and the coastal basin has seven reservoirs cited in water right permits, of which 43 have conservation storage capacities of 6.17 million cubic meters or greater. The 16 reservoirs listed in Table 1 and included on the map of Figure 2 are the only reservoirs in the Brazos River Basin that have a combined conservation and flood control storage capacity of greater than 100 million cubic meters. There are no reservoirs this large in the coastal basin. These 16 reservoirs contain 80% of the total conservation storage capacity of the 680 reservoirs in the Brazos WAM and supply about 40% of the total annual permitted diversion volume.
The U.S. Army Corps of Engineers (USACE) owns and operates nine multiple-purpose reservoirs (Table 1) that contain all gated flood control storage capacity in the Brazos River Basin. Nonfederal sponsors control the storage capacity allocated to water supply and reimburse all costs allocated to water supply [42].
USACE flood control operations occur whenever lake levels rise above the top of the conservation pool and are based on non-damaging flow limits at downstream gauges. No releases are made that contribute to flows exceeding 708 cubic meters per second (m3/s) at the Waco gauge, 1700 m3/s at the Richmond gauge, or other specified non-damaging flow limits at other gauges. The effects of flood control operations of Whitney and Waco Reservoirs, with initial impoundment in 1951 and 1965 (Table 1), on flows at the gauge on the Brazos River near Waco are pronounced in Figure 3 because the gauge is located a short distance below the dams. The gauge on the Brazos River near Richmond is located significant distances downstream of all nine of the USACE flood control reservoirs. The effects of the dams are not as clearly evident in the flows at the Richmond gauge in Figure 4.
Water right permits authorize the use of stream flow to fill reservoir storage and supply water needs subject to specified conditions. Water right priorities reflecting the dates that stream flow was first appropriated or permit applications submitted range from 29 June 1914 to near the present for the Brazos River Basin and adjoining coastal basin. Over 1000 entities that include a river authority, water districts, cities, private companies, farmers, and other appropriators hold 1220 water right permits that authorize annual diversions totaling 3.05 billion m3/year in the Brazos Basin and coastal basin for municipal (47.6%), industrial (30.1%), agricultural irrigation (18.0%), and other (4.3%) uses.
The Brazos River Authority (BRA) has contracted for the conservation storage capacity in the nine federal reservoirs, owns three other existing reservoirs, and holds a water right permit for a proposed reservoir that is not yet constructed. The BRA also owns and operates regional water and wastewater treatment and water conveyance facilities. The BRA sells water under contract to cities, industries, and farmers subject to authorizations defined in the multiple water right permits held by the BRA. The City of Waco has multiple water right permits for Lake Waco, though the BRA is the nonfederal sponsor for the water supply storage in the federal reservoir. The BRA holds water right permits for the 11 other reservoirs of the 12-reservoir USACE/BRA system.
Hydroelectric energy is generated at Whitney Reservoir. Essentially all releases through the hydropower turbines are diverted downstream for municipal, industrial, or agricultural use. The conservation pool includes storage for head for hydropower as well as water supply. The electricity is marketed through a U.S. Department of Energy agency to a local electric power cooperative.
Environmental flow standards (EFS) have been established at the 19 USGS gauge sites on the Brazos River and its tributaries shown in Figure 2 following the process established pursuant to Senate Bill 3 (SB3) enacted by the Texas Legislature in 2007 [25,43]. An officially constituted expert science team [44] developed recommended EFS considering only environmental needs that were then refined by a stakeholder committee [45] based on consideration of all water needs. The science team and stakeholder committee submitted their recommendations to the TCEQ for final public and agency review, approval, and publication in the Texas Water Code [43]. The SB3 EFS include subsistence, base, and in-bank and overbank high-pulse flow components that vary seasonally and with hydrologic conditions. The procedures, reports, and other relevant information regarding establishment of SB3 EFS for the Brazos and other river basins are accessible at the TCEQ WAM website. The SB3 process for establishing EFS includes periodic review and improvement of the EFS.
5.3. Water Availability Model (WAM) for the Brazos River Basin and Adjoining Coastal Basin
The Brazos WAM simulates operation of 680 reservoirs and other facilities in accordance with 1220 water right permits. The authorized use scenario simulation with results presented in Section 5.4 is based on the premise that all water right holders appropriate the full amounts allowed in their water rights permits. Current use and other water use scenarios can also be simulated. The hydrologic period-of-analysis is January 1940 through December 2017. The 1940–2017 monthly naturalized flows at 77 control points provided in the simulation input dataset are disaggregated to daily and distributed to over 3000 other sites during the simulation.
SB3 EFS are incorporated the daily SIMD. Daily instream flow targets computed in a SIMD simulation in accordance with the EFS specifications are summed to monthly quantities within SIMD and recorded in a DSS file. The monthly targets are incorporated in the monthly SIM input dataset.
SB3 EFS are inserted in the WAM datasets with a priority based on the date that the designated science team and stakeholder committee submit recommendations to the TCEQ. The Brazos SB3 EFS were adopted in 2014 with a priority date of 1 March 2012. Existing senior water right permit holders are not affected. However, the SB3 EFS significantly reduce WAM simulated unappropriated flows available for future water right permit applicants.
The monthly SIM or daily SIMD simulation is based on the premise that water use requirements are supplied subject to water availability during each of the 936 months or 28,490 days of the 1940–2017 hydrologic period-of-analysis. The 1940–2017 naturalized flows provided as simulation input represent the stream flows that would have occurred naturally without human water resources development and use. Frequency and reliability metrics are computed from simulation results.
5.4. Simulation Results
SIM and SIMD simulation results can be massive. The modeling system provides flexible capabilities for organizing, analyzing, and displaying simulation results. Application of the modeling system in planning and administration of the water right permit process typically focuses on developing water supply reliability metrics for specific water rights of interest and assessing effects of these rights on the reliabilities of other water rights. Brazos WAM simulation results are used here in a more general basin-wide total manner to illustrate the concepts and issues discussed.
The mean, standard deviation, and quantities with specified exceedance frequencies (Equation (1)) for observed, naturalized, regulated, and unappropriated flows in cubic meters per second (m3/s) at the Richmond gauge (Figure 2) for the 28,490 days or 936 months of the 1940–2017 hydrologic period-of-analysis are tabulated in Table 2. Metrics for daily and monthly means of observed and naturalized flows are tabulated in columns 2, 3, 4, and 5. Regulated and unappropriated flows computed alternatively in daily SIMD and monthly SIM simulations are compared in columns 6–11. SIMD simulation results include both simulated daily (columns 6 and 8) and aggregated monthly (columns 7 and 9) quantities. Statistics for monthly SIM results are presented in columns 10 and 11.
The characteristics of observed versus naturalized versus simulated regulated flows of the Brazos River at the Richmond gauge site (Figure 2) are reflected in the statistics of Table 2. The 1220 water rights in the Brazos WAM reduce the mean flow of 228 m3/s at the basin outlet for natural undeveloped conditions to 181 m3/s for the simulated scenario of all water rights appropriating their authorized amounts. The frequency statistics indicate that unappropriated flows can be expected to be zero much of the time, which implies that significant reservoir storage capability is required to achieve acceptable levels of water supply reliability for additional new or increased water rights. The averaging effects of monthly versus daily computational time steps can also be observed in Table 2.
Daily SB3 EFS instream flow targets at the Richmond gauge near the outlet computed in the daily SIMD simulation are plotted in Figure 5. The monthly SIM simulation of Table 2 and Figure 6 includes SB3 EFS flow targets from the daily SIMD simulation for the 19 sites shown in Figure 2 computed as a function of regulated flow, season of the year, and hydrologic condition, as specified by the SB3 EFS with subsistence, base, and high-pulse flow components [25,34,43]. The SB3 EFS do not affect water rights with seniority dates earlier than 1 March 2012. In the model, junior rights with priority dates later than this date curtail actions that adversely affect meeting the requirements defined by the SB3 EFS.
Summations of SIMD end-of-day and SIM end-of-month storage contents of the 680 reservoirs in the Brazos WAM from daily and monthly simulations are plotted in Figure 6. These plots reflect operation of the 680 reservoirs, most of which were constructed during the 1950s through 1980s, to supply water use targets authorized by the 1220 presently active water right permits during an assumed repetition of 1940–2017 hydrology. Storage in individual reservoirs is of interest in most applications and tends to fluctuate much more than the total storage in 680 reservoirs.
Reservoir storage contents provide a meaningful drought index. The most hydrologically severe drought in the Brazos River Basin since before 1940 began gradually in 1950 and ended with major widespread flooding in April 1957, as shown in Figure 6. The more economically costly 2010–2014 drought and other less-severe dry periods are also evident in the storage plots. The residents of the Brazos River Basin, and most other areas of Texas, and the water management community have never experienced a drought as hydrologically severe as 1950–1957 with present population, economic development, and associated water needs. Water planning and management is based on a drought more hydrologically severe than 1950–1957 occurring at some unknown time in the future.
The 1940–2017 mean annual natural flow of the Brazos River near its outlet is 236% of the annual diversions, totaling 3.05 billion cubic meters per year authorized by the 1220 water right permits modeled in the Brazos WAM. The majority of the flow occurs during periods of high flows or floods. Reservoir storage is essential for reliable water supplies. The volume reliability, RV in Equation (3), for the 3.05 billion m3/year aggregation of all water supply diversion rights authorized by the 1220 water right permits are 79.1% and 87.6% respectively, in the daily and monthly simulations.
6. Hydrologic and Institutional Aspects of Water Management and Modeling Thereof
Important considerations and issues encountered in assessing water availability and supply reliability statewide and allocating stream flow and reservoir storage among numerous water users and diverse types of use are highlighted as follows. The Brazos WAM serves as an example to illustrate key concepts and issues. Two distinctly different but integrally interconnected topics are addressed: (1) water management and (2) modeling and analysis of water management.
6.1. Hydrologic Variability and Stationarity
Variability and stationarity of precipitation, reservoir evaporation, and stream flow are key considerations affecting water management and assessments of water availability. Hydrologic variability includes continuous fluctuations and seasonal changes along with the extremes of intense floods and severe multiple-year droughts. Hydrologic variability and associated water supply reliability, flood risk, and future uncertainty are fundamental to water management and modeling thereof. Stationarity, or lack thereof (non-stationarity), refers to long-term homogeneity over time with no permanent changes or trends. Stationarity of naturalized stream flows and other variables is also important in water availability modeling and water management.
The TWDB maintains a database updated annually of January 1940 to near-present mean monthly precipitation rates and January 1954 to near-present monthly reservoir water surface evaporation rates for each of 92 one-degree quadrangles that encompass the state [4,26]. The databases are used along with data from other sources to develop simulation input datasets of net reservoir evaporation less precipitation rates for the WAMs. Evaporation–precipitation volumes are computed in the simulation model by multiplying fluctuating reservoir surface areas by evaporation less adjusted precipitation rates which exhibit year-to-year as well as great seasonal variability.
Evaporation is a major component of reservoir water budgets and important consideration in water management and water availability assessments. For comparison, the simulated long-term mean annual evaporation volume from the over 3400 reservoirs statewide has been computed with the WAMs to be a volume equivalent to 61% of the year 2010 actual annual total agricultural or 126% of the total municipal water use from all surface and groundwater sources in Texas [46].
The WRAP program HYD includes routines for managing the TWDB precipitation and reservoir evaporation rate datasets and performing statistical frequency and trend analyses of the data for individual quadrangles and statewide averages [4]. Long-term trends or permanent changes in 1940–2019 precipitation or 1954–2019 evaporation characteristics are not evident from time series plots and regression analyses of the 92 TWDB datasets reflecting spatial averaging over one-degree longitude by one-degree latitude quadrangle areas. Any long-term trends that may exist are hidden by the great continuous variability. Statewide averages of monthly precipitation and reservoir water surface evaporation rates in centimeters (cm) per month are plotted in Figure 7 and Figure 8.
The observed daily flows of the Brazos River at the USGS gauges near Waco and Richmond plotted in Figure 3 and Figure 4 illustrate the tremendous variability of river flows throughout Texas, including throughout the Brazos River Basin. Extremes of multiple-year droughts and major floods are combined with seasonal and continuous fluctuations.
Construction and operation of dams and other facilities, water supply diversions, return flows from surface and groundwater supply sources, and other aspects of population and economic growth significantly affect stream flow, with the resulting changes varying greatly between locations [26]. For example, the flows of the San Antonio River below the City of San Antonio and the San Jacinto River below Houston have increased significantly over the past 100 years as a result of wastewater treatment plant effluent accompanying increased water supply from groundwater and inter-basin conveyance and increase impervious land cover due to urbanization. The flow of the Rio Grande has deceased greatly due to construction of reservoirs and development of irrigated agriculture. The Brazos and Trinity Rivers are representative of many rivers that have experienced a decrease in flood flows due to flood control reservoirs and raising of low flows due to return flows from municipal and industrial water use. Flow immediately below dams is greatly affected by reservoir operations, but the effects diminish with distance downstream, as illustrated by Figure 3 and Figure 4.
The WRAP/WAM modeling process consists of computational adjustments that convert observed flows to naturalized flows input to a simulation model that generates regulated and unappropriated flows reflecting a specified scenario of water resources development, allocation, management, and use. The process of naturalizing flows consists of removing non-stationarities. Removal of all non-stationarities is not feasible. However, the Texas experience in developing the WAMs indicates that long-term changes in flow characteristics are due primarily to major reservoir projects and major water supply diversions and return flows, which are included in the flow naturalization adjustments adopted in compilation of the WAM simulation input datasets. Based on statistical trend analyses and time series plots, the naturalized flows in the WAMs representing past natural conditions are considered to generally be reasonably free of long-term changes or trends.
Effects of long-term future climate change on hydrology and water management throughout the world are explored extensively in the literature. The Brazos WAM and San Jacinto River Basin WAM were combined with global climate model precipitation and evaporation output and a watershed precipitation-runoff model in university research studies to evaluate the impacts of future climate change scenarios on water availability [47,48]. Modeling uncertainties were found to be too great to derive meaningful conclusions regarding future climatic and hydrologic conditions in these studies. Neilson-Gammon et al. [49] assess the risk and consequences of unprecedented future drought conditions occurring in Texas during the latter half of the 21st century due to climate change.
6.2. Water Management Community
Assessments of water availability are performed within a complex water management community of diverse entities with different responsibilities and roles. WRAP and its input datasets in the WAM system were developed and are employed within the Texas water management community.
With over 3000 employees, the TCEQ is the largest state environmental regulatory agency in the U.S. Along with its many other responsibilities, the TCEQ administers five interstate river basin compacts and two water right permit systems for (1) the Texas share of the waters of the Rio Grande and (2) the remainder of Texas. The TCEQ leadership role in developing, maintaining, and expanding the WAM system stems from its water allocation responsibilities.
Both a regional and statewide planning process and creation of the WAM system were authorized by comprehensive water management legislation enacted in 1997 as Senate Bill 1 and now commonly referenced as SB1. Sixteen regional plans and a statewide plan updated in a five-year cycle forecasts water needs and water availability at 10-year intervals for 50 years into the future and presents plans for dealing with deficits. The TWDB in collaboration with regional planning groups is responsible for SB1 regional and statewide planning and assists local water supply entities in financing water projects. TCEQ approval of applications for new water right permits or amendments to existing permits requires that proposed actions be consistent with SB1 statewide and relevant regional water plans. The shared WAM system contributes significantly to integration of planning and water allocation.
The TWDB manages the Texas Instream Flow Program (TIFP) authorized by the 2001 SB2 to improve capabilities for preserving stream flows for environmental needs. Recognizing that many years will be required to develop all of the needed assessment methods and water management strategies, the 2007 SB3 initiated procedures for incorporating EFS in the WAMs based on best currently available expert opinion and information, subject to continuing review and improvement. A science team and stakeholder committee in collaboration with the TCEQ established the SB3 ESF for the Brazos River Basin following SB3 protocols [43,44,45]. Science teams are comprised of hydrologists and ecological scientists from universities, consulting firms, and government agencies. Stakeholder committees are constituted to represent a diverse range of interests that include municipal, industrial, and agricultural water users, electric utilities, recreation, environmental protection, and other relevant sectors.
The Brazos River Authority (BRA), created in 1931, is the oldest of the 19 Texas river authorities and has water management responsibilities for a river basin with an area larger than many states in the U.S. and countries in the world. The 19 river authorities of Texas were created by the Texas Legislature. They are funded primarily through their sale of water supply services and electricity to other public and private entities. River authorities hold many of the water rights that include larger storage and diversion quantities. Unlike the TCEQ and TWDB, the river authorities own and operate reservoir projects, water treatment and conveyance facilities, and other constructed infrastructure.
Many cities and private entities hold their own water right permits issued by the TCEQ. Other cities, private companies, and farmers purchase water from river authorities or water districts that hold the required TCEQ-administered water right permits. Some larger cities supply neighboring smaller cities. Municipal water districts are created through cooperative agreements of multiple cities. Farmers may purchase water from irrigation districts. The numerous water districts are similar to river authorities but have more narrowly defined responsibilities.
The U.S. Congress in the Flood Control Act of 1936 charged the U.S. Army Corps of Engineers (USACE) with construction and operation of flood control projects nationwide at federal expense. The USACE is also responsible for inland navigation. Water supply is a local responsibility. The Water Supply Act of 1958 authorized inclusion of water supply storage in multiple-purpose federal reservoirs subject to all costs allocated to water supply being reimbursed to the federal government by nonfederal sponsors [42]. The USACE owns and operates over 500 reservoirs nationwide. Nine of the 27 USACE reservoirs in Texas are located in the Brazos River Basin. The USACE contracts with nonfederal sponsors that control the portion of reservoir storage capacity allocated to water supply but provides no commitment regarding the availability of water to fill the storage capacity. The USACE is not directly involved with obtaining or administering water rights.
The USACE also administers a permit program under authority of Section 404 of the Clean Water Act of 1977 regulating construction activities affecting rivers, streams, and wetlands. The use of the WRAP/WAM system to evaluate Section 404 permit applications for construction of water supply projects in Texas is being investigated by the USACE Fort Worth and Galveston District Offices.
Water right permit applicants, regional planning groups, and various other entities routinely hire consulting engineering firms to perform professional services that include WRAP/WAM simulation studies. The many consulting firms that have employed WAMs for various clients range in size from firms consisting of one professional engineer to regional firms with staff of several hundred professionals working in offices in multiple Texas cities to international companies, with many thousands of people distributed between many different offices in Texas and throughout the world.
The Water Resources Act of 1964 authorized establishment of a water institute at a university in each state to facilitate federal/state partnerships in research and extension. These state institutes comprise the National Institutes for Water Resources (NIWR) network managed by the U.S. Geological Survey (USGS) at the federal level. The Texas Water Resources Institute (TWRI) of the Texas A&M University System represents Texas in the NIWR network. The WRAP modeling system originated from a university research project sponsored by this federal/state partnership program.
The membership of the Texas Water Conservation Association (TWCA) is comprised of water management professionals employed by the many public and private entities mentioned in the preceding paragraphs. The WRAP Committee of the TWCA provides recommendations to the TCEQ and its contractor (TAMU represented by this author) regarding water management issues and needs for expanded modeling and analysis capabilities and reviews research and development products. Eleven WRAP user group conferences held since 2006 have been attended by water professionals from the TCEQ, TWDB, river authorities, water districts, other state and federal agencies, engineering firms, and universities. WRAP training sessions are conducted periodically.
The author was the recipient of the Research and Innovation Award of the American Academy of Water Resources Engineers (AAWRE) presented at the 20th American Society of Civil Engineers (ASCE) Environmental and Water Resources Institute (EWRI) World Water Congress in 2019 for his role in development of WRAP and its implementation in the Texas WAM System.
6.3. Water Allocation
As demands on limited resources intensify, water allocation through water right permit systems, interstate compacts, international treaties, federal/state/local agreements, and environmental protection programs grows in importance and significantly affects water availability. The WRAP modeling system includes flexible features for simulating diverse water allocation mechanisms.
Water allocation systems equitably apportion water among users, protect existing water users from having their supplies diminished by new users, govern the sharing of limited water resources during droughts when supplies are inadequate to meet all needs, and facilitate efficient use of water resources. Each of the 50 states in the U.S. has developed its own rules and practices, which have evolved historically and continue to change [42,43]. Western and eastern states have generally adopted different approaches to water rights due largely to the western states having much drier climates. Most states treat allocation of groundwater versus surface water very differently.
Water flowing in the Rio Grande and stored in International Amistad and Falcon Reservoirs on the Rio Grande are jointly controlled by the Mexico and U.S. Sections of the International Boundary and Water Commission (IBWC). Flow and storage are allocated between the two nations by a 1944 treaty. The IBWC maintains an accounting of storage in Amistad and Falcon Reservoirs, inflows, water supply and hydropower releases, spills, and evaporation allocated to Mexico and to the U.S. Texas participates in interstate river basin compacts with New Mexico, Oklahoma, Arkansas, and Louisiana for allocation of the water resources of the Rio Grande, Pecos, Canadian, Red, and Sabine Rivers. The WAMs simulate allocation of water between Texas and its neighbors, allocate the Texas share to all individual water rights in Texas, but do not further sub-allocate the water allocated to the other states and Mexico.
Legal rights to the use of stream flow in the U.S. are generally based on two alternative doctrines, riparian and prior appropriation [43]. The basic concept of the riparian doctrine is that water rights are incidental to the ownership of land adjacent to a stream. The prior appropriation doctrine is based on protecting senior water users from having their supplies diminished by newcomers developing water supplies later in time. In a prior appropriation system, rights are not inherent in land ownership, and priorities are established based on dates that water is appropriated.
Variations of the riparian doctrine are applied in 29 states in the eastern and central U.S. The prior appropriation doctrine governs water rights in 19 western states, including Texas. Ten of these states, including Texas, originally recognized riparian rights but later converted to prior appropriation while preserving existing riparian rights. Hawaii and Louisiana have their own unique water right systems. Most of the western states have established permit systems in which a state agency issues permits to water right holders specifying amounts and conditions of water use. With growing demands on limited water resources, permit systems will likely continue to be developed in the eastern states similar to those already in place in the drier western states [22,50,51].
Several western states have water-master operations for real-time management of water rights, but most states do not. The TCEQ Rio Grande Water Master Office has administered accounting of water use, working closely with irrigators, cities, and the IBWC, since the 1970s. The Brazos River Basin water-master office was established in 2015. However, water master operations have not yet been established for the majority of Texas river basins. The TCEQ administers curtailment actions during drought and takes enforcement action any time to stop reported unauthorized water use but does not otherwise closely monitor water use. Establishment of additional TCEQ water master offices for individual river basins with more detailed monitoring and accounting procedures continues to be investigated.
With the exception of the Rio Grande, water allocation priorities are set by dates specified in water right permits that reflect dates water was initially appropriated. Priorities for flow and storage in the lower Rio Grande are based on type of use as well as historical use. Modeling priority systems is an essential fundamental requirement for the WAMs. WRAP includes flexible options for both simulating variations of the prior appropriation water rights doctrine and alternatively appropriating water in an upstream-to-downstream sequence consistent with the riparian rights doctrine.
6.4. Reservoir System Operations
A Brazos River Authority (BRA) system operation permit with accompanying water management plan approved by the TCEQ in November 2016 significantly increased water supply capabilities based on an expanded understanding of reliability provided by the WRAP/WAM modeling system. The amount of water that BRA supplies under contracts with wholesale water customers is constrained by its water right permits. BRA water rights were established historically for individual reservoir projects near the time of their construction. The new system operations permit credits the BRA with using unregulated flow entering the river system below the dams and return flows from BRA wastewater treatment plants in coordination with releases from eleven reservoirs that balance storage between the reservoirs.
One key basic concept of the system operation permit and water management plan is that for a particular level of reliability, the total quantity of water provided by multiple reservoirs operated as a system is greater than the summation of quantities provided by the reservoirs with each operated individually. Storage contents can be balanced in multiple reservoirs to minimize the risk that any one reservoir is emptied and thus unable to supply demands. The hydrologic characteristics of large river basins include spatial variability of the timing of low flow conditions at different locations.
Another key system operations concept is to execute water supply contracts that commit different levels of reliability, called firm and interruptible, for different types of water use and available alternative water supply sources. Municipal water supplies require a high level of reliability. Farmers may prefer to increase the amount of water normally available in many years for irrigation even though the risk of shortages during drought years increase. Declining groundwater sources limit groundwater use. However, infrequent increased use of groundwater can be combined with commitments for increased surface water use most of the time.
For example, the Lower Colorado River Authority (LCRA) operates a system of six reservoirs on the Colorado River to supply water for Austin and other cities for municipal and industrial use at a high level of reliability and water to farmers in the lower basin for agricultural irrigation at significantly lower levels of reliability. LCRA agreements with farmers for irrigation water are based on setting allocations at the beginning of the annual irrigation season based on the storage contents of the reservoirs. The irrigators received no water during the extremely dry 2011. This water allocation strategy and most of the reservoirs did not exist during the historic 1950–1957 drought.
The older LCRA and recent BRA system operation permits and water management plans reflect the tradeoffs that occur between the amount of water committed for beneficial use and the level of reliability that can be achieved. If water commitments are limited as required to ensure an extremely high level of dependability, much of the water resource flows to the ocean or is lost through reservoir evaporation much of the time. WAM studies in the various river basins indicate that quantities that may be supplied change greatly with relatively small changes in reliability requirements. The amount of water supplied from Texas river systems can be increased significantly by accepting higher risks of shortages or emergency demand reductions.
Reuse of returns flows is another important system operations consideration. The BRA system operation permit application process included extensive public review and comment. Several cities expressed concerns that BRA was claiming their wastewater treatment effluent. The final approved permit credits the BRA with reuse of only return flows from its own regional wastewater treatment plants. The WAMs have also been applied in exploring the effects of access by different entities to wastewater treatment plant return flows in the City of Austin on the Colorado River and the Dallas and Fort Worth metropolitan area in the upper Trinity River Basin.
6.5. Major Limitations of the Modeling System
Complexities discussed throughout this paper impose limitations on both computer modeling and water management. Several diverse constraints on modeling capabilities for assessing water availability and allocation are highlighted as follows.
Stream flow is extremely variable. A monthly computational time step has been concluded to be optimal for modeling water allocation and management from the perspective of municipal, industrial, agricultural, and other types of water use. However, daily computations are required to adequately capture the effects of flow variability from the perspectives of flood control reservoir operations and environmental instream flow standards, particularly high-pulse flow components of the standards. As noted in Section 4.2, flow routing and forecasting are employed with a daily model, though not relevant in a monthly model. Flow routing and forecasting are highly approximate. Calibration of routing parameters for stream reaches has been found to be complex and inaccurate.
Losses of flow in river reaches due to seepage and evapotranspiration are considered in the downstream translation of flow changes due to water right actions in both the monthly and daily versions of the model. The loss computation methodology is simplistic due to difficulties in both simulating the relevant physical processes and determining values for input parameters.
Conjunctive management of surface and ground water, or lack thereof, is an important issue in both water management and modeling thereof. Fundamental hydrologic and institutional differences prevent combining surface and ground water in the same simulation model. Unlike surface water, groundwater ownership is inherent in land ownership. Conjunctive management of water from ground and surface water is constrained by differences in allocation policies. Physical hydrologic processes and fundamental modeling strategies and methods are also very different between these interconnected components of the hydrologic cycle.
Water availability for beneficial use depends upon water quality as well as quantity. For example, the water supply capabilities of several large reservoirs in Texas are severely constrained by salinity from natural salt deposits in geologic formations in the Permian Basin geologic region that underlies the upper watersheds of the Rio Grande, Pecos, Brazos, Red, and Canadian River Basins in New Mexico, Oklahoma, and the north Texas panhandle. Stream flows have high concentrations of chlorides, sulfates, and other dissolved minerals in the upper reaches of these river systems that are diluted by low-salinity tributary inflows in the middle and lower basins. A salinity simulation component of the WRAP modeling system has been developed motivated by the natural salt pollution and applied with the monthly Brazos WAM to explore effects of salinity on water supply capabilities [6,39]. However, much more research is needed to improve capabilities for assessing the impacts of natural salt pollution and other water quality issues on water availability and allocation for beneficial use.
A pure prior appropriation water rights system is not feasible for many reasons. For example, although the WRAP simulation model allows reservoir storage and water supply diversions to be assigned different priorities, in most water right permits, a single priority date is assigned in a permit granting the right to both store and divert water. Reservoir operation in Texas is based on long-term storage as a protection against severe multiple-year droughts. The supply reliability of a reservoir is diminished if upstream junior appropriators reduce inflows when the reservoir is not completely full and spilling. However, forcing junior appropriators to curtail their water use to maintain inflows to an almost full or even significantly drawn-down reservoir is difficult and not necessarily the optimal use of the water resource. This is an example of a water policy issue that is difficult to resolve though potential solution strategies can be easily simulated in the model.
7. Conclusions
Quantitative probability-based assessments of water availability are essential for effective water allocation and management. Modeling of institutional mechanisms as well as river system hydrology and operation of dams/reservoirs and other constructed facilities are necessary in assessments of water availability. Successful implementation of the Texas WAM System required collaborative efforts of a large and diverse water management community. The shared use of the modeling system has significantly contributed to integrating water allocation, planning at statewide, regional, project feasibility, and operational levels, research and development, and other water management endeavors.
Assessments of water availability and supply reliability are performed with the WRAP/WAM system in three stages: (1) compilation and continuing updating of simulation input datasets, (2) performing simulations, and (3) organizing and analyzing relevant frequency and reliability metrics and other information from the simulation results. Water availability assessment applications usually involve revising simulation input datasets to reflect changes in water use requirements or different proposed projects or management strategies of interest. The simulation model combines extremely variability natural river system hydrology, complex operations of constructed infrastructure, and water allocation systems that grow in importance with increasing demands on limited resources.
The generalized Water Rights Analysis Package (WRAP) modeling system is applicable in any place in the world and reflects flexibility and practicality necessitated by its evolution within the Texas water management community. Lessons learned from the Texas experience in creating and employing a water availability modeling system are relevant worldwide.
Funding
This research received no external funding.
Acknowledgments
Many agencies and professionals in the Texas water management community have contributed to the evolution of the WRAP/WAM modeling system over the past 30 years. However, the information and conclusions presented in the paper are the responsibility of the author without implication of official endorsement by any of these agencies or individuals.
Conflicts of Interest
The author declares no conflict of interest.
References
- Wurbs, R.A. Water Rights Analysis Package Modeling System Reference Manual, 12th ed.; Technical Report (TR) 255; Texas Water Resources Institute: College Station, TX, USA, 2019; 462p, Available online: https://twri.tamu.edu/publications/technical-reports/2019-technical-reports/tr-255/ (accessed on 1 October 2020).
- Wurbs, R.A. Water Rights Analysis Package Modeling System Users Manual, 12th ed.; TR-256; Texas Water Resources Institute: College Station, TX, USA, 2019; 272p, Available online: https://twri.tamu.edu/publications/technical-reports/2019-technical-reports/tr-256/ (accessed on 1 October 2020).
- Wurbs, R.A. Fundamentals of Water Availability Modeling with WRAP, 9th ed.; TR-283; Texas Water Resources Institute: College Station, TX, USA, 2019; 114p, Available online: https://twri.tamu.edu/publications/technical-reports/2019-technical-reports/tr-283/ (accessed on 1 October 2020).
- Wurbs, R.A. Water Rights Analysis Package River System Hydrology, 3rd ed.; TR-431; Texas Water Resources Institute: College Station, TX, USA, 2019; 215p, Available online: https://twri.tamu.edu/publications/technical-reports/2019-technical-reports/tr-431/ (accessed on 1 October 2020).
- Wurbs, R.A.; Hoffpauir, R.J. Water Rights Analysis Package Daily Modeling System; TR-430; Texas Water Resources Institute: College Station, TX, USA, 2019; 430p, Available online: https://twri.tamu.edu/publications/technical-reports/2019-technical-reports/tr-430/ (accessed on 1 October 2020).
- Wurbs, R.A. Salinity Simulation with WRAP; TR-317; Texas Water Resources Institute: College Station, TX, USA, 2009; 87p. [Google Scholar]
- Wurbs, R.A. Texas water availability modeling system. J. Water Resour. Plan. Manag. 2009, 131, 270–279. [Google Scholar] [CrossRef]
- Wurbs, R.A. Sustainable statewide water resources management in Texas. J. Water Resour. Plan. Manag. 2015, 141, A4014002. [Google Scholar] [CrossRef]
- Wurbs, R.A. Water Management Models; Pearson/Prentice-Hall Publishing: Upper Saddle River, NJ, USA, 1995; 245p. [Google Scholar]
- Wurbs, R.A. Dissemination of generalized water resources models in the United States. Water Int. 1998, 23, 190–198. [Google Scholar] [CrossRef]
- Wurbs, R.A. Modeling and Analysis of Reservoir System Operations; Pearson/Prentice-Hall: Upper Saddle River, NJ, USA, 1996; 372p. [Google Scholar]
- Labadie, J.W. Optimal operation of multireservoir systems: State-of-art review. J. Water Resour. Plan. Manag. 2004, 130, 93–111. [Google Scholar] [CrossRef]
- Rani, R.; Moreira, M.M. Simulation-optimization modeling: A survey and potential applications in reservoir system operation. Water Resour. Manag. 2010, 24, 1107–1138. [Google Scholar] [CrossRef] [Green Version]
- Lund, J.R.; Hui, R.; Escriva-Bou, A.; Porse, E.; Adams, L.; Connaughton, J.; Kasuri, L.; Lord, B.; Siegfried, L.; Thayer, R.; et al. Chapter 130 Reservoir operation design. In Handbook of Applied Hydrology; Singh, V.P., Ed.; McGraw Hill: New York, NY, USA, 2017. [Google Scholar]
- Wurbs, R.A. Comparative Evaluation of Generalized River/Reservoir System Models; TR-282; Texas Water Resources Institute (TWRI): College Station, TX, USA, 2005; 203p. [Google Scholar]
- Wurbs, R.A. Chapter 1 Generalized models of river system development and management. In Current Issues in Water Management; Uhlig, U., Ed.; InTech: Rijeka, Croatia, 2011; pp. 1–22. Available online: https://www.intechopen.com/books/current-issues-of-water-management/generalized-models-of-river-system-development-and-management (accessed on 1 October 2020).
- U.S. Army Corps of Engineers Hydrologic Engineering Center. HEC-ResSim. Available online: https://www.hec.usace.army.mil/software/hec-ressim/ (accessed on 1 October 2020).
- Center for Advances Decision Support for Water and Environmental Systems. RiverWare. Available online: https://www.riverware.org/ (accessed on 1 October 2020).
- Colorado State University. MODSIM Decision Support System. Available online: http://modsim.engr.colostate.edu/ (accessed on 1 October 2020).
- Texas Water Development Board. Water for Texas 2017; Texas Water Development Board: Austin, TX, USA, 2017. [Google Scholar]
- Sahs, M.K. (Ed.) Essentials of Texas Water Resources, 6th ed.; State Bar of Texas, Environmental and Natural Resources Law Section: Austin, TX, USA, 2020. [Google Scholar]
- Wurbs, R.A. Water rights in Texas. J. Water Resour. Plan. Manag. 1995, 121, 447–454. [Google Scholar] [CrossRef]
- Texas Water Development Board Planning. Available online: https://www.twdb.texas.gov/waterplanning/index.asp (accessed on 1 October 2020).
- National Research Council. The Science of Instream Flows: A Review of the Texas Instream Flow Program; National Academies Press: Washington, DC, USA, 2005. [Google Scholar]
- Wurbs, R.A. Incorporation of environmental flows in water allocation in Texas. Water Int. Int. Water Resour. Assoc. 2017, 42, 18–33. [Google Scholar] [CrossRef]
- Wurbs, R.A.; Zhang, Y. River System Hydrology in Texas; TR-461; TWRI: College Station, TX, USA, 2014; 442p, Available online: https://twri.tamu.edu/publications/technical-reports/2014-technical-reports/tr-461/ (accessed on 1 October 2020).
- Gippel, C.J.; Cosier, M.; Markar, S.; Liu, C. Balancing environmental flows needs and water supply reliability. Int. J. Water Resour. Dev. 2009, 25, 331–353. [Google Scholar] [CrossRef]
- O’Keefe, J. Chapter 4 Environmental Flow Allocation as a Practical Aspect of Integrated Water Resources management. In River Conservation and Management; Boon, P.J., Raven, P.J., Eds.; John Wiley & Sons: Hoboken, NJ, USA, 2012. [Google Scholar]
- Jain, S.K.; Acreman, M.C. Chapter 134 Environmental flows. In Handbook of Applied Hydrology; Singh, V.P., Ed.; McGraw-Hill: New York, NY, USA, 2016. [Google Scholar]
- Wohl, E. Forgotten legacies: Understanding and mitigating historical human alterations of river corridors. Water Resour. Res. 2019, 55, 181–201. [Google Scholar] [CrossRef] [Green Version]
- Water Rights Analysis Package. Available online: https://ceprofs.civil.tamu.edu/rwurbs/wrap.htm (accessed on 1 October 2020).
- Texas Water Resources Institute Publications. Available online: http://twri.tamu.edu/publications/ (accessed on 1 October 2020).
- Wurbs, R.A.; Walls, W.B. Water rights modeling and analysis. J. Water Resour. Plan. Manag. 1989, 115, 416–430. [Google Scholar] [CrossRef]
- Wurbs, R.A. Daily Water Availability Model for the Brazos River Basin and San Jacinto-Brazos Coastal Basin; TR-513; Texas Water Resources Institute: College Station, TX, USA, 2019; 238p, Available online: https://twri.tamu.edu/publications/technical-reports/2019-technical-reports/tr-513/ (accessed on 1 October 2020).
- Wurbs, R.A. Daily Water Availability Model for the Trinity River Basin; Texas Commission on Environmental Quality: Austin, TX, USA, 2019; 193p. [Google Scholar]
- Wurbs, R.A. Daily Water Availability Model for the Neches River Basin; Texas Commission on Environmental Quality: Austin, TX, USA, 2020; 198p. [Google Scholar]
- Texas Commission on Environmental Quality, Water Availability Modeling System. Available online: https://www.tceq.texas.gov/permitting/water_rights/wr_technical-resources/wam.html (accessed on 1 October 2020).
- Hydrologic Engineering Center. HEC-DSSVue HEC Data Storage System Visual Utility Engine, User’s Manual; Version 2, CPD-79; U.S. Army Corps of Engineers: Davis, CA, USA, 2009. Available online: https://www.hec.usace.army.mil/ (accessed on 1 October 2020).
- Wurbs, R.A.; Lee, C.H. Salinity in water availability modeling. J. Hydrol. 2011, 409, 451–459. [Google Scholar] [CrossRef]
- Wurbs, R.A.; Schnier, S.T.; Olmos, H.E. Short-term reservoir storage frequency relationships. J. Water Resour. Plan. Manag. 2012, 138, 597–605. [Google Scholar] [CrossRef]
- United States Geological Survey (USGS) National Water Information System (NWIS). Available online: https://waterdata.usgs.gov/nwis (accessed on 1 October 2020).
- Wurbs, R.A. Chapter 137 Institutional framework for water management. In Handbook of Applied Hydrology; Singh, V.P., Ed.; McGraw-Hill: New York, NY, USA, 2016. [Google Scholar]
- Texas Commission on Environmental Quality. Chapter 298 Environmental Flow Standards for Surface Water. Subchapter G: Brazos River and Its Associated Bay and Estuary System; Texas Water Code: Austin, TX, USA, 2014. Available online: https://www.tceq.texas.gov/assets/public/legal/rules/rules/pdflib/298g.pdf (accessed on 1 October 2020).
- Brazos River Basin and Bay Expert Science Team. Environmental Flow Regime Recommendations Report; Final Submission to the Brazos River Basin and Bay Area Stakeholder Committee, Environmental Flows Advisory Group, and Texas Commission on Environmental Quality: Austin, TX, USA, March 2012. Available online: https://www.tceq.texas.gov/assets/public/permitting/watersupply/water_rights/eflows/brazos_bbest_complete_document.pdf (accessed on 1 October 2020).
- Brazos River and Associated Bay and Estuary System Basin and Bay Stakeholders Committee. Environmental Flow Standards and Strategies Recommendations Report; Brazos River and Associated Bay and Estuary System Basin and Bay Stakeholders Committee: Austin, TX, USA, 2012. Available online: https://www.tceq.texas.gov/assets/public/permitting/watersupply/water_rights/eflows/brazos_bbasc_report_8_22_2012_bbasc.pdf (accessed on 1 October 2020).
- Wurbs, R.A.; Ayala, R.A. Reservoir evaporation in Texas, USA. J. Hydrol. 2014, 510, 1–9. [Google Scholar] [CrossRef]
- Muttiah, R.S.; Wurbs, R.A. Modeling the impacts of climate change on water supply reliabilities. Water Int. 2002, 27, 407–419. [Google Scholar] [CrossRef]
- Wurbs, R.A.; Muttiah, R.S.; Felden, F. Incorporation of climate change in water availability modeling. J. Hydrol. Eng. 2005, 10, 375–385. [Google Scholar] [CrossRef]
- Neilsen-Gammon, J.W.; Banner, J.L.; Cook, B.I.; Tremaine, D.M.; Wong, C.I.; Mace, R.E.; Gao, H.; Yang, Z.L.; Gonzales, M.F.; Hoffpauir, R.; et al. Unprecedented drought challenges for Texas water resources in a changing climate: What do researchers and stakeholders need to know? J. Earth’s Future 2020, 8. [Google Scholar] [CrossRef]
- Tarlock, A.D.; Corbridge, J.N.; Getches, D.A. Water Resource Management: A Casebook in Law and Public Policy, 6th ed.; Foundation Press: New York, NY, USA, 2009. [Google Scholar]
- Getches, D.H. Water Law in a Nutshell, 4th ed.; Thomson/Reuters: St. Paul, MN, USA, 2009. [Google Scholar]
Figure 1.
Map of major rivers and largest cities in Texas.

Figure 2.
Sixteen largest reservoirs and nineteen gauge sites with SB3 EFS in the Brazos River Basin [27].
Figure 2.
Sixteen largest reservoirs and nineteen gauge sites with SB3 EFS in the Brazos River Basin [27].

Figure 3.
January 1900 through July 2020 daily flow of Brazos River at Waco gauge.

Figure 4.
October 1922 through July 2020 daily flow of Brazos River at Richmond gauge.

Figure 5.
Daily minimum instream flow targets for SB3 EFS at Richmond gauge on the Brazos River.

Figure 6.
Summation of total storage contents of the 680 reservoirs in the monthly SIM (blue solid line) and daily SIMD (red dotted line) simulations.
Figure 6.
Summation of total storage contents of the 680 reservoirs in the monthly SIM (blue solid line) and daily SIMD (red dotted line) simulations.

Figure 7.
Statewide average monthly precipitation rates.

Figure 8.
Statewide average monthly reservoir evaporation rates.


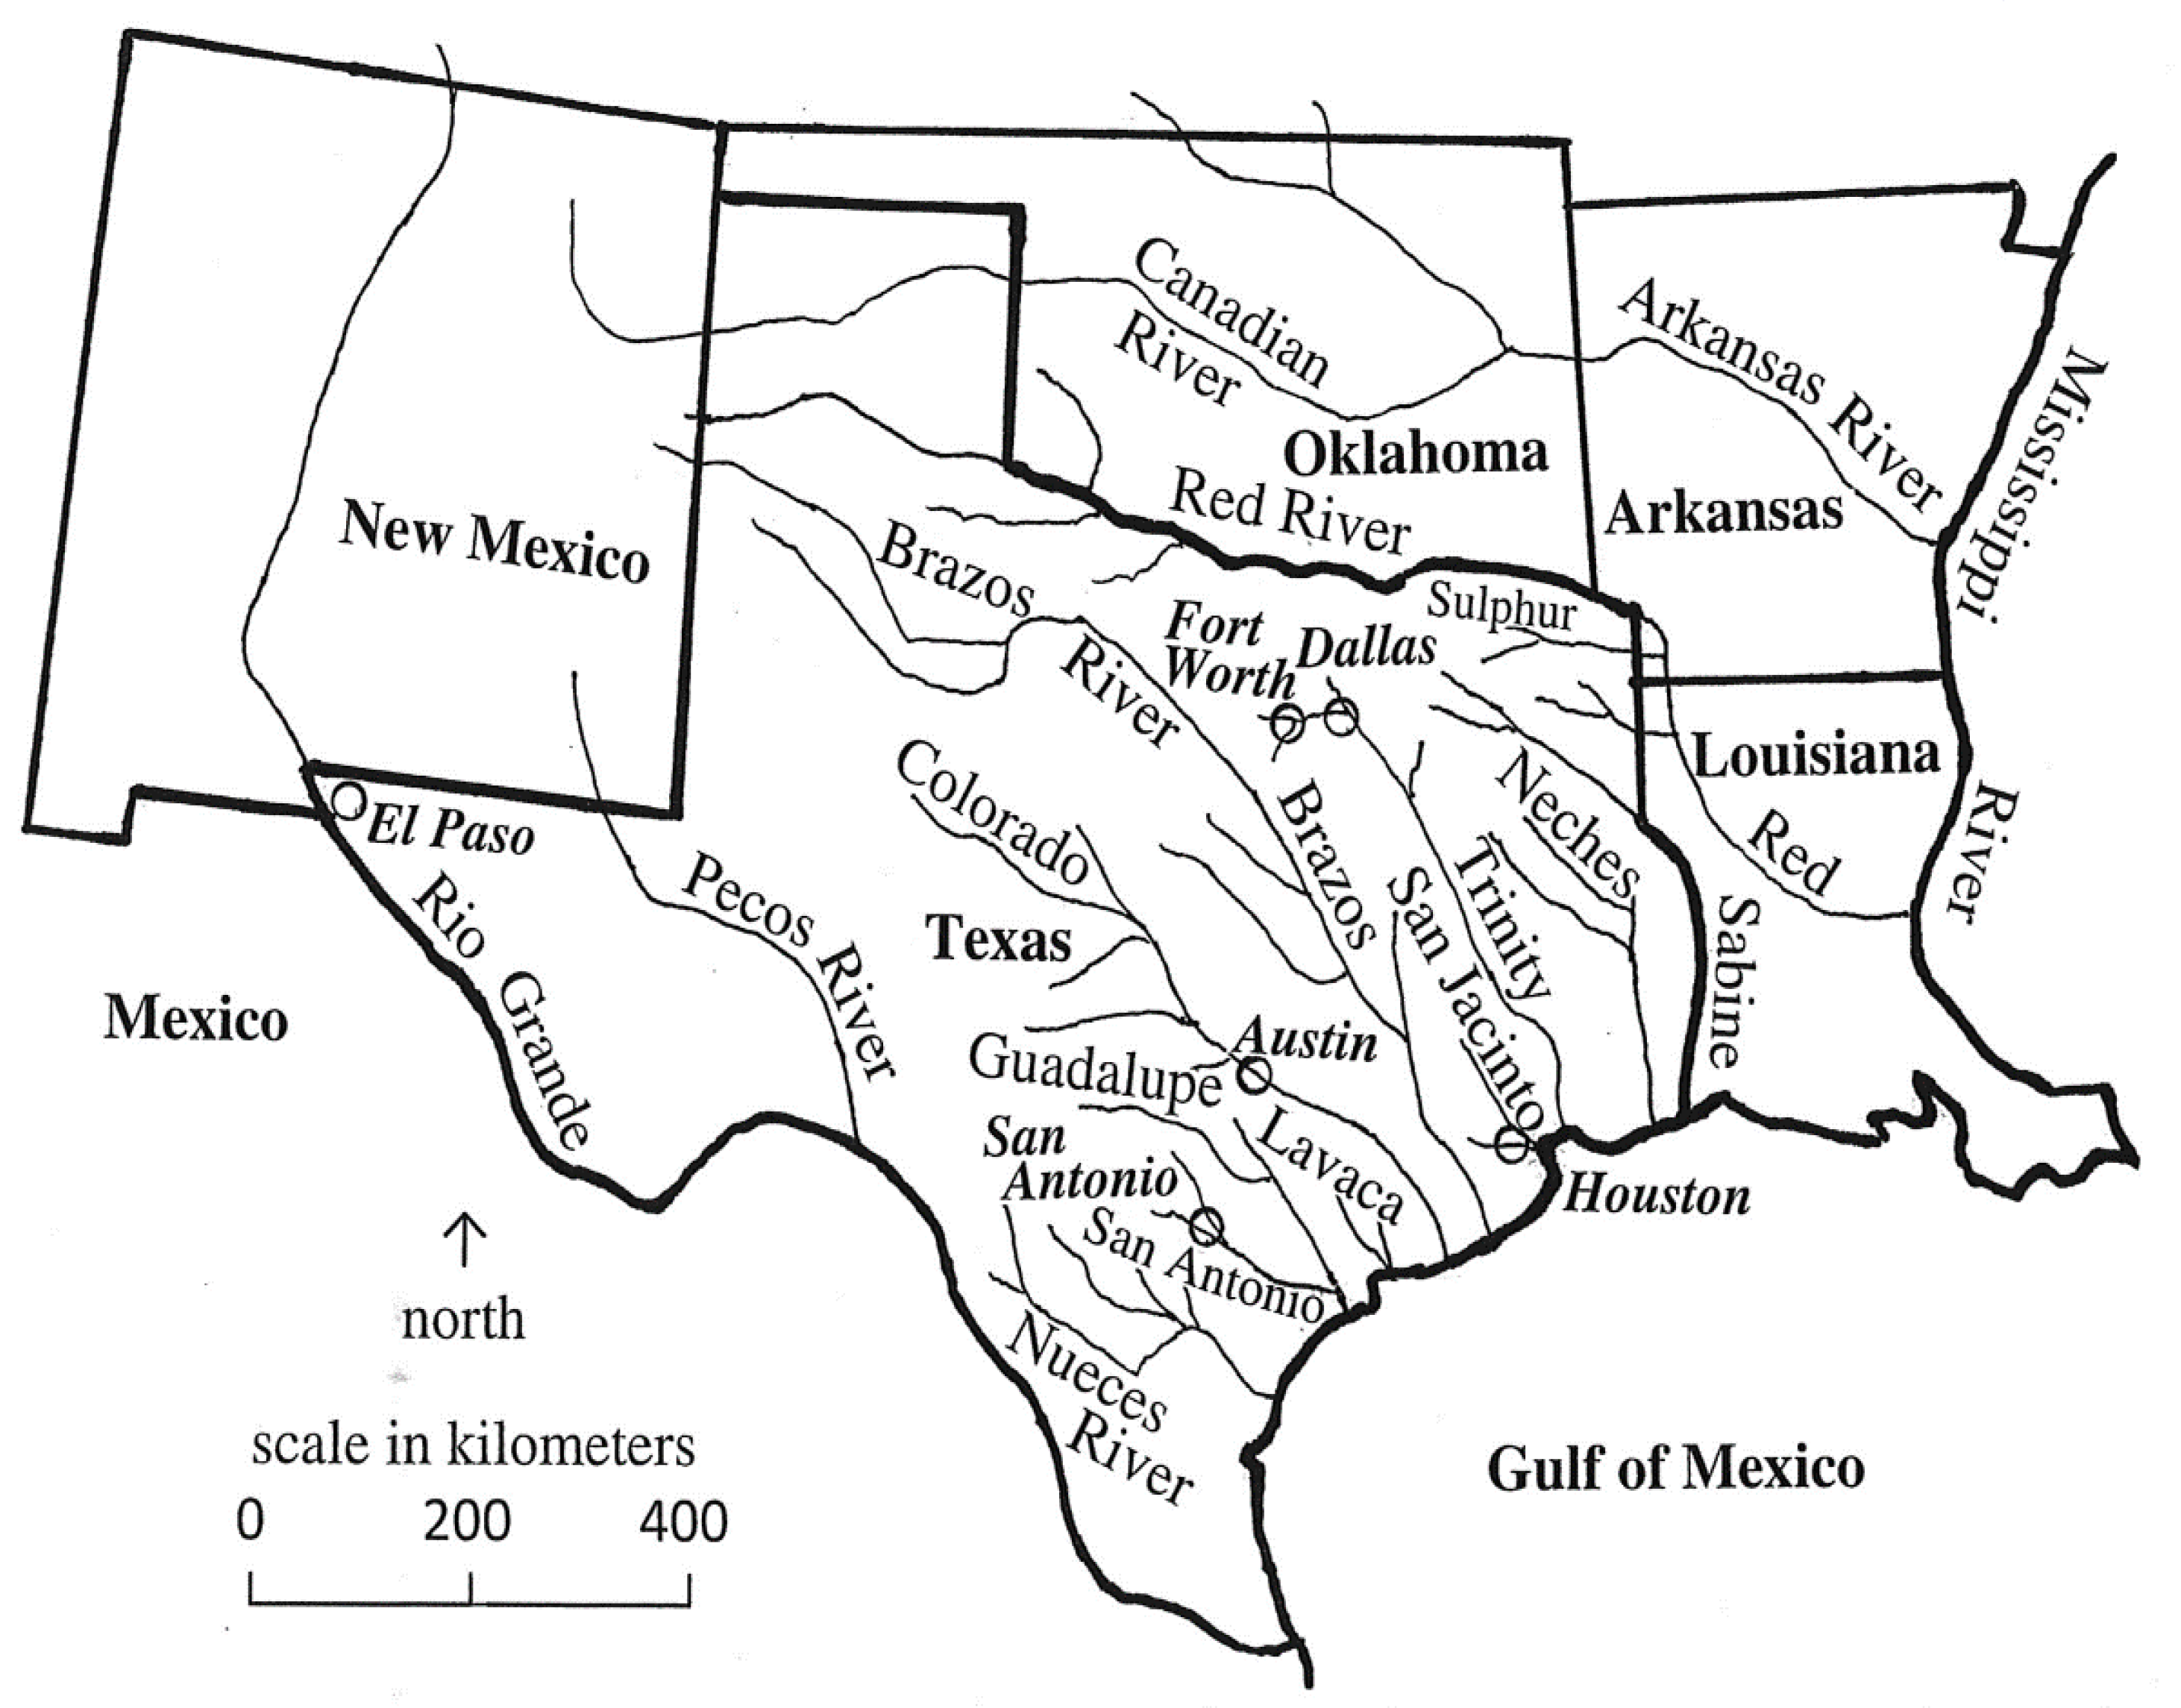
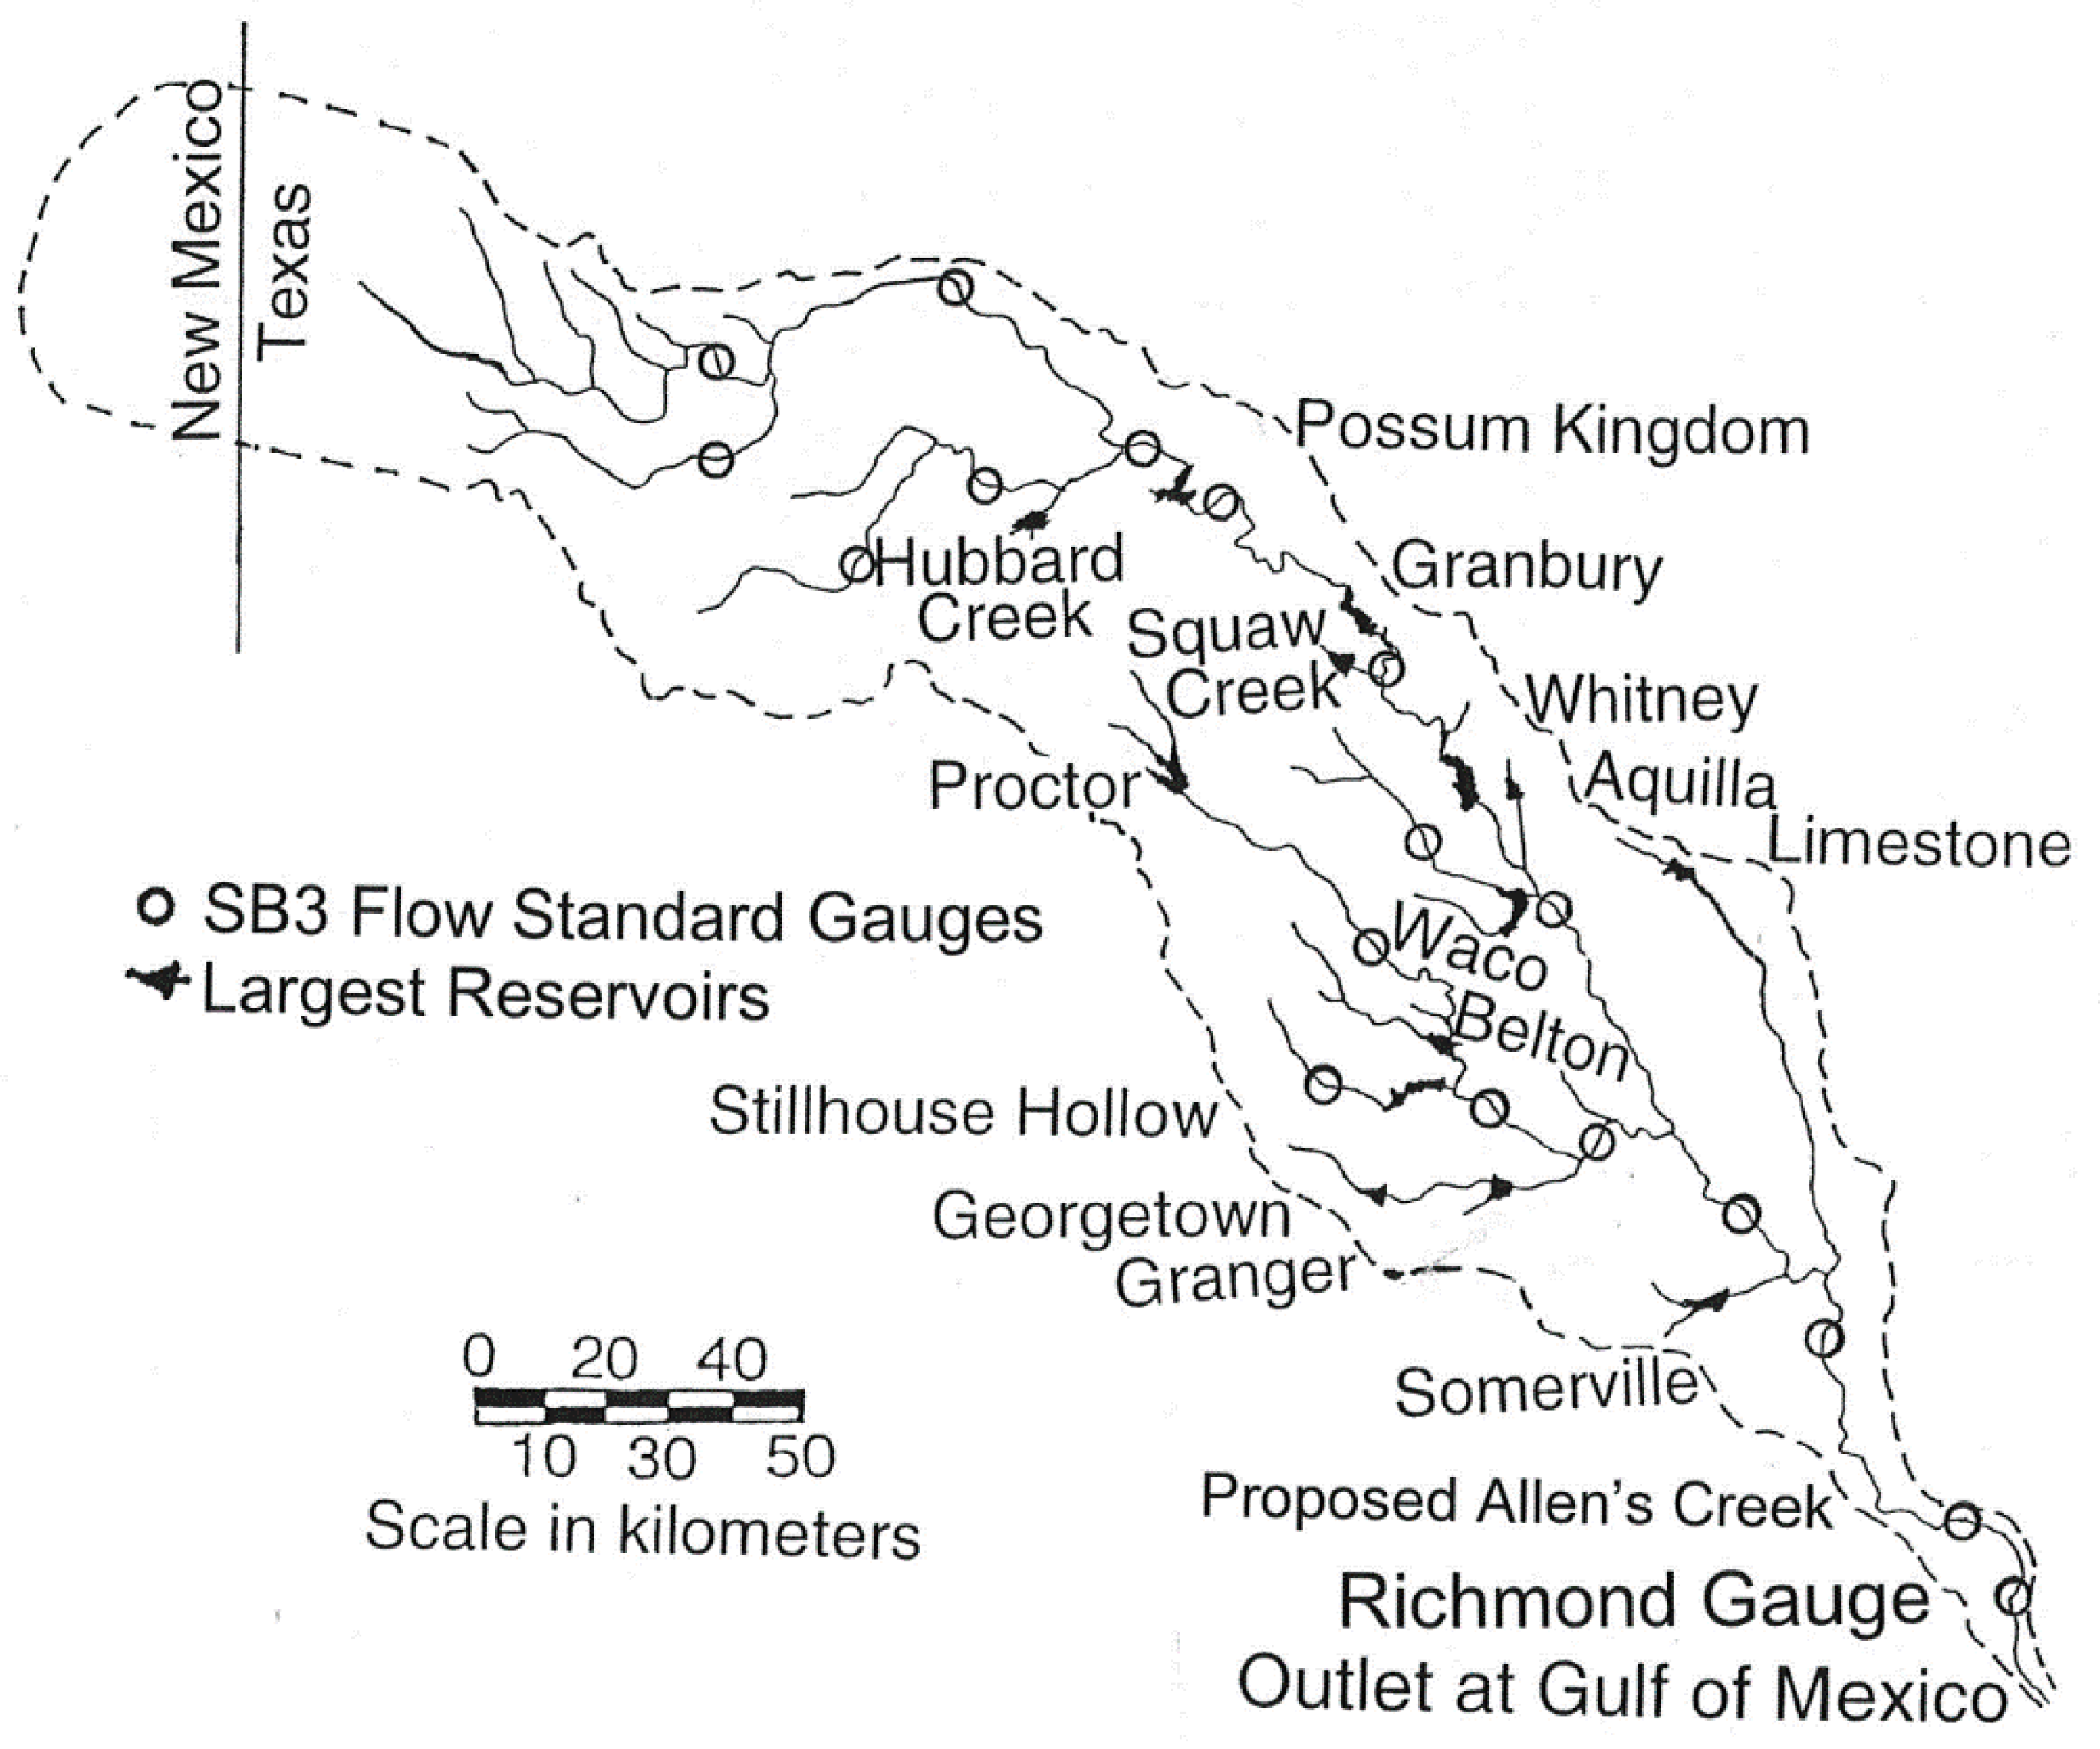
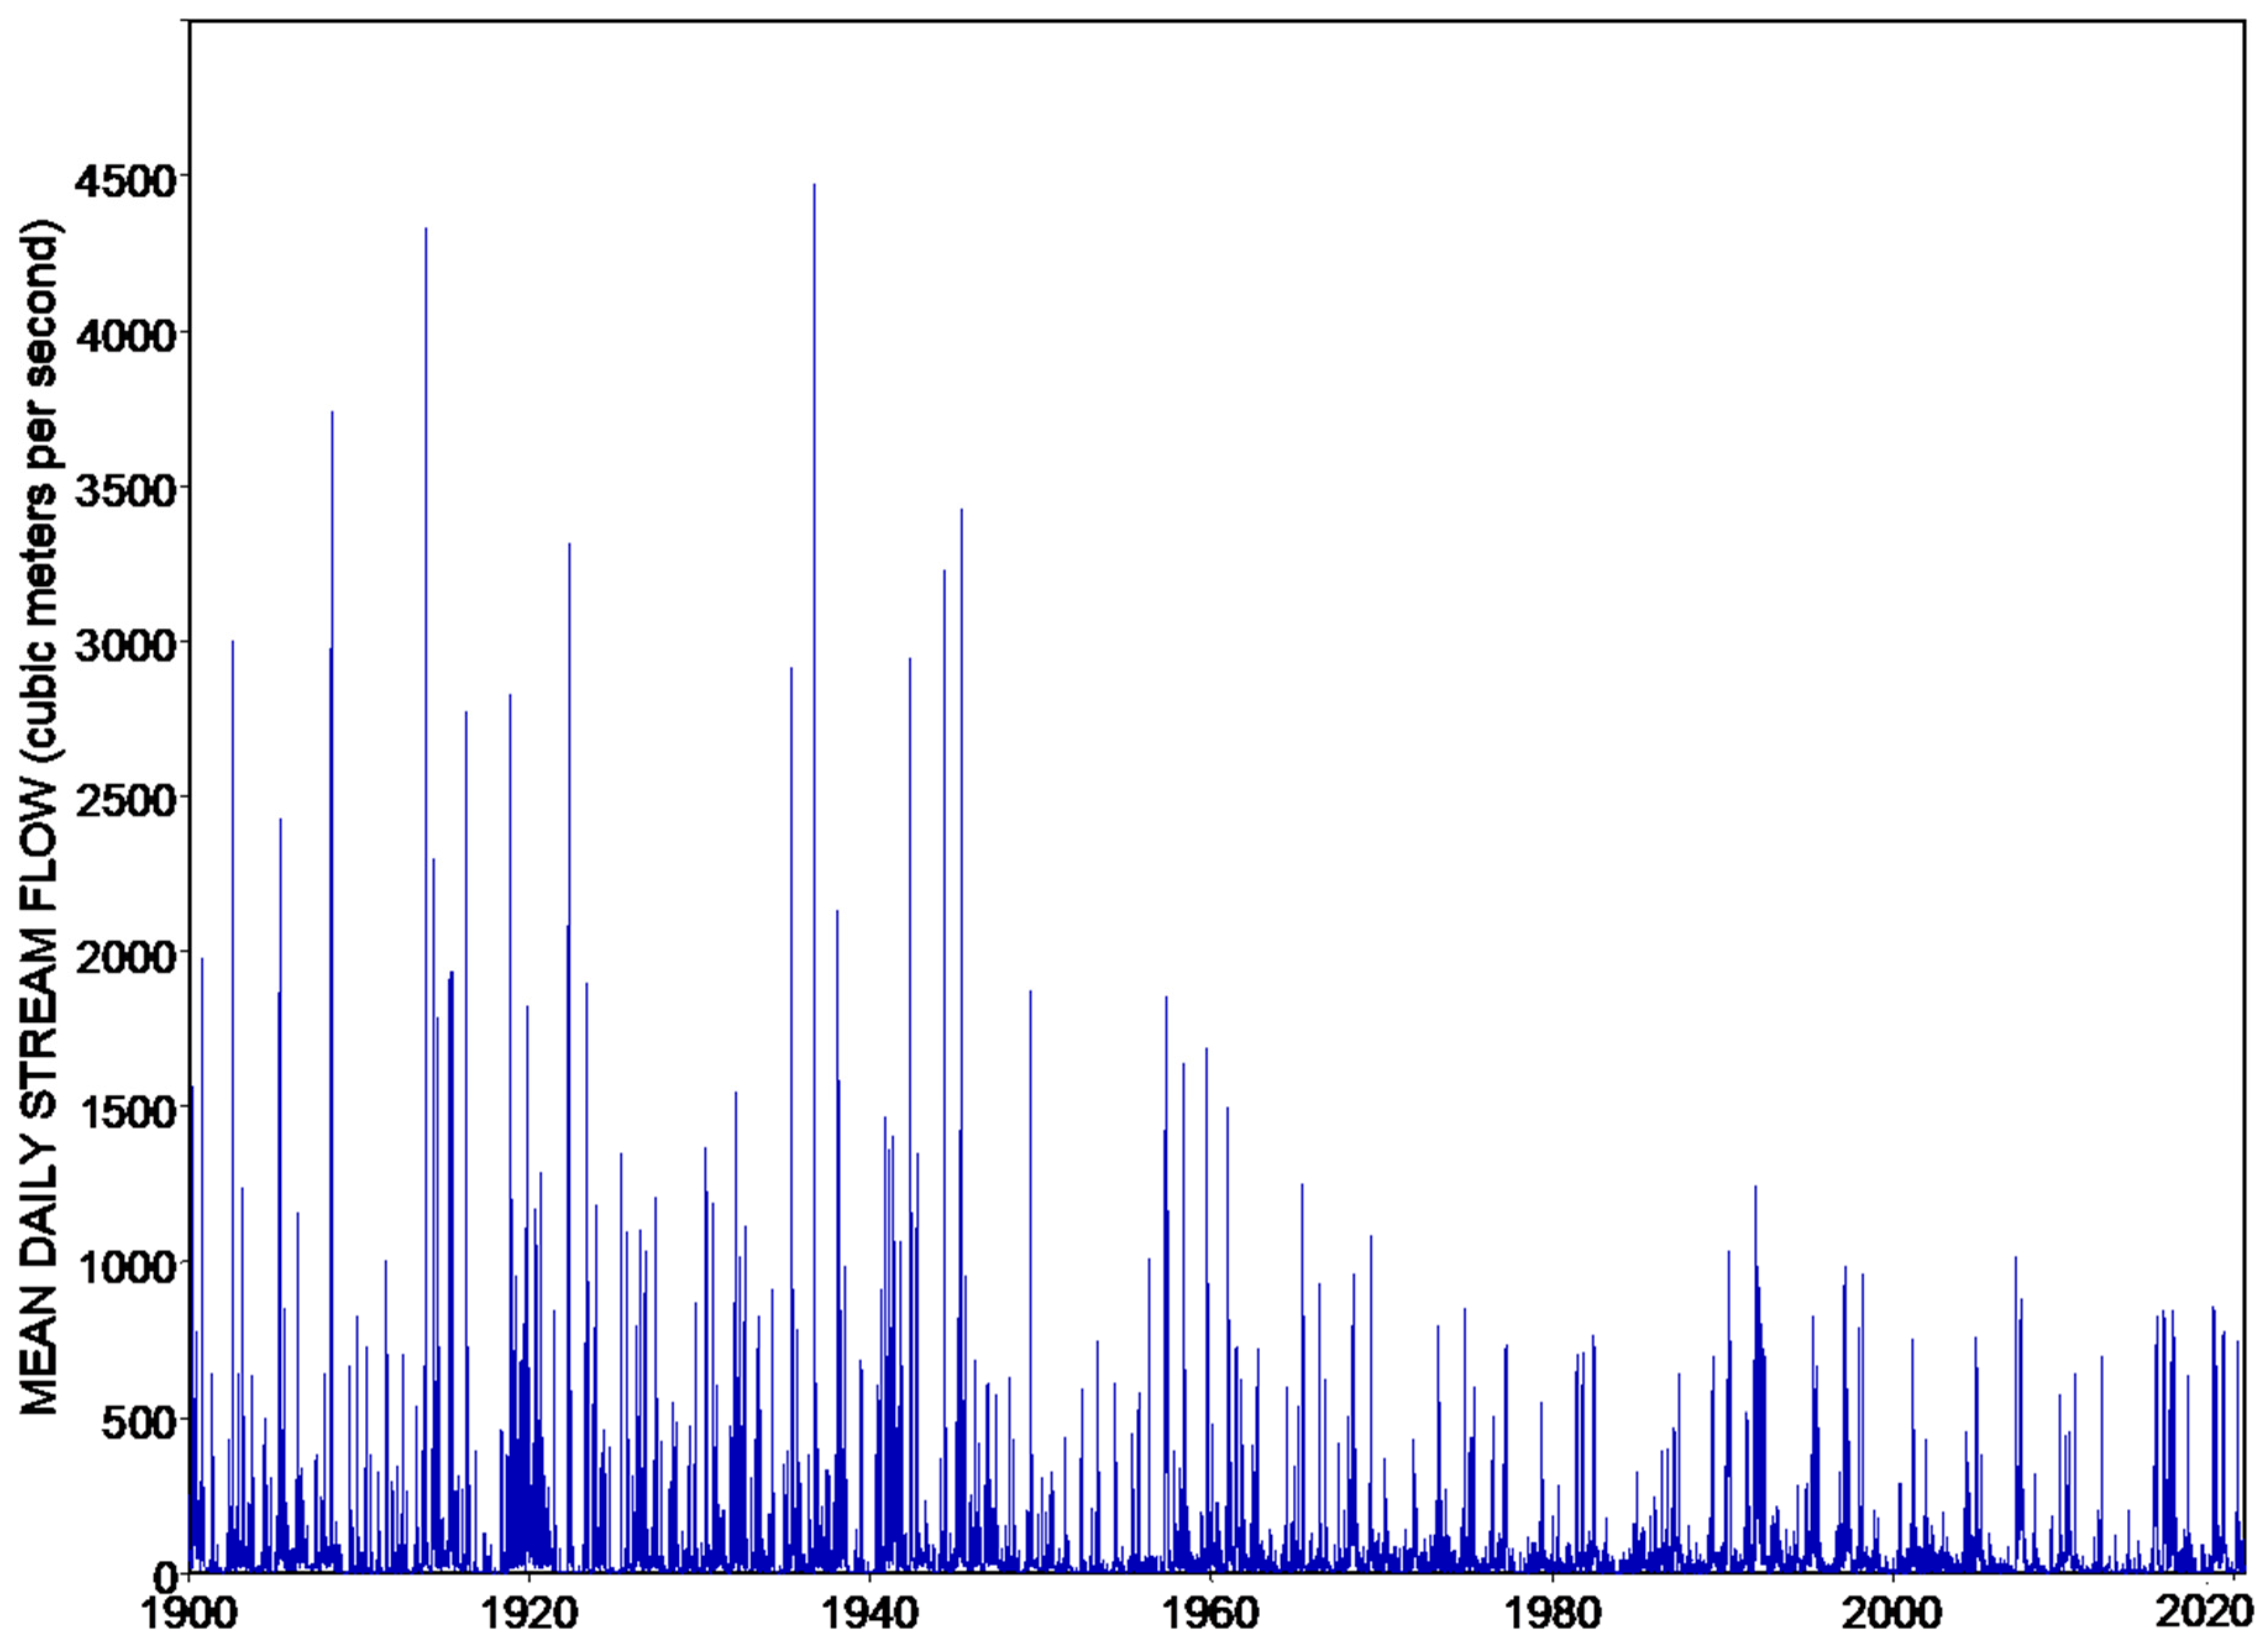
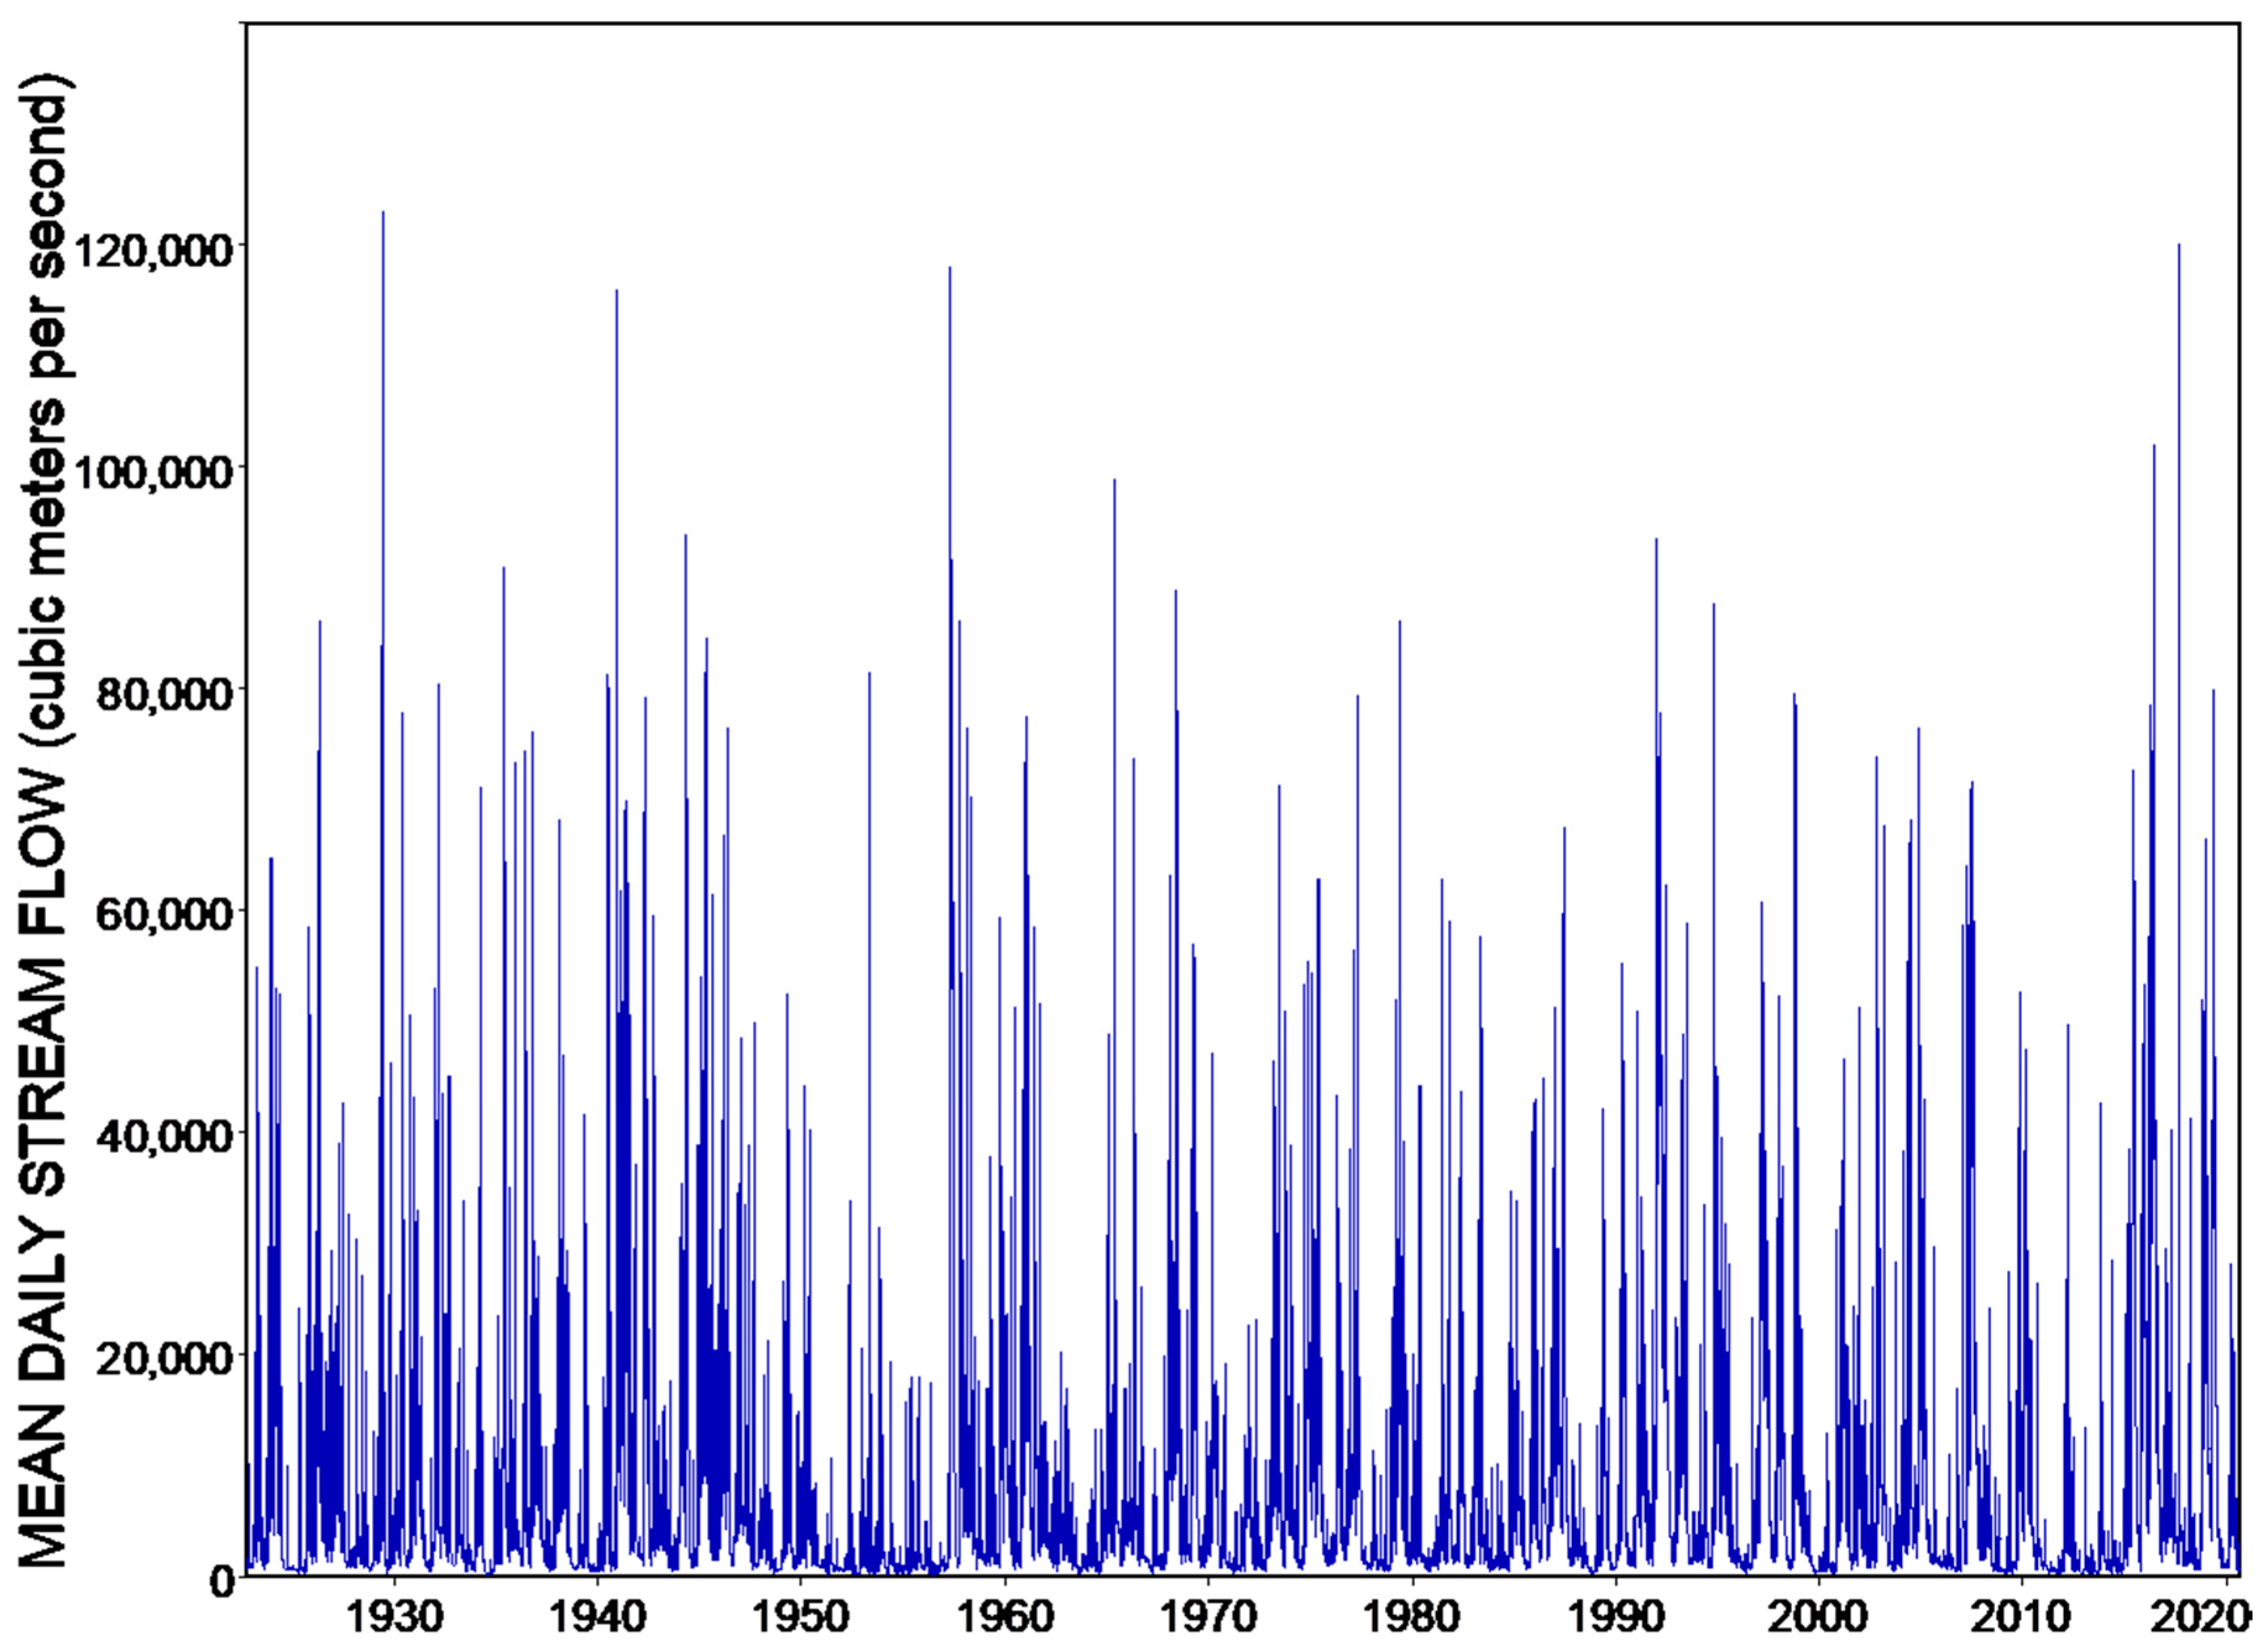
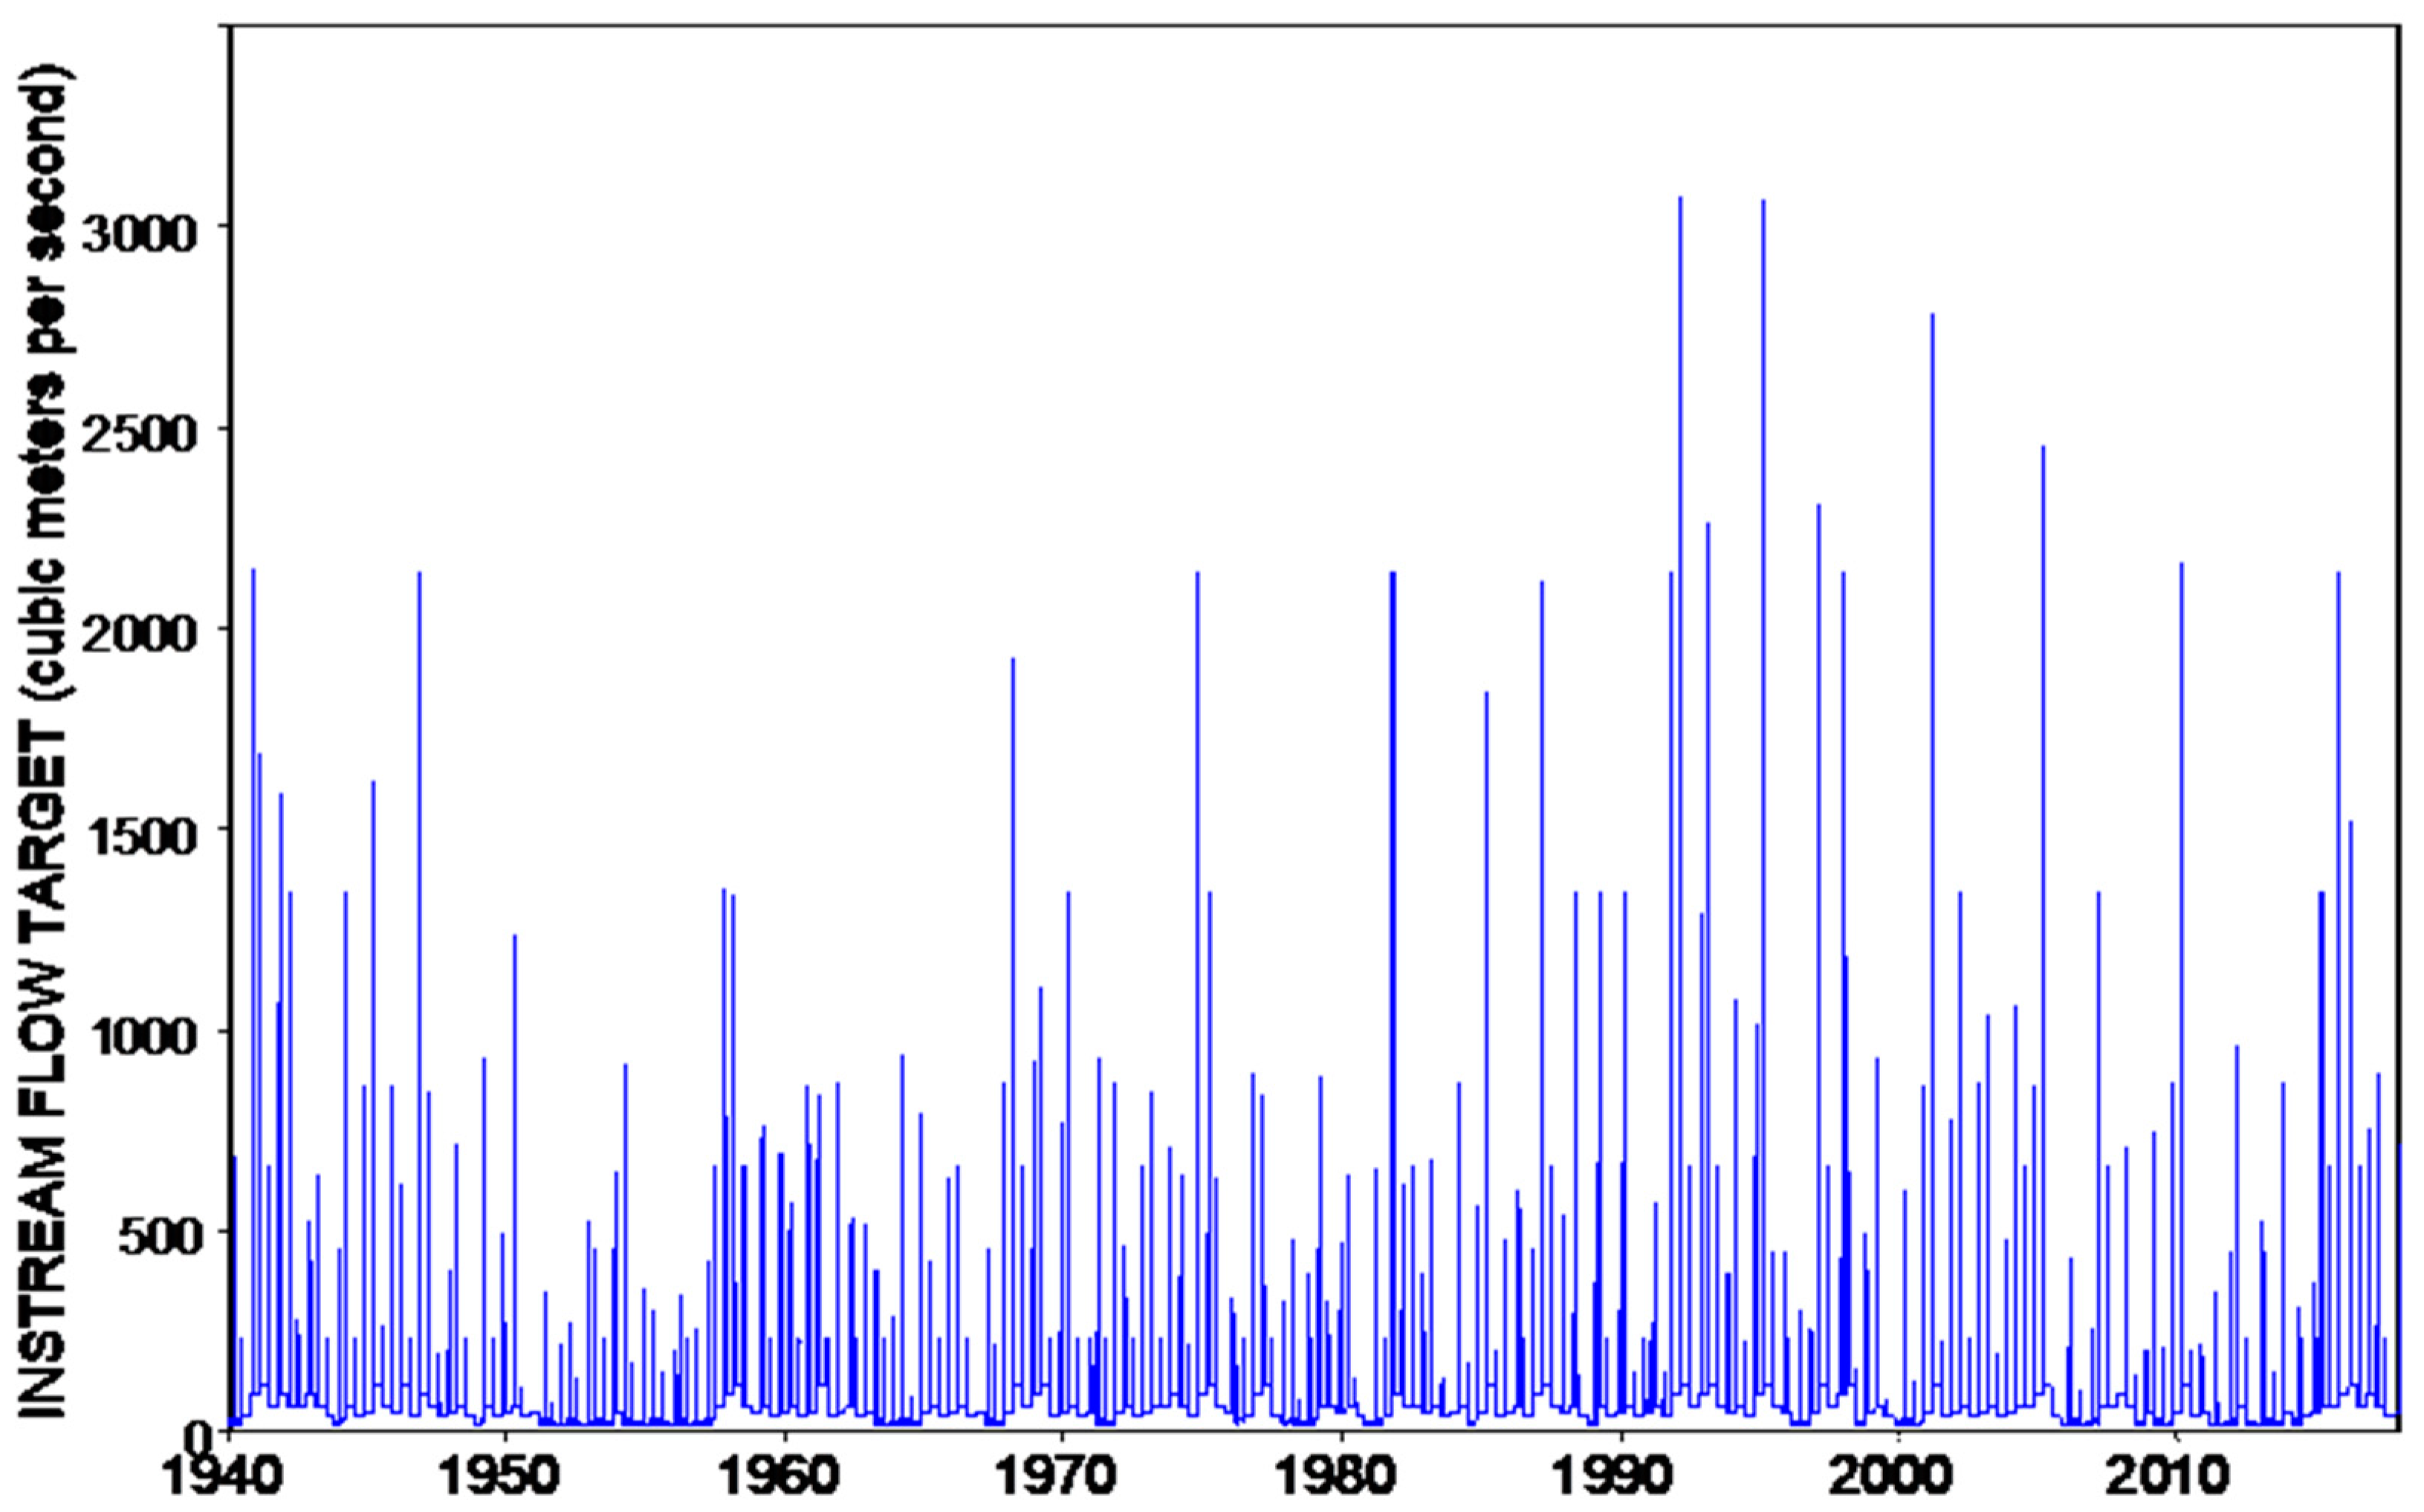
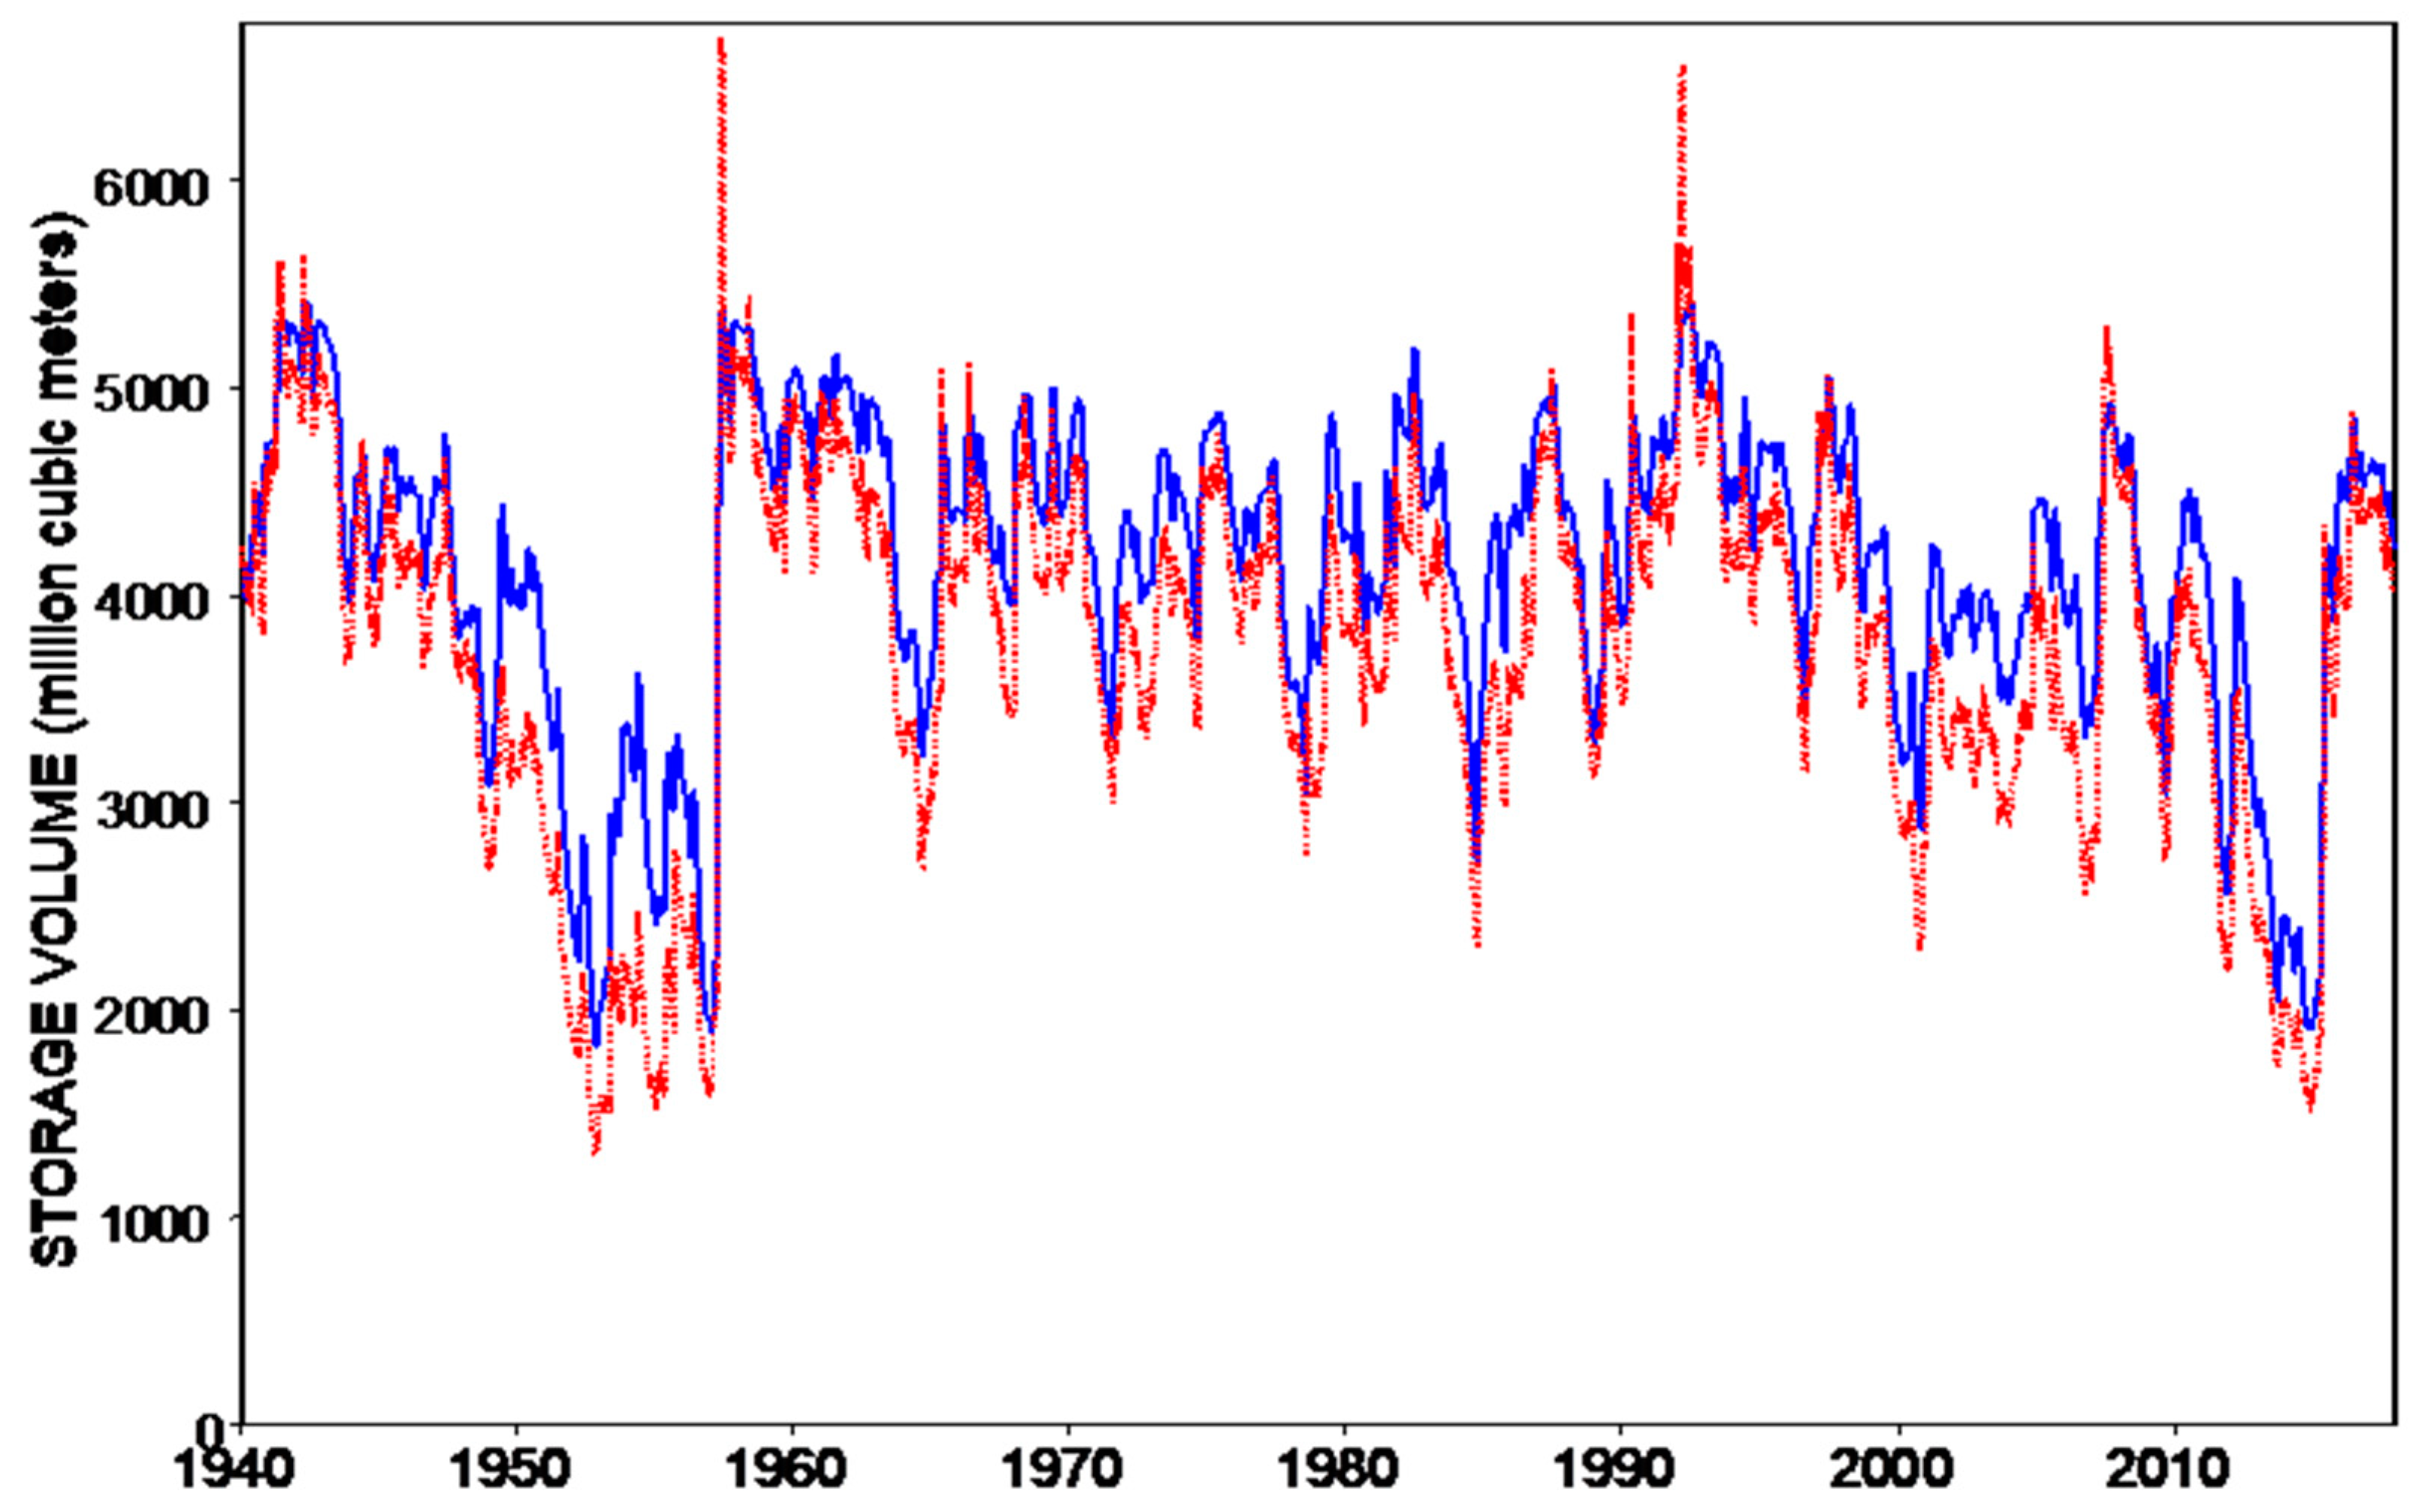
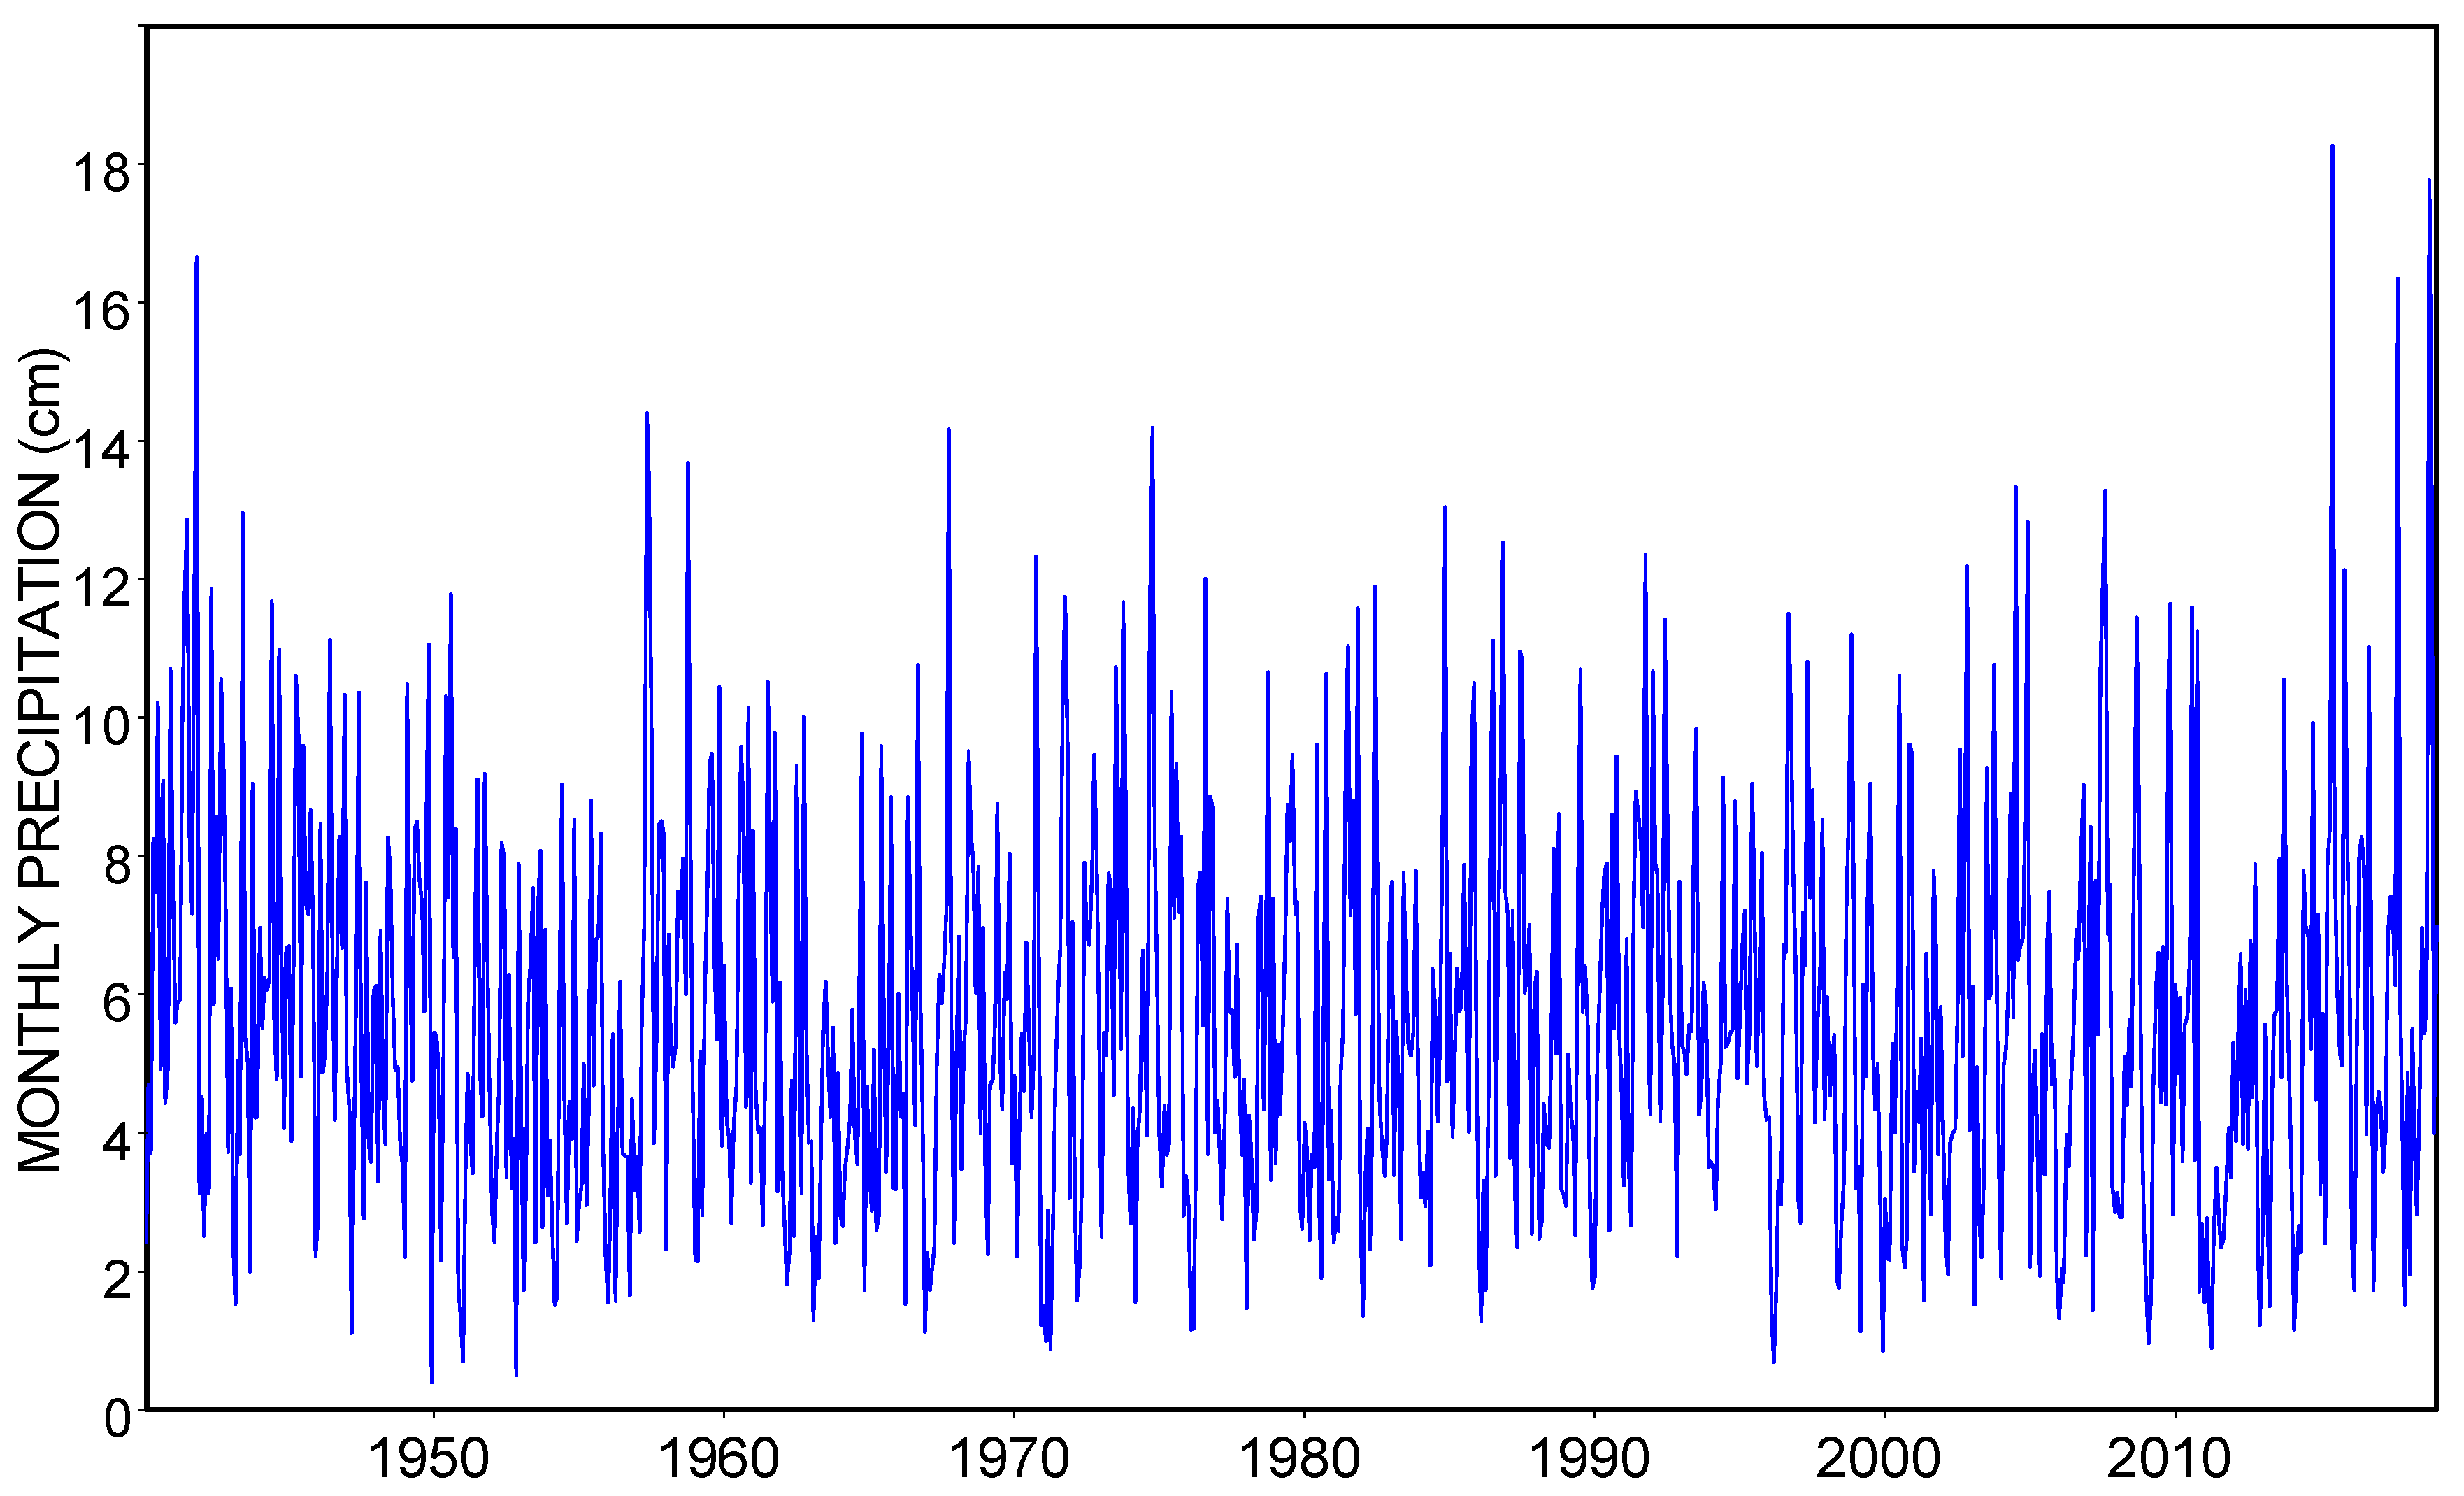
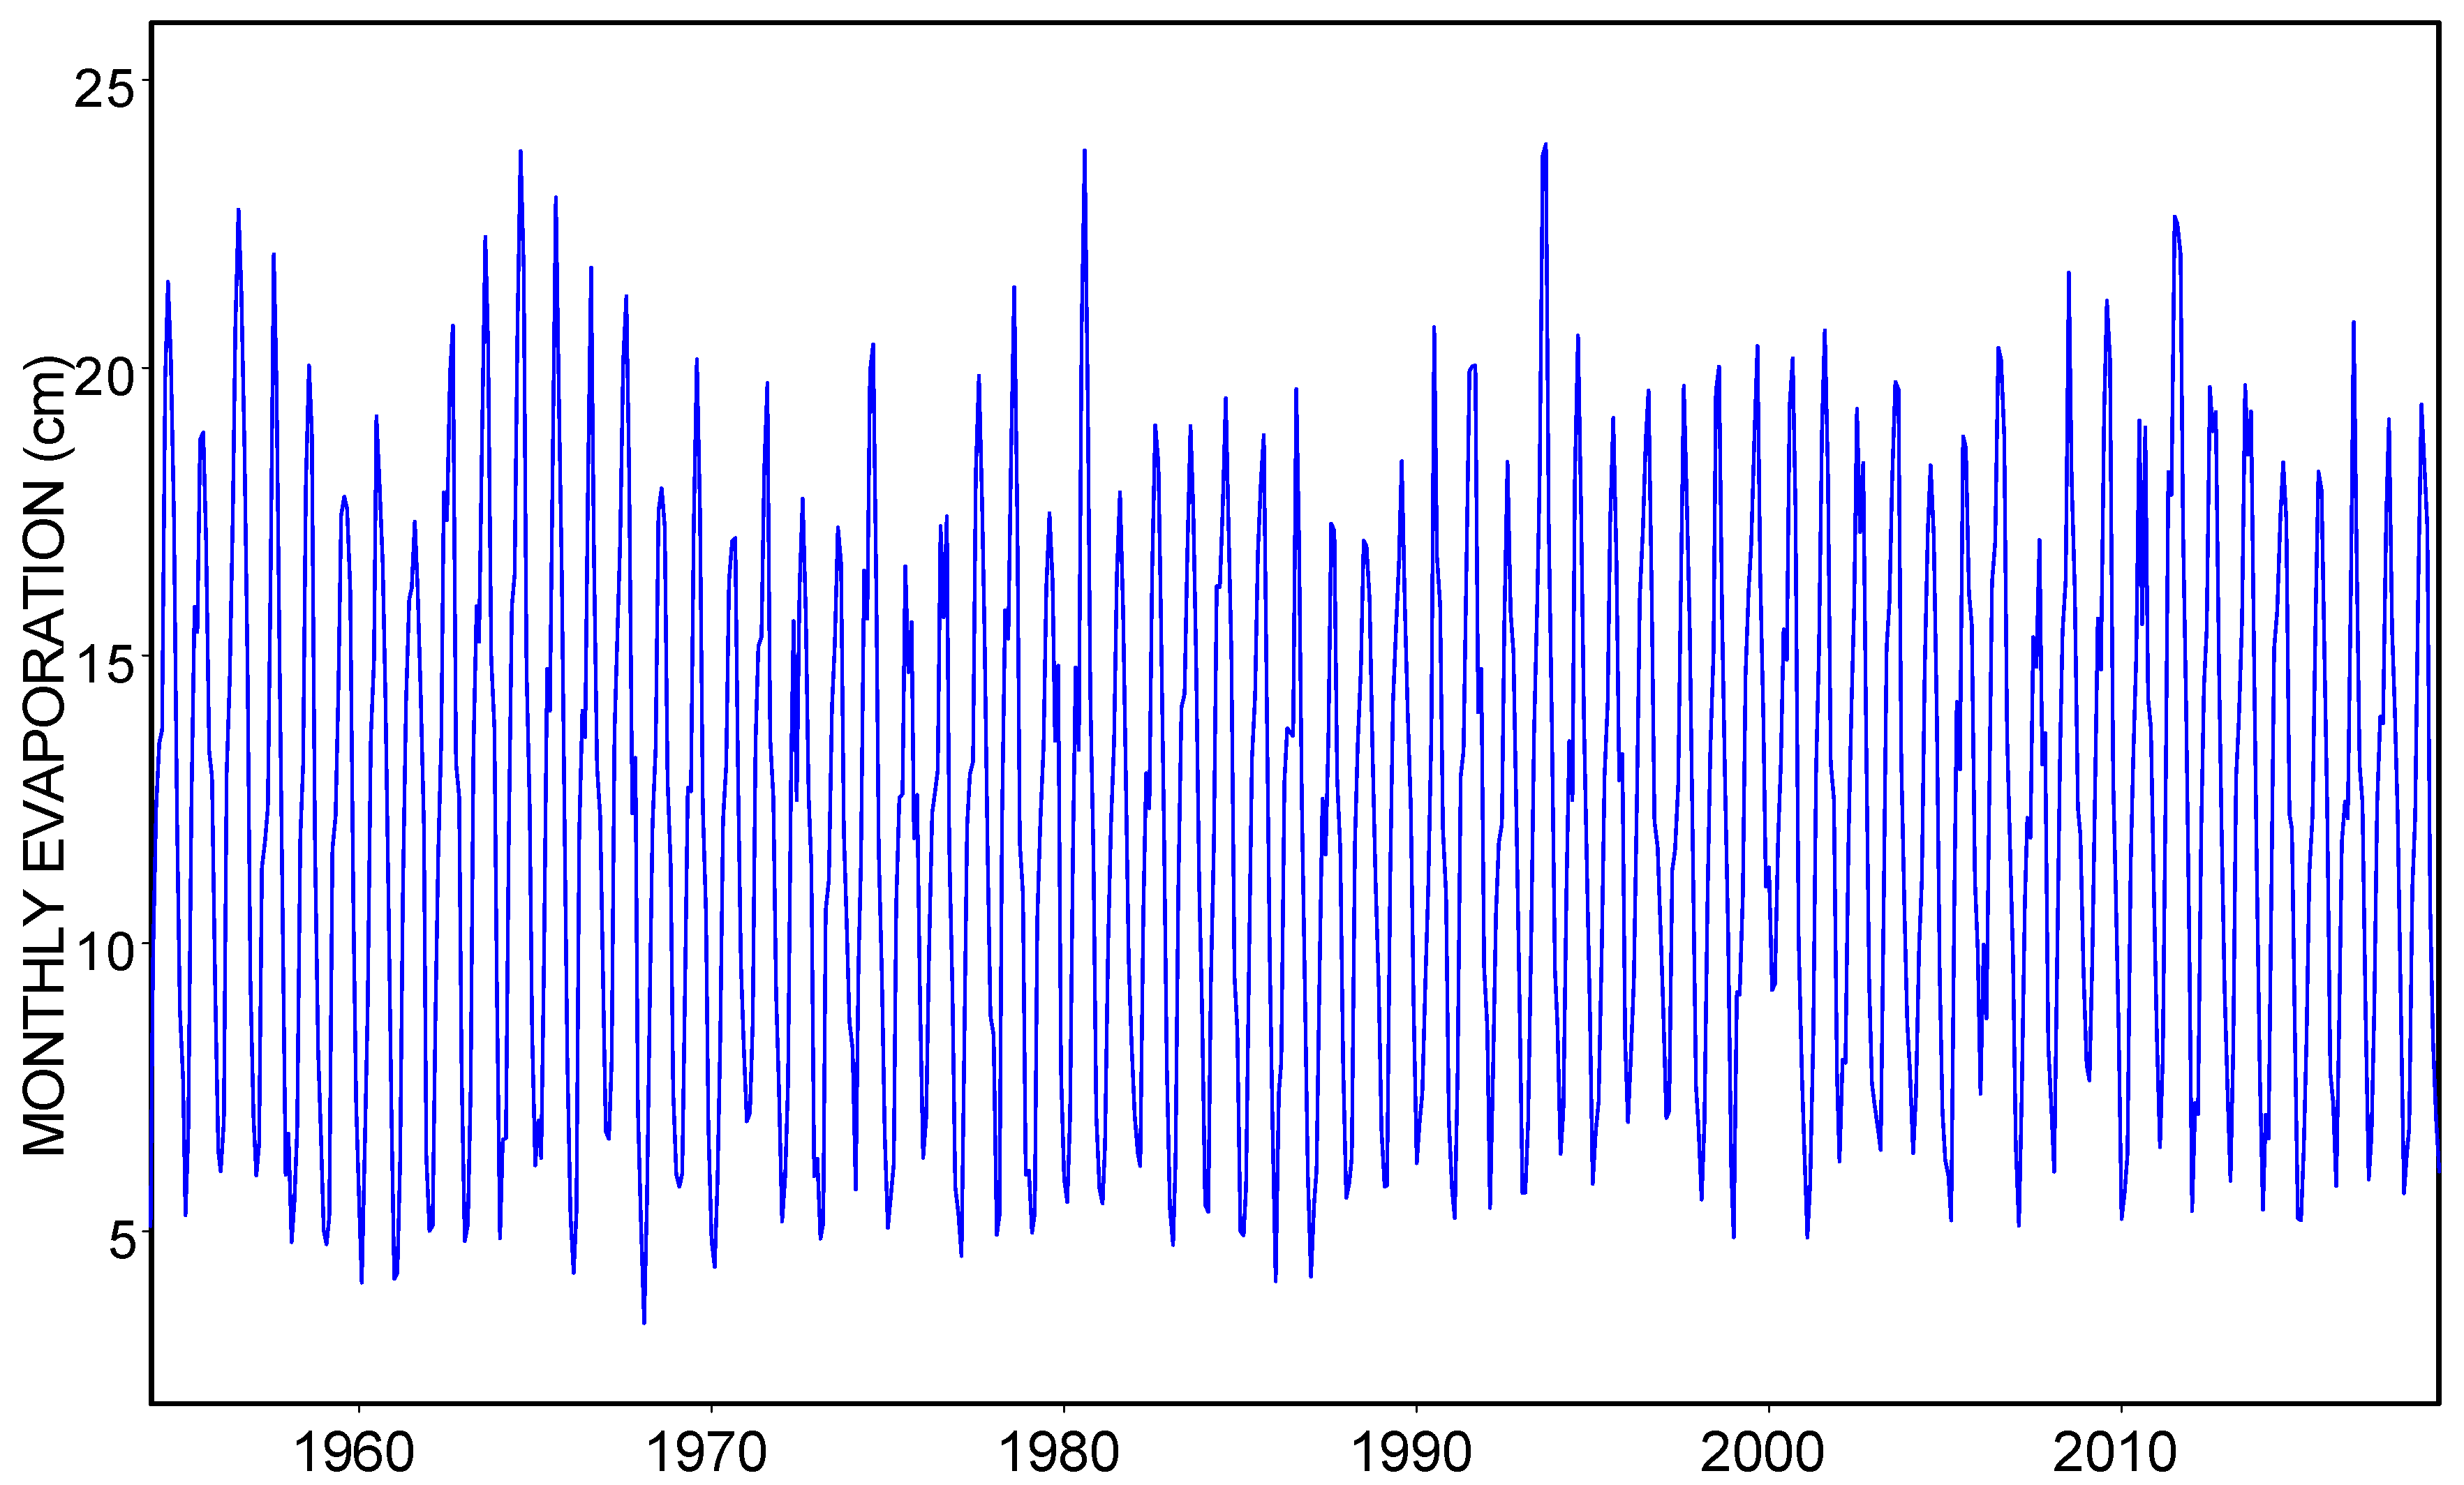
Table 1.
Largest reservoirs in the Brazos River Basin.
| Reservoir | Stream | Initial | Storage Capacity (Mm3) | ||
|---|---|---|---|---|---|
| Impoundment | Conservation | Flood Control | Total | ||
| U.S. Army Corps of Engineers and Brazos River Authority | |||||
| Whitney | Brazos River | 1951 | 785 | 1682 | 2467 |
| Aquilla | Aquilla Creek | 1983 | 65 | 115 | 180 |
| Waco | Bosque River | 1965 | 255 | 641 | 896 |
| Proctor | Leon River | 1963 | 73 | 388 | 462 |
| Belton | Leon River | 1954 | 565 | 790 | 1354 |
| Stillhouse Hollow | Lampasas River | 1968 | 291 | 487 | 778 |
| Georgetown | San Gabriel | 1980 | 46 | 116 | 161 |
| Granger | San Gabriel | 1980 | 81 | 220 | 301 |
| Somerville | Yequa Creek | 1967 | 198 | 428 | 626 |
| Brazos River Authority | |||||
| Possum Kingdom | Brazos River | 1941 | 894 | − | 894 |
| Granbury | Brazos River | 1969 | 191 | − | 191 |
| Limestone | Navasota River | 1978 | 278 | − | 278 |
| Allen′s Creek | Allen′s Creek | proposed | 180 | − | 180 |
| City of Lubbock | |||||
| Alan Henry | Double Mountain | 1993 | 143 | − | 143 |
| West Central Texas Municipal Water District | |||||
| Hubbard Creek | Hubbard Creek | 1962 | 392 | − | 392 |
| Texas Utilities Services (cooling water for Comanche Peak Nuclear Power Plant) | |||||
| Squaw Creek | Squaw Creek | 1977 | 187 | − | 187 |
Table 2.
Frequency statistics for daily and monthly observed and naturalized flows at the Richmond gauge site and regulated and unappropriated flows from daily and monthly simulations.
Table 2.
Frequency statistics for daily and monthly observed and naturalized flows at the Richmond gauge site and regulated and unappropriated flows from daily and monthly simulations.
| 1 | 2 | 3 | 4 | 5 | 6 | 7 | 8 | 9 | 10 | 11 |
|---|---|---|---|---|---|---|---|---|---|---|
| Observed | Naturalized | Daily SIMD Simulation | Monthly SIM | |||||||
| Regulated | Unappropriated | Regulated | Unappro- | |||||||
| Daily | Monthly | Daily | Monthly | Daily | Monthly | Daily | Monthly | Monthly | priated | |
| (m3/s) | (m3/s) | (m3/s) | (m3/s) | (m3/s) | (m3/s) | (m3/s) | (m3/s) | (m3/s) | (m3/s) | |
| Mean | 216 | 216 | 228 | 228 | 181 | 181 | 103 | 103 | 180 | 113 |
| Standard Deviation | 346 | 273 | 407 | 292 | 369 | 250 | 289 | 192 | 266 | 238 |
| Minimum | 1.6 | 5.7 | 0 | 0 | 0 | 0 | 0 | 0 | 0.1 | 0 |
| 99% | 8.7 | 12.2 | 4 | 7 | 0 | 0.1 | 0 | 0 | 4.4 | 0 |
| 98% | 11 | 14 | 6.7 | 9.6 | 0 | 2.6 | 0 | 0 | 6.8 | 0 |
| 95% | 14.8 | 18 | 11 | 15.9 | 0 | 8 | 0 | 0 | 10.3 | 0 |
| 90% | 19.8 | 24.5 | 16.5 | 24.1 | 1.5 | 12.9 | 0 | 0 | 15.2 | 0 |
| 80% | 29.2 | 35.8 | 27.5 | 38.3 | 10.4 | 20.4 | 0 | 0 | 22.4 | 0 |
| 70% | 39.9 | 52.3 | 39.9 | 59.1 | 19.2 | 31.7 | 0 | 0.5 | 31.9 | 0 |
| 60% | 54.7 | 74.8 | 57.2 | 81.9 | 25.9 | 49 | 0 | 3.6 | 42.8 | 0 |
| 50% | 80.7 | 105 | 83.8 | 120 | 41.4 | 78 | 0 | 14.7 | 68.9 | 0 |
| 40% | 123 | 156 | 127 | 168 | 75.2 | 119 | 0 | 35.8 | 108 | 19.2 |
| 30% | 189 | 222 | 195 | 237 | 140 | 180 | 21.6 | 79.2 | 171 | 65.9 |
| 20% | 309 | 358 | 309 | 364 | 248 | 300 | 110 | 170 | 283 | 184 |
| 10% | 555 | 563 | 582 | 579 | 499 | 509 | 312 | 329 | 506 | 370 |
| Maximum | 3400 | 2190 | 9200 | 2880 | 9170 | 1810 | 7300 | 1480 | 2560 | 2530 |
© 2020 by the author. Licensee MDPI, Basel, Switzerland. This article is an open access article distributed under the terms and conditions of the Creative Commons Attribution (CC BY) license (http://creativecommons.org/licenses/by/4.0/).
Share and Cite
MDPI and ACS Style
Wurbs, R.A. Institutional Framework for Modeling Water Availability and Allocation. Water 2020, 12, 2767. https://doi.org/10.3390/w12102767
AMA Style
Wurbs RA. Institutional Framework for Modeling Water Availability and Allocation. Water. 2020; 12(10):2767. https://doi.org/10.3390/w12102767
Chicago/Turabian StyleWurbs, Ralph A. 2020. "Institutional Framework for Modeling Water Availability and Allocation" Water 12, no. 10: 2767. https://doi.org/10.3390/w12102767
Note that from the first issue of 2016, this journal uses article numbers instead of page numbers. See further details here.