Prediction of Droughts in the Mongolian Plateau Based on the CMIP5 Model


1
College of Geographical Science, Inner Mongolia Normal University, Hohhot 010022, China
2
Department of Geography, School of Arts and Sciences, National University of Mongolia, Ulaanbaatar 14201, Mongolia
3
Inner Mongolia Key Laboratory of Disaster and Ecological Security on the Mongolian Plateau, Inner Mongolia Normal University, Hohhot 010022, China
4
Inner Mongolia Key Laboratory of Remote Sensing and Geographic Information Systems, Inner Mongolia Normal University, Hohhot 010022, China
*
Author to whom correspondence should be addressed.
Water 2020, 12(10), 2774; https://doi.org/10.3390/w12102774
Submission received: 5 August 2020
/
Revised: 27 September 2020
/
Accepted: 1 October 2020
/
Published: 5 October 2020
(This article belongs to the Special Issue Drought and Extreme Events Caused by Climate Changes)
Abstract
:Understanding the variations of future drought under climate warming can provide the basis for mitigation efforts. This study utilized the standardized precipitation evapotranspiration index (SPEI), empirical mode decomposition (EMD) and empirical orthogonal function analysis (EOF) to predict the spatiotemporal variation of future drought under the representative concentration pathway RCP4.5 and RCP8.5 scenarios within the Mongolian Plateau over the period 2020–2100. The SPEI was computed using temperature and precipitation data generated by the fifth stage of the Coupled Model Intercomparison Project (CMIP5). The results under both the RCP4.5 and RCP8.5 scenarios showed increasing changes in temperature and precipitation. Both scenarios indicated increases in drought, with those under RCP8.5 much more extreme than that under RCP4.5. Under both scenarios, the climate showed an abrupt change to become drier, with the change occurring in 2041 and 2054 for the RCP4.5 and RCP8.5 scenarios, respectively. The results also indicated future drought to be more extreme in Mongolia than in Inner Mongolia. The simulated drought pattern showed an east–west antiphase and a north–south antiphase distribution based on EOF. The frequency of drought was higher under RCP8.5 compared to that under RCP4.5, with the highest frequencies under both scenarios occurring by the end of the 21st century, followed by the mid-21st century and early 21st century. The findings of this research can provide a solid foundation for the prevention, early warning and mitigation of drought disasters within the context of climate change in the Mongolian Plateau.
1. Introduction
The Earth’s climate is undergoing a significant and rapid change due to global warming. The Fifth Assessment Report (AR5) of the Intergovernmental Panel on Climate Change (IPCC) has claimed that the change in climate may be more extreme than previously recognized, with records showing that the global surface temperature increased by 0.85 °C during 1880–2012, whereas the average temperature over 2003–2012 was higher than that in 1850–1990 by 0.78 °C. The region experiencing the most rapid warming was identified as the middle latitude of the Northern Hemisphere [1,2]. The scientific consensus is that the surface temperature will continue to increase in the future, with associated effects on the global natural ecosystem and economy [1]. Attention has been increasingly focused on regional and global climate change prediction to facilitate adaption and mitigation to climate change.
The Coupled Model Intercomparison Project (CMIP) was launched by the World Climate Research Program (WCRP) to facilitate global circulation model (GCM) data sharing and comparison [3,4,5]. The CMIP5 mainly includes historical climate simulations and future climate projection under different scenarios of greenhouse gas concentrations [6]. In comparison to the CMIP3 model, the CMIP5 model features an improved spatial resolution, parameterization scheme and coupling technology, and some applications of CMIP5 have taken into account dynamic vegetation, carbon and nitrogen cycle processes. The CMIP5 has adopted a new generation of representative concentration pathways (RCPs) [7], which represents a new scenario of stable greenhouse gas concentrations over the next hundred years expressed by radiative forcing per unit area, including RCP2.6, RCP4.5, RCP6 and RCP8.5 [8,9]. Many studies based on the CMIP model have contributed to the general scientific consensus that global warming will lead to an increase in the frequency, intensity and duration of extreme climate events [10,11,12]. Future global and regional changes in climate change are therefore an important topic in current research.
There has been a remarkable increase in the frequency and intensity of extreme weather events under climate change [1]. Droughts, which are often long-lasting, have a wide spatial effect, and can potentially have considerable social and economic costs, with severe impacts on the terrestrial ecosystem [13]. According to the statistics of the International Disaster Database (https://www.emdat.be/, last accessed 29 July 2020), there was a global total of 327 drought disasters during 2000–2019, which affected over 1.4 billion people and had an economic cost of US$ 112 billion. The damage caused by droughts over this period was estimated to be far larger than that over 1960–1999. Some regions have shown significant increases in the frequency and severity of droughts due to global warming [14,15]. A study by Sun et al. [16] based on the CMIP5 model concluded that durations of droughts in the Yangtze River Basin will increase the future, with agricultural droughts projected to be more severe than meteorological and hydrological droughts. The frequencies of severe and extreme droughts in Southwest China have also been predicted to increase dramatically [17]. The Mongolian Plateau, which is located in the middle latitude of the Northern Hemisphere, is an important geomorphic structural unit in the hinterland of Eurasia, forms a valuable component of the global grassland ecosystem and is characterized by a fragile and sensitive ecological environment [18,19,20]. This region has been shown to be experiencing climate warming under continuous global warming at a rate which is higher than the global average [21]. Past climate studies of the region have mainly focused on historical changes in precipitation and temperature and the influence on the grassland ecosystem, vegetation phenology and vegetation coverage [22,23,24], whereas there have been few attempts to simulate future climate of the region. Past studies in the region have shown an increase and decrease in temperature and precipitation over the past decade, respectively [25,26]. Increases in the severity of droughts in the region have had negative effects on the plateau, including lowering grassland productivity, reducing vegetation coverage, accelerating the desertification process and having adverse effects on the development of agriculture and stockbreeding [27,28].
Climate change effects on the Mongolian Plateau are of global concern, since the climate of the region affects the East Asian and global atmospheric circulation by strengthening the westerly jet and winter monsoon [29,30]. Despite a strong interest in how the future climate of the Mongolian Plateau will change under global warming, there have been few studies on this issue. There is an existing research done by Jiang et al. that suggests that the plateau will experience significant climate warming and accompanying increased precipitation in the future [31]. Therefore, the current study aimed to identify the possible temporal and spatial characteristics of future climate in the region to characterize the frequency and severity of future droughts. The current study used CMIP5 simulations of future precipitation and temperature for the period 2020–2100 under two representative concentration pathways (RCPs), the standardized precipitation evapotranspiration index (SPEI) as a drought index, and a combination of the empirical mode decomposition (EMD) and empirical orthogonal function (EOF) methods. The results of the current study can act as an important reference for the development of an early warning of future drought events, disaster risk assessment and regional hazard prevention in the Mongolian Plateau.
2. Data and Methodology
2.1. Study Area
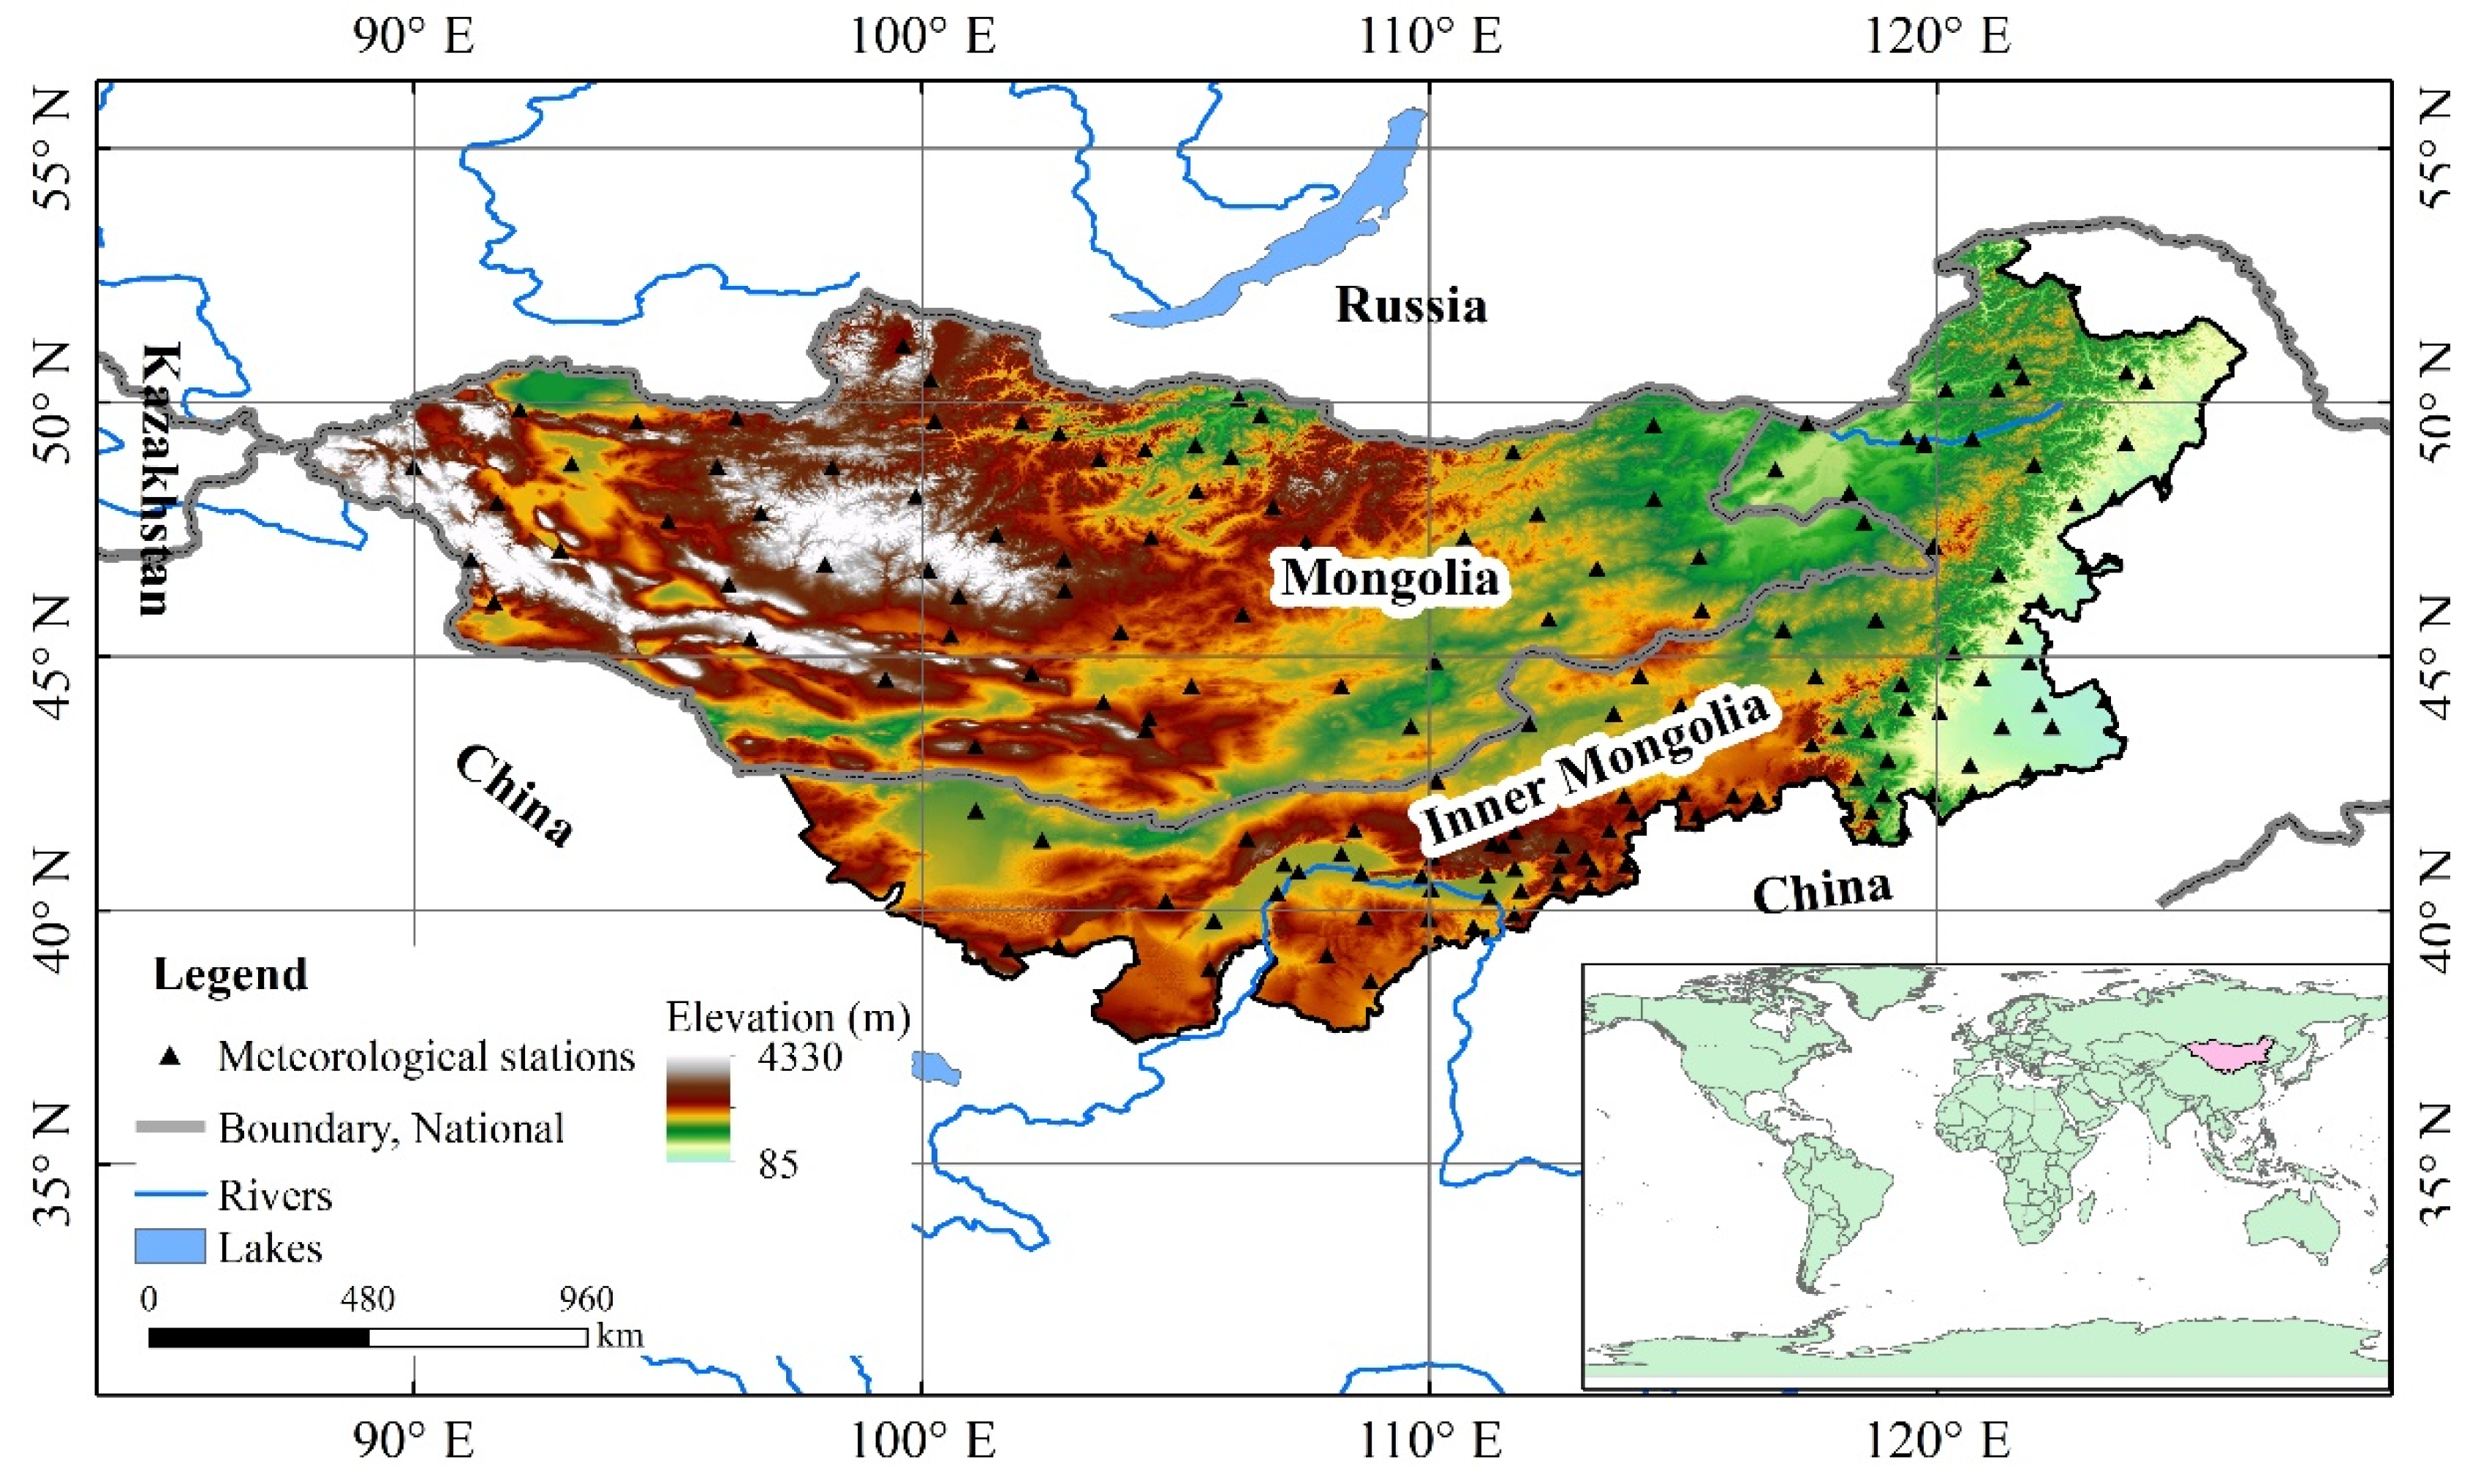
The Mongolian Plateau is located in the hinterland of Eurasia between 37°46’–53°08’ N and 87°40’–125°15’ E, and mainly includes Mongolia, the Chinese region of Inner Mongolia and parts of the Russian region of Siberia [32]. The current study regarded the central region of the Mongolian Plateau (hereinafter referred to as the Mongolian Plateau) as the study area, encompassing Mongolia and Inner Mongolia (Figure 1). Macroscopic landforms of the study area mainly include mountains and high plain, with elevation decreasing from west to east. The Mongolian Plateau falls within a temperate continental climate zone with four distinct seasons, a large difference in temperature between day and night, extended daylight hours and strong solar radiation. The rainy season occurs during summer (June to August), with annual precipitation reducing from 300–400 mm in the east to 100–200 mm in the west. The weather systems responsible for precipitation mainly originate from the Arctic Ocean in the north and the Pacific Ocean in the south. Temperature gradually increases from east to west.
2.2. Datasets Used in the Study
The observed monthly mean temperature and precipitation datasets for 1980–2015 were obtained from the Inner Mongolia Meteorological Service and Mongolia Meteorological Service for 121 and 60 stations, respectively.
Temperature and precipitation data from 19 CMIP5 models (Table 1) were obtained from the Earth System Grid Federation (ESGF, https://esgf-node.llnl.gov/search/cmip5/, last accessed 30 July 2020) for two periods representing historical and the 21st century for 1980–2005 and 2020–2100, respectively. The present study analyzed the greenhouse gas emission stabilization scenario RCP4.5 and the RCP8.5 scenario and not the ideal greenhouse gas emission scenario RCP2.6 to assess potential future changes in climate variables and drought. Since the RCP4.5 scenario is a medium emission scenario and is most likely to occur in the future, climate change predicted under this scenario is more likely. Under the RCP4.5 scenario, radiation forcing increases until 2070 and stabilizes at 4.5 W·m−2 by 2100. The RCP8.5 scenario represents high greenhouse gas emissions with an assumption of a large population, slow income growth, low technological innovation rate and slow optimization of energy structure, under which radiation forcing will rise to 8.5 W·m−2 by 2100 and the CO2 equivalent concentration will reach 1370 ppm (× 10−6). The 19 CMIP5 models selected in the current study were uniformly resampled with a resolution of 0.5° × 0.5° due to differences in resolution.
2.3. Methodology
2.3.1. SPEI
The SPEI was first proposed by Vicente-Serrano et al. in 2010 [33] and is designed to consider both precipitation and potential evapotranspiration when identifying droughts. The SPEI also captures the main impact of increased temperature on water demand and can be calculated over a range of timescales from 1–48 months, thereby reflecting the duration and cumulative effects of droughts. The SPEI is therefore widely used for evaluating, monitoring and assessing droughts within the context of global warming [34,35,36]. The SPEI for different time scales can reflect anomalous water states at different times in the past. The present study selected SPEI timescales of 3 and 12 months to reflect the seasonal and annual meteorological drought. According to the statistic of historical droughts in the study area and grade standard of meteorological drought, an SPEI < −0.5 was regarded as indicative of drought in the study area, and the drought was commonly classified into normal (SPEI > −0.5), light drought (−1.0 < SPEI ≤ −0.5), moderate drought (−1.5 < SPEI ≤ −1.0) and severe drought (SPEI ≤ −1.5). The frequency of meteorological drought with an SPEI < −0.5 was also calculated based on the SPEI with following equation [37]:
In Equation (1), n is the number of droughts in the data series and N is the number of data series (N = 81 in this study).
2.3.2. Assessment of CMIP5 Models
The present study used the multi-model ensemble mean (MME) and Taylor diagram to assess the CMIP5 models. The MME includes an equal weighted average and a weighted average and is widely used in the simulation and prediction of future climate change, since the MME is able to offset deviation of each model to a certain extent. In addition, the use of the MME applied to multiple CMIP5 models has generated more accurate simulation results when compared to observations [38,39].
The Taylor diagram can be used to demonstrate the simulation capability of climate models by quantifying the difference between the model simulations and observations using the correlation coefficient (R), root mean square error () and standard deviation between simulations () and observations ():
In Equation (2), R and are positively and negatively related to the similarity between model simulations and observations, respectively [40].
2.3.3. Empirical Mode Decomposition
Empirical mode decomposition (EMD) is a time–frequency analysis method that is applied to non-linear and non-stationary time series [41]. The EMD method decomposes an original time series to obtain a series of time scale components from high frequency to low frequency termed intrinsic mode functions (IMFs). The current study applied EMD to analyze variations of temperature, precipitation and drought in the Mongolian Plateau under different RCP scenarios for 2020–2100.
The EMD process incorporates the following steps:
- (1)
- Identify all maximum and minimum points in the data sequence ;
- (2)
- Construct the upper and lower envelope curves by spline interpolation and then calculate the average value:In Equation (3), , and are the upper, lower and average envelope curve values, respectively.
- (3)
- Calculate the difference between the original data sequence and :In Equation (4), is the original data sequence.
- (4)
- Repeat steps 2 and 3 until the component is a new IMF component defined as ;
- (5)
- Calculate the residual value:In Equation (5), is the original data sequence and is the IMF component.
- (6)
- After completing steps 1–5, the original data sequence can be decomposed into certain IMF components and a residual value:In Equation (6), is the IMF component of the original data sequence decomposition and is the residual value.
2.3.4. Empirical Orthogonal Function
The empirical orthogonal function (EOF) is a commonly used method for decomposing the spatial and temporal distributions and characteristics of climate change [42]. The principle of the EOF involves representing the climate variable observation data as a matrix.
In Equation (7), is the observation station and is the length of the time series.
is then taken as the linear combination of p spatial eigenvectors and corresponding time weight coefficients:
In Equation (8), is the time coefficient and is the spatial eigenvector (or spatial mode). During this process, the main information of the variable field is represented by several typical eigenvectors.
The current study decomposed the annual average SPEI using EOF and extracted the main spatial modes and corresponding time coefficients to reveal the temporal and spatial variations in droughts on the Mongolian Plateau. An eigenvector value less than 0 and time coefficient greater than 0 indicated that the process had a continuous characteristic: the larger the absolute value of the eigenvector, the more typical the drought. In contrast, for an eigenvector value greater than 0, the larger the value of the eigenvector, the more typical the wet year. In addition, a time coefficient less than 0 indicated an opposite trend.
2.3.5. Linear Trend Analysis
The current study used linear trend analysis to analyze the spatial and temporal trends in the SPEI [26]. The slope coefficients of each pixel were calculated as:
In Equation (9), and are the values of the independent and dependent variables in the ith year, respectively, and n is the number of years. Positive and negative slopes generally indicate upward and downward trends in the SPEI, respectively. In addition, the Mann–Kendall statistical test was used to detect the abrupt change in drought.
3. Results
3.1. Assessment of Models
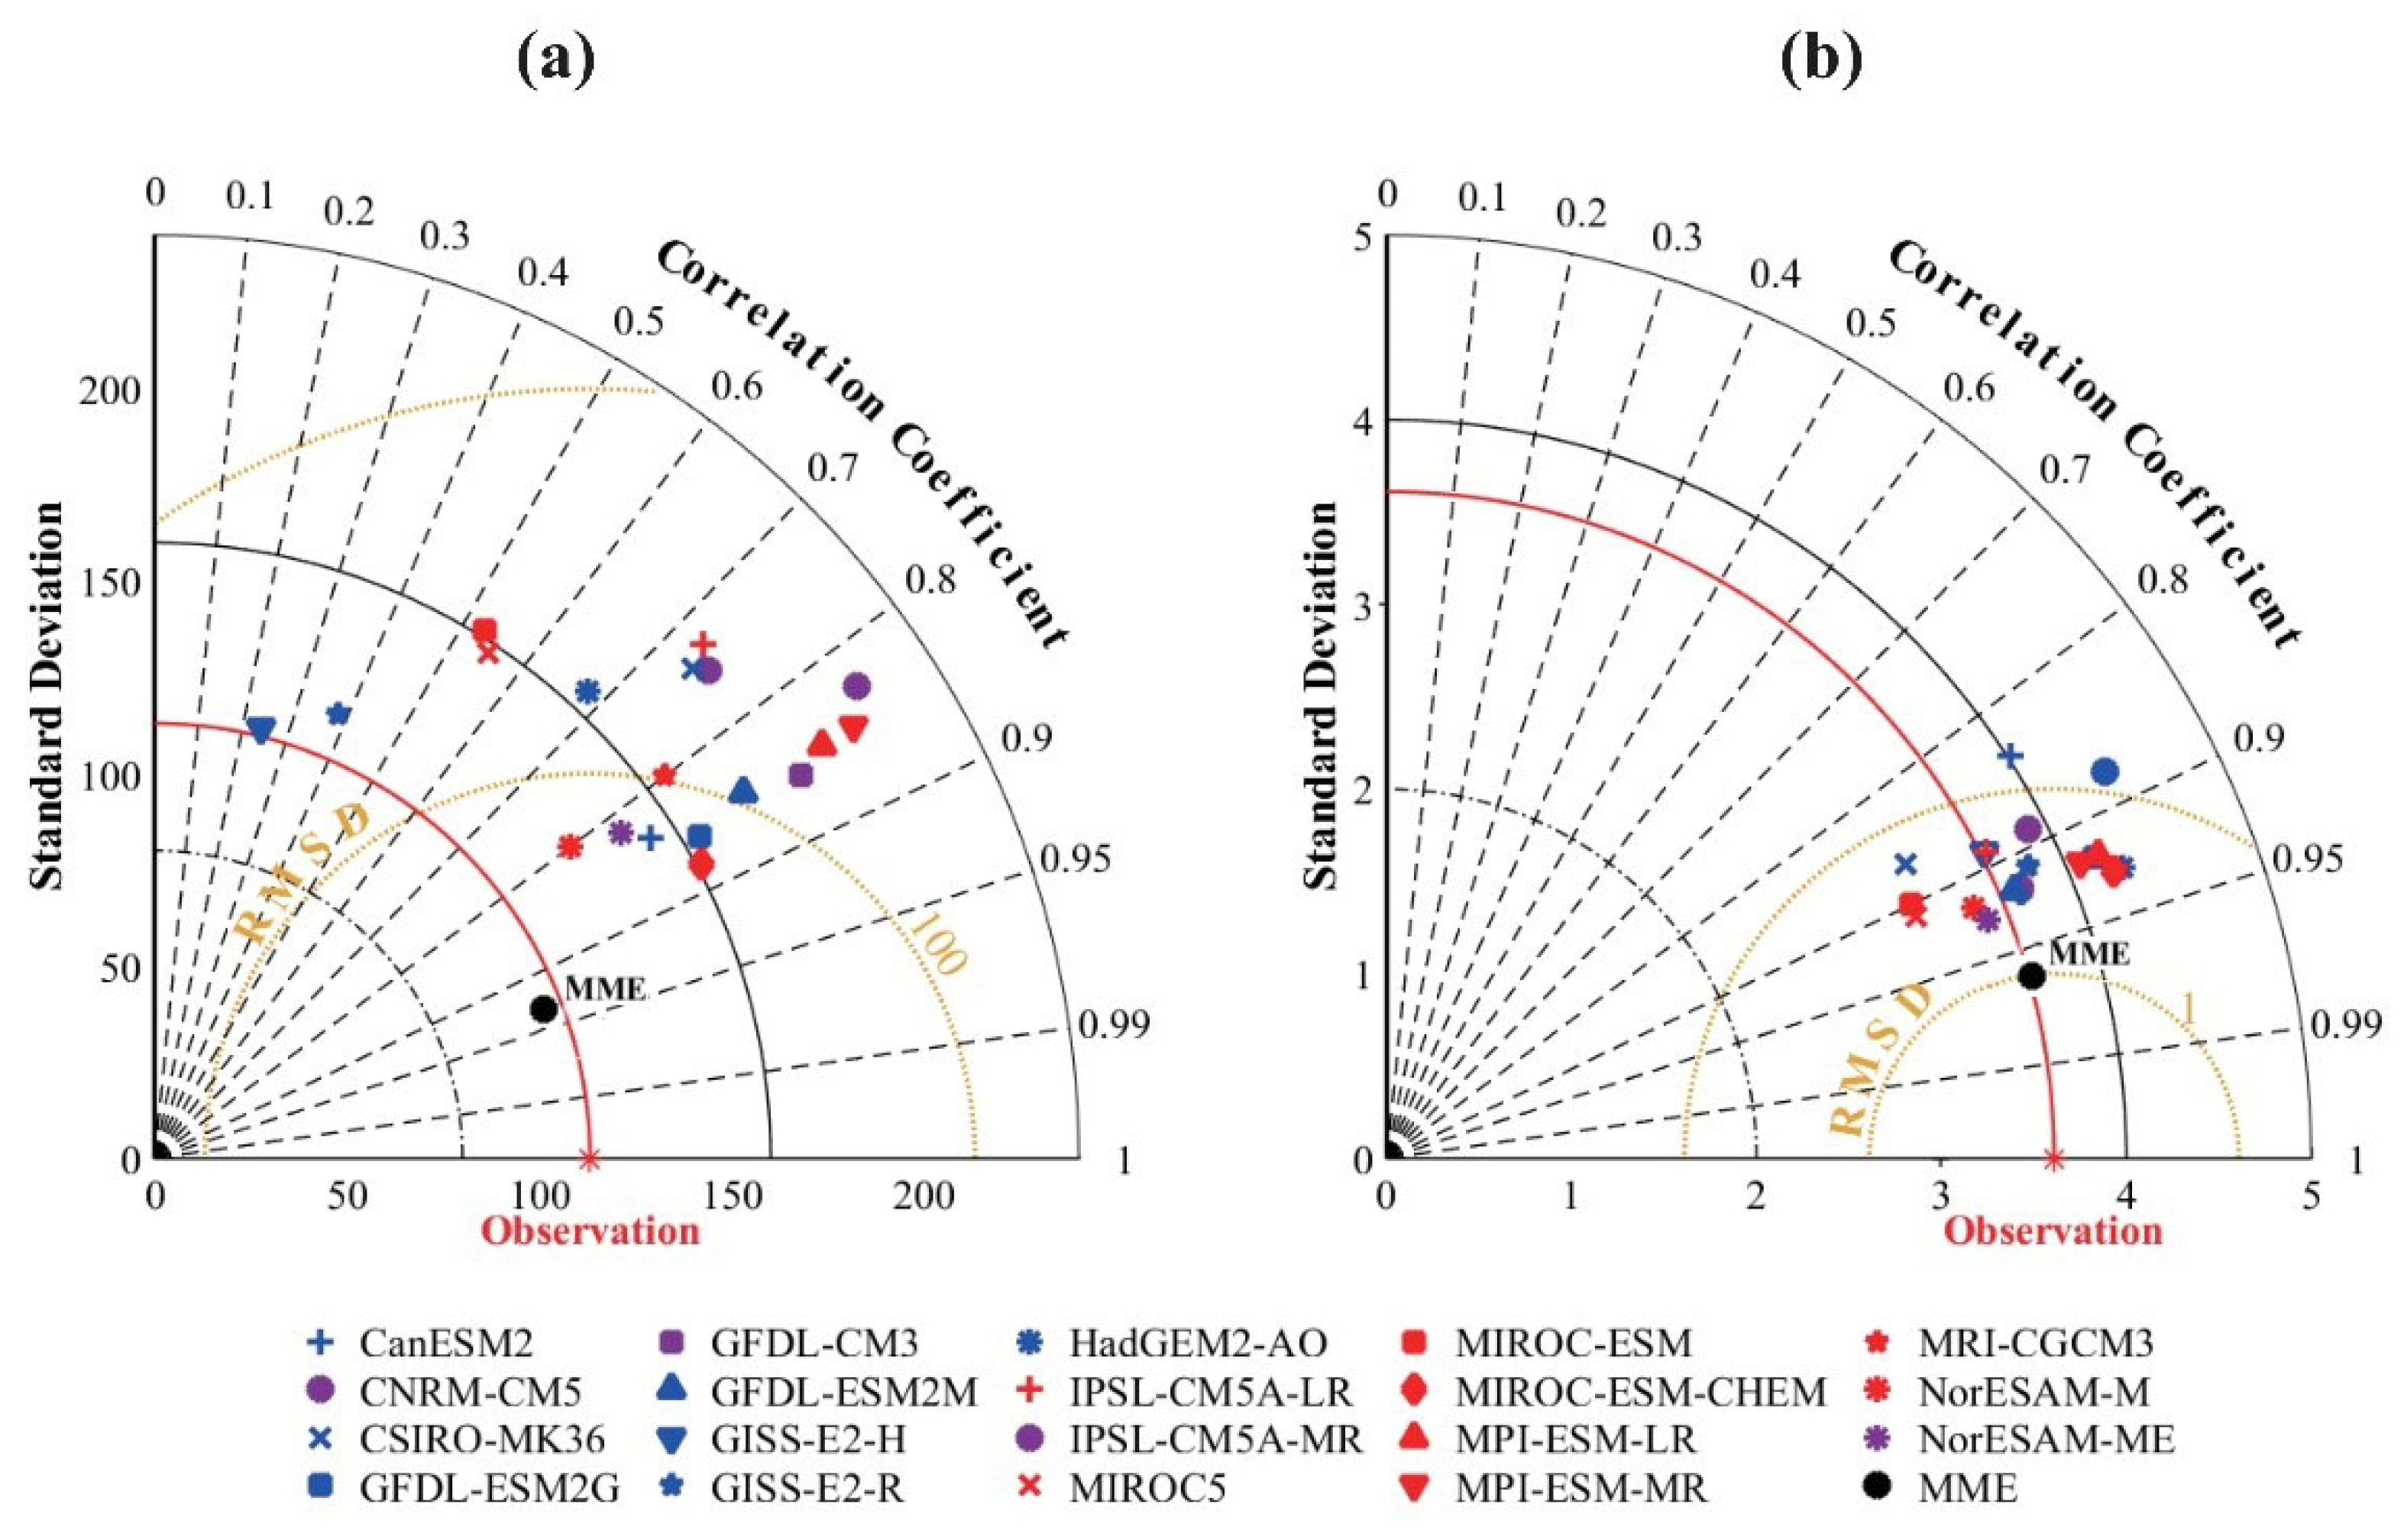
The present study used observation data, 19 CMIP5 models, the multi-model ensemble mean (MME) and Taylor diagrams to select the most suitable climate models for predicting future precipitation and temperature for the Mongolian Plateau. It is worth mentioning that firstly, we calculated the correlation coefficient, root mean square error and standard deviation of 19 single models, and then combined these models (the average of all models) to obtain the MME. Figure 2 shows the Taylor diagram of MME and the average simulated monthly temperature and precipitation of the 19 CMIP models. It is evident from Figure 2 that the different models showed different performances in simulating temperature and precipitation.
The simulations of historic conditions by the majority of the models reflected the spatial distribution of the observation values, with correlation coefficients ranging between 0.4–0.8 and 0.8–0.95 for precipitation and temperature, respectively, and with the standard deviations of simulations also similar to the observed value in temperature. However, the MME of historical simulations of the 19 models was closer to the observed values compared to simulations of individual models, with correlation coefficients for precipitation and temperature of 0.94 (p < 0.01) and 0.96 (p < 0.01), respectively. The standard deviation and root mean square error of the MME were also closer to the observed values compared to that of individual model simulations. These results demonstrated that the MME of historical simulations was more representative of observed monthly temperature and precipitation in the Mongolian Plateau compared to simulations of single models, and therefore that the MME of future simulations would also be reliable.
3.2. Projected Temperature and Precipitation Changes under the Investigated RCP Scenarios
3.2.1. Temporal Changes in Temperature and Precipitation
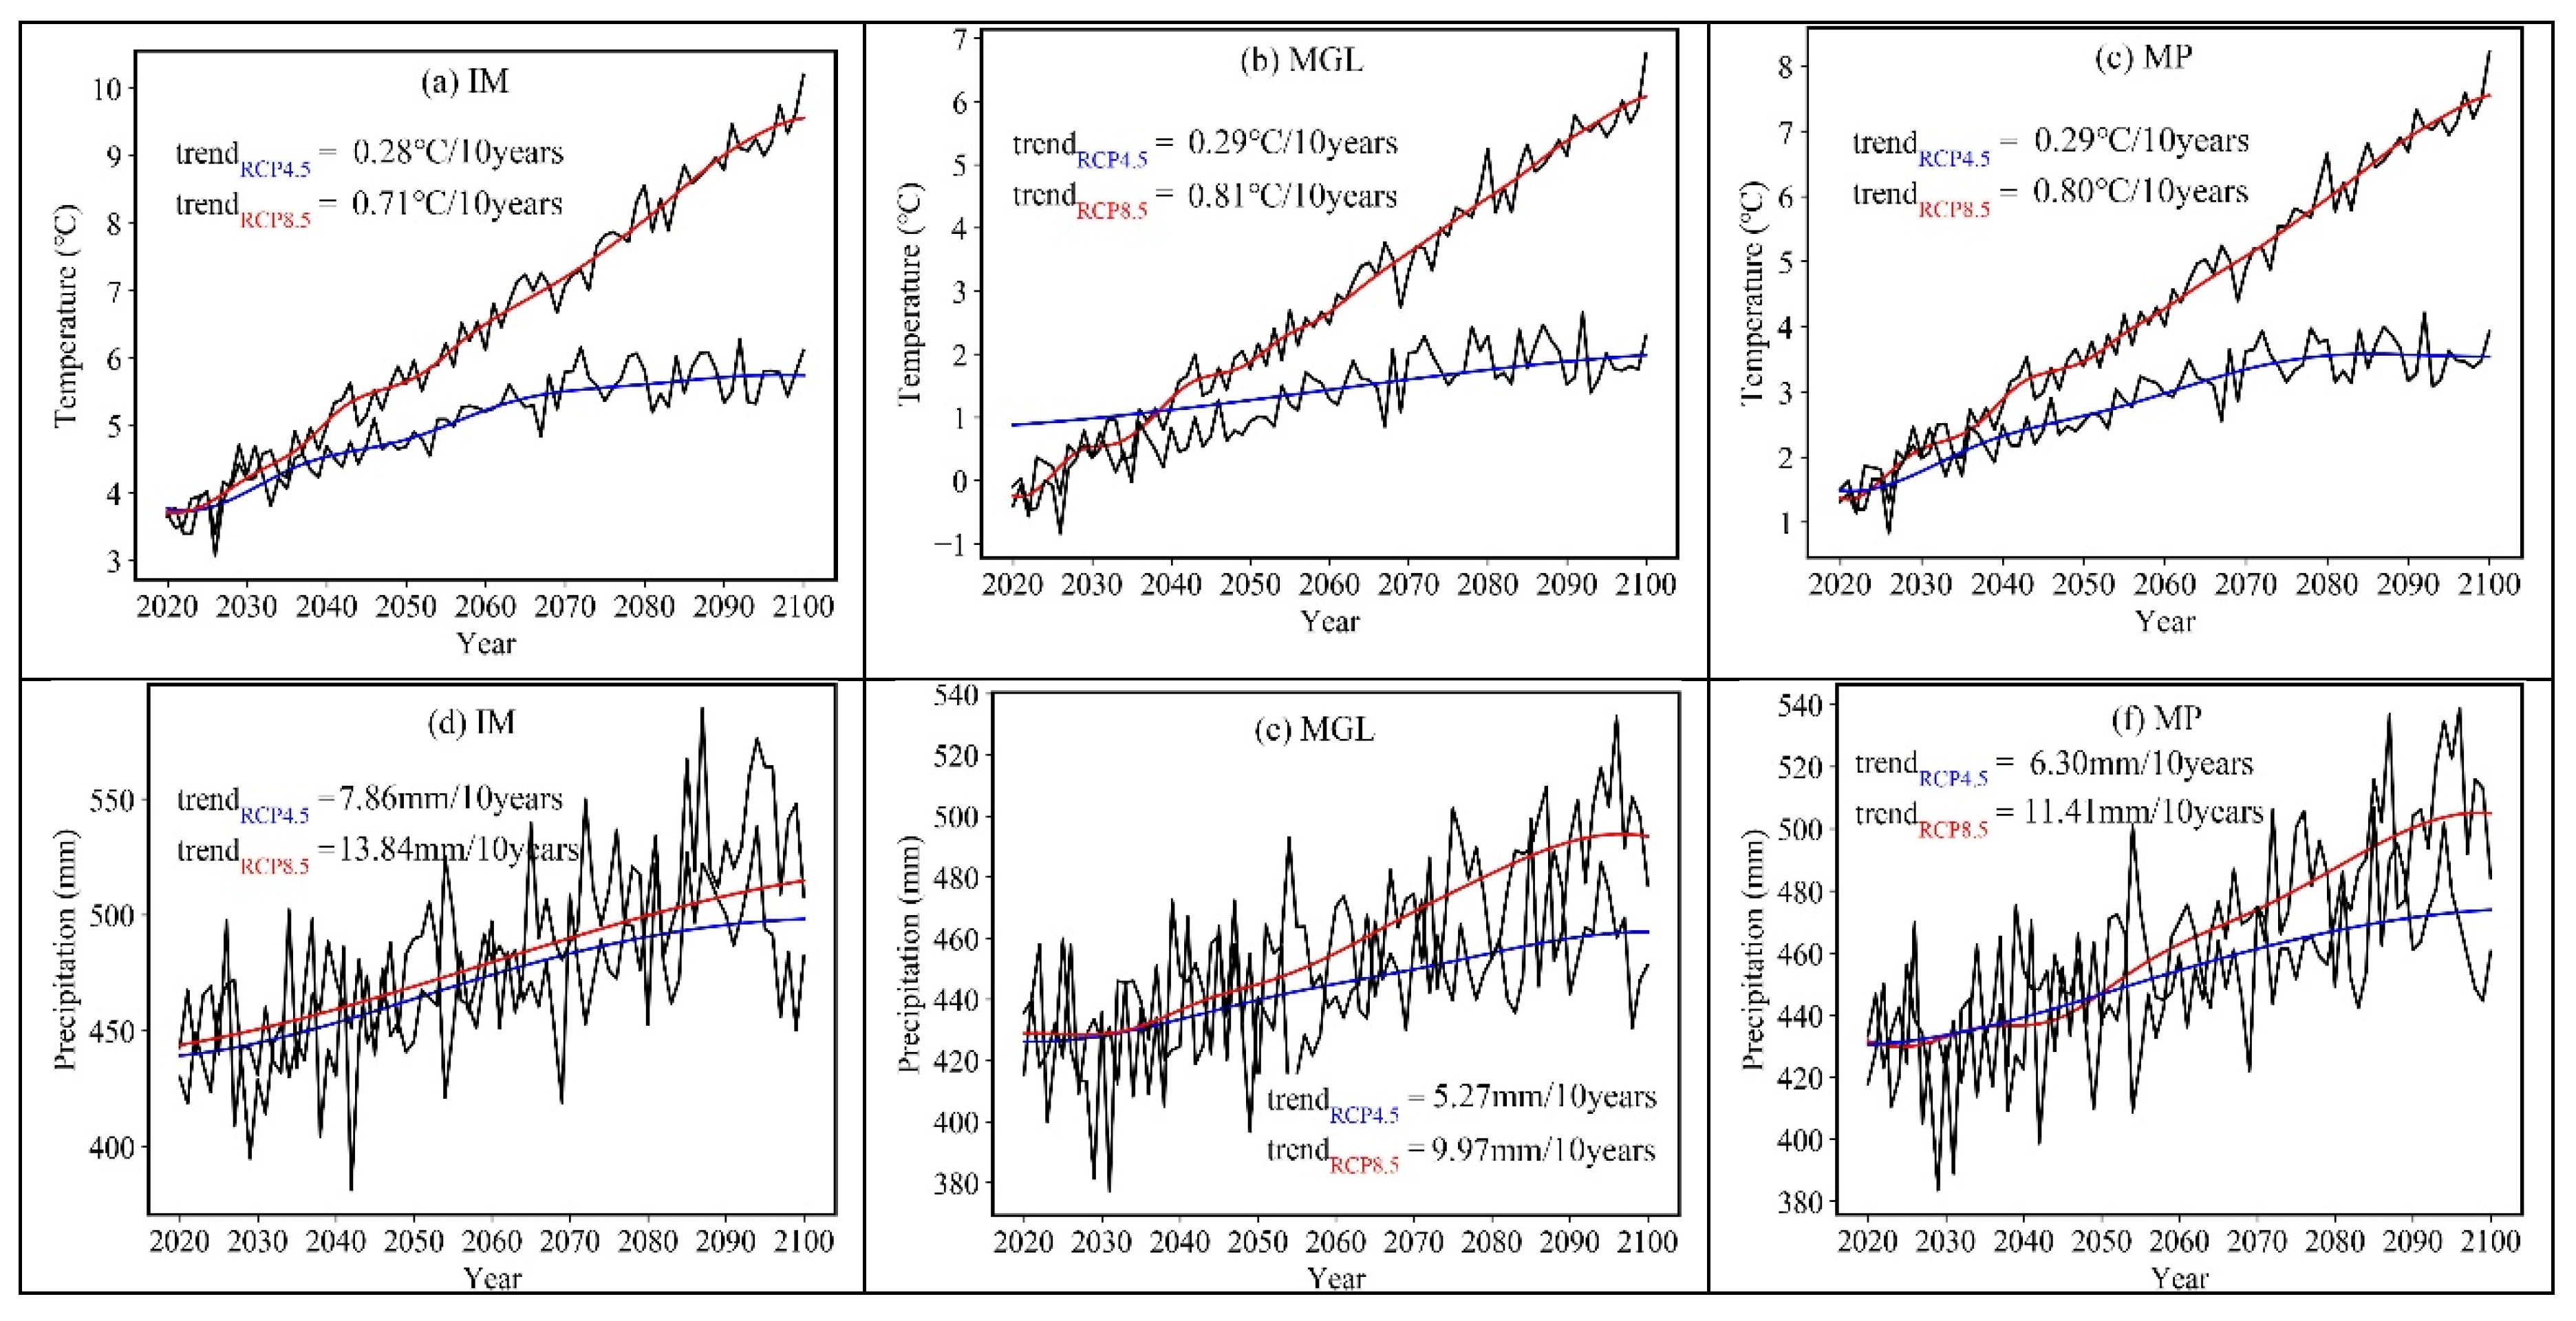
The present study used the EMD to analyze changes in temperature and precipitation under the two different greenhouse gas emission scenarios from 2020 to 2100. The results showed that significant increasing changes in annual mean temperature in Inner Mongolia under the RCP4.5 and RCP8.5 scenarios were 0.28 ℃/10years and 0.71 ℃/10years, respectively (Figure 3a). Changes in annual mean temperature under the RCP4.5 and RCP8.5 scenarios in Mongolia were 0.29 ℃/10years and 0.81 ℃/10years, respectively. There is an obvious intersect point at 2039, and after this the temperature in the two scenarios increased significantly, with a rate of 0.83 ℃/10years in RCP8.5 and 0.23 ℃/10years in RCP4.5 (Figure 3b). The results showed higher warming in Mongolia compared to that in Inner Mongolia. Annual temperature in the Mongolian Plateau under the RCP4.5 and RCP8.5 scenarios increased by 0.29 ℃/10 years and 0.80 ℃/10 years, respectively, over 2020–2100 (Figure 3c). A significant increasing trend in annual mean temperature was generally observed before 2080 under RCP4.5, followed by a stagnation, whereas simulations under the RCP8.5 scenario predicted a rapid increasing trend in temperature after 2040.
Simulations under both the RCP4.5 and RCP8.5 scenarios showed significant increasing trends in annual precipitation in the Mongolian Plateau, and that under the RCP8.5 scenario was larger. Moreover, the rate of increase in annual precipitation was larger in Inner Mongolia than in Mongolia. More specifically, the EMD trends of annual precipitation in Inner Mongolia under the RCP4.5 and RCP8.5 scenarios were 7.86 mm/10 years and 13.84 mm/10 years, respectively (Figure 3d). The annual precipitation in Mongolia under the RCP4.5 and RCP8.5 scenarios had significantly increasing trends, with 5.27 mm/10 years and 9.97 mm/10 years (Figure 3e). Annual precipitation in the Mongolian Plateau showed significantly increasing trends under the RCP4.5 and RCP8.5 scenarios of 6.30 mm/10 years and 11.41 mm/10 years, respectively (Figure 3f). The annual precipitation was stable before 2050, after which it increased significantly.
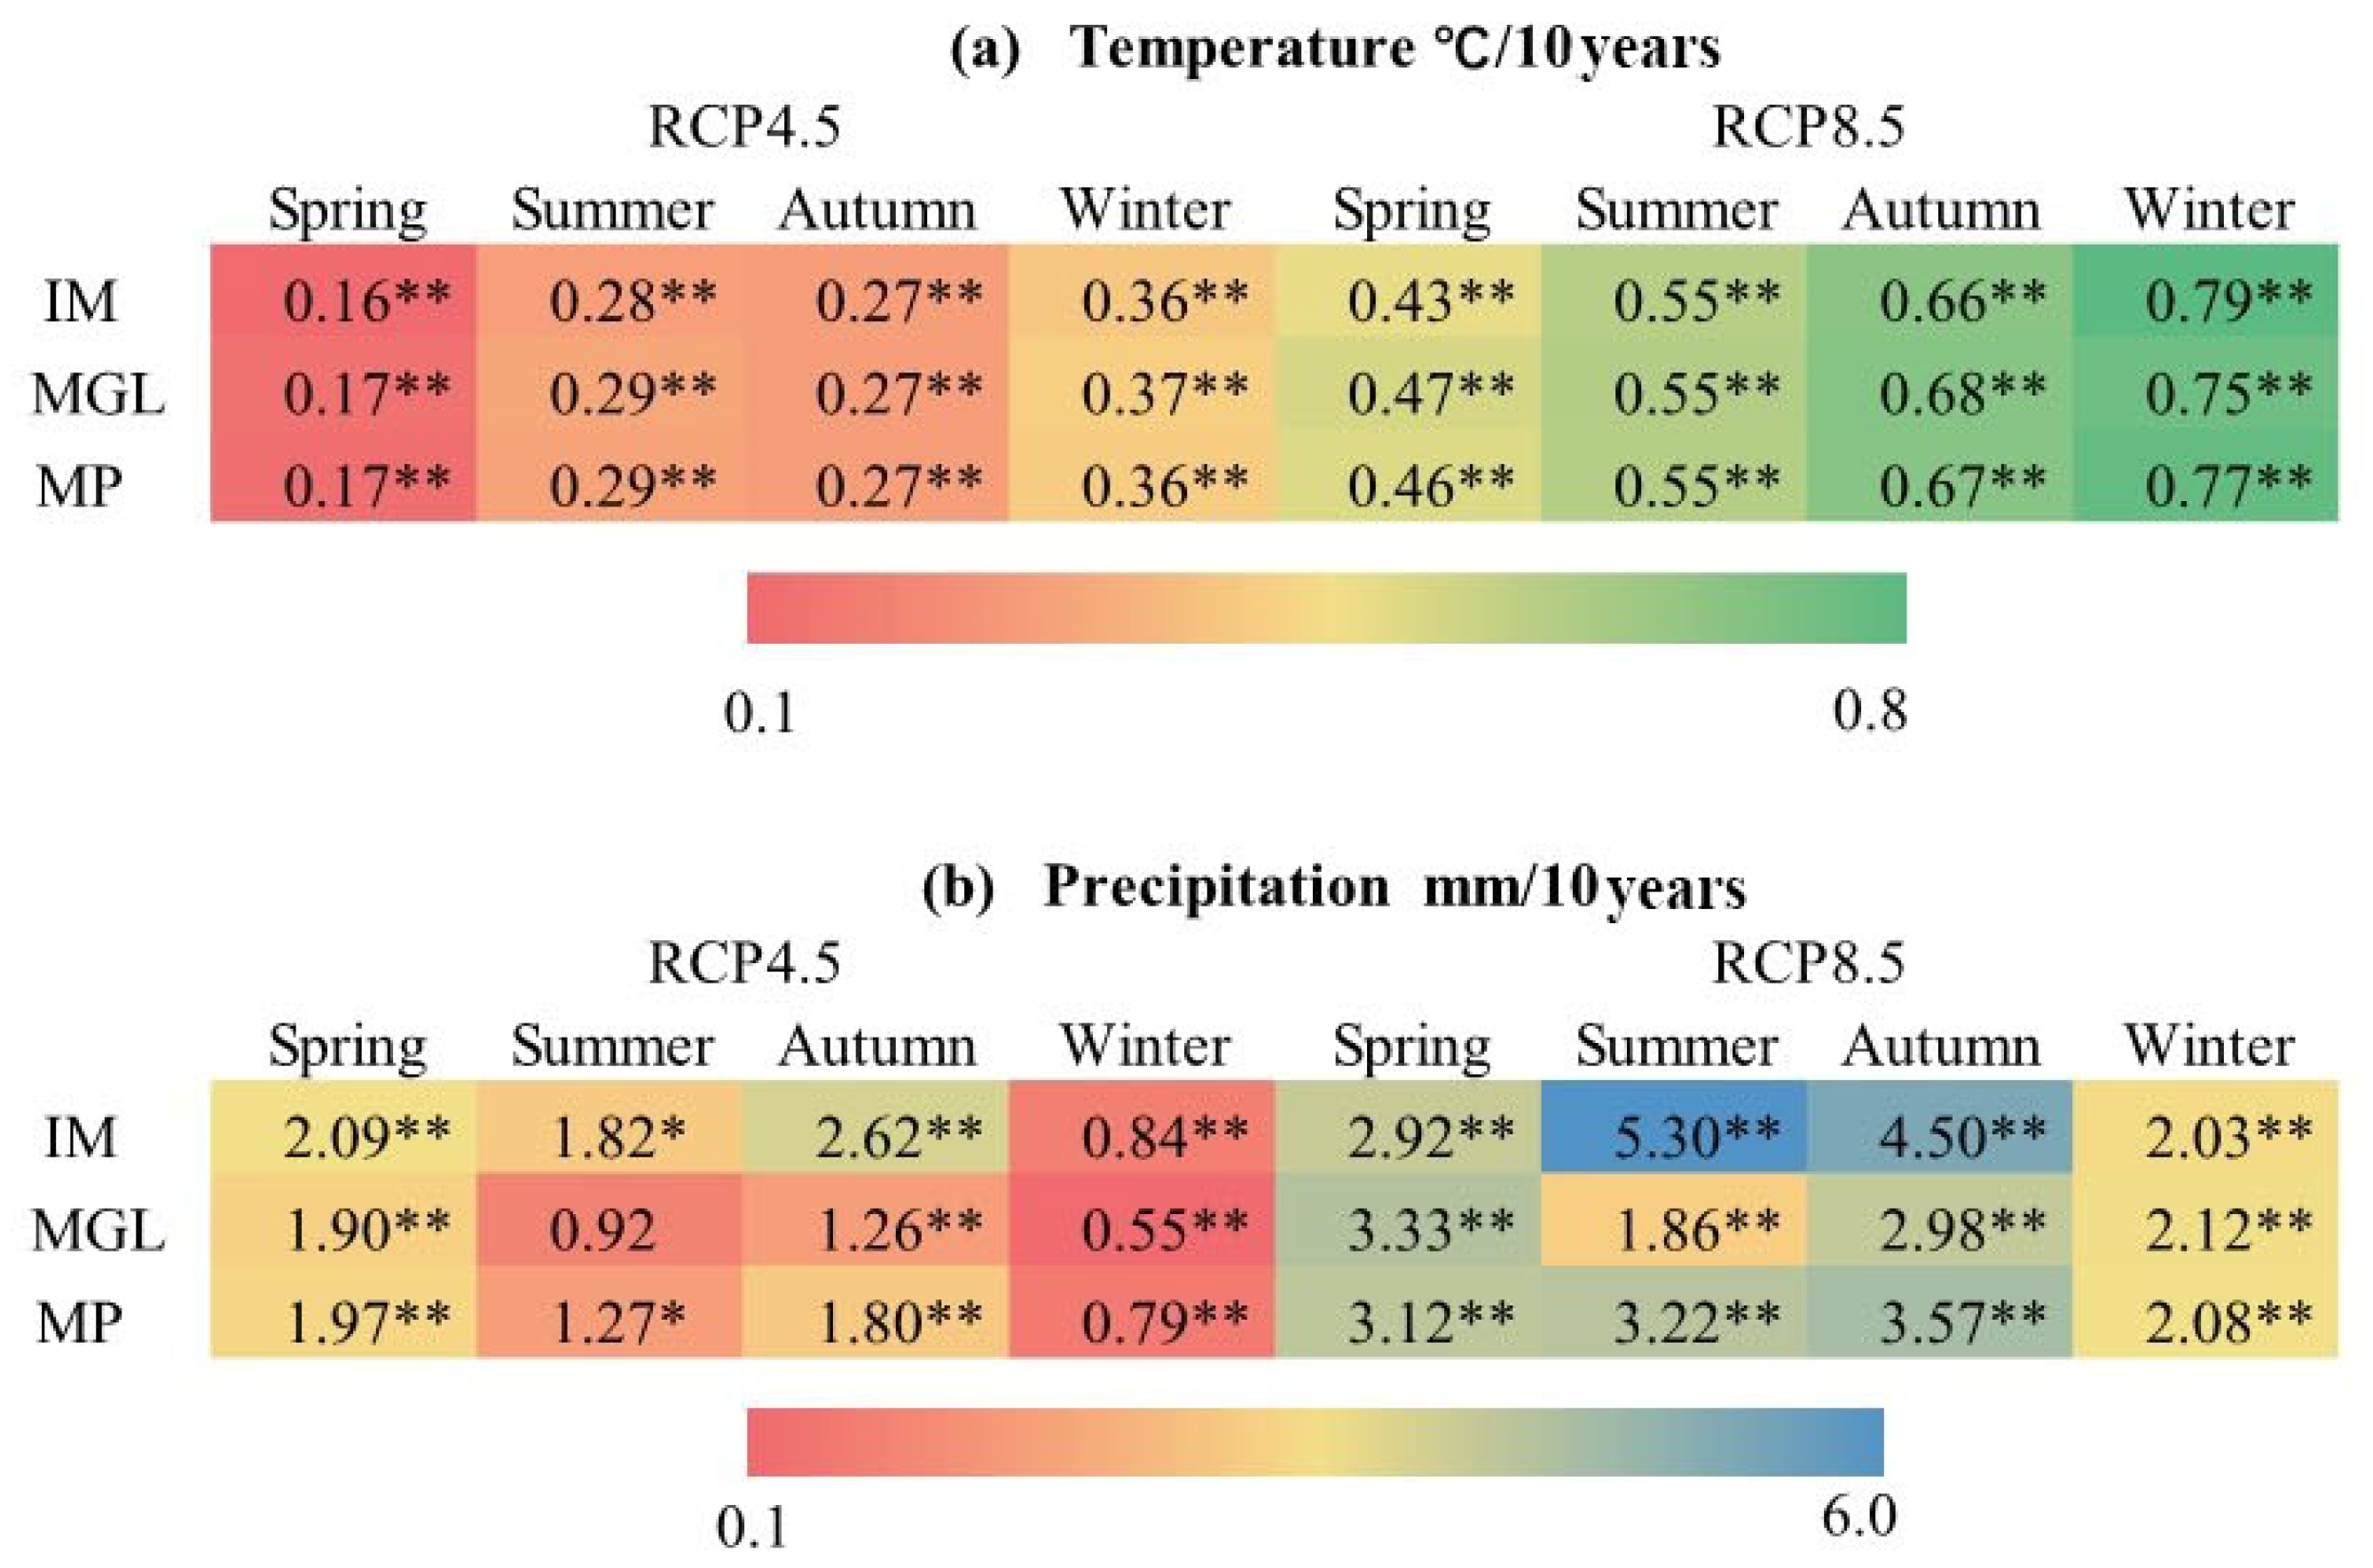
Figure 4 shows the seasonal changes in temperature and precipitation, where it is evident (Figure 4a) that there were significant increases in temperature (p < 0.01) for all four seasons for each region under both RCP scenarios. The warming trend under the RCP4.5 scenario was greatest in winter, followed by summer, autumn and spring, with temperature increases ranging from 0.16 ℃/10 years to 0.29 ℃/10 years. Warming trends over all seasons in Mongolia were greater than those in Inner Mongolia under the RCP4.5 scenario. The results generally showed an increasing warming trend with increasing greenhouse gas emissions. The rate of warming under the RCP8.5 scenario was more than two-fold higher than that under the RCP4.5 scenario. For example, the warming trends over spring in the Mongolian Plateau were 0.17 ℃/10 years and 0.46 ℃/10 years under the RCP4.5 and RCP8.5 scenarios, respectively. Rates of temperature increase ranged from 0.43 ℃/10 years to 0.79 ℃/10 years under the RCP8.5 scenario. The highest rates of temperature increases in the three regions occurred over winter, followed by autumn, summer and spring.
Figure 4b shows seasonal changes in precipitation, where it is evident that there were increases in precipitation over all seasons, with the rates of increases different for different seasons and the increases under RCP8.5 larger than that under RCP4.5. The increases in precipitation in Inner Mongolia over summer were much larger than that in Mongolia, with values of 1.82 mm/10 years and 0.92 mm/10 years, respectively. Increases in precipitation in Inner Mongolia for all four seasons were greater than that in Mongolia. The greatest rate of precipitation increase for the Mongolian Plateau was for spring, followed by autumn, summer and winter under the RCP4.5 scenario. There were significant increases in precipitation for all seasons under the RCP8.5 scenario, and the rate of increase in summer precipitation in Inner Mongolia was highest at 5.30 mm/10 years. Rates of increase in precipitation in spring and winter were greater in Mongolia that those in Inner Mongolia, while the increase in precipitation in summer and autumn in Inner Mongolia is greater than that in Mongolia. Over the entire study area, the highest rate of increase in precipitation was in autumn, followed by summer, spring, and winter under the RCP8.5 scenario.
3.2.2. Spatial Changes in Temperature and Precipitation
Figure 5 shows the spatial distribution of variation in future temperature and precipitation in the Mongolian Plateau under different RCP scenarios during 2020–2100. There were significant increases in temperature under both scenarios. Temperature under the RCP4.5 scenario increased at a rate ranging between 0.24 ℃/10 years~0.34 ℃/10 years, where the increasing rate in the western part of Mongolia was higher than that in the eastern part, and in Inner Mongolia it gradually increased from the west to the east (Figure 5a). While the temperature changes under RCP8.5 showed a similar spatial trend, the extent of temperature change was larger, ranging between 0.71 ℃/10 years~0.88 ℃/10 years (Figure 5b). Under both scenarios, the increasing rates of temperature in the north of the plateau were higher than those to the south. The western and northeastern regions of Inner Mongolia showed the highest and lowest increases in temperature, respectively
Changes in precipitation under the RCP4.5 scenario significantly increased at a rate ranging from 2.8 mm/10 years to 13.4 mm/10 years and the increases in precipitation were higher to the west of the plateau compared to those in the east under RCP4.5 (Figure 5c). Changes in precipitation under the RCP8.5 scenario ranged from 3.9 mm/10 years to 21.9 mm/10 years, with significant increasing changes over the plateau (Figure 5d). The highest and lowest precipitation occurred in the eastern parts of Inner Mongolia and the western region of Mongolia, respectively. Increases in precipitation in Inner Mongolia were larger than those in Mongolia, and those to the east of the plateau were higher than those to the west under both scenarios.
3.3. Projected Changes in Drought Under the RCP Scenarios
3.3.1. Variations in Future Drought
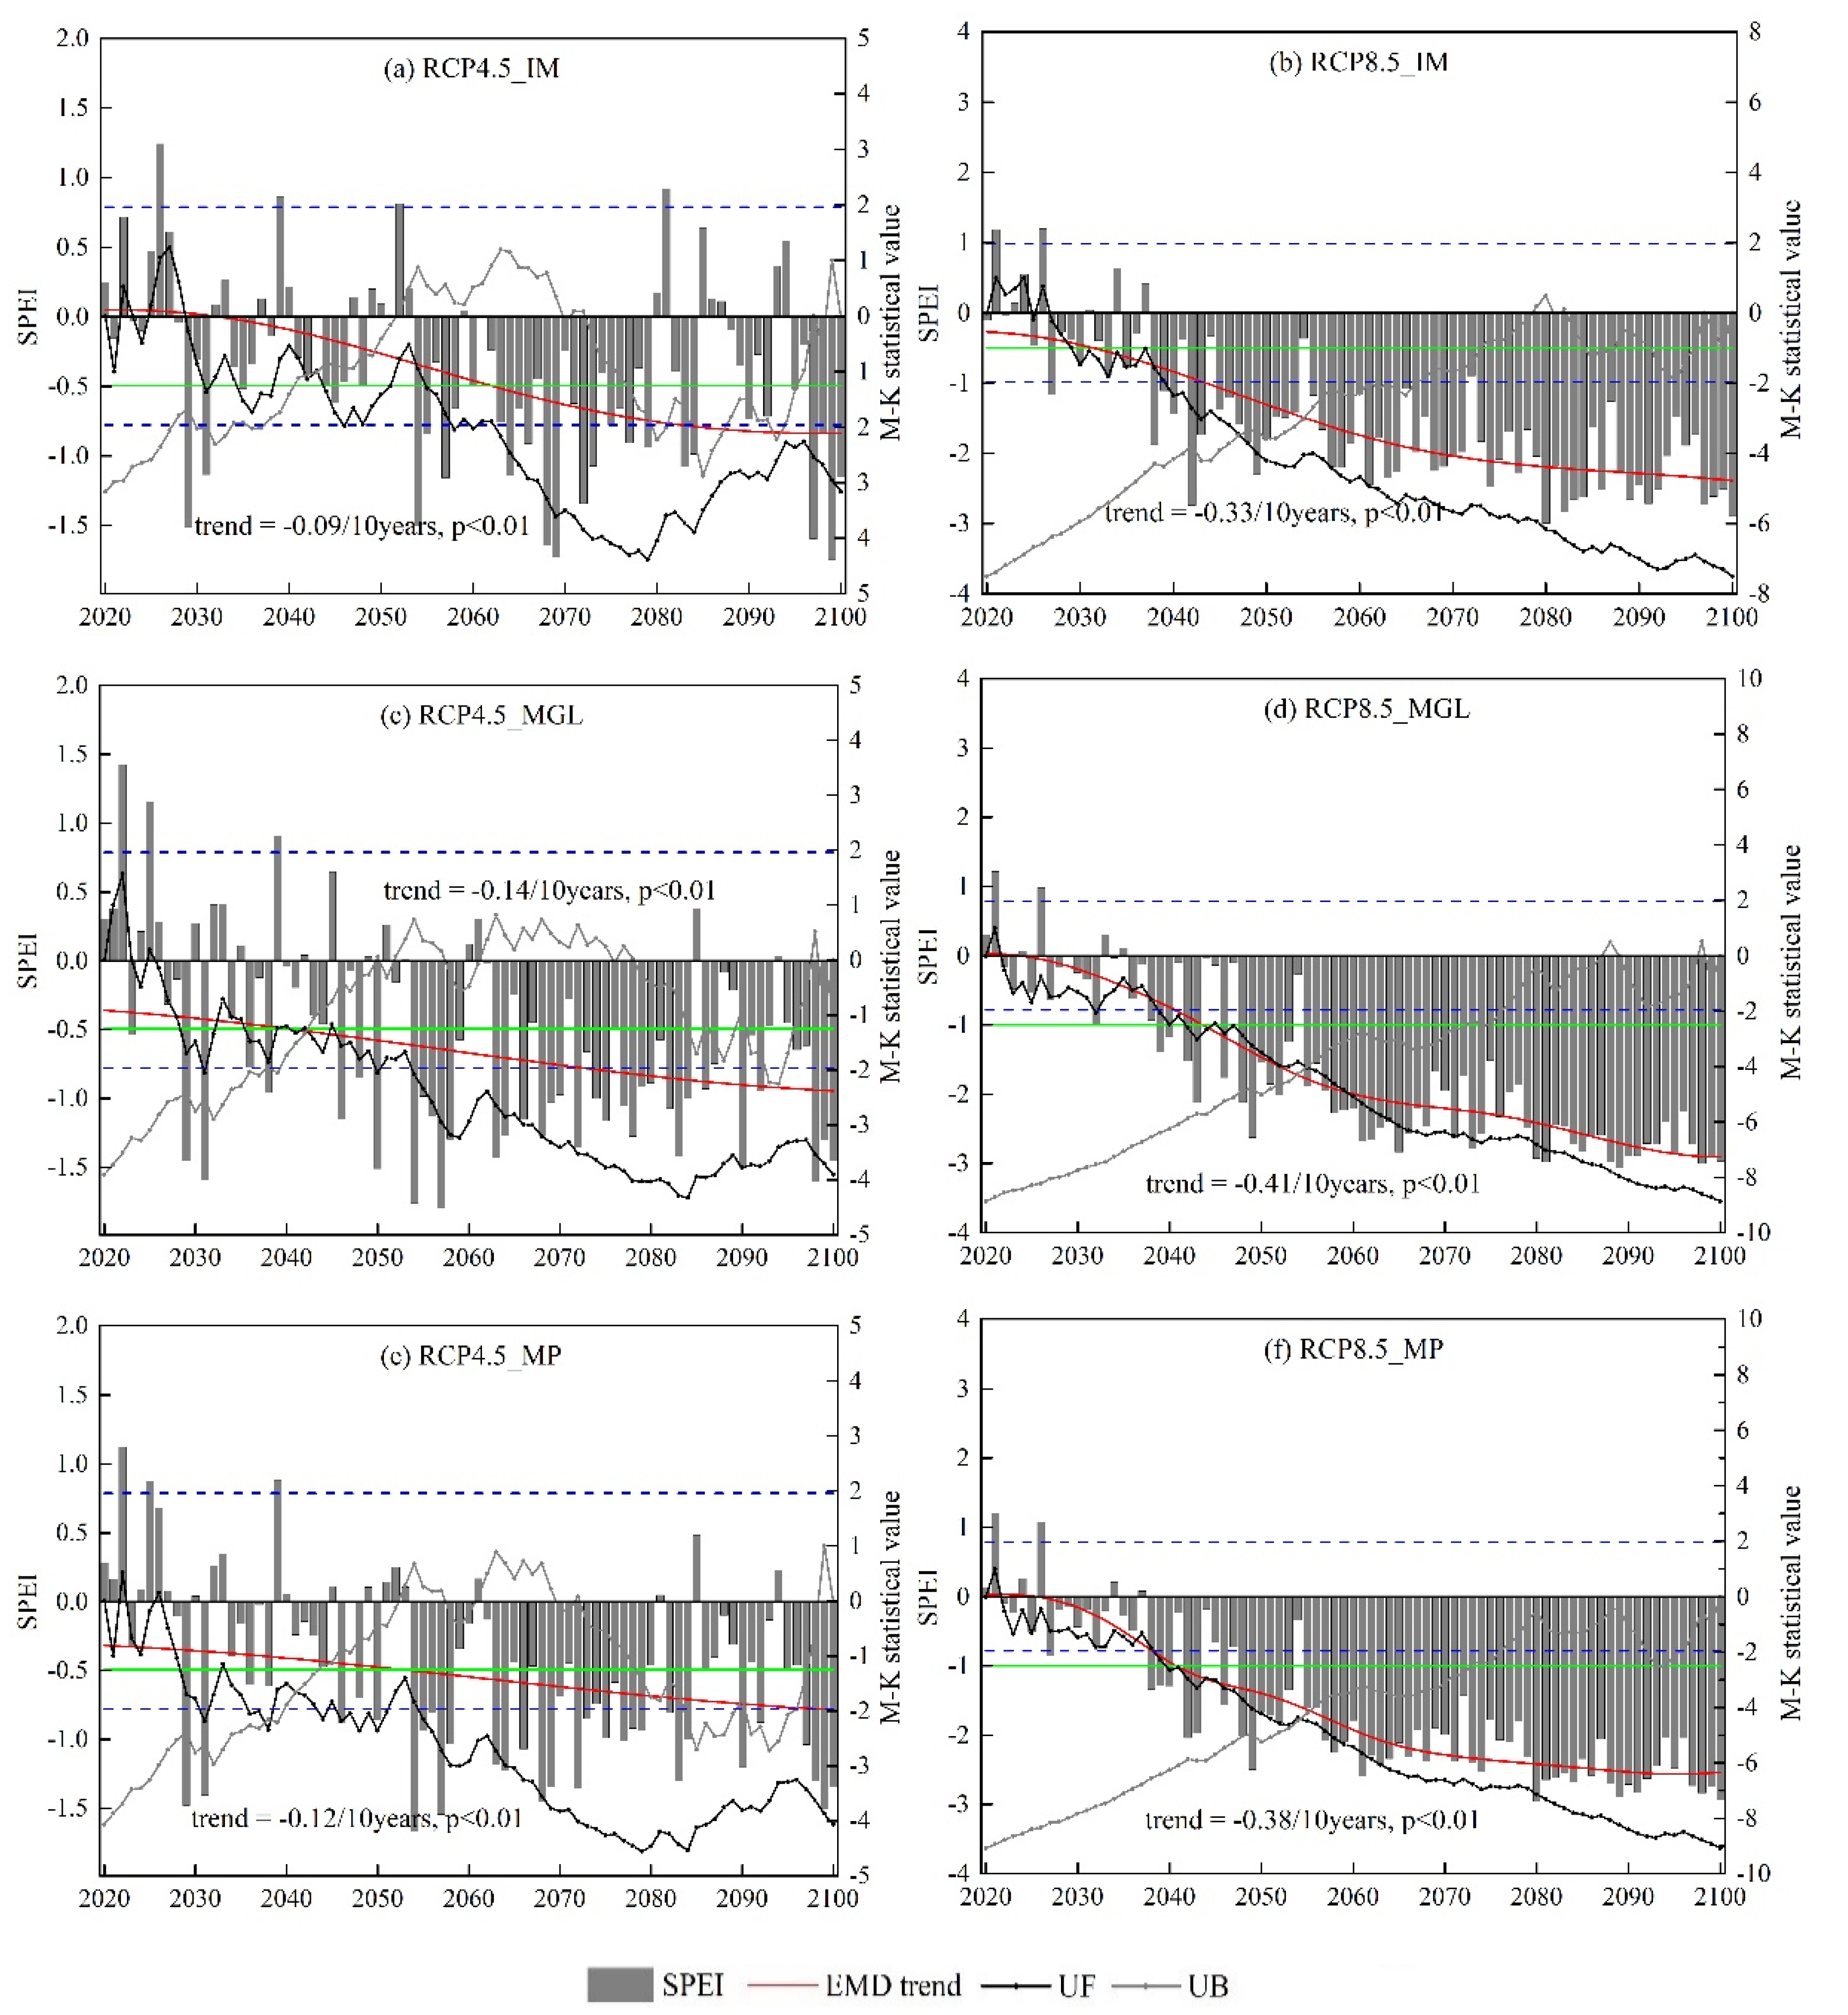
Figure 6 shows the temporal variability of the annual SPEI in the Mongolian Plateau for the different RCP scenarios. It is evident that under the RCP4.5 scenario, the annual SPEI in Inner Mongolia decreased at a rate of −0.09/10 years, with the change becoming significant in 2041, prior to which normal wet conditions were observed, whereas droughts occurred more frequently after 2041 and a severe drought occurred in 2069 (Figure 6a). There was a significant decline in the annual SPEI in Inner Mongolia under the RCP8.5 scenario of −0.33/10 years (p < 0.01) during 2020–2100, with an abrupt change occurring in 2047 (Figure 6b), and 31 severe drought (SPEI ≤ −1.5) years predicted to occur after 2047. Changes in the annual SPEI in Mongolia under the RCP4.5 and RCP8.5 scenarios were −0.14/10 years and −0.41/10 years, respectively (Figure 6c,d). Drought under RCP8.5 was more severe than that under RCP4.5, with 45 and 5 severe drought years predicted after 2055 and 2042, respectively.
There was a significant decline in the annual SPEI in the Mongolian Plateau under the RCP4.5 scenario after 2041, with droughts predicted after this (Figure 6e). There was a significant decline in the SPEI in the Mongolian Plateau of −0.38/10 years under the RCP8.5 scenario, with drought frequency increasing over time. The year 2054 marked a threshold after which drought occurred frequently (Figure 6f).
Figure 7 shows the spatial changes in the SPEI in the Mongolian Plateau during 2020–2100 under the two RCP scenarios, where it is evident that there was a decline in the annual SPEI for the majority of regions under the RCP4.5 scenario, indicating intensification of drought over the study period. Areas showing a significant decline in the SPEI accounted for 60.3% of the total area and were mainly distributed in the western parts of Mongolia (Figure 7a). All regions of the Mongolian Plateau showed declines in the SPEI under the RCP8.5 scenario, with the magnitude of decline intensifying from east to west. In addition, the decline was not significant for the northernmost part of Mongolia. Figure 7b shows that there was a larger range of SPEI change under the RCP8.5 scenario than under the RCP4.5 scenario, indicating more severe drought under the RCP8.5 scenario. The decline in the SPEI was greater in the north compared to the southern plateau. Drought in Mongolia was more severe than that in Inner Mongolia, and drought in the west was more severe than that in the eastern plateau.
3.3.2. Changes in Future Drought Frequency
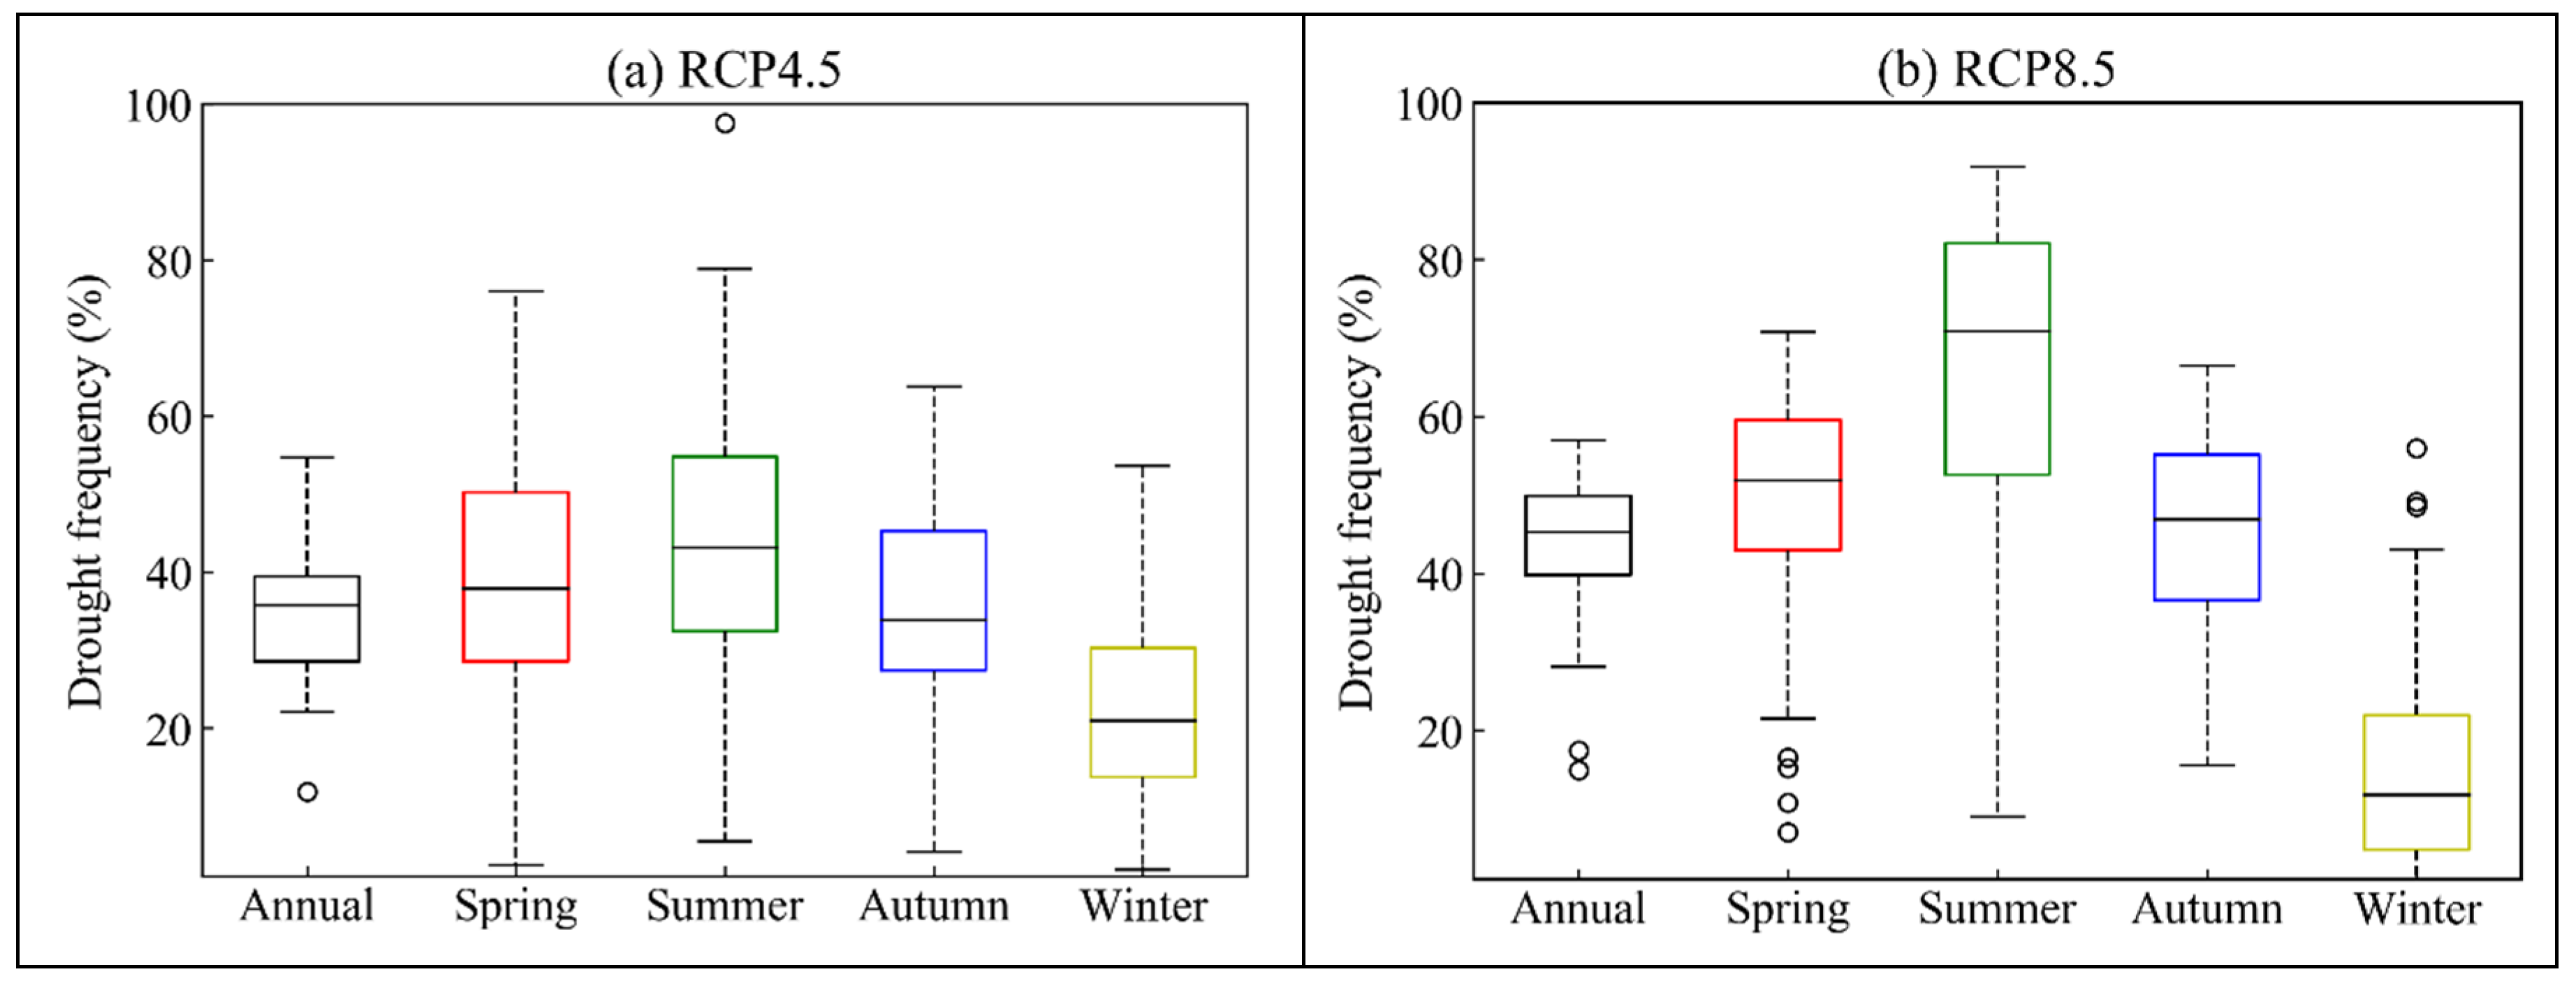
Figure 8 shows the frequency of seasonal droughts with an SPEI < −0.5 in the Mongolian Plateau under the different scenarios from 2020 to 2100. Annual drought frequency mainly ranged from 28–40% under the RCP4.5 scenario. Droughts were most frequent in summer, followed by spring, autumn and winter, with drought frequency in winter between 13–30% (Figure 8a). The annual frequency of droughts increased to 39–50% under the RCP8.5 scenario (Figure 8b). Droughts under this scenario were also most frequent in summer, followed by spring, autumn and winter. Except for winter, the frequencies of droughts under RCP8.5 for all seasons were higher than those under RCP4.5, indicating that the droughts were more severe under the RCP 8.5 scenario.
Figure 9 shows the spatial distribution in drought frequency under the different greenhouse gas emission scenarios in the Mongolian Plateau during 2020–2100. The study period was divided into three intervals of 2020–2040, 2041–2070 and 2071–2100 representing the early 21st century, the mid-21st century and the late 21st century, respectively, to better illustrate changes in drought frequency. It is evident in Figure 9 that there were obvious spatial differences in drought frequency for different scenarios and for different periods.
Figure 9 shows that drought frequency under both scenarios was highest by the end of the 21st century, followed by the mid-21st century and early 21st century. During the early 21st century, the drought frequency ranged between 18–30% for both scenarios, with a larger area of land under the RCP8.5 scenario having higher drought frequencies than that under the RCP4.5 scenario. During the mid-21st century, the frequency of drought increased to 26–56% and 23–62% under the RCP4.5 and RCP8.5 scenarios, respectively, with drought frequency increasing compared to the previous interval. The frequency of drought increased to 24–58% and 32–68% by the end of the 21st century under the RCP4.5 and RCP 8.5 scenarios, respectively, with drought frequency increasing from east to west.
3.3.3. Spatial Patterns of Drought by EOF
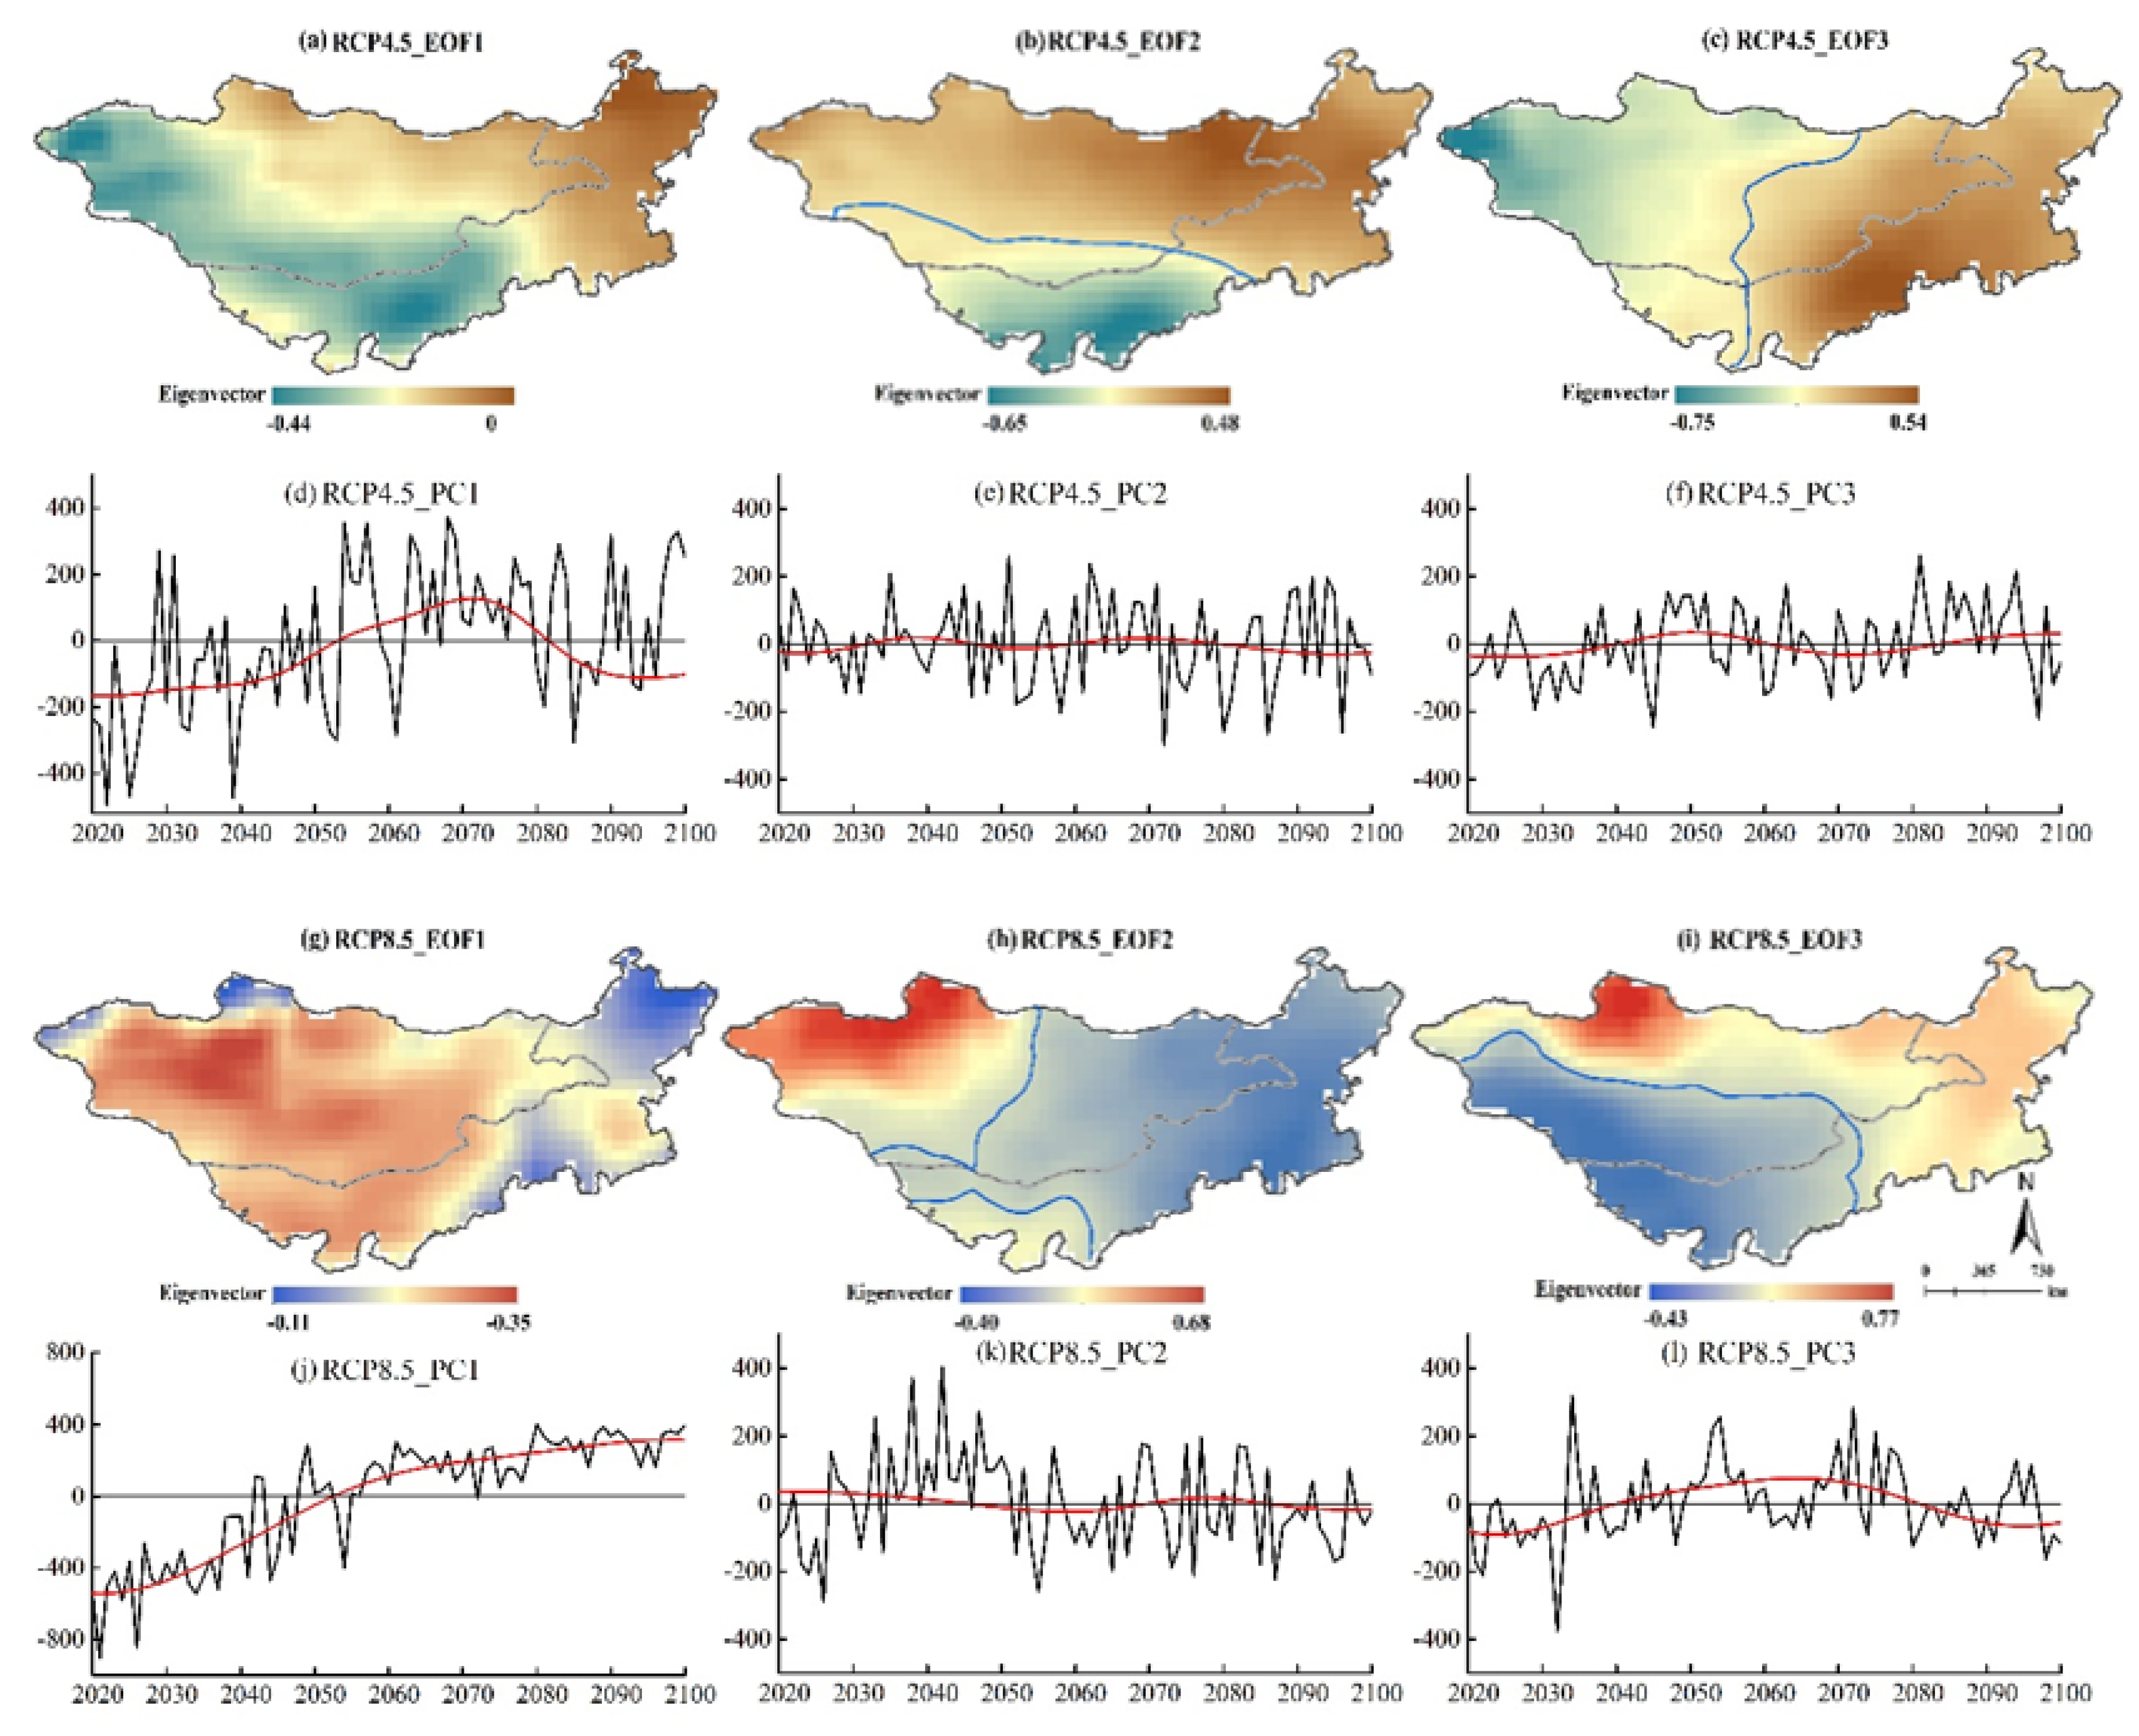
Table 2 shows the statistic of explained variance of the leading EOFs of annual SPEI. It can be seen that the first three modes explain more than 65.6% and 75.0% of the total variance in the SPEI under the RCP4.5 and RCP8.5 scenarios, respectively. Therefore, the first three EOFs and their corresponding principle components (PCs) can be used to identify the main characteristics of drought patterns. Figure 10 shows a plot of eigenvalues and eigenvectors of the annual SPEI under the RCP4.5 and RCP8.5 scenarios based on EOF analysis.
The first component, EOF1, accounted for 40.7% of the total variance under the RCP4.5 scenario (Table 2), with a negative value over the entire plateau. The time coefficient was positive before 2053 and negative until 2081 and then positive thereafter, indicating that the climate has a change of dry–wet–dry. The linear PC1 time series exhibited an increasing trend, indicating that drought severity became more severe in 2020–2100 (Figure 10a,d). The second component, EOF2, explained 14.3% of the total variance and reflected the antiphase distribution corresponding to the southwest region of the plateau in Inner Mongolia with a negative EOF, and the northeastern region of the plateau with a positive EOF (Figure 10b). PC2 showed a decreasing trend, indicating that west of Inner Mongolia became wetter and the other regions became drier (Figure 10e). A negative EOF3 occurred in the western part of the plateau, whereas positive regions were evident in the eastern part (Figure 10c). PC3 showed an increasing trend (Figure 10f), with drought increasing in the western part of the plateau and the eastern part becoming wetter.
EOF1 of the annual SPEI explained 57.8% (Table 2) of the total variance under the RCP8.5 scenario and was negative. The PC1 showed a strong increasing trend and the eigenvector value was negative (Figure 10g,j), reflecting coherent drought over the Mongolian Plateau for 2020–2100. The climate was relatively wet before 2051 but became dry after 2051. The EOF2 explained 10.5% of the total variance and revealed the western and eastern portions of the antiphase distribution (Figure 10h). The linear PC2 time series showed a decreasing trend (Figure 10k), with the west becoming drier and the east becoming wetter. The third component, EOF3, accounted for 6.7% of the total variance and reflected the antiphase distribution corresponding to the eastern and western regions of the plateau with positive and negative EOF values, respectively. PC3 showed a slightly increasing trend, indicating that the eastern region of the plateau became wetter, whereas the western region became drier (Figure 10i,l).
4. Discussion
The study of future climate change in the Mongolian Plateau is of particular importance. The present study therefore identified future spatiotemporal changes in temperature, precipitation and drought for the Mongolian Plateau based on 19 CMIP5 models. The MME was shown to be more representative of observed data compared to simulation results of any single model, as found previously [38,39].
The present study found that there will be significant warming of the Mongolian Plateau under the two investigated RCP scenarios, with that under the RCP8.5 scenario higher than that under the RCP4.5 scenario. Increases in temperature were evident across all seasons, with the highest warming occurring during winter. These future climate trends identified in the present study were similar to trends in temperature identified in research conducted at a global scale, in China and in arid and semiarid areas in general [43,44,45]. Increases in temperature were more extreme in Mongolia than in Inner Mongolia, consistent with the findings of Jiang et al. and Liu et al. [31,46]. The results showed a future increasing precipitation trend in the Mongolian Plateau, with the increase in Inner Mongolia larger than that in Mongolia. This result is consistent with a previous study, which showed that precipitation in the middle–high latitudes of the northern hemisphere will increase in the future [1,47]. Within the context of global warming, variation in the difference between land–sea temperature results in the enhancement of East Asian atmospheric circulation in summer, with the enhancement in the north greater than that in the south, which may explain the rise in precipitation in the northern part of Eastern Asia [43,48]. Moreover, a study by Jiang et al. [31] suggests that the Mongolian Plateau will experience significant climate warming and accompanying increased precipitation in the coming century. Therefore, the approach of using temperature and precipitation model data to calculate drought and to analyze future drought trends is to some extent reliable. Besides, it was proved that the SPEI has strong ability of monitoring and evaluating drought and flood; where SPEI-1 can reflect the frequent alternation of monthly drought and flood, SPEI-3 and SPEI-6 reflect the changing regularity of the wet–dry season and SPEI-12 can be used to identify the influence and duration of long-term drought and flood [49,50]. Therefore, the SPEI-3 and SPEI-12 were selected to analyze the seasonal and annual droughts.
The annual SPEI of the Mongolian Plateau showed a significant downward trend from 2020 to 2100, indicating a progressively increasing drought in the future, with the highest drought intensity and frequency by the end of the 21st century. The results showed that the drought magnitude under the RCP8.5 scenario was more severe than that under the RCP4.5 scenario. The results of the present study were consistent with those of studies related to future drought projection in arid areas. For example, the study of Naumann et al. [51] showed that drought is expected to increase rapidly. The study in China showed an increased frequency of drought and a decreasing frequency of wet years, and that the frequencies of short- and long-term droughts in Inner Mongolia will largely increase in the future [46]. Other studies have shown that drought in Mongolia will be more severe than in Inner Mongolia, with drought being more extreme in the west of the plateau compared to in the east, and with these projected trends being consistent with observed trends in the Mongolian Plateau during 1980–2014 [26]. In general, the results of the present study showed an intensification of drought in the Mongolian Plateau in the future, possibly because of the continuation of contemporary warming rates and water supply–demand deficits [45,51]. The increasing frequency and severity of drought will have certain negative effects on socioeconomic development and the ecological environment. Thus, effective measures to mitigate future drought should be developed.
Although the present study used the latest CMIP5 models and selected the optimal models from this set, some uncertainties remain. Certain shortcomings in climate simulation persist due to uncertainty or incompleteness of the atmospheric greenhouse and emission scenarios, the complexity of the climate and limitations to available data, and therefore, some uncertainty in the model results persists [52]. While simulations of absolute values of temperature and precipitation by models remain uncertain, it is generally accepted that trends and average values observed over a wide range of models are highly reliable [53,54]. Since the spatial resolutions of the model used were different, all models were resampled to have the same resolution of 0.5° × 0.5° in the current study to facilitate comparison, and this introduced some errors, like overestimation or underestimation, into the simulation results. Therefore, future studies should use a larger number of climate models with improved simulation capabilities, optimal emission scenarios, most appropriate downscaling methods and drought indicators for centralized analysis to more reasonably predict future drought conditions in the Mongolian Plateau under global warming. The results of the current study can act as a reference for developing adaptation and response measures to climate change.
5. Conclusions
The present study used precipitation and temperature data from 19 GCMs, the Taylor diagram and MME to evaluate the simulation model applicable to the Mongolian Plateau. The MME was used along with the SPEI, EMD and EOF to predict spatiotemporal variations in future drought in the Mongolian Plateau over the period 2020–2100 and under the representative concentration pathways RCP4.5 and RCP8.5. The key conclusions of the present study are as follows:
Future increases in temperature and precipitation were evident under both the RCP4.5 and RCP8.5 scenarios, with the trends larger under the latter scenario. The increase in temperature was larger in Mongolia than in Inner Mongolia, while precipitation was large in Inner Mongolia. Seasonal changes in temperature were largest in winter.
- (1)
- The annual SPEI in the Mongolian Plateau showed a clear decreasing trend during 2020–2100, with fluctuations under the different scenarios, indicating increasing drought in the Mongolian Plateau in the future. The decrease in the SPEI was larger under the RCP8.5 scenario compared to that under the RCP4.5 scenario, indicating that drought was more serious under the former. A significant abrupt change occurred in 2041 and 2054 for the RCP4.5 and RCP8.5 scenarios, respectively. Moreover, drought in Mongolia was more serious than in Inner Mongolia in the future.
- (2)
- The first three EOFs and their corresponding PCs were used to observe spatiotemporal patterns of drought in the Mongolian Plateau, which showed east–west and north–south antiphase distributions.
- (3)
- The frequency of drought increased in RCP8.5 compared with RCP4.5, indicating that drought was more severe under the RCP8.5 scenario. Seasonal drought frequency was highest in summer under the two scenarios. The frequency of drought under the two scenarios was highest by the end of 21st century, followed by the mid-21st century and early 21st century. Drought frequency increased east to west.
Author Contributions
All authors contributed significantly to this manuscript. Y.B. (Yuhai Bao) was responsible for the theoretical aspects of the paper. S.T. and Y.B. (Yongbin Bao) were responsible for the data collection and preprocessing, E.G. was responsible for the methodology design, S.T. and Y.L. drafted the manuscript; all authors read and revised the final manuscript. All authors have read and agreed to the published version of the manuscript.
Funding
This study was financially supported by the National Natural Science Foundation of China (No. 42061070 and No.61631011), and the Research Foundation for Advanced Talents of Inner Mongolia Normal University (2019YJRC002).
Conflicts of Interest
The authors declare no conflict of interest.
References
- IPCC. Climate Change 2013: The Physical Science Basis. Contribution of Working Group I to the Fifth Assessment Report of the Intergovernmental Panel on Climate Change; Cambridge University Press: Cambridge, UK, 2013. [Google Scholar]
- Ji, F.; Wu, Z.H.; Huang, J.P.; Chassignet, E. Evolution of land surface air temperature trend. Nat. Clim. Chang. 2014, 4, 462–466. [Google Scholar] [CrossRef]
- Lambert, S.J.; Boer, G.J. CIMP1 evaluation and intercomparison of coupled climate models. Clim. Dynm. 2001, 17, 83–106. [Google Scholar] [CrossRef]
- Behrens, L.K.; Martin, T.; Semenov, V.A.; Latif, M. The Arctic sea ice in the CMIP3 climate model ensemble—variability and anthropogenic change. Cryosphere Discuss. 2012, 6, 5317–5344. [Google Scholar] [CrossRef] [Green Version]
- Torres, R.R.; Marengo, J.A. Climate change hotspots over South America: From CMIP3 to CMIP5 multi-model datasets. Theor. Appl. Climatol. 2014, 117, 579–587. [Google Scholar] [CrossRef]
- Taylor, K.E.; Stouffer, R.J.; Meehl, G.A. An overview of CMIP5 and the experiment design. Bull. Am. Meteorol. Soc. 2012, 93, 485–498. [Google Scholar] [CrossRef] [Green Version]
- Vuuren, D.P.V.; Edmonds, J.; Kainuma, M.; Riahi, K.; Thomson, A.; Hibbard, K.; George, C.H.; Kram, T.; Krey, V.; Lamarque, J.E. The representative concentration pathways: An overview. Clim. Chang. 2011, 109, 5. [Google Scholar] [CrossRef]
- Guo, Y.; Dong, W.J.; Ren, F.M.; Zhao, Z.C.; Huang, J.B. Surface air temperature simulations over China with CMIP5 and CMIP3. Adv. Clim. Chang. Res. 2013, 4, 145–152. [Google Scholar]
- Jiang, D.B.; Tian, Z.P. 2013. East Asian monsoon change for the 21st century: Results of CMIP3 and CMIP5 models. Chin. Sci. Bull. 2013, 58, 1427–1435. [Google Scholar] [CrossRef] [Green Version]
- Wallace, J.M.; Held, I.M.; Thompson, D.W.J. Global warming and winter weather. Science 2014, 343, 729–730. [Google Scholar] [CrossRef]
- Tao, H.; Fraedrich, K.; Menz, C.; Zhai, J. Trends in extreme temperature indices in the Poyang Lake Basin, China. Stoch. Env. Res. Risk A 2014, 28, 1543–1553. [Google Scholar] [CrossRef]
- Li, J.F.; Zhang, Q.; Chen, Y.Q. GCMs-based spatiotemporal evolution of climate extremes during the 21st century in China. J. Geophys. Res-Atmos. 2013, 118, 11017–11035. [Google Scholar] [CrossRef]
- Hao, Z.; Singh, V.P. Drought characterization from a multivariate perspective: A review. J. Hydrol. 2015, 527, 668–678. [Google Scholar] [CrossRef]
- Sheffield, J.; Wood, E.F. Projected changes in drought occurrence under future global warming from multi-model, multi-scenario, IPCC AR4 simulations. Clim. Dynam. 2008, 31, 79–105. [Google Scholar] [CrossRef]
- Dai, A. Increasing drought under global warming in observations and models. Nat. Clim. Chang. 2013, 3, 52–58. [Google Scholar] [CrossRef]
- Sun, F.; Mejia, A.; Zeng, P.; Che, Y. Projecting meteorological, hydrological and agricultural droughts for the Yangtze River basin. Sci. Total Environ. 2019, 696, 134076. [Google Scholar] [CrossRef]
- Lin, W.; Wen, C.; Wen, Z. Assessment of future drought in southwest china based on cmip5 multimodel projections. Adv. Atmos. Sci. 2014, 31, 1035–1050. [Google Scholar]
- Zhen, L.; Liu, J.Y.; Liu, X.L.; Wang, L.; Batkhishig, O.; Wang, Q.X. Structural change of agriculture-livestock system and affecting factors in Mongolian Plateau. J. Arid Land Resour. Environ. 2008, 22, 144–151. [Google Scholar]
- Leng, F.W. The recent progress of carbon cycle research in east Asian. Prog. Biochem. Biophys. 2011, 38, 1015–1019. [Google Scholar] [CrossRef]
- John, R.; Chen, J.; Ouyang, Z.; Batkishig, O.; Samanta, A.; Ganguly, S.; Yuan, W.; Xiao, J. Vegetation response to extreme climate events on the Mongolian Plateau from 2000 to 2010. Environ. Res. Lett. 2013, 8, 035033. [Google Scholar] [CrossRef]
- Wang, L.; Zhen, L.; Liu, X.L.; Batkhishig, O.; Wang, Q. Comparative studies on climate changes and influencing factors in central Mongolian Plateau region. Geogr. Res. 2008, 27, 171–180. [Google Scholar]
- Nandintsetseg, B.; Greene, J.S.; Goulden, C.E. Trends in extreme daily precipitation and temperature near lake hövsgöl, Mongolia. Int. J. Climatol. 2010, 27, 341–347. [Google Scholar] [CrossRef]
- Ma, W.; Liu, Z.; Wang, Z. Climate change alters interannual variation of grassland aboveground productivity: Evidence from a 22-year measurement series in the Inner Mongolian grassland. J. Plant Res. 2010, 123, 509–517. [Google Scholar] [CrossRef] [PubMed]
- Chuai, X.W.; Huang, X.J.; Wang, W.J. NDVI, Temperature and Precipitation Changes and Their Relationships with Different Vegetation Types during 1998–2007 in Inner Mongolia, China. Int. J. Climatol. 2013, 33, 1696–1706. [Google Scholar] [CrossRef]
- Sternberg, T.; Thomas, D.; Middleton, N. Drought dynamics on the Mongolian steppe, 1970–2006. Int. J. Climatol. 2011, 31, 1823–1830. [Google Scholar] [CrossRef]
- Tong, S.; Lai, Q.; Zhang, J.; Bao, Y.; Lusi, A.; Ma, Q.; Li, X.; Zhang, F. Spatiotemporal drought variability on the Mongolian Plateau from 1980-2014 based on the SPEI-PM, intensity analysis and Hurst exponent. Sci. Total Environ. 2017, 615, 1557–1565. [Google Scholar] [CrossRef] [PubMed]
- Shinoda, M.; Nachinshonhor, G.U.; Nemoto, M. Impacts of drought on vegetation dynamics of the Mongolia steppe: A field experiment. J. Arid Environ 2010, 74, 63–69. [Google Scholar] [CrossRef]
- Goudie, A.S.; Middleton, N.J. The changing frequency of dust storms through time. Clim. Chang. 1992, 20, 197–225. [Google Scholar] [CrossRef]
- Shi, Z.; Liu, X.; Liu, Y.; Sha, Y.; Xu, T. Impact of Mongolian Plateau versus Tibetan Plateau on the westerly jet over North Pacific Ocean. Clim. Dynam. 2014, 42, 1–10. [Google Scholar] [CrossRef]
- Sha, Y.; Shi, Z.; Liu, X.; An, Z. Distinct impacts of the Mongolian and Tibetan Plateaus on the evolution of the East Asian monsoon. J. Geophys. Res. Atmos. 2015, 120, 4746–4782. [Google Scholar] [CrossRef]
- Jiang, L.G.; Yao, Z.J.; Huang, H.Q. Climate variability and change on the Mongolian Plateau: Historical variation and future predictions. Clim. Res. 2016, 67, 1–14. [Google Scholar] [CrossRef]
- Wei, Y.; Zhen, L.; Batkhishig, O.; Liu, X.; Fen, L.I.; Yang, L. Empirical study on con-sumption of ecosystem services and its spatial differences over Mongolian Plateau. Res. Sci. 2009, 31, 1677–1684. [Google Scholar]
- Vicente-Serrano, S.M.; Beguería, S.; Lópezmoreno, J.I. A multiscalar drought index sensitive to global warming: The standardized precipitation evapotranspiration index. J. Clim. 2010, 23, 1696–1718. [Google Scholar] [CrossRef] [Green Version]
- Yu, M.; Li, Q.; Hayes, M.J.; Svoboda, M.D.; Heim, R.R. Are droughts becoming more frequent or severe in china based on the standardized precipitation evapotranspiration index: 1951–2010? Int. J. Climatol. 2014, 34, 545–558. [Google Scholar] [CrossRef]
- Li, L.; She, D.; Zheng, H.; Lin, P.; Yang, Z. Elucidating diverse drought characteristics from two meteorological drought indices (SPI and SPEI) in China. J. Hydrometeorol. 2020, 21, 1513–1530. [Google Scholar] [CrossRef]
- Ma, B.; Zhang, B.; Jia, L.; Huang, H. Conditional distribution selection for SPEI-daily and its revealed meteorological drought characteristics in China from 1961 to 2017. Atmos. Res. 2020, 246, 105108. [Google Scholar] [CrossRef]
- Mo, X.; Hu, S.; Lu, H.; Lin, Z.; Liu, S. Drought Trends over the Terrestrial China in the 21st 600 Century in Climate Change Scenarios with Ensemble GCM Projections. J. Nat. Resour. 2018, 33, 1244–1256. [Google Scholar]
- Xu, C.H.; Xu, Y. The projection of temperature and precipitation over China under RCP scenarios using a CMIP5 multi-model ensemble. Atmos. Ocean. Sci. Lett. 2012, 5, 527–533. [Google Scholar]
- Hu, Q.; Jiang, D.B.; Fan, G.Z. Evaluation of CMIP5 models over the Qinghai–Tibetan Plateau. Chin. J. Atmos. Sci. 2014, 38, 924–938. [Google Scholar]
- Taylor, K.E. Summarizing multiple aspects of model performance in a single diagram. J. Geophys. Res. Atmos. 2001, 106, 7183–7192. [Google Scholar] [CrossRef]
- Huang, N.E.; Shen, Z.; Long, S.R.; Wu, M.C.; Shih, H.H.; Zheng, Q. The empirical mode decomposition and the hilbert spectrum for nonlinear and non-stationary time series analysis. Proc. Math. Phys. Eng. Sci. 1998, 454, 903–995. [Google Scholar] [CrossRef]
- Wang, H.; Chen, Y.; Pan, Y.; Li, W. Spatial and temporal variability of drought in the arid region of China and its relationships to teleconnection indices. J. Hydrol. 2015, 523, 283–296. [Google Scholar] [CrossRef]
- Jiang, D.B.; Wang, H.J.; Lang, X.M. East Asian climate change trend under global warming background. Chin. J. Geophys. 2004, 47, 590–596. [Google Scholar] [CrossRef]
- Zhao, T.B.; Chen, L.; Ma, Z.G. Simulation of historical and projected climate change in arid and semiarid areas by CMIP5 models. Chin. Sci. Bull. 2014, 59, 412–429. [Google Scholar] [CrossRef]
- Liu, Z.F.; Wang, R.; Yao, Z.J. Air temperature and precipitation over the Mongolian Plateau and assessment of CMIP 5 climate models. Res. Sci. 2016, 38, 956–969. [Google Scholar]
- Liu, K.; Jiang, D.B. Projected changes in the dry/wet climate of China under the RCP4.5 scenario. Chin. J. Atmos. Sci. 2015, 39, 489–502. [Google Scholar]
- Kharin, V.V.; Zwiers, F.W.; Zhang, X.; Wehner, M. Changes in temperature and precipitation extremes in the CMIP5 ensemble. Clim. Change 2013, 119, 345–357. [Google Scholar] [CrossRef]
- Sun, Y.; Ding, Y.H. A projection of future changes in summer precipitation and monsoon in East Asia. Sci. China. Ser. D-Earth. Sci 2009, 39, 1487–1504. [Google Scholar] [CrossRef]
- Bae, S.J.; Lee, S.H.; Yoo, S.H. Analysis of drought intensity and trends using the modified SPEI in south Korea from 1981 to 2010. Water 2018, 10, 327. [Google Scholar] [CrossRef] [Green Version]
- Yao, J.Q.; Tuoliewubieke, D.; Chen, J.; Huo, W.; Hu, W.F. Identification of drought events and correlations with large-scale ocean–atmospheric patterns of variability: A case study in Xinjiang, China. Atmosphere 2019, 10, 94. [Google Scholar] [CrossRef] [Green Version]
- Naumann, G.; Alfieri, L.; Wyser, K.; Mentaschi, L.; Betts, R.A.; Carrao, H.; Spinoni, J.; Vogt, J.; Feyen, L. Global changes in drought conditions under different levels of warming. Geophys. Res. Lett. 2018, 45, 3285–3296. [Google Scholar] [CrossRef]
- Almazroui, M.; Nazrul Islam, M.; Saeed, S.; Alkhalaf, A.K.; Dambul, R. Assessment of uncertainties in projected temperature and precipitation over the Arabian Peninsula using three categories of CMIP5 multimodel ensembles. Earth Syst. Environ. 2017, 1, 23. [Google Scholar] [CrossRef] [Green Version]
- Swain, S.; Hayhoe, K. CMIP5 projected changes in spring and summer drought and wet conditions over North America. Clim. Dynam. 2015, 44, 2737–2750. [Google Scholar] [CrossRef]
- Park, C.K.; Byun, H.R.; Deo, R.; Lee, B.R. Drought prediction till 2100 under RCP 8.5 climate change scenarios for Korea. J. Hydrol. 2015, 526, 221–230. [Google Scholar] [CrossRef]
Figure 1.
Geographical location and elevation of the Mongolian Plateau and distribution of meteorological stations.
Figure 1.
Geographical location and elevation of the Mongolian Plateau and distribution of meteorological stations.

Figure 2.
Taylor diagram of (a) precipitation and (b) temperature.

Figure 3.
Future temporal trends in temperature and precipitation in Inner Mongolia (a,d), Mongolia (b,e) and the Mongolian Plateau (c,f) during 2020–2100. The black lines indicate the annual series of temperature and precipitation, whereas the blue and red lines denote the empirical mode decomposition (EMD) trend components under the representative concentration pathway RCP4.5 and RCP8.5 scenarios.

Figure 4.
Changes in seasonal (a) temperature and (b) precipitation during 2020–2100 in Inner Mongolia (IM), Mongolia (MGL) and the Mongolian Plateau (MP) under the representative concentration pathway RCP4.5 and RCP8.5 greenhouse gas emission scenarios; ** and * indicate the trends are significant at the 1% and 95% confidence level, respectively.

Figure 5.
Changes in temperature and precipitation under the (a,c) representative concentration pathway RCP4.5 and (b,d) RCP8.5 scenarios for the Mongolian Plateau.
Figure 5.
Changes in temperature and precipitation under the (a,c) representative concentration pathway RCP4.5 and (b,d) RCP8.5 scenarios for the Mongolian Plateau.

Figure 6.
Changes in the standardized precipitation evapotranspiration index (SPEI) during 2020–2100 in Inner Mongolia (a,b), Mongolia (c,d) and the Mongolian Plateau (e,f) under the RCP4.5 and RCP8.5. The bars represent the annual series of the SPEI, with drought occurring when bars cross the threshold represented by the lower green line at SPEI = −0.5. The red lines represent the trends in empirical mode decomposition. UF and UB curves are the progressive and retrograde series obtained by the Mann–Kendall statistical test; the point at which the UF and UB lines cross indicates the start of abrupt change; the blue dotted line represents the confidence line (p = 0.05).

Figure 7.
Changes to the spatial distribution of the annual standardized precipitation evapotranspiration index (SPEI) under the (a) RCP4.5 and (b) RCP8.5 scenarios for the Mongolian Plateau. The black dots indicate insignificance at a 95% confidence level.
Figure 7.
Changes to the spatial distribution of the annual standardized precipitation evapotranspiration index (SPEI) under the (a) RCP4.5 and (b) RCP8.5 scenarios for the Mongolian Plateau. The black dots indicate insignificance at a 95% confidence level.

Figure 8.
Seasonal frequencies of drought in the Mongolian Plateau under different representative concentration pathway (RCP) greenhouse gas scenarios during 2020–2100. (a) RCP4.5; (b) RCP8.5.
Figure 8.
Seasonal frequencies of drought in the Mongolian Plateau under different representative concentration pathway (RCP) greenhouse gas scenarios during 2020–2100. (a) RCP4.5; (b) RCP8.5.

Figure 9.
Spatial distribution of drought frequency under different representative concentration pathway (RCP) greenhouse gas scenarios for 2020–2040, 2041–2070 and 2071–2100 under the RCP4.5 (a–c) and RCP8.5 scenarios (d–f).
Figure 9.
Spatial distribution of drought frequency under different representative concentration pathway (RCP) greenhouse gas scenarios for 2020–2040, 2041–2070 and 2071–2100 under the RCP4.5 (a–c) and RCP8.5 scenarios (d–f).

Figure 10.
First three eigenvectors (EOF1, EOF2 and EOF3) and their corresponding principal component (PC) series for the annual standardized precipitation evapotranspiration index (SPEI) under RCP4.5 (a–f) and RCP8.5 (g–l) scenarios during 2020–2100 for the Mongolian Plateau. The blue line indicates the eigenvalue equal to 0.


Table 1.
The Coupled Model Intercomparison Project (CMIP5) models adopted in the present study.
| No. | Model | Institution | Resolution |
|---|---|---|---|
| 1 | CanESM2 | Canadian Centre for Climate Modelling and Analysis, Canada | 2.8° × 2.8° |
| 2 | CNRM-CM5 | Centre National de Recherché Météorologiques (France) | 1.4° × 1.4° |
| 3 | CSIRO-Mk3.6.0 | Commonwealth Scientific and Industrial Research Organization (CSIRO), Australia | 1.9° × 1.9° |
| 4 | GFDL-ESM2G | NOAA Geophysical Fluid Dynamics Laboratory, USA | 2.5° × 2.0° |
| 5 | GFDL-CM3 | NOAA Geophysical Fluid Dynamics Laboratory, USA | 2.5° × 2.0° |
| 6 | CFDL-ESM2M | NOAA Geophysical Fluid Dynamics Laboratory, USA | 2.5° × 2.0° |
| 7 | GISS-E2-H | NASA Goddard Institute for Space Studies, USA | 2.5° × 2.0° |
| 8 | GISS-E2-R | NASA Goddard Institute for Space Studies, USA | 2.5° × 2.0° |
| 9 | HadGEM2-AO | Met Office Hadley Centre, UK | 1.9° × 1.2° |
| 10 | IPSL-CM5A-LR | Institute Pierre Simon Laplace, France | 3.8° × 1.9° |
| 11 | IPSL-CM5A-MR | Institute Pierre Simon Laplace, France | 2.5° × 1.3° |
| 12 | MIROC5 | Atmosphere and Ocean Research Institute (The University of Tokyo), Japan | 1.4° × 1.4° |
| 13 | MIROC-ESM | Atmosphere and Ocean Research Institute (The University of Tokyo), Japan | 2.8° × 2.8° |
| 14 | MIROC-ESM-CHEM | Atmosphere and Ocean Research Institute (The University of Tokyo), Japan | 2.8° × 2.8° |
| 15 | MPI-ESM-LR | Max Planck Institute for Meteorology (MPI-M), Germany | 1.9° × 1.9° |
| 16 | MPI-ESM-MR | Max Planck Institute for Meteorology (MPI-M), Germany | 1.9° × 1.9° |
| 17 | MRI-CGCM3 | Meteorological Research Institute, Japan | 1.1° × 1.1° |
| 18 | NorESM1-M | Bjerknes Centre for Climate Research, Norwegian Meteorological Institute, Norway | 2.5° × 1.9° |
| 19 | NorESM1-ME | Bjerknes Centre for Climate Research, Norwegian Meteorological Institute, Norway | 2.5° × 1.9° |
Table 2.
Explained variance of the leading EOFs of the annual SPEI.
| Leading EOFs Mode | Explained Variance (Cumulative Explained Variance) | |
|---|---|---|
| RCP4.5 | RCP8.5 | |
| First mode (EOF1) | 40.7 % (40.7%) | 57.8% (57.8%) |
| Second mode (EOF2) | 14.3 % (55.1%) | 10.5% (68.3%) |
| Third mode (EOF3) | 10.5 % (65.6%) | 6.7% (75.0%) |
© 2020 by the authors. Licensee MDPI, Basel, Switzerland. This article is an open access article distributed under the terms and conditions of the Creative Commons Attribution (CC BY) license (http://creativecommons.org/licenses/by/4.0/).
Share and Cite
MDPI and ACS Style
Li, Y.; Tong, S.; Bao, Y.; Guo, E.; Bao, Y. Prediction of Droughts in the Mongolian Plateau Based on the CMIP5 Model. Water 2020, 12, 2774. https://doi.org/10.3390/w12102774
AMA Style
Li Y, Tong S, Bao Y, Guo E, Bao Y. Prediction of Droughts in the Mongolian Plateau Based on the CMIP5 Model. Water. 2020; 12(10):2774. https://doi.org/10.3390/w12102774
Chicago/Turabian StyleLi, Yongzhen, Siqin Tong, Yongbin Bao, Enliang Guo, and Yuhai Bao. 2020. "Prediction of Droughts in the Mongolian Plateau Based on the CMIP5 Model" Water 12, no. 10: 2774. https://doi.org/10.3390/w12102774
Note that from the first issue of 2016, this journal uses article numbers instead of page numbers. See further details here.