Study on Permeability Characteristics of Rocks with Filling Fractures Under Coupled Stress and Seepage Fields
by
Zhende Zhu
1,2, 
Zihao Niu
1,2,*,
Xiangcheng Que
1,2,
Cheng Liu
1,2,
Yanxin He
1,2 and
Xinghua Xie
3 1
Key Laboratory of Ministry of Education for Geomechanics and Embankment Engineering, Hohai University, Nanjing 210098, China
2
Jiangsu Research Center for Geotechnical Engineering Technology, Hohai University, Nanjing 210098, China
3
State Key Laboratory of Hydrology Water Resources and Hydraulic Engineering, Nanjing Hydraulic Research Institute, Nanjing 210098, China
*
Author to whom correspondence should be addressed.
Water 2020, 12(10), 2782; https://doi.org/10.3390/w12102782
Submission received: 13 September 2020
/
Revised: 2 October 2020
/
Accepted: 5 October 2020
/
Published: 6 October 2020
(This article belongs to the Section Hydrology)
Abstract
:Infilling fractured rock masses are widely distributed in the deeply buried oil reservoirs and surrounding rocks of mine caves. The internal filling material has a great influence on the mechanical properties and seepage characteristics of fractured rock mass. In this paper, through theories and experiments, the mechanism of permeability changes of infilling fractured rock under a coupling condition is studied. In terms of theory, the fracture compaction effect coefficient δ is added to the classical matchstick model, and the volume strain principle is used to propose a permeability model for fractured rock. Furthermore, based on the Hertz contact theory, mineral particles are generalized into rigid spheres, and the mechanism of crack development between mineral particles under seepage pressure is analyzed. In terms of experiment, a true triaxial seepage test was carried out on rock-like specimens to obtain the change law of the permeability characteristics of fractured rock. The test results are largely consistent with the theoretical calculation results of the theoretical model, which verifies the applicability of the model proposed in this paper. After the loading failure of the specimen, the internal filling material was taken out and analyzed, and by observing the distribution of cracks on the surface, it is verified that the seepage pressure promotes the development of cracks in the filling fracture.
1. Introduction
The seepage characteristics of surrounding rock under the conditions of stress–seepage coupling are of fundamental significance to better understanding the stability of underground mines and exploiting low permeability reservoirs [1,2,3]. Taking the underground liquid injection method as an example, under high external water pressure, the stress load on the surrounding rock is extremely complex, and the permeability of the surrounding rock affects the safety and efficiency of the entire production process [4,5,6]. In addition, in the construction of hydropower stations and the storage of nuclear waste, the rock masses around the working face must deal with the coupling problem of high in situ stress and high seepage pressure, which can easily induce geological disasters such as earthquakes [7,8,9]. Previous studies have shown that factors such as volcanism and tectonic stress lead to the formation of fractures in a rock mass. Due to weathering and sedimentation, the fractures become filled with mineral particles of different sizes [10,11]. Compared to intact rock, the mineral particles in the filled fractures are loosely packed, their physical and mechanical properties are poor, and damage to the rock mass occurs more frequently at the fractures [12,13,14,15].
Research on the permeability characteristics of fractured rocks began with a smooth parallel plate test, and the test results produced the famous cubic law [16,17]. Based on the cubic law, scholars have made various amendments and obtained many rock permeability models [18,19,20]. Under the current increasingly complex engineering background, it is difficult to meet engineering needs by only considering the permeability problem caused by seepage pressure [21,22]. Related research is mainly carried out in one of two areas: experiments or theory. As an experiment, Samuelson used a true triaxial compression shear seepage test and found that pore flow pressure will greatly reduce the friction strength of structural faults and affect the stability of rock blocks [23]. Zoback and Byerlee researched the effect of microcracks on the permeability of granite and found that the rupture of microcracks can substantially enhance the permeability of granite, but the contribution of isolated cracks is insignificant [24]. Zou studied the permeability change law of fractured rocks through the triaxial seepage test and analyzed the internal crack propagation process [25]. Ali studied the mechanical properties of the fractured rocks. The previous research showed that the mechanical properties of an infilled rock fracture are determined by the morphological details of the fracture surface, the thickness, and the performance of the filling material [26].
In terms of theoretical research, Wu used a dual porosity elastic model and Wei used a three porosity dual permeability model to describe the flow of fluids in coal seams [27,28]. Based on the JRC-JCS model of fractured rock and considering the macroscopic roughness of the fracture, Ma used the microscopic bond shear model to develop a model that can predict the peak shear strength of sandstone and mudstone cement filling fractures [29]. Yang added a coupled hydraulic machinery (HM) model to the enriched NMM to simulate fluid-driven fracturing in the rock. The simulation results agreed well with the analytical and experimental results [30]. However, the calculation process of the model proposed by the above scholars is complicated, and the model parameters are difficult to obtain. Moreover, in the natural state of fractured rock, the inside of the fracture is filled or partially filled. The internal filling material is usually composed of mineral particles of different sizes with properties that will greatly affect the mechanics and seepage characteristics of the fractured rock masses [31]. Therefore, it is necessary to add parameters related to the permeability characteristics of the filling material, considering the existing permeability model, and to establish a seepage model that describes the variation of the permeability coefficient of the fractured rock in the coupling field. On this basis, a true triaxial seepage test can be used to analyze the failure form of fractured rock and the propagation process of internal cracks.
This paper treats the seepage characteristics under the stress–seepage coupling field as a quasi-static problem. From the perspective of volumetric strain, combined with the three-parameter permeability model proposed by Shang [32], a permeability model under the coupling field of fractured rocks was established. Furthermore, based on the Hertz contact model and combined with the micro-convex sliding model, the stress field around the internal mineral particle structure under high hydraulic conditions is analyzed, and the reasons for the hydraulic failure of the filling fractures are analyzed. To verify the accuracy of the model proposed in this paper, a true triaxial seepage test was carried out on a rock-like specimen containing a single fracture. By comparing the experimental data and the theoretical calculation results and analyzing the damage law of the specimens, the accuracy of the theory proposed in this paper is verified.
2. Physical Characteristics and Seepage Failure Mode of Fractured Rocks
2.1. Physical Properties of Fractured Rocks
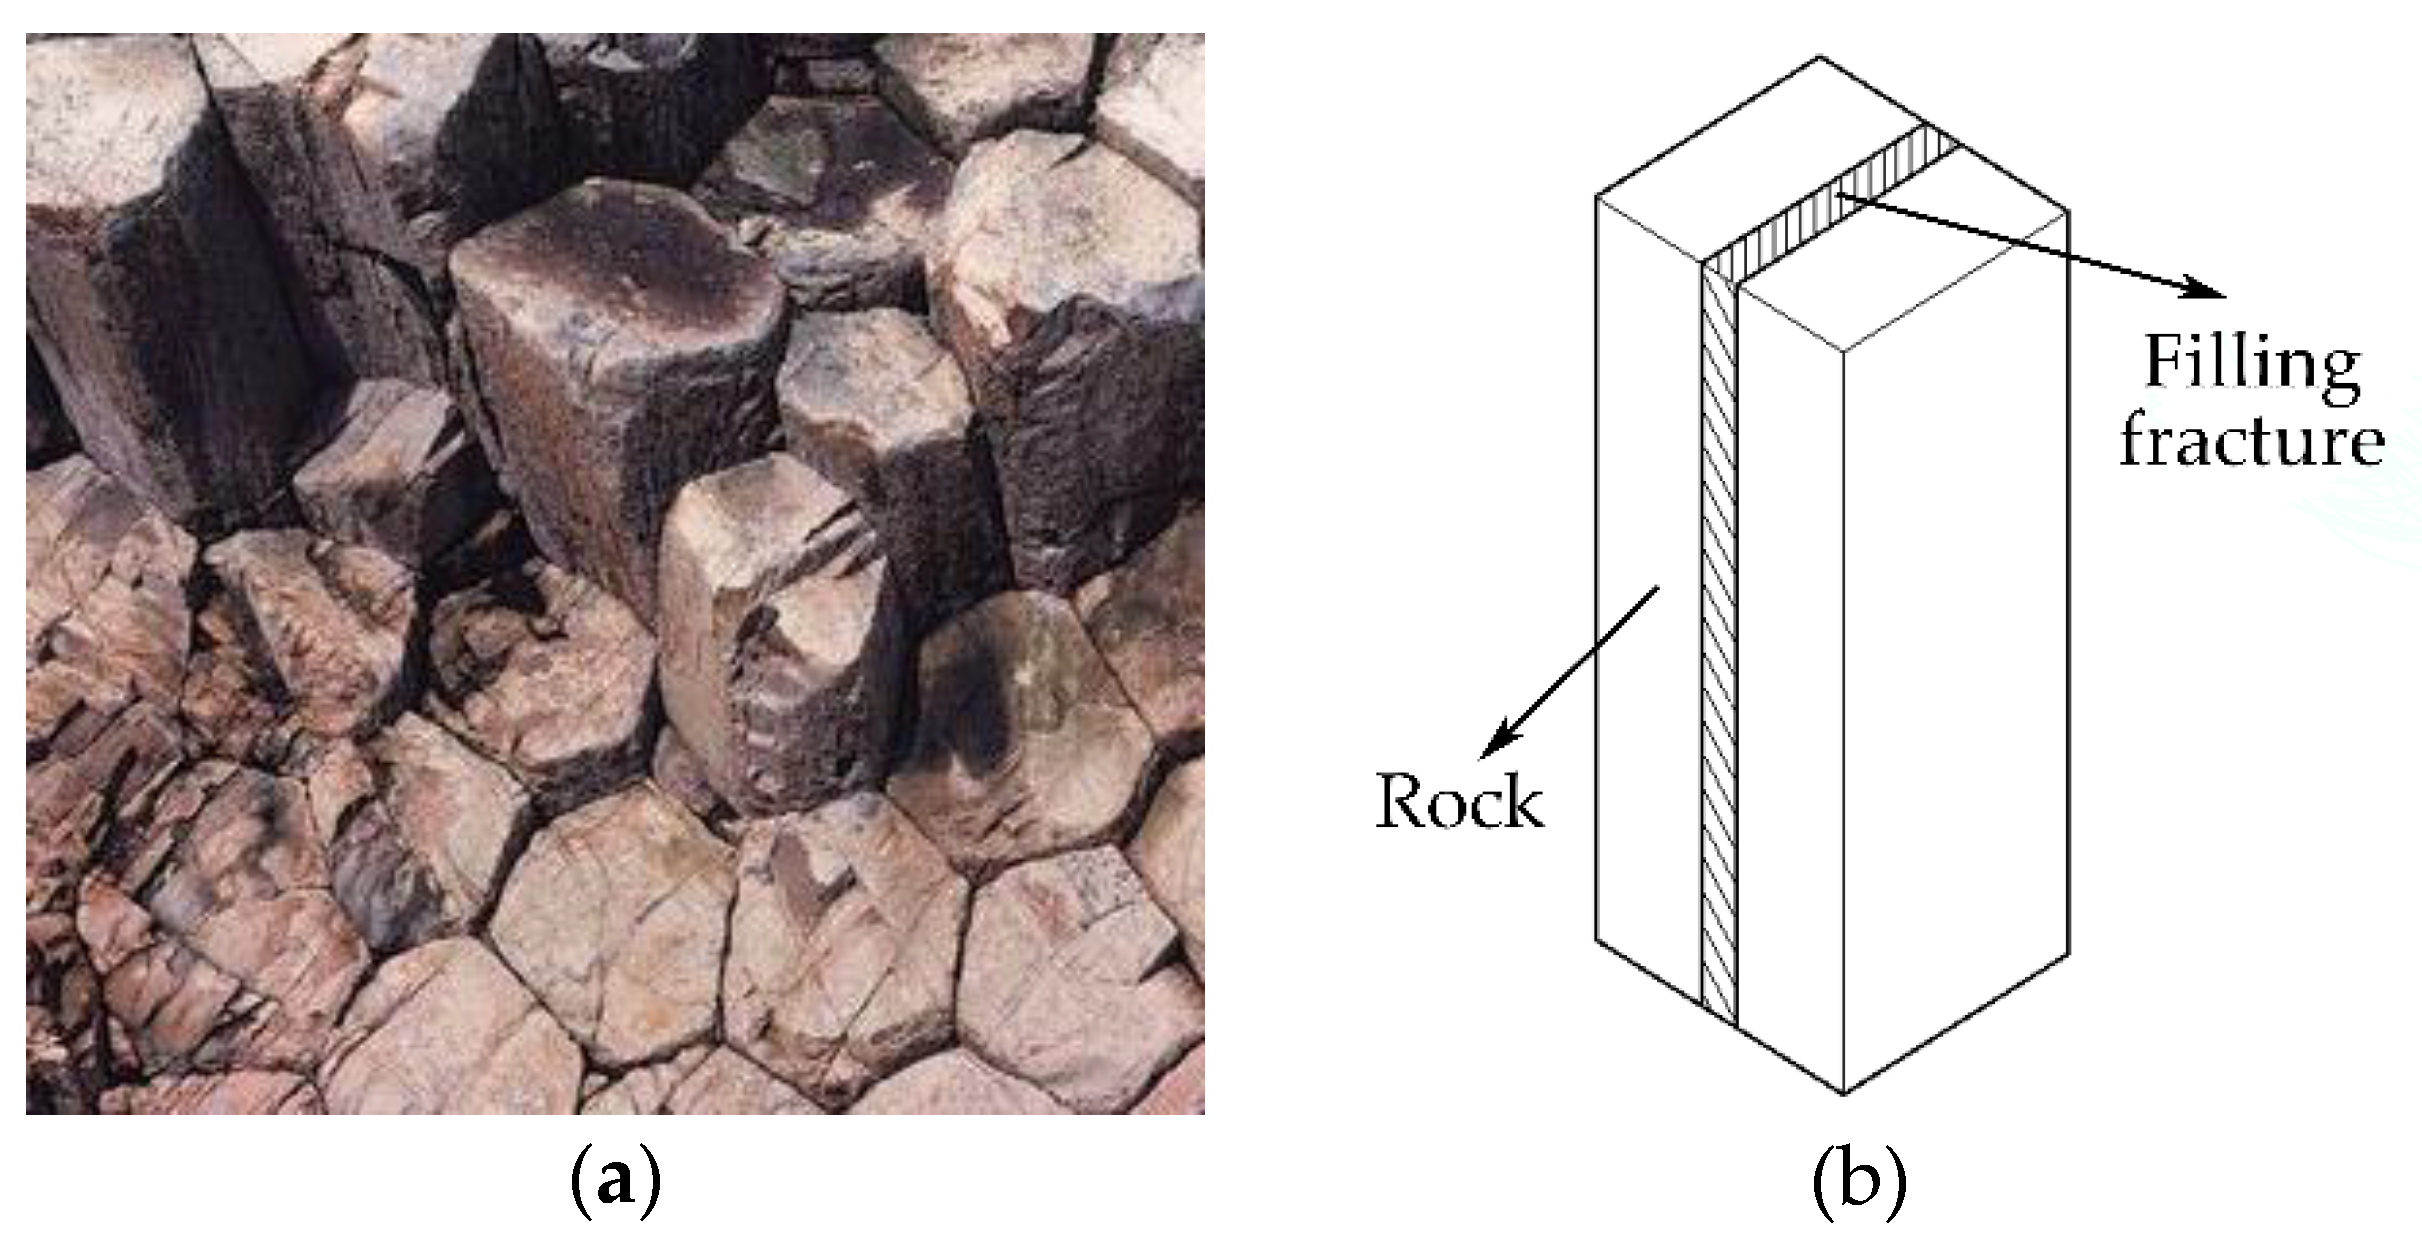
Sediment and mineral fragments are the main materials that compose filling fractures, giving them properties similar to rocks. However, they are very different from rocks in terms of their mechanics and seepage properties. Fractured rocks usually have the characteristics of high permeability, high heterogeneity, and strong anisotropy. In contemporary research, most scholars simplify this type of rock into a transversely isotropic body with fracture distribution, attach the fracture as a deterioration condition of the rock, and ignore the interface characteristics of the fracture surface [33]. Taking common igneous basalt as an example, the columnar jointed rock mass exposed in the field is a typical filled jointed rock mass and has physical and mechanical properties and permeability characteristics that have extremely strong anisotropy. Due to the special geological conditions during the rock’s formation period, the open fractures on the surface and inside are formed by weathering and sedimentation. The fractures and the rock matrix are fully cemented to form a highly integrated composite material [34,35]. A typical jointed rock is shown in Figure 1a. The single filling fracture inside of it can be simplified as in Figure 1b, which is composed of a middle pair of fillings with the rock matrix on both sides.
2.2. Seepage Failure Characteristics of Filling Fractured Rock
In the study of the permeability characteristics of fractured rocks, the focus is on the deterioration properties of the fillings under hydraulic action. The fillings act as a seepage channel during the infiltration process. Under the constraints of the macro stress field, the internal fillings’ mineral particles experience relative slippage during the mutual extrusion process, which will promote a new seepage channel to develop. This characteristic causes the filling fractured rocks to have different seepage characteristics at different loading stages. When the coupled stress field is applied, as the degree of fractured rocks participating in the deformation process increases, the strain state gradually transitions from compression deformation to expansion deformation—that is, the filling fractures enter the expansion process of the internal macroscopic cracks. From the perspective of the volumetric strain of the filling, in this process, the volumetric strain changes from compression to expansion, and the boundary is called the C–D boundary [36,37]. The mathematical expression can be written as
where is the volumetric strain, . are the strains in the three principal stress directions, is the difference between the volumetric strain , and i is the loading stage.
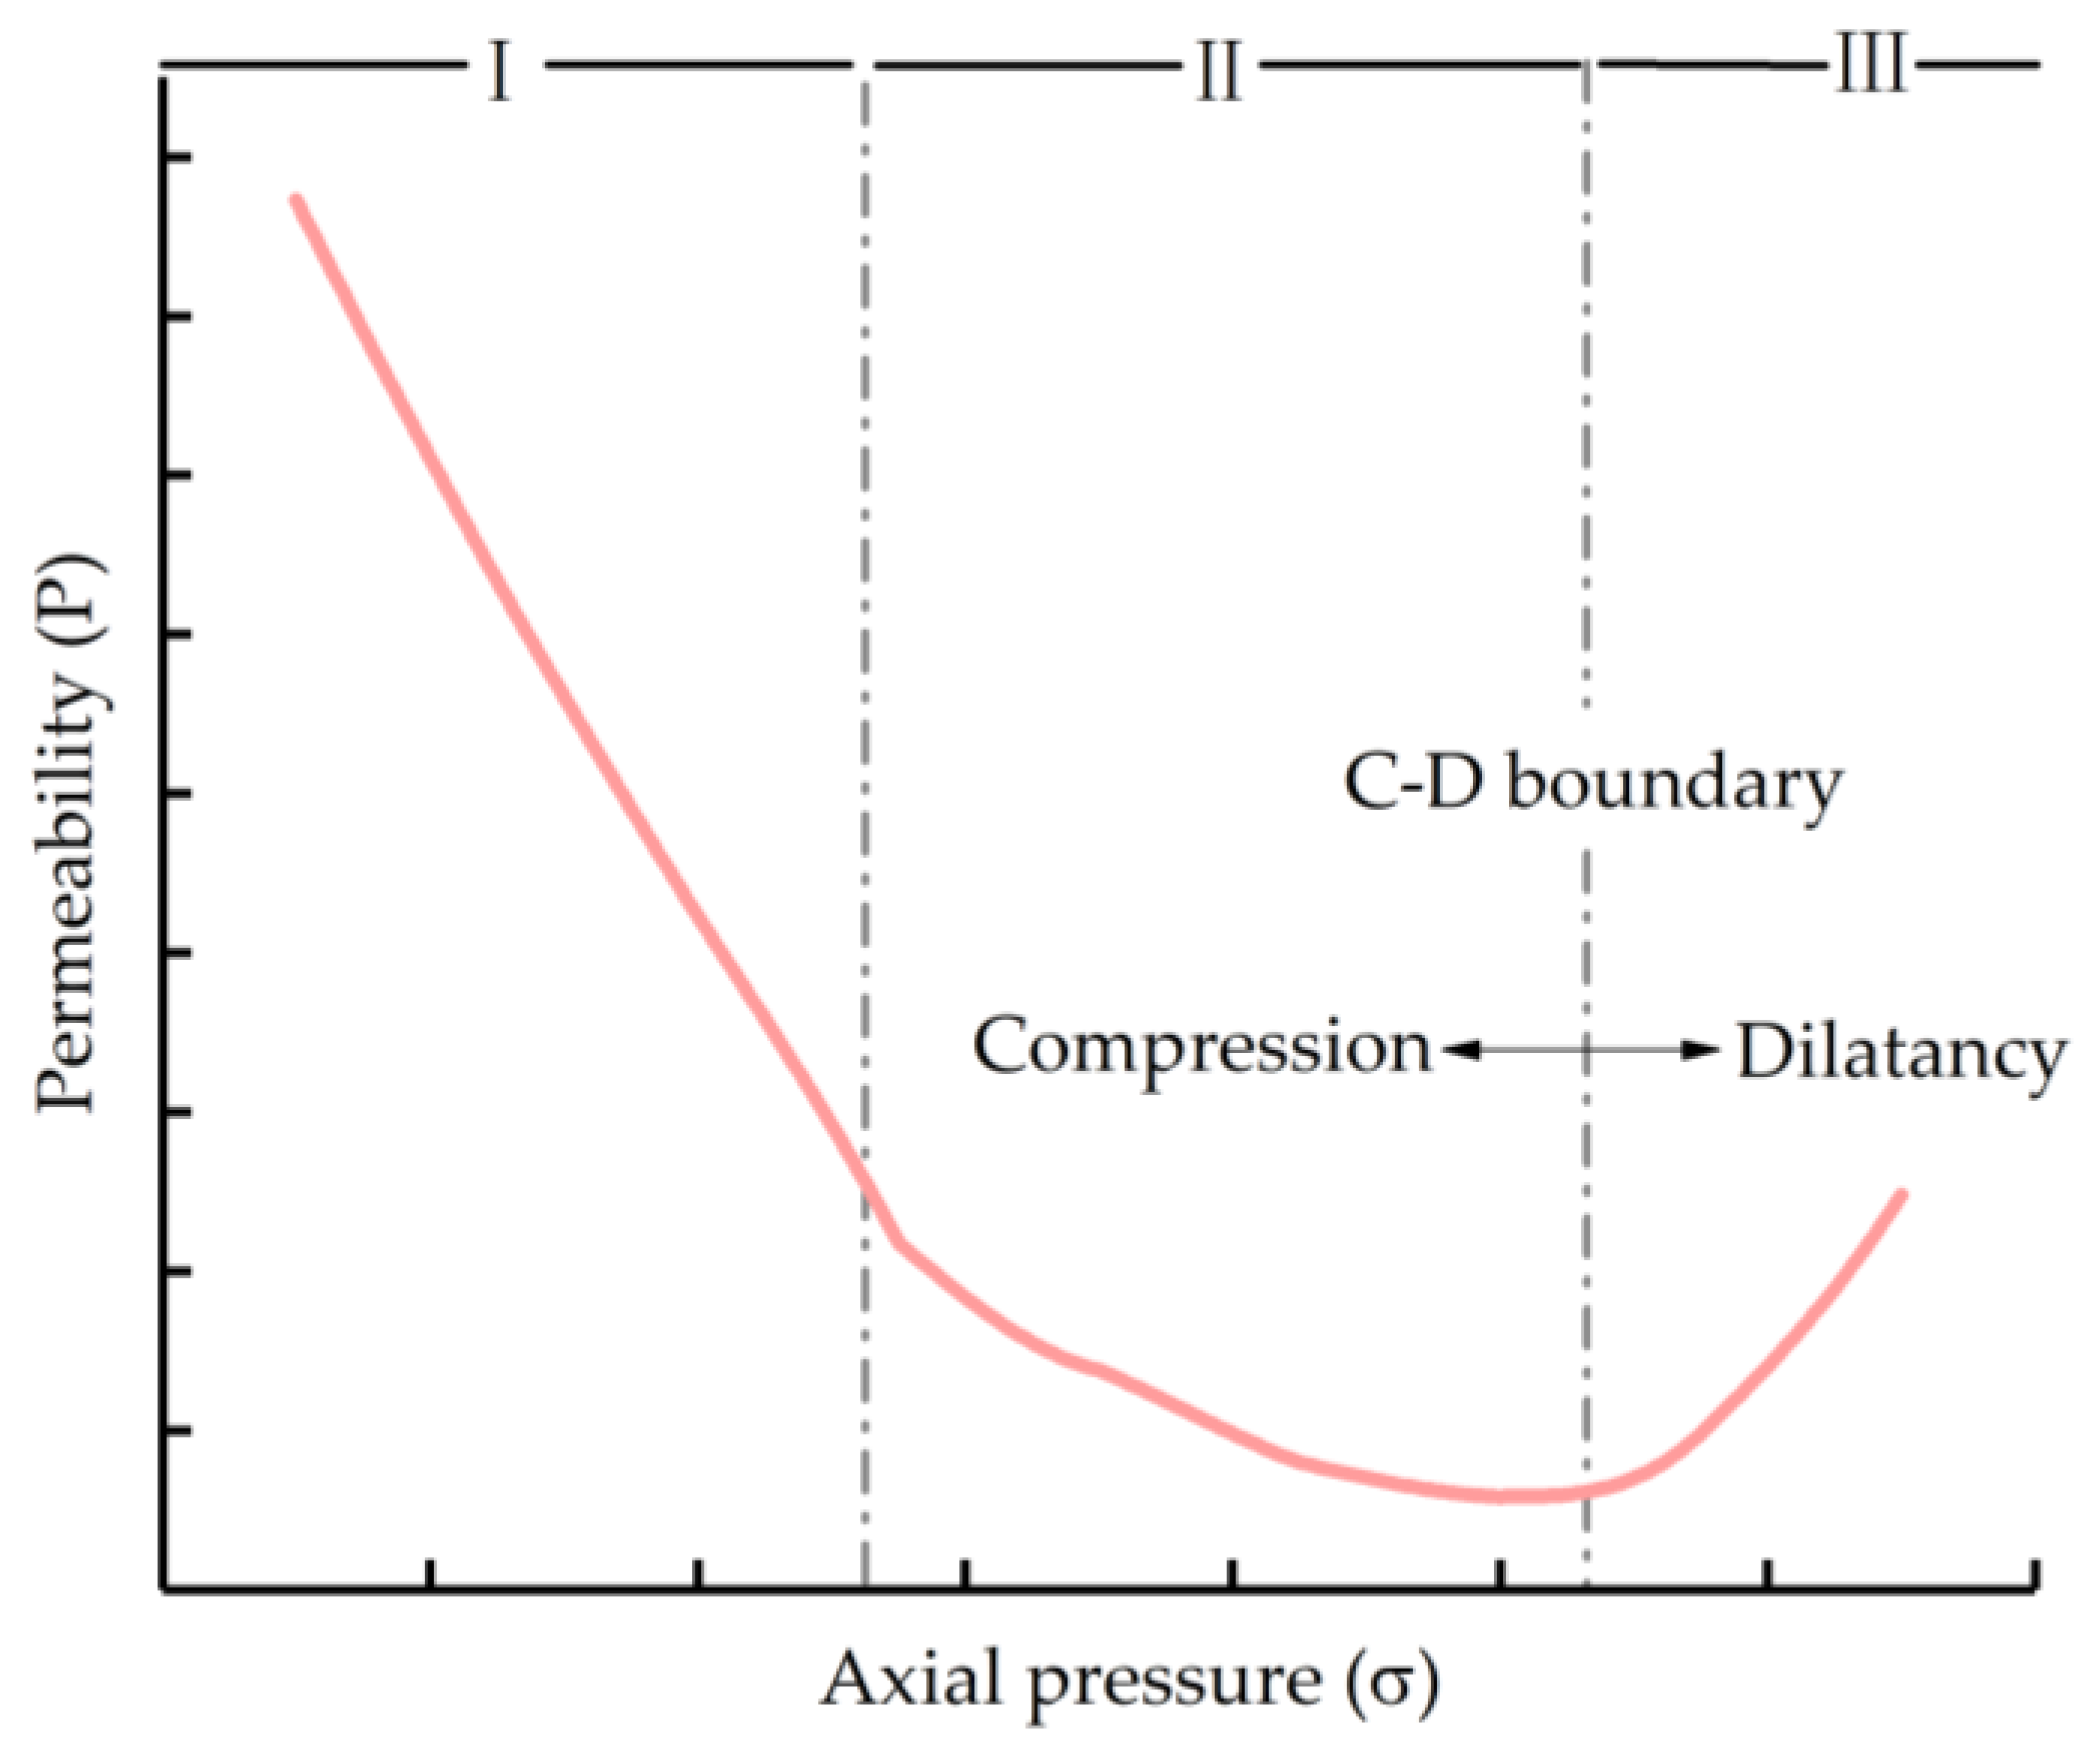
The change in the volumetric strain of fractured rocks can be reflected by the permeability coefficient. The change curve of the permeability coefficient of typical fractured rocks can be divided into three stages, as shown in Figure 2. In the elastic compression stage (stage 1), as the filling compresses, the internal pores of the filling fractures are compacted, and the permeability coefficient shows a downward trend. With an increase in axial pressure, macroscopic cracks appear in the filling. The permeability coefficient will then no longer decrease and tends to become stable (stage 2). When a large number of macroscopic cracks initiate and the volumetric strain of the fillings produces expansion, the permeability coefficient increases rapidly with the generation of through cracks. Consequently, the filling fractures gradually lose their mechanical properties, their structure is largely destroyed, and the expansion phase (stage 3) is entered. The boundary between the second and third stages is the C–D boundary. Therefore, when considering the changes in the permeability properties of the fillings under the coupled field, it is difficult to reflect the permeability mechanism based only on an analysis of the two-dimensional geometric characteristics. It is necessary to also analyze the filling fracture from the perspective of a three-dimensional entity to clarify the internal crack propagation mechanism.
3. Establishment of the Permeability Model of Fractured Rock in the Elastic Phase
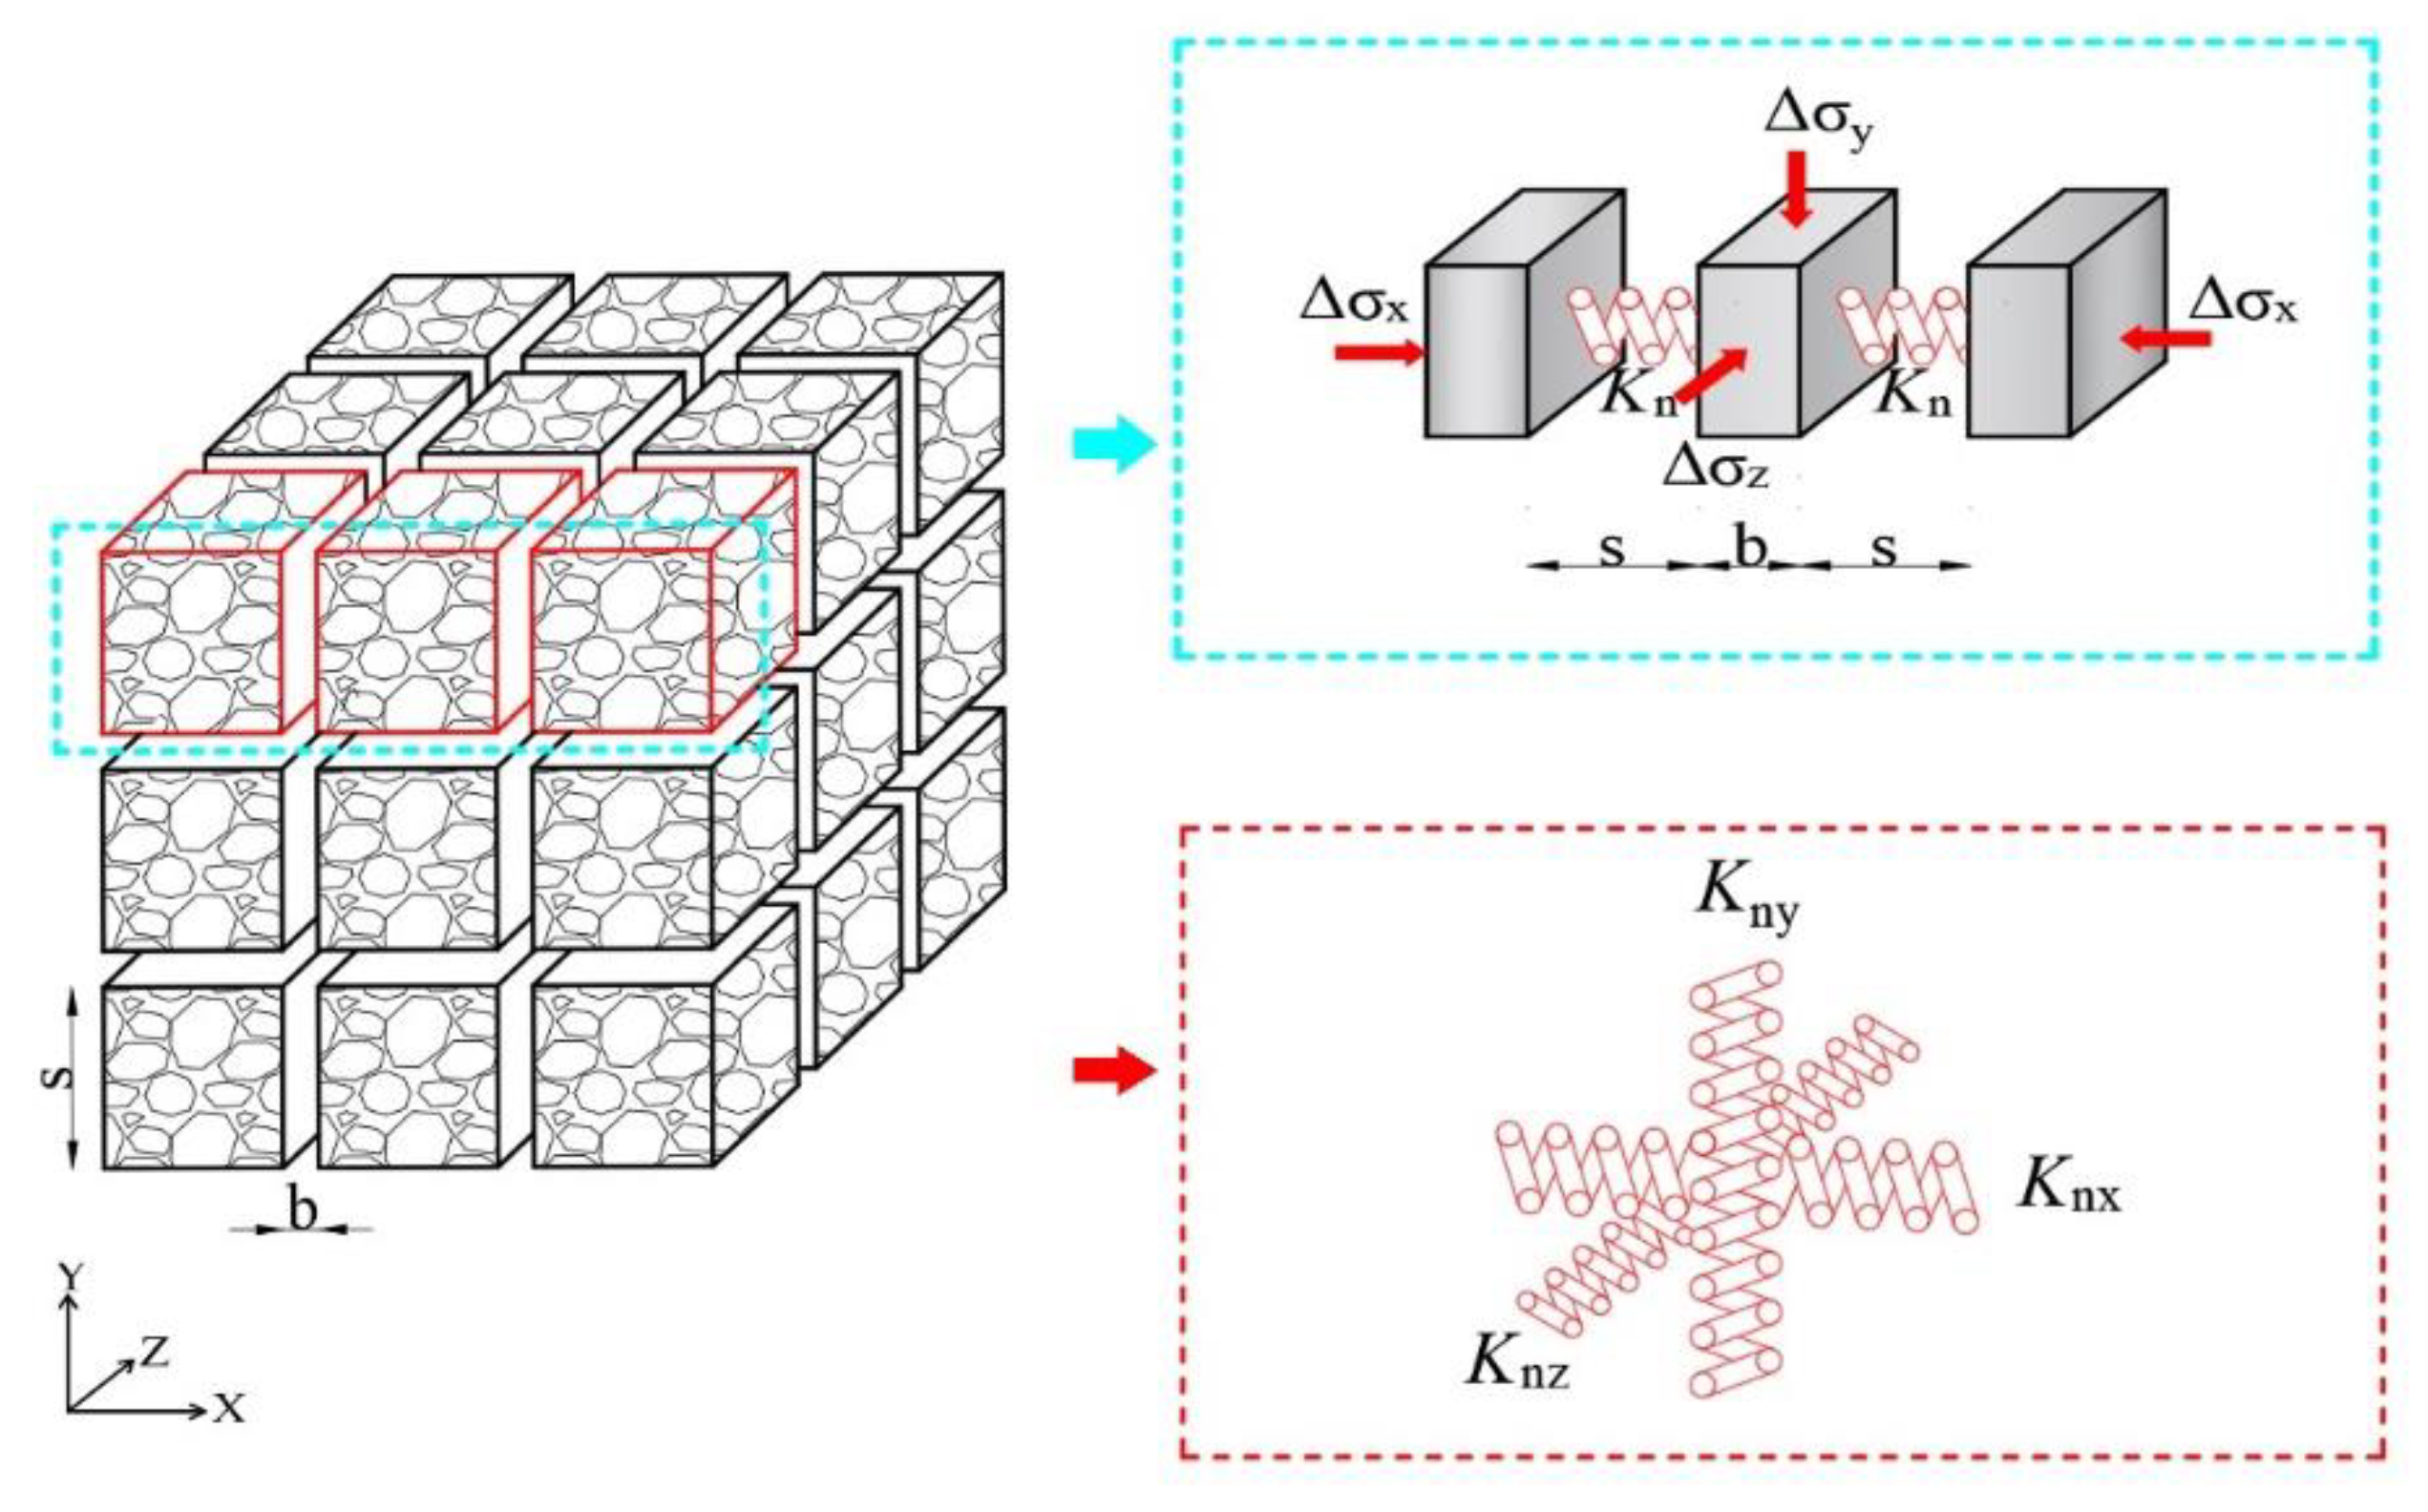
Fractured rocks can be generalized into a matchstick model consisting of a network of fractures and complete rock blocks [27,38], as shown in Figure 3. Under the assumption of elasticity, the volume strain of a fractured rock is composed of two parts: the joint and the intact rock mass. The stiffness of the joint is much lower than that of the matrix and will cause great deformation, even under a small load. Therefore, in engineering, an engineering strain is often used to describe a small deformation of the matrix, while a natural strain is used to describe a large deformation of the joint [39]. Thus, a complete rock can be simplified into a combination spring parallel to the three loading directions, and fractured rocks can be simplified into a combination of a filled body and a spring perpendicular to the joint plane.
For the matchstick block of fractured rock shown in Figure 3, the permeability can be calculated by the following formul:
where kf is the permeability of the fractured rock, b is the aperture of the fracture, and s is the spacing of the fractures. These parameters are used to describe the current state of the fractured rocks.
If the initial state of the fractures is used as the reference, Equation (2) is rewritten as
where k0,f, b0, and s0 are the parameters of the fractures at the initial state, and (s0/s) denotes the spacing ratio.
Equation (3) shows that the permeability is one power of the spacing ratio. Ju and Chen’s articles both verified this conclusion [40,41]. Under external loading, the aperture of the existing fracture may change, and the fracture spacing will also change accordingly based on the compression of the rock matrix and the fractures. However, during this compression process, the filling material will simultaneously bring about a compaction effect [42,43]. This effect will lead to a tighter arrangement of the filling material particles and further reduce the permeability of the fractured rock. Therefore, the compaction effect coefficient δ is added into Equation (3) to characterize the permeability attenuation due to fracture compression under elastic conditions. Assuming that this parameter is n power of the spacing ratio and that n depends on the material properties, Equation (3) is rewritten as
Fractured rock is a typical heterogeneous, porous medium whose volume is completely occupied by the fractures and matrix [39,44]:
where V, VJ, and VR are the current volumes of the entire rock, fractures, and matrix, respectively.
Correspondingly, the volume of the entire rock in the initial state can be expressed as
where subscript 0 denotes the initial state. The same subscripts appearing in the following equations have the same meaning.
Under the coupled stress field, according to Hooke’s law, the volume of the fractures and matrix can be expressed as [45]
where KR and KJ are the bulk modulus of the entire rock and the bulk modulus of the fractures, respectively. is the mean effective stress, and is the mean effective stress increment, which is .
The volume of the fracture can be obtained by the product of crack thickness t and fracture surface area, and the surface area of the fracture can be expressed by the fracture spacing s and the fracture aperture b:
Equation (9) assumes that the change of loading only affects the crack spacing s and the fracture aperture b, while the crack thickness remains unchanged. The thickness of the fracture is a parameter related to the rock matrix, and the deformation of the rock matrix is very small. So the thickness of the fracture stays constant in this model.
Substituting Equation (9) into Equation (8) yields
Further, substituting Equation (10) into Equation (4) yields
Let γR and γJ stand for the fracture aperture proportion of the matrix and fractures, respectively, which are defined as
The change in fracture spacing s can be composed of the changes of the matrix and fractures [25,46] as
Hence, substituting Equations (13) and (14) into Equation (11) yields the permeability model of the fractured rock, which can be expressed as
Equation (15) is the stress–seepage coupling model of the fractured rock. We noted that the permeability coefficient k is closely related to the stress state of the fractured rock, the fracture spacing, and the bulk modulus. Ignoring the fracture spacing and the compaction effect of the fractures, the model degenerates to a typical negative exponential permeability model. Adding the influence of the temperature field, the model is transformed into the three-parameter seepage model proposed by Shang [32]. Based on the elastic stage, the model can’t describe the change of the permeability coefficient in the plastic stage and failure stage. At the same time, because the model involves many parameters, it is more suitable to describe the fractured rock with regular fracture distribution.
4. True Triaxial Seepage Test under the Stress Conditions of Fractured Rocks
4.1. Test Equipment and Test Materials
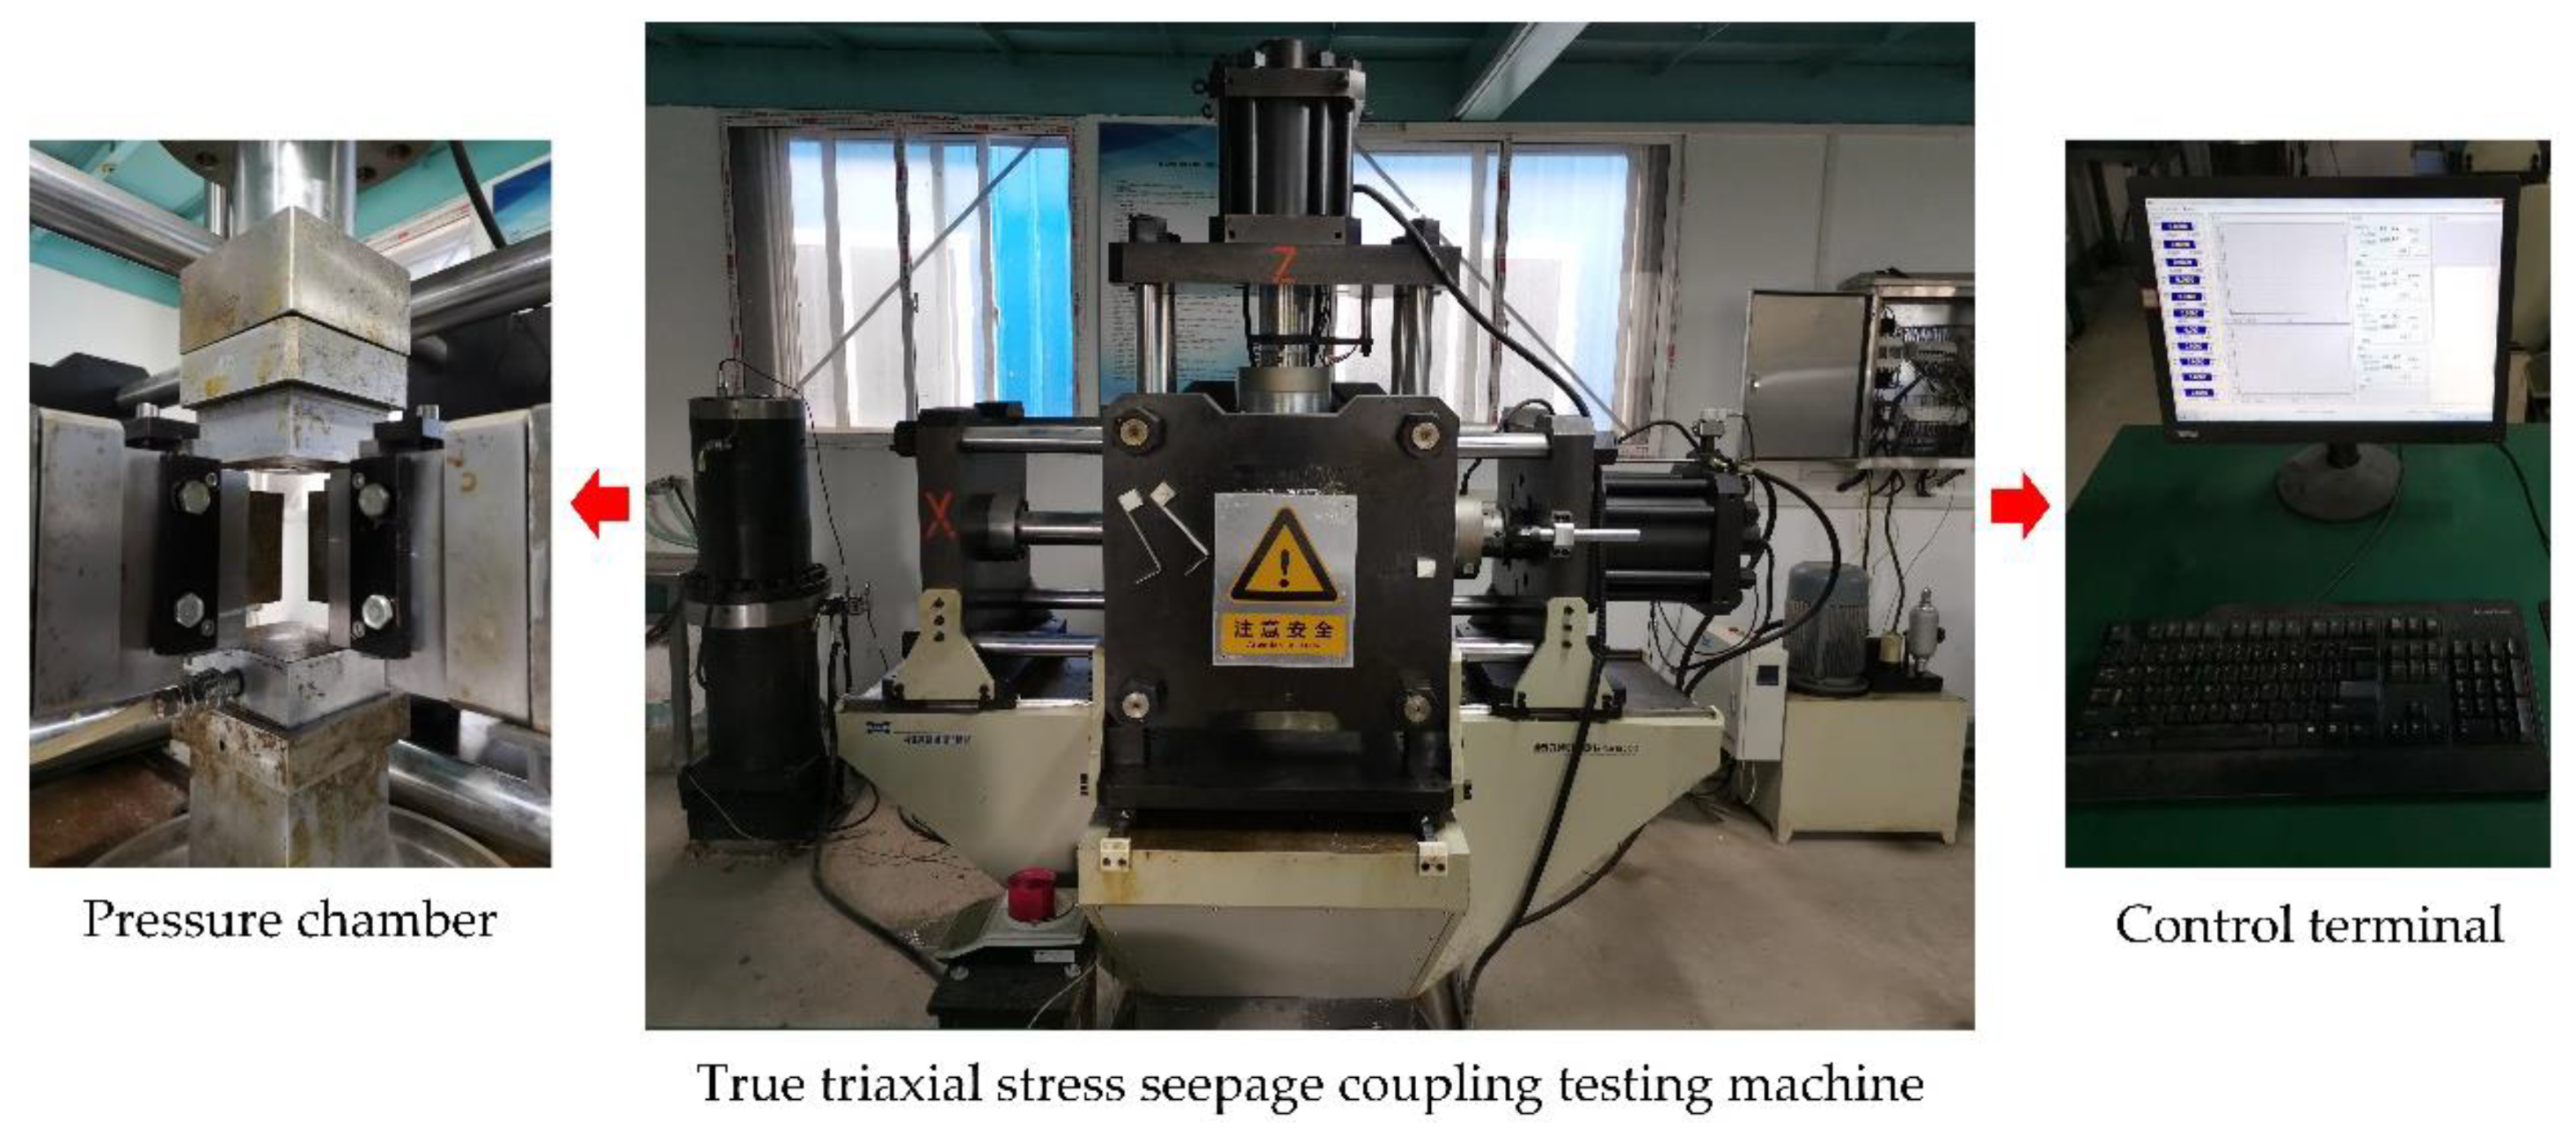
The true triaxial seepage test was carried out on a rock fracture seepage testing machine, the manufacture, software design and follow-up maintenance of the instrument are jointly completed by Nanjing hydraulic research institute and China Xi’an Lichuang Material Testing Technology Co., Ltd.
The test system consisted of five parts: the main engine, the infiltration water cylinder, the hydraulic source, the infiltration pressure system, and the electronic control system. The instrument is shown in Figure 4. Compared to the advanced rock mass triaxial seepage test devices used in current scientific research work, this test system can be independently loaded in three directions to achieve the permeability characteristics of the rock under a true triaxial stress state research (including seepage deformation and seepage failure). The system can apply static pressure in the range of 0~1000 KN, which is provided by a hydraulic source. The pressure measurement accuracy is 0.1 MPa, and the displacement measurement accuracy is 0.01 mm. At the same time, the seepage pressure system is a key component of the measurement system. A water tank with a maximum water storage volume of 20 L provides a seepage pressure of 0–30 MPa. During the test, confining pressure and seepage pressure were applied simultaneously. The application of seepage pressure resulted in the formation of seepage pressure difference at both ends of the specimen, allowing pore water to flow out from the bottom of the specimen. The real-time seepage flow data of the rock specimen were obtained by weighing with a high precision electronic balance and transmitted to the host, which generated digital maps of the data.
To simulate the fillings of the fractured rocks, this experiment used polymethyl methacrylate (PMMA) as the rock matrix and cement mortar as the filling material. The rock-like cube specimen was composed of PMMA with a width of 50 mm on both sides and cement mortar board in the middle. According to the relevant assumptions of the model established in this paper, the same simplified method was used to make the fracture filling samples. Because PMMA has a higher strength and lower permeability than the cement mortar, it can better simulate the permeability characteristics of filling fractured rocks found in nature. Before the formal test, we performed conventional uniaxial compression (UCS) tests on the PMMA and cement mortar materials under equal strain rate conditions. The tests were carried out on an RMT-150B multi-function rigid rock servo testing machine using rate control loading with a rate of 0.05 mm/s. The elastic modulus and Poisson’s ratio of the two different materials were then obtained. The Young’s modulus of the cement mortar in the saturated state was 1.3 GPa, and the Poisson’s ratio was 0.29. The Young’s modulus of the PMMA was 3.6 GPa, and the Poisson’s ratio was 0.363 (room temperature 25 °C, 1 atmosphere).
4.2. Test Preparation and Test Plan
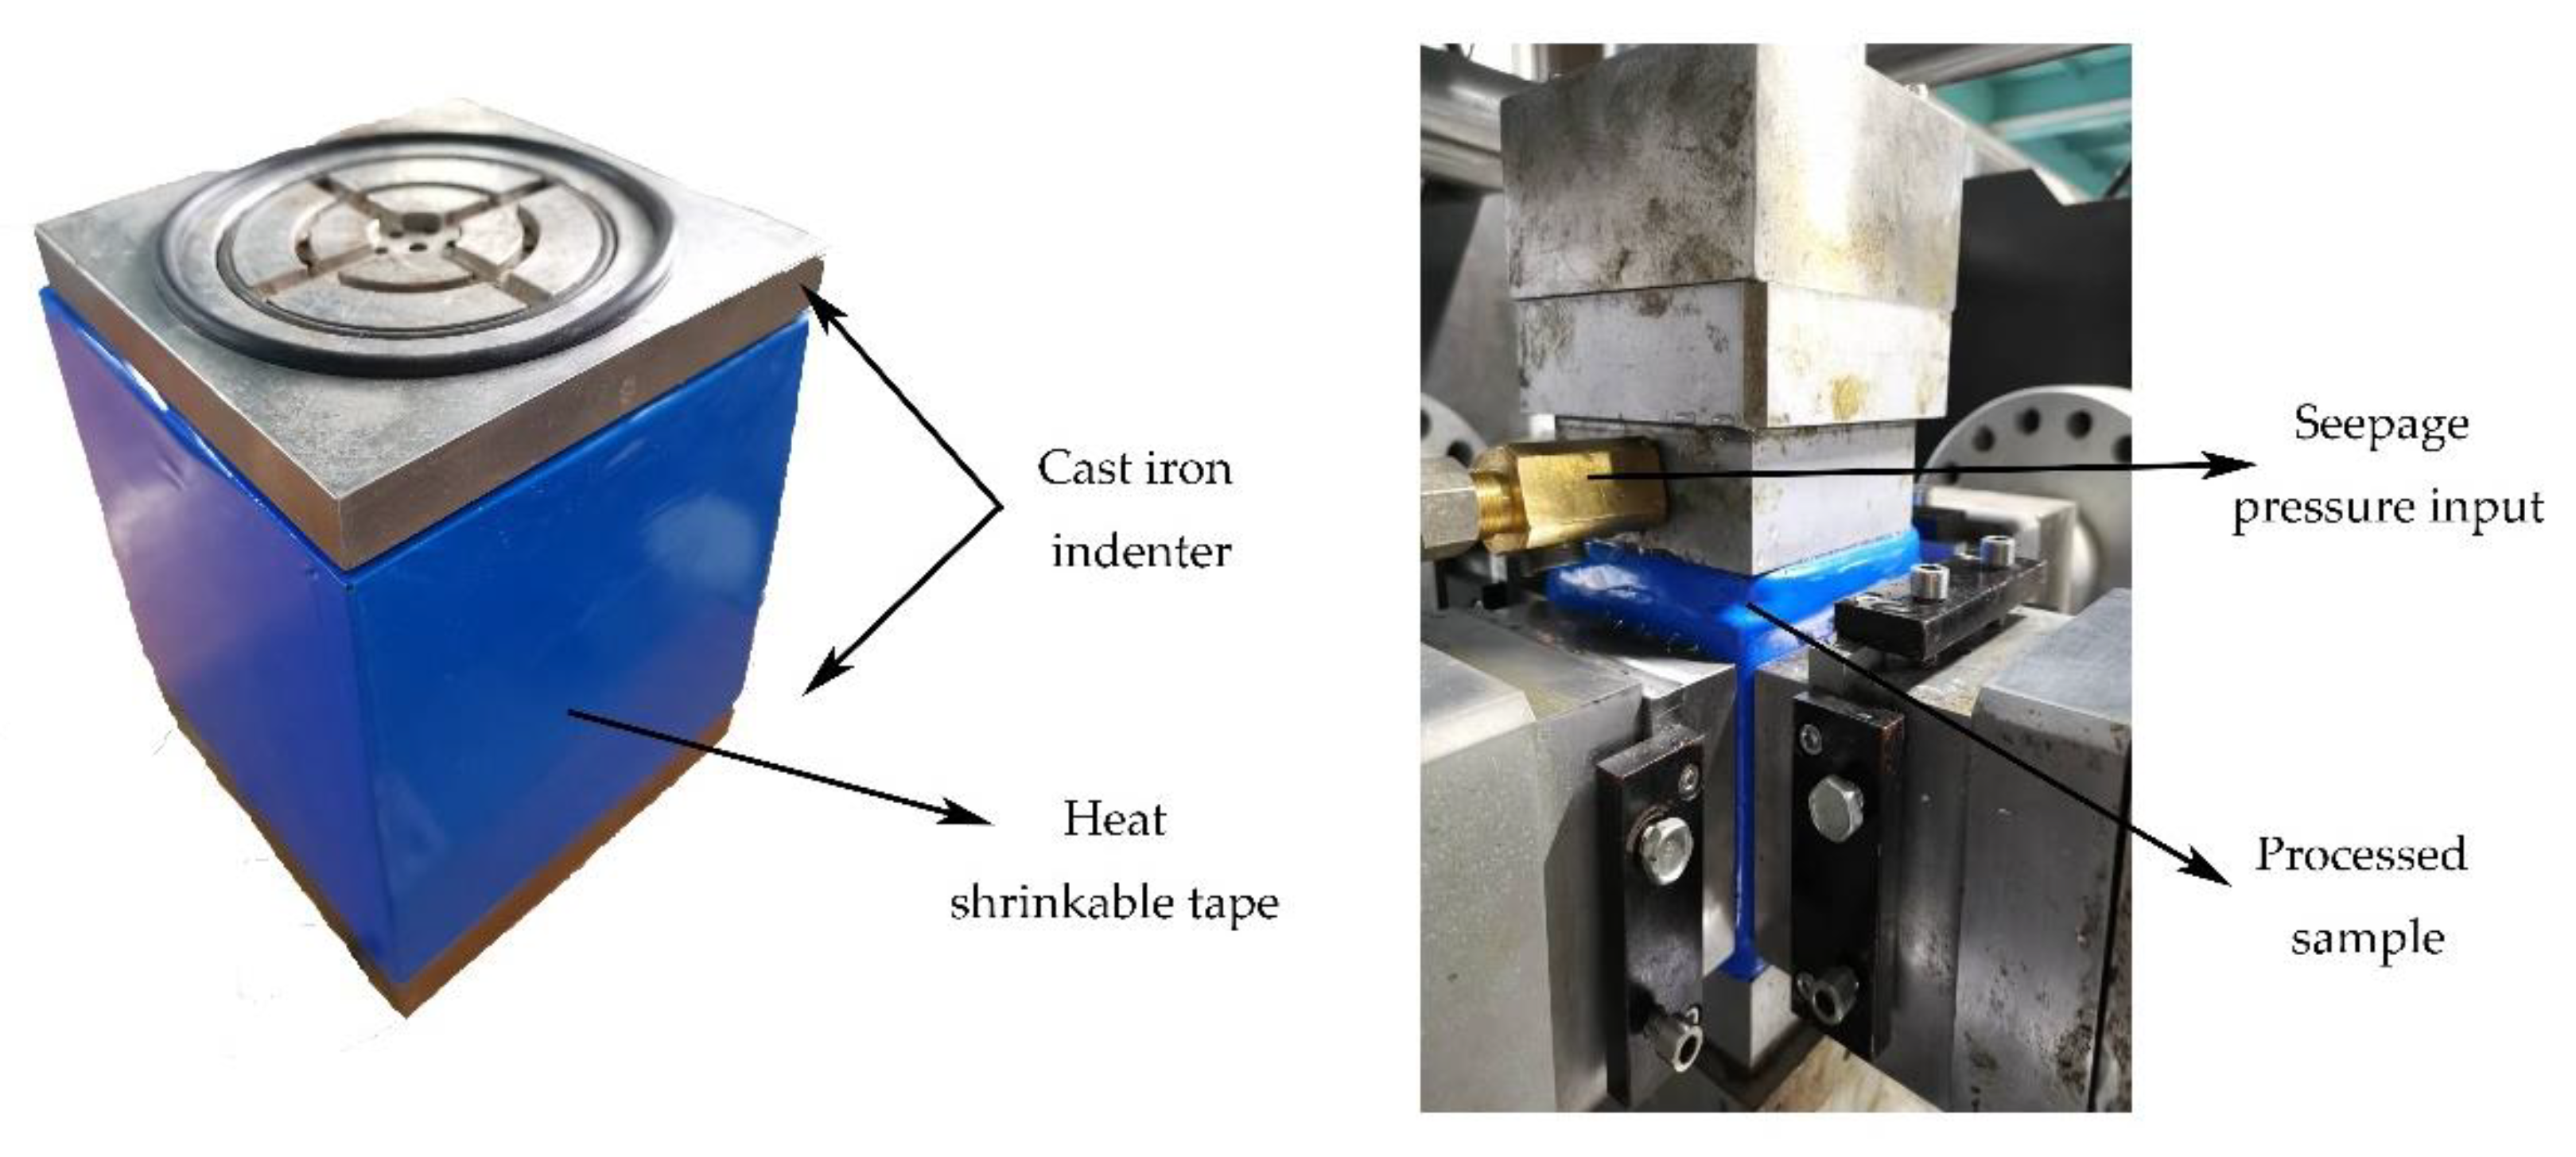
During the test, three-dimensional stress and seepage pressure P were applied to the cube specimens, with the seepage pressure gradient direction parallel to the extension direction of the specimen fracture. The inlet seepage pressure was set according to the test plan, and the outlet pressure was the atmospheric pressure. To ensure the single-pass permeability of the specimens, all specimens were saturated before the penetration test. To ensure that the penetration path only existed in the fractures, a waterproof sealant was used on the side of the specimen. We installed a cast iron indenter with the same area as the specimen on the upper and lower surfaces, with a thickness of 5 mm. Waterproof rubber gaskets were installed on the upper and lower ends of the indenter, and the surrounding area was bonded to the specimen using a waterproof sealant. In addition, the outside of the specimen was wrapped by a layer of plastic heat shrinkable tape from top to bottom to prevent water from entering the side of the specimen. Finally, we connected the specimen to the loading joint with a rubber sleeve and installed it in the pressure chamber. Figure 5 illustrates how the specimen was handled and installed.
To explore the permeability of the specimens under stress–seepage coupling conditions, the specific test steps are as follows:
1. Load the confining pressure (σ2 = σ3) slowly to 2 MPa at a low rate, load the axial pressure σ1 to 10 MPa, and then load the seepage pressure from 0.8 MPa to 1.4 MPa in stages; the loading gradient is set to 0.2 MPa. Under the premise that the pressure loading of each stage of seepage flow is completed and the flow rate remains stable, the change law of the permeability coefficient under a low confining pressure environment is recorded.
2. Raise the confining pressure (σ2 = σ3) to 5 MPa and load the seepage pressure in stages from 0.8 MPa to 1.4 MPa; the loading gradient is then set to 0.2 MPa. Under the premise that each stage of seepage pressure is loaded and the outflow remains stable, record the change law of the permeability coefficient under high confining pressure conditions.
3. Fix the confining pressure (σ2 = σ3) to 2 MPa and the seepage pressure to 1 MPa. Load the axial load in stages; the pressure change of each load gradient is then 2.5 MPa. Next, load the axial pressure until the sample fails. Record the change process of the permeability coefficient of the specimen under the condition of low confining pressure. Then, change the fixed confining pressure to 5 MPa, use the same loading gradient, and record the change process of the permeability coefficient of the specimen (same type as previous test) under the condition of high confining pressure.
4. Repeat the above test process for four specimens with different joint apertures.
5. Analysis of the Test Results
5.1. The Influence of the Fracture Aperture
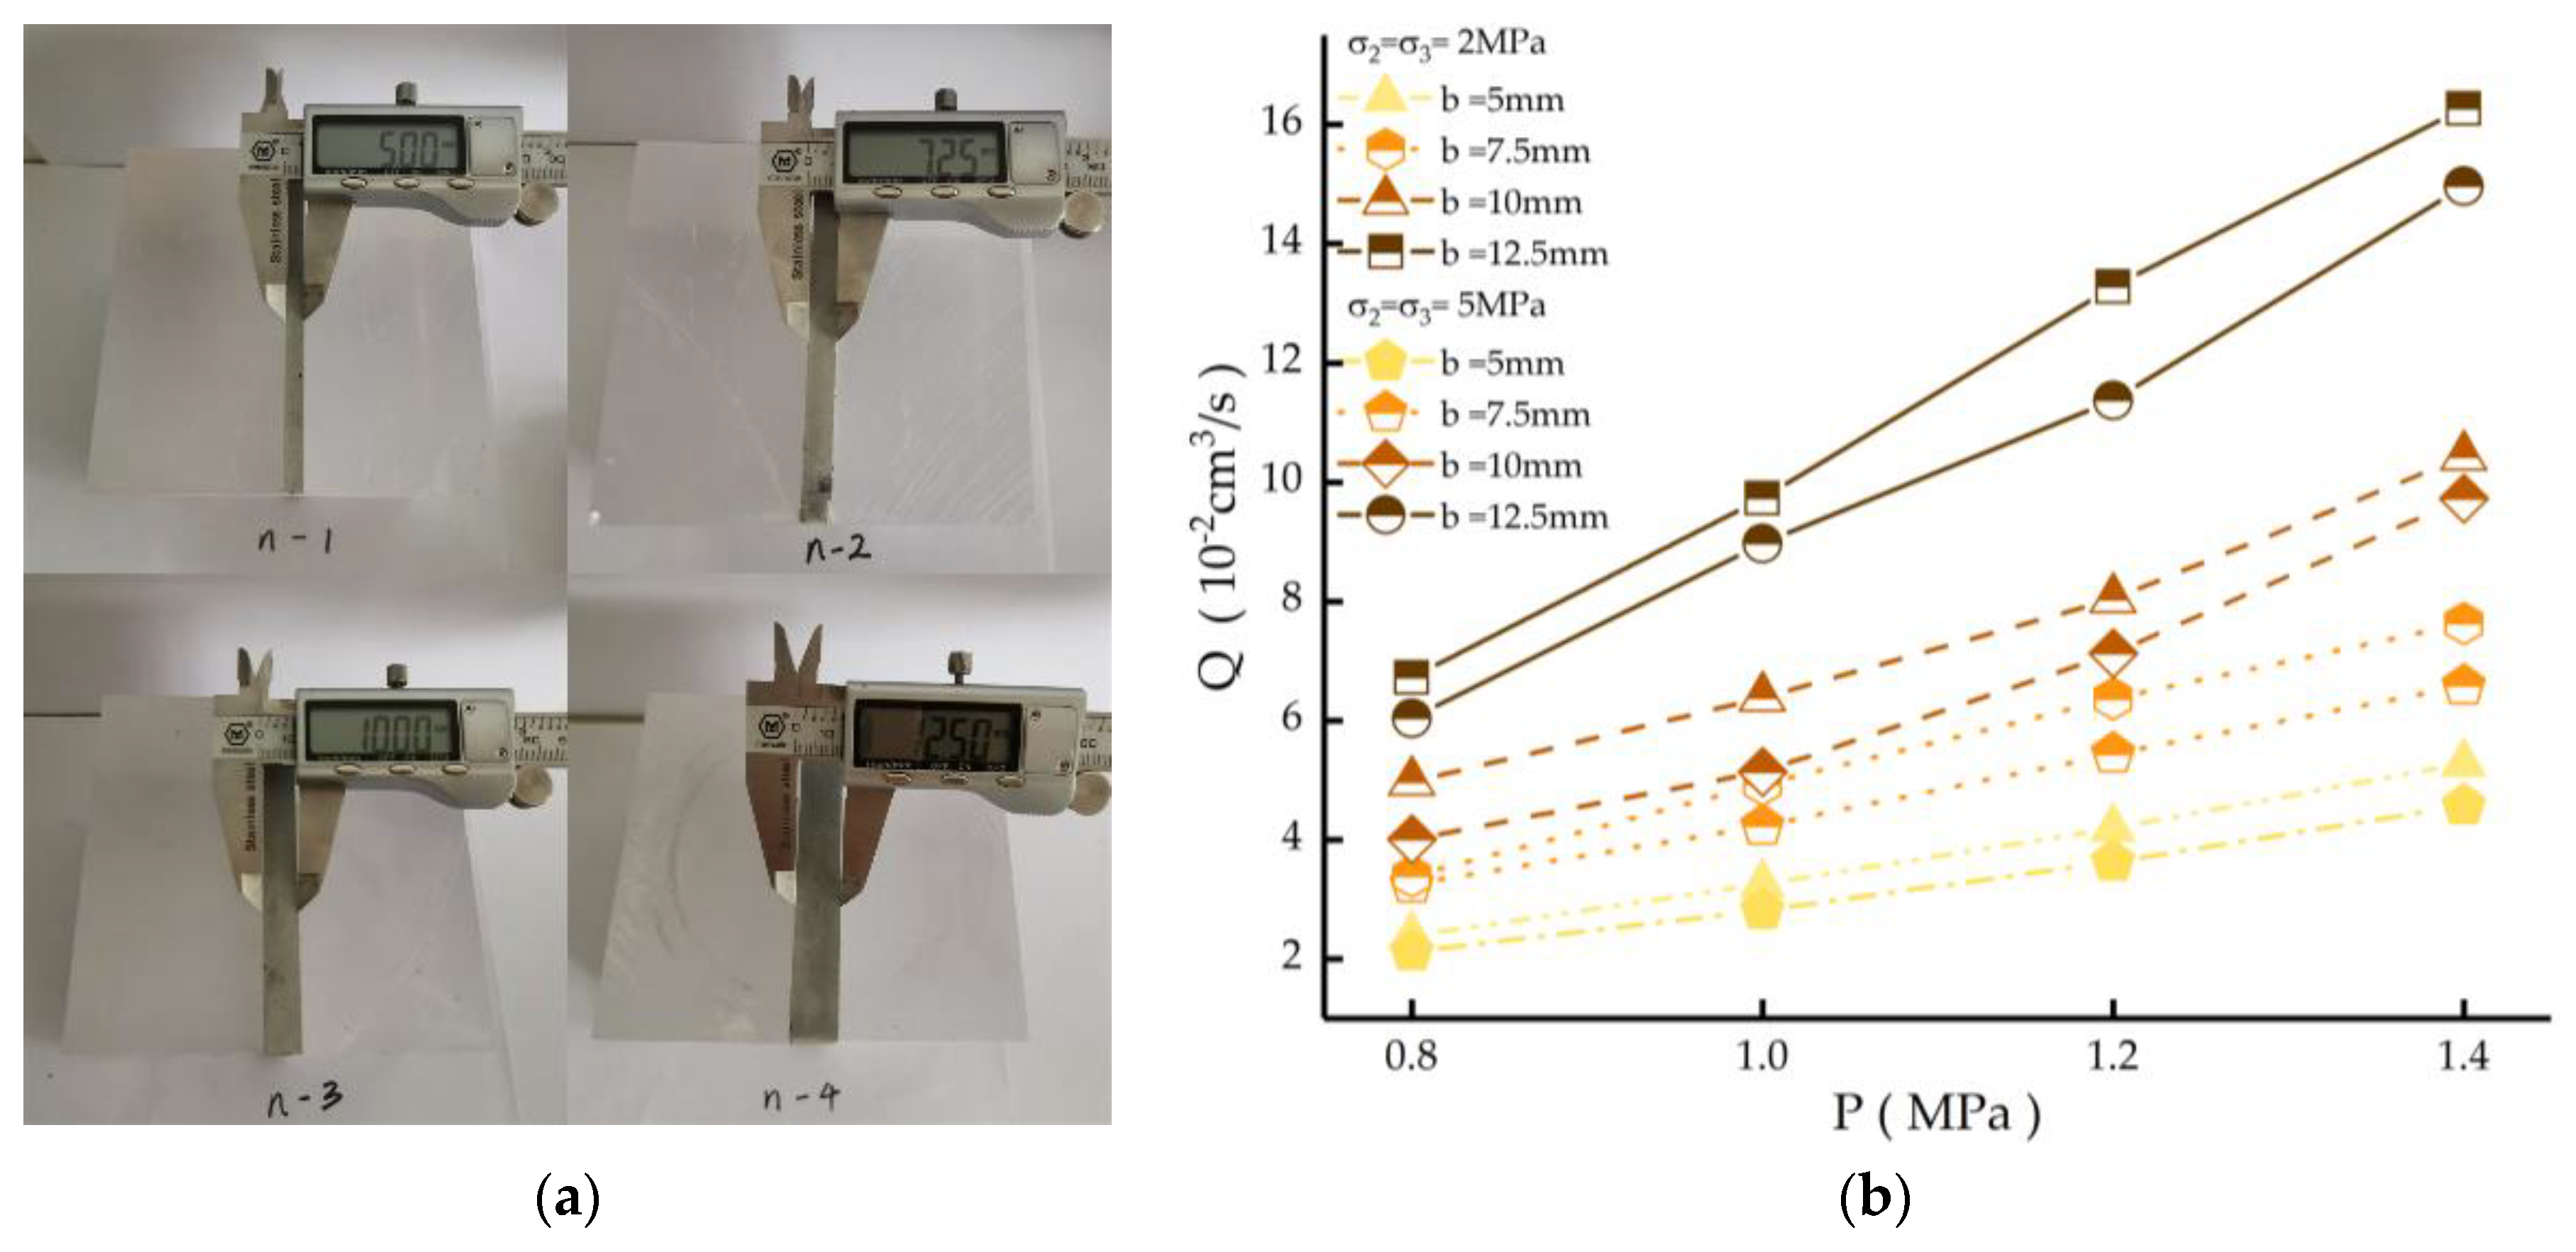
To explore the influence of the fracture aperture on the seepage discharge Q, test steps 1 and 2 were carried out. The specimens with four different fracture apertures are shown in Figure 6a. Under the conditions of low and high confining pressure, the seepage discharge of the specimens varied with the seepage pressure, as shown in Figure 6b.
Under the condition of a low confining pressure, the seepage discharge values of the four different apertures of the specimens from small to large were 2.389 × 10⁻² cm3/s, 3.392 × 10⁻² cm3/s, 4.972 × 10⁻² cm3/s, and 6.728 × 10⁻² cm3/s, which proved that the fracture aperture will affect the seepage flow. However, the relationship between the two was not a strictly linear relationship, but instead a superlinear relationship. The reason for this situation was the randomness of the pore distribution in the fracture, which led to a larger initial seepage discharge value of the specimen with a larger fracture aperture. With an increase in seepage pressure, the seepage discharge of the four specimens all increased, and the correlation trend was generally linear, indicating that the seepage discharge of the fractured rock mass and the seepage pressure were basically linearly related, which conformed to the general law of rock mass seepage mechanics.
In the test, the steady-state method was used to measure the seepage discharge of the specimens and calculate the permeability coefficient. The permeability coefficient was calculated by the following formula:
where kzz is the permeability coefficient of the rock along the water pressure gradient direction, is the bulk density of water, L is the length of the specimen, and A is the cross-sectional area of the specimen.
5.2. Influence of Axial Pressure and Verification of the Permeability Model
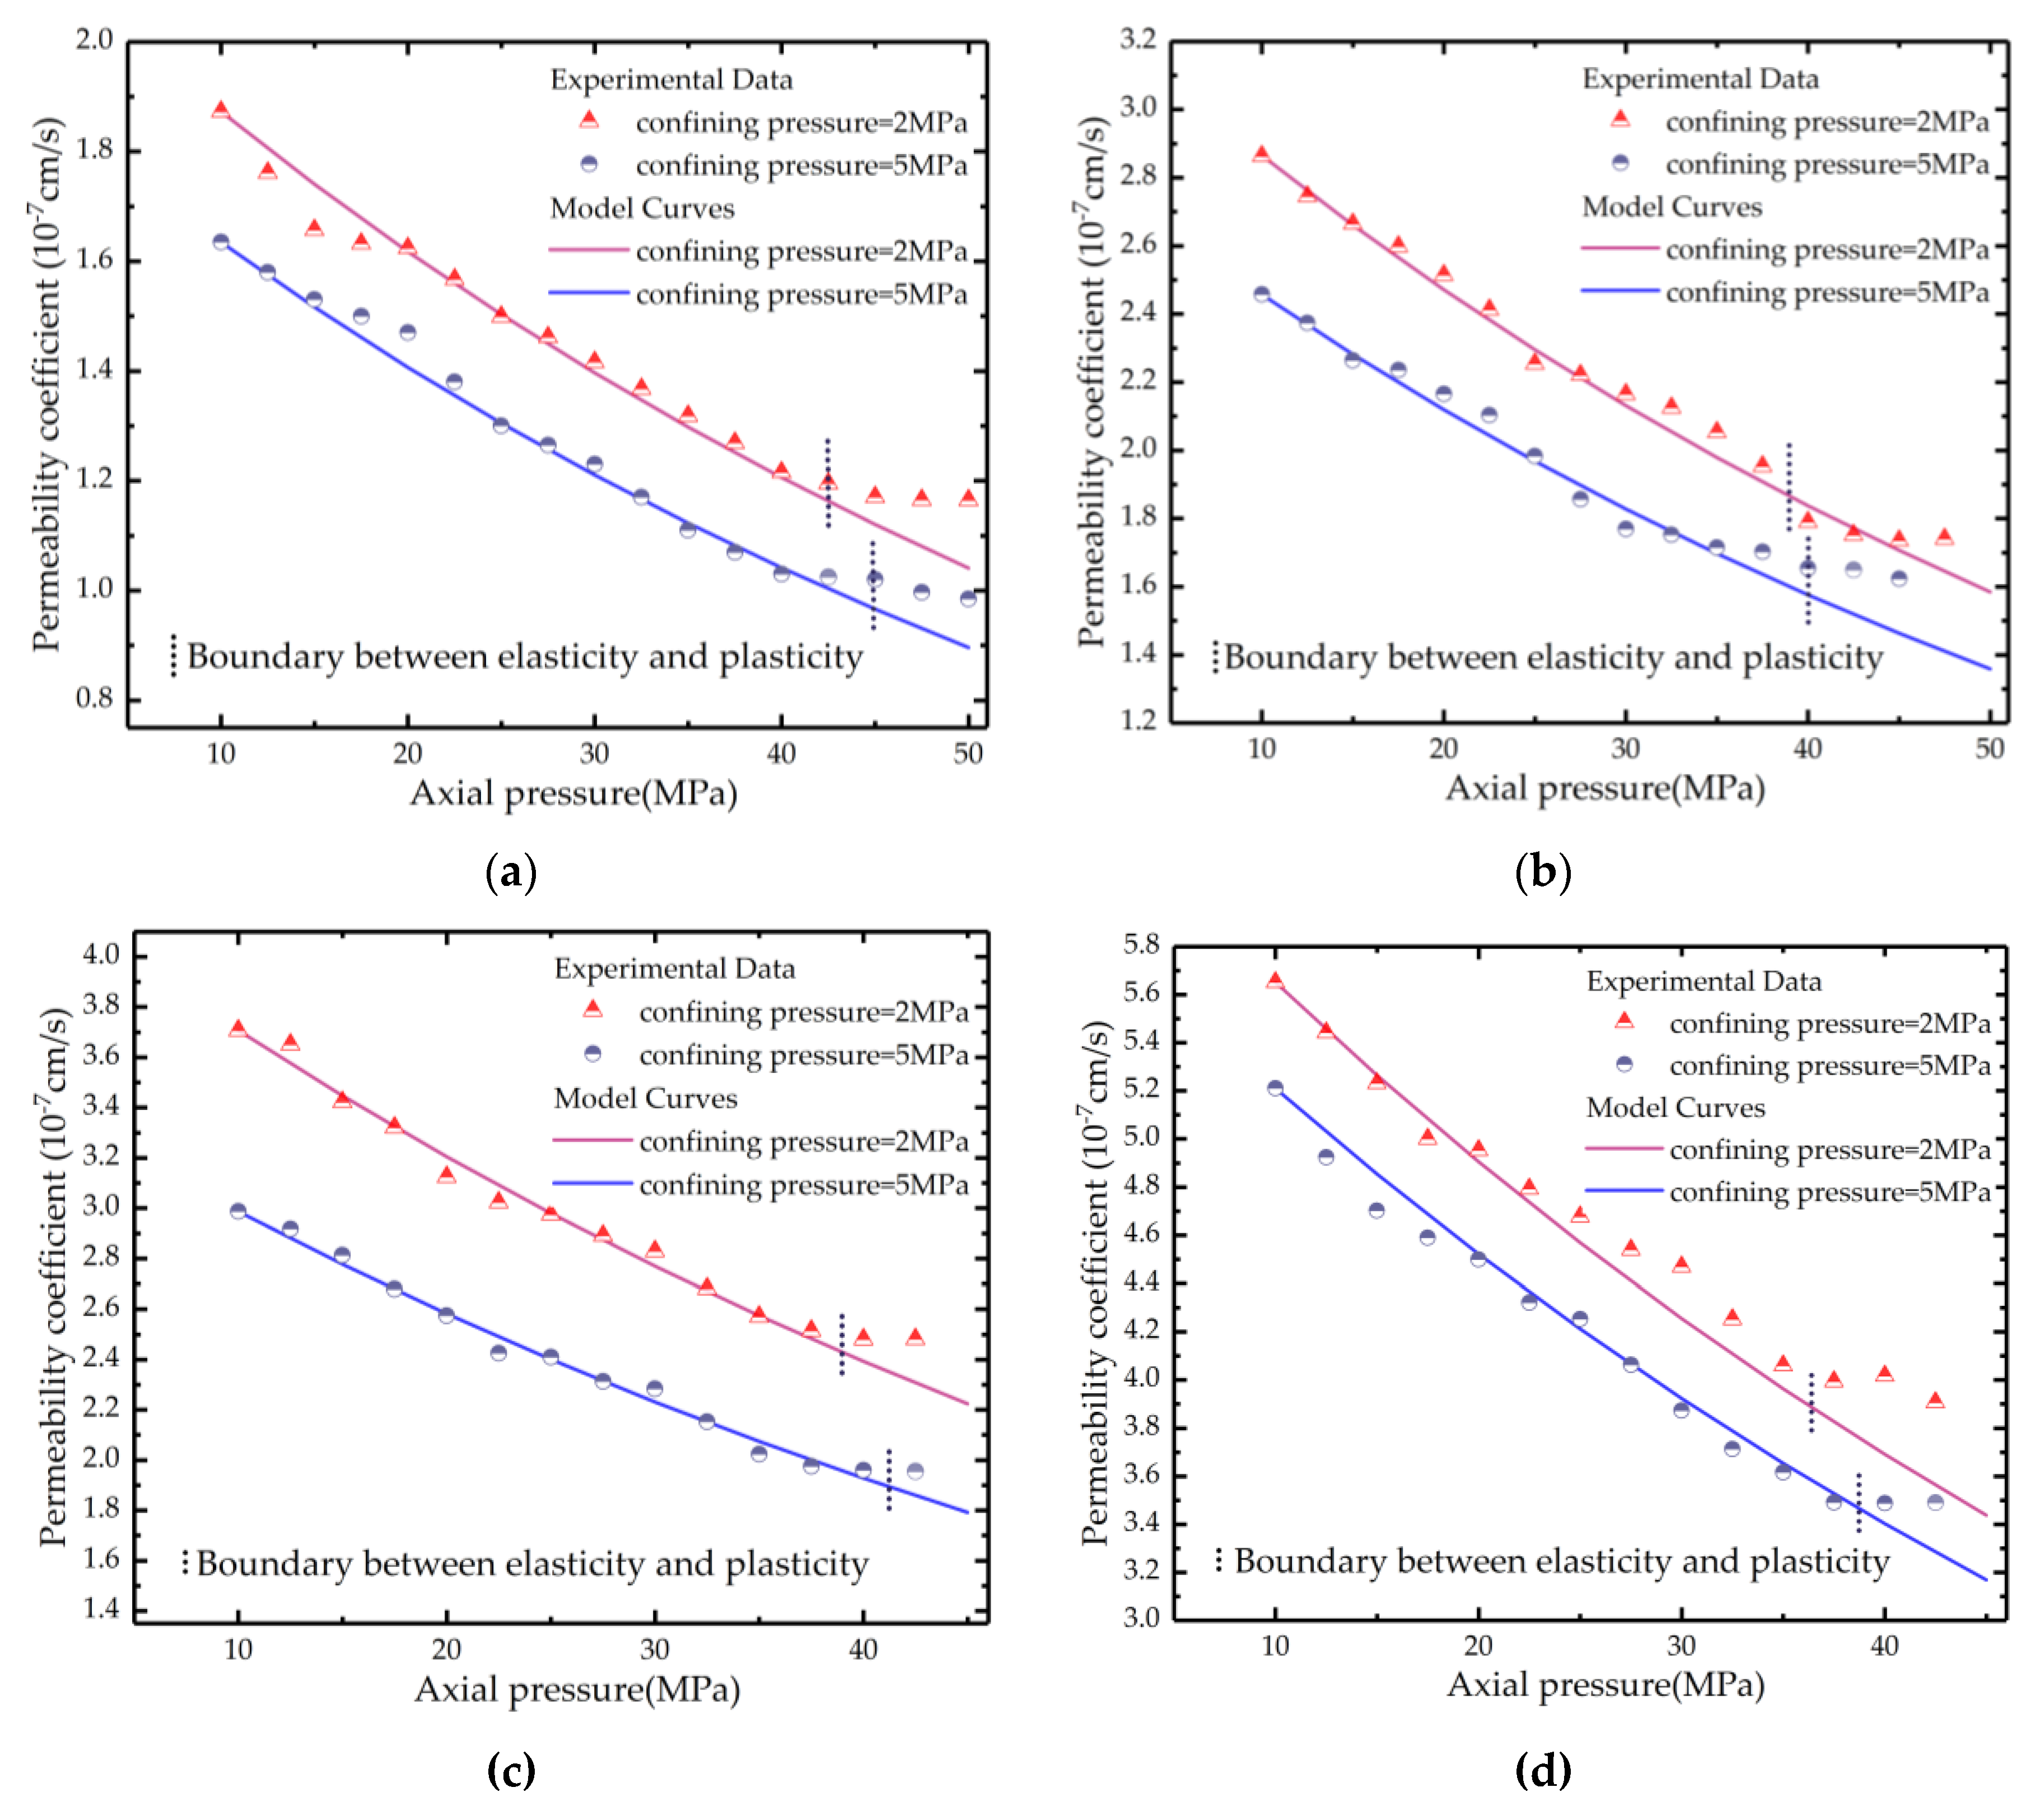
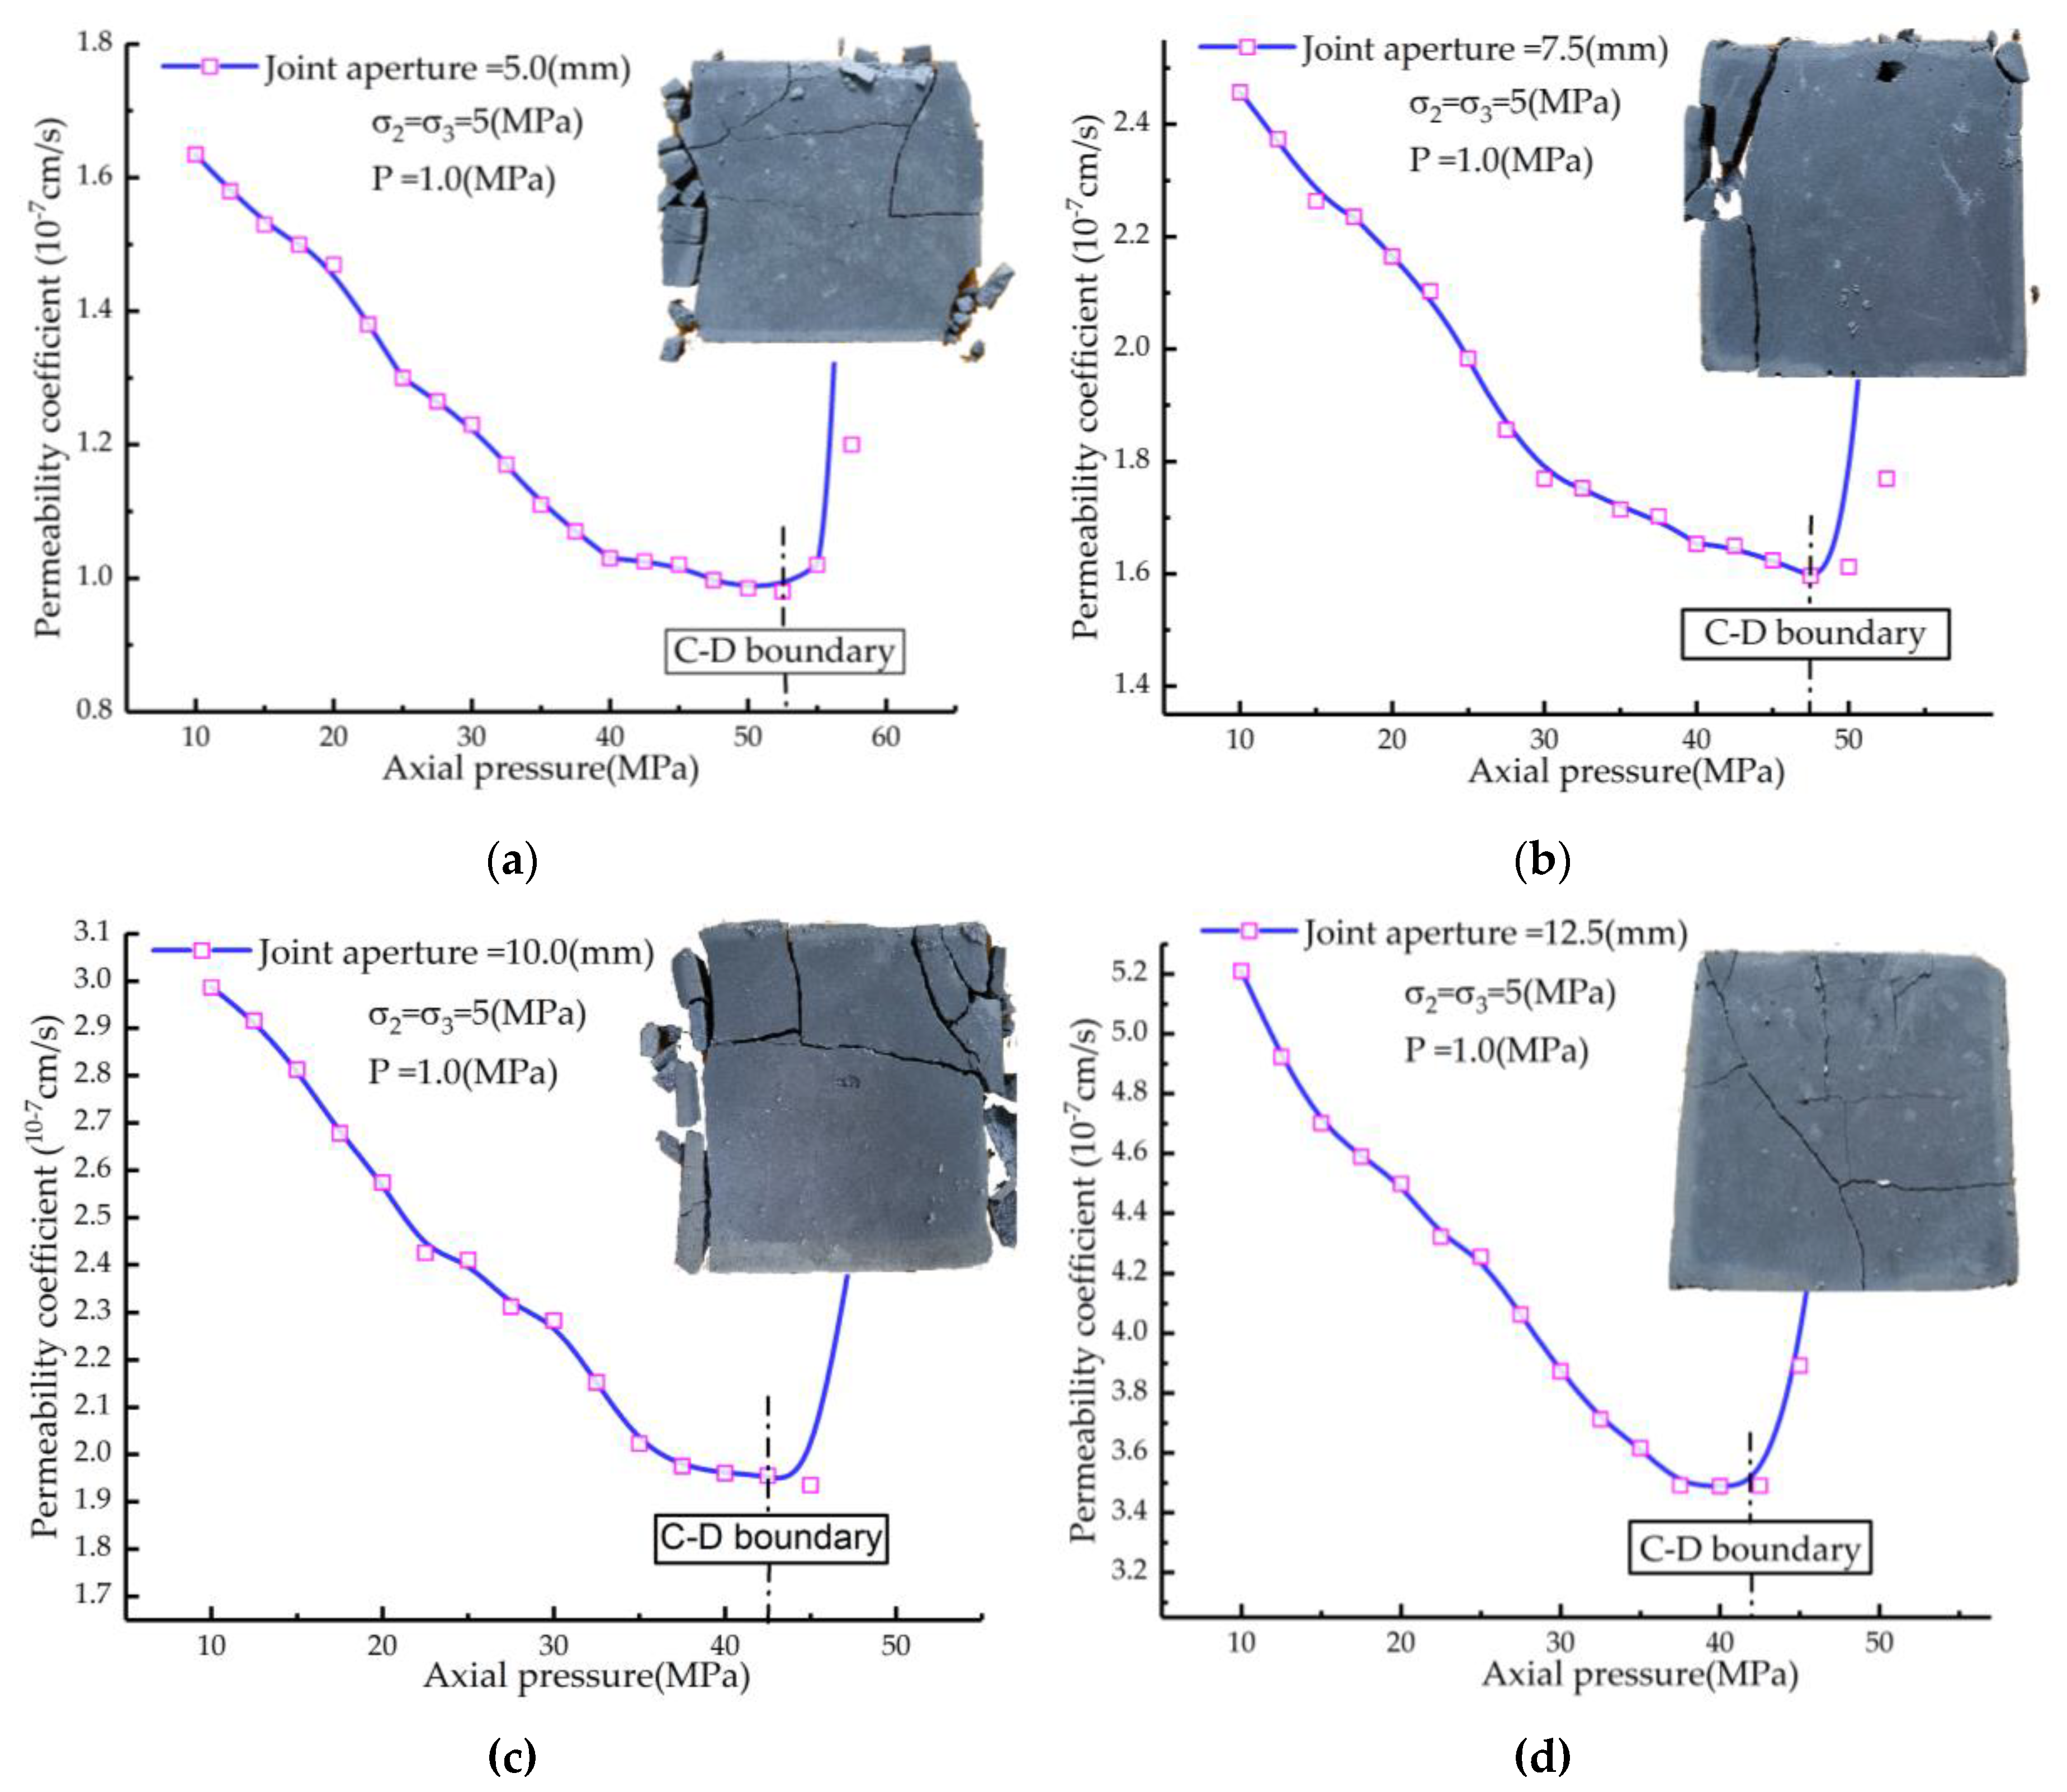
To explore the effect of axial pressure on the permeability coefficient and verify the permeability model proposed in Section 3, test step 3 was carried out, and the specific parameter values required by the model are listed in Table 1. It should be noted that the permeability model proposed above is for fractured rock in the elastic stage, so only the sample data in the elastic stage are intercepted for comparison, while the full stress permeability coefficient curve of the sample is analyzed later. The test results and theoretical calculation results are shown in Figure 7.
The data in Figure 7 show that with an increase of axial pressure, the permeability of the specimen showed a negative exponential downward trend. That is, when the axial pressure level was low, the specimen deformed into elastic deformation, and the permeability coefficient showed a rapid declining trend. In the case of high axial pressure, plastic deformation occurred inside the filling fracture, and the response on the permeability coefficient curve made the rate of the decrease in the permeability coefficient tend to be flat. Take the n-1 type sample as an example. Permeability tests were conducted under the two confining pressure conditions of σ2 = σ3 = 2 MPa and σ2 = σ3 = 5 MPa, corresponding to high and low confining pressure conditions, respectively. Under high confining pressure, after the axial pressure rose from 10 MPa to 30 MPa, the permeability coefficient of the specimen dropped from 1.63 × 10⁻⁷ cm/s to 1.23 × 10⁻⁷ cm/s—a decline percentage of 24.54%. After increasing the axial pressure to 50 MPa, the permeability coefficient was further reduced to 0.99 × 10⁻⁷ cm/s, relative to the permeability when the axial pressure was 30 MPa, and the decline percentage was 19.51%. Obviously, as the axial pressure continued to increase, the downward trend of the permeability coefficient gradually became smaller.
The dotted line in Figure 7 represents the elastic and plastic boundary of the filling fracture. As the aperture of the fracture increased, the stress value of the elastic and plastic boundary of the specimen gradually decreased, indicating that the sensitivity of the permeability coefficient to axial pressure gradually increased. This situation can be explained from the perspective of the destruction of the filling. The directions of the original cracks inside the filling fractures were different. When the filling entered the plastic stage, the internal cracks began to propagate and penetrate. A specimen with a larger fracture aperture was more conducive to the formation of preferential seepage channels, thereby affecting the permeability coefficient.
Analyzing the verification of the constitutive model, it can be seen that within the range of elasticity, the calculation results of the model and the test results are in good agreement. The correlation coefficient was then used to describe the fitting degree of the model. We calculated that the correlation coefficients of the experimental results and theoretical calculation values under various conditions were both greater than 0.95. This shows that under the condition of online elasticity, the permeability model established in this paper can reflect the change trend of the permeability characteristics of the fractured rocks. Notably, under high stress conditions (σ1 > 50 MPa), the fitting results begin to deviate because the filling fracture plate enters the plastic phase from the elastic stage. In the plastic phase, the aperture of the filling fracture is further reduced, but at the same time, the internal cracks are gradually penetrated, and new seepage channels are gradually formed between the fracture fillings. This channel leads to an increase in permeability. Under the combined action of the above two influencing factors, the sample shows the characteristics of a stable permeability coefficient.
6. The Effect of Water Pressure on Fractured Rocks
6.1. Stress Field Distribution on the Surface of the Fracture Fillings
In the fractured rocks, the thickness of the fracture is thinner than that of the entire rock, and the strength is much lower than that of the complete rock. Therefore, its compressive strength along the direction of joint extension is generally ignored, and only its vertical compressive strength is considered [47]. When analyzing the deterioration mechanism and permeability characteristics of the filling fracture under the coupling field, the influence of the stress field perpendicular to the fracture is considered, and water pressure is used as the volume force to calculate the effective stress inside the rock mass, which determines the deterioration degree of the filling fracture. However, due to the complexity of the structure of the mineral bulk deposits inside, an analysis using the traditional isotropic material analysis method will ignore the horizontal stress component generated by the water pressure on the fracture surface, and the stress component will accelerate the development of cracks.
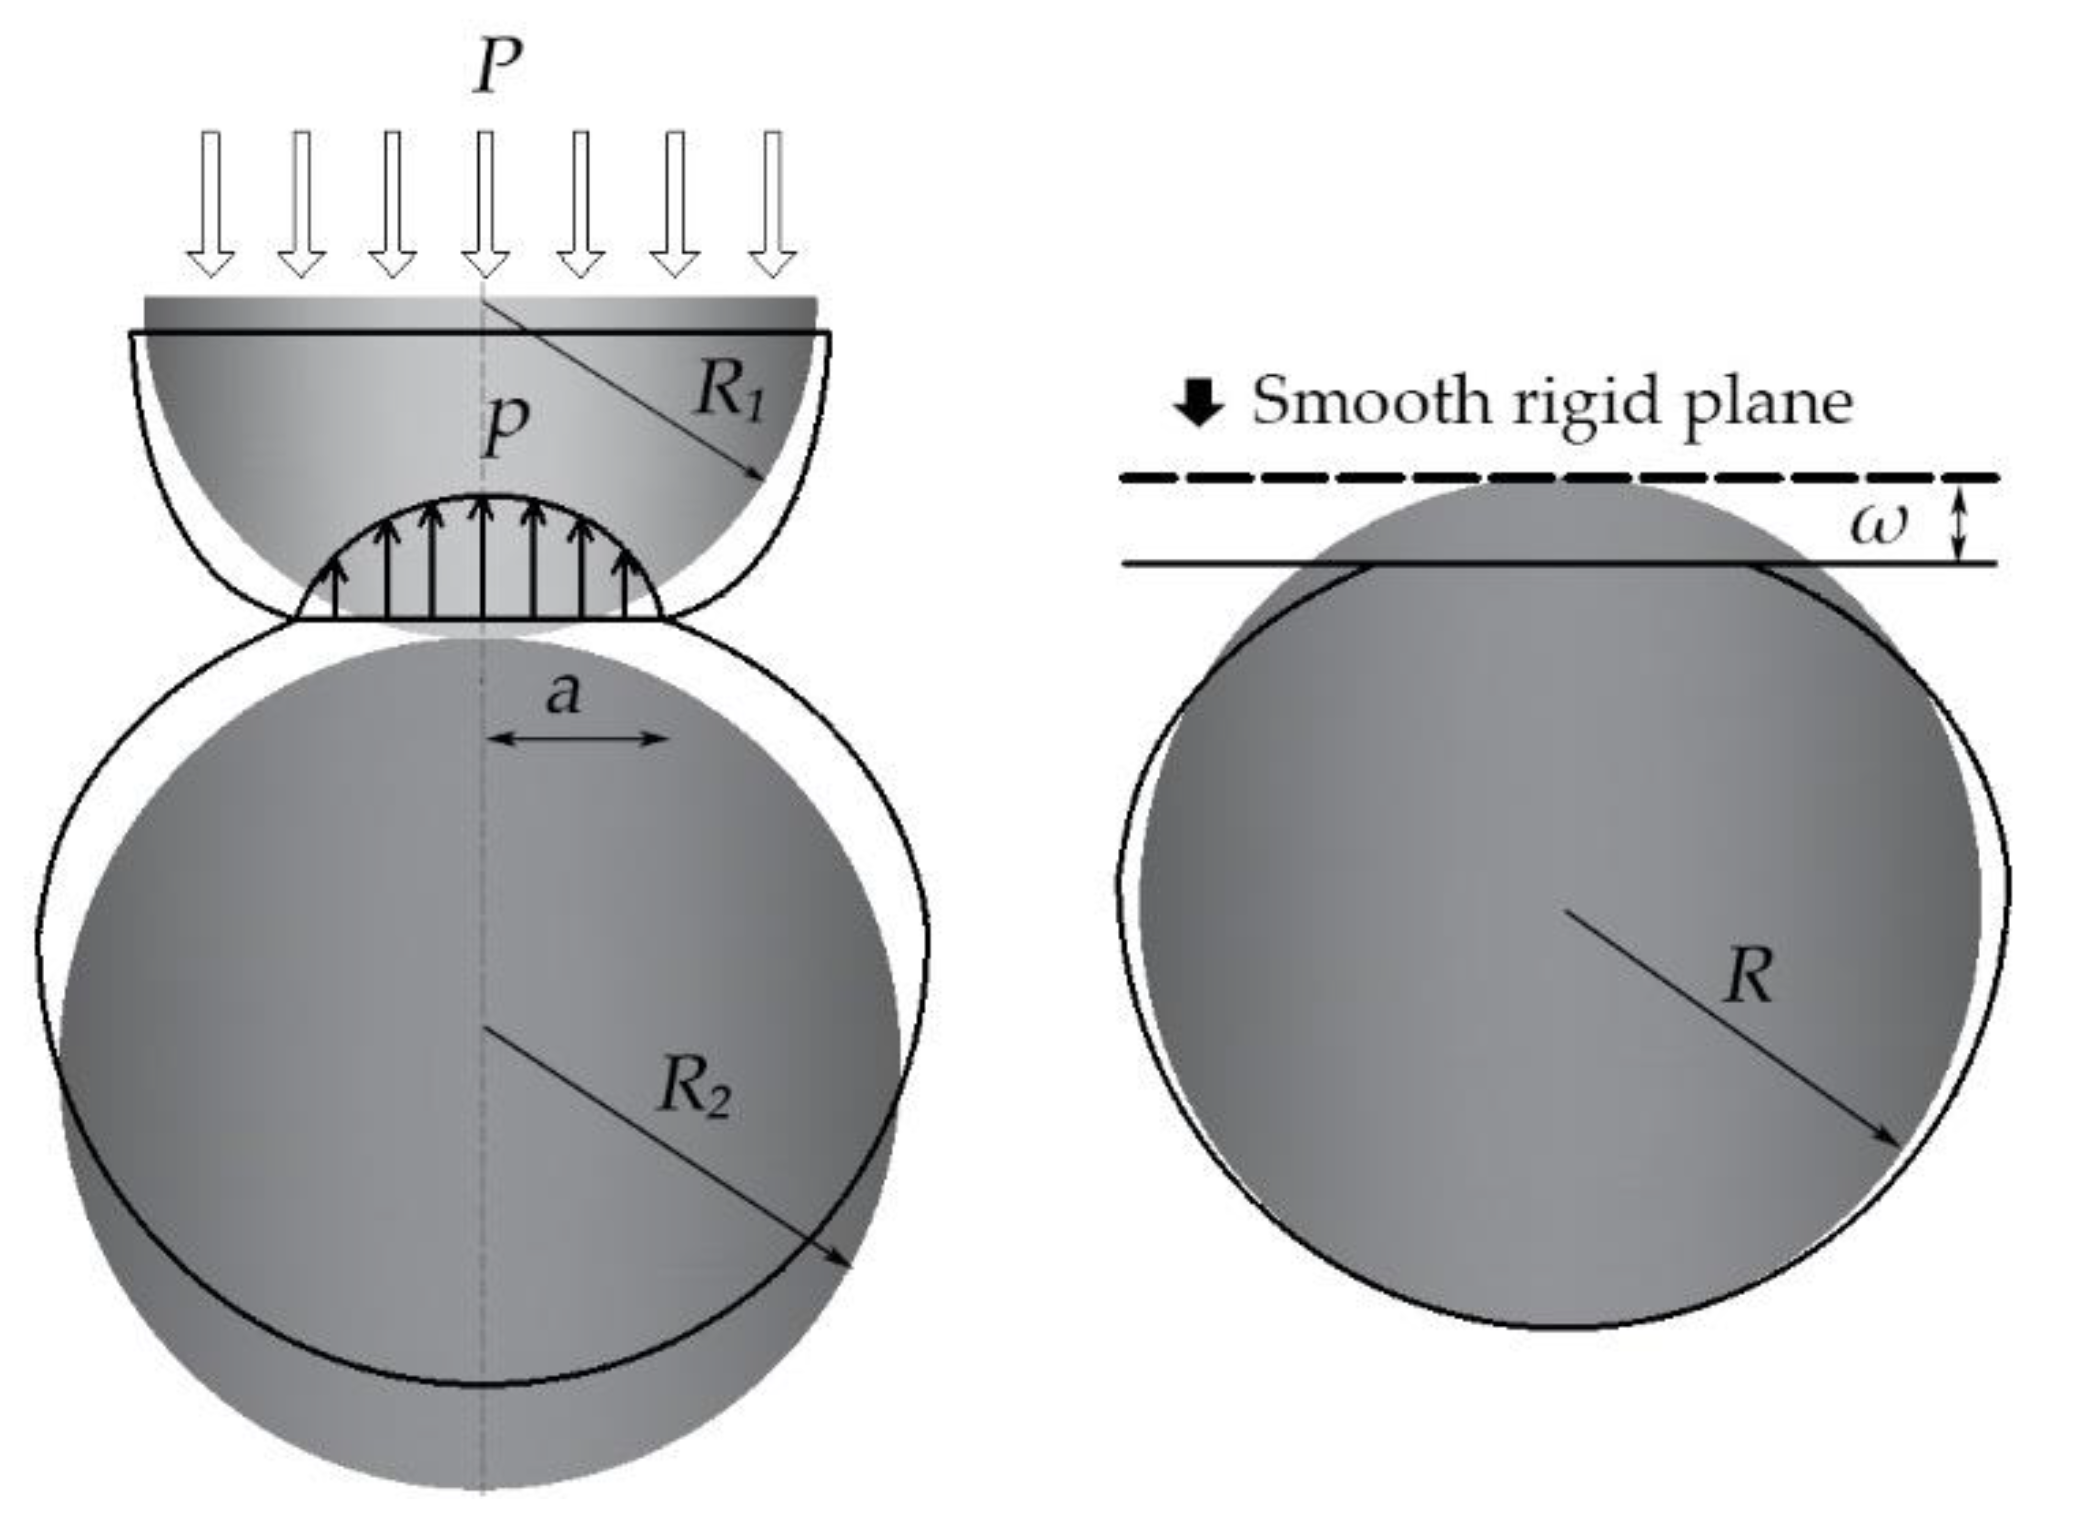
To analyze the stress distribution on the surface of the filling fracture, based on Hertzian contact theory, the fracture surface is assumed to be an ideal plane, and the filling mineral particles are described by sphere units. Therefore, the mineral particles on the fracture surface can be expressed as hemispheres. When the coupling field is applied, the seepage pressure acts on the fracture surface in the form of a uniform force, and contact interference occurs between the particles. At the same time, a surface force perpendicular to the normal water head is generated. This force will produce shear slip and lateral splitting between mineral particles (i.e., the deterioration effect of water pressure on filling fractures). The following is a qualitative analysis of the effect of seepage pressure. The Hertzian contact in the filling fracture is shown in Figure 8:
Using the same assumption as Hertzian contact theory [48], the contact between the spheres is considered frictionless contact, and the contact area is an elastic space; then, the contact interference ω and indentation radius a can be calculated by the pressure P, as follows:
where R is the particle radius, σP is the water pressure, v is the Poisson’s ratio, and E is the elastic modulus.
Taking the area unit in the indentation circle, the normal displacement and tangential displacement at any point in the indentation can be calculated as follows [49]:
where r is the radius from any point in the indentation to the center of the indentation, and p(r) is the contact stress.
The tangential strain of the filling fracture surface can be obtained by the formula . Since the rock is in a three-dimensional stress state, the surface stress of the rock can be obtained by the generalized Hooke’s law: , where and are the tangential strain and the normal strain of the infilled joint surface, respectively. Ignoring its shear modulus, the rock surface stress can be expressed as
According to the analysis method of particle flow, the development of cracks on the rock surface is generally considered to occur at the edge of the particles and continues to expand inside the specimen. Substitute Equation (17) into Equation (20), and the surface stress at the edge of the indentation can be expressed as
Equation (21) clarifies the stress distribution on the joint surface. The normal stress acts on the lower particles, and the radial stress will produce the “stress concentration” phenomenon in a certain range of mineral particles, which can explain the causes of the cracks on the joint surface. At the same time, we observed that the magnitude of the above-mentioned stress has nothing to do with the size of the filler particles inside the fractures; instead, it only relates to the elastic modulus and Poisson’s ratio. Therefore, the reason for the deterioration effect of the filling fractures caused by hydraulic conditions is the arrangement of mineral particles and the mineral composition. Eventually, these conditions will lead to the development of internal cracks in the fractures and increase the permeability of the fractured rocks.
6.2. Analysis of Internal Cracks in the Fillings after a Full Stress Test
By analyzing the cracks inside the sample, the failure process of the sample could be determined. The failure form of the rock under hydro-mechanical coupling was different from stress loading failure. From the results of the formula derivation in Section 6.1, the seepage field will cause an increase in the horizontal stress component of the rock surface, which will lead to crack development in the filling fracture near the high water head. This section focuses on an analysis of the distribution of cracks on the near water head side and the far water head side of the filling after the destructive loading test (that is, the sample that has completed step 3 of the test). At the same time, the variation law of the permeability coefficient during the full stress–permeability process of the sample is analyzed, and this law is compared with the crack development process.
Since the samples were combined samples, the internal fillings had good visualization characteristics. After destructive loading, we removed the PMMA blocks on both sides of the sample and obtained the cement mortar board that entered the destruction stage. Taking n-1 type and n-3 type samples as examples, the cement mortar boards of the two groups of samples after destructive loading are shown in Figure 9.
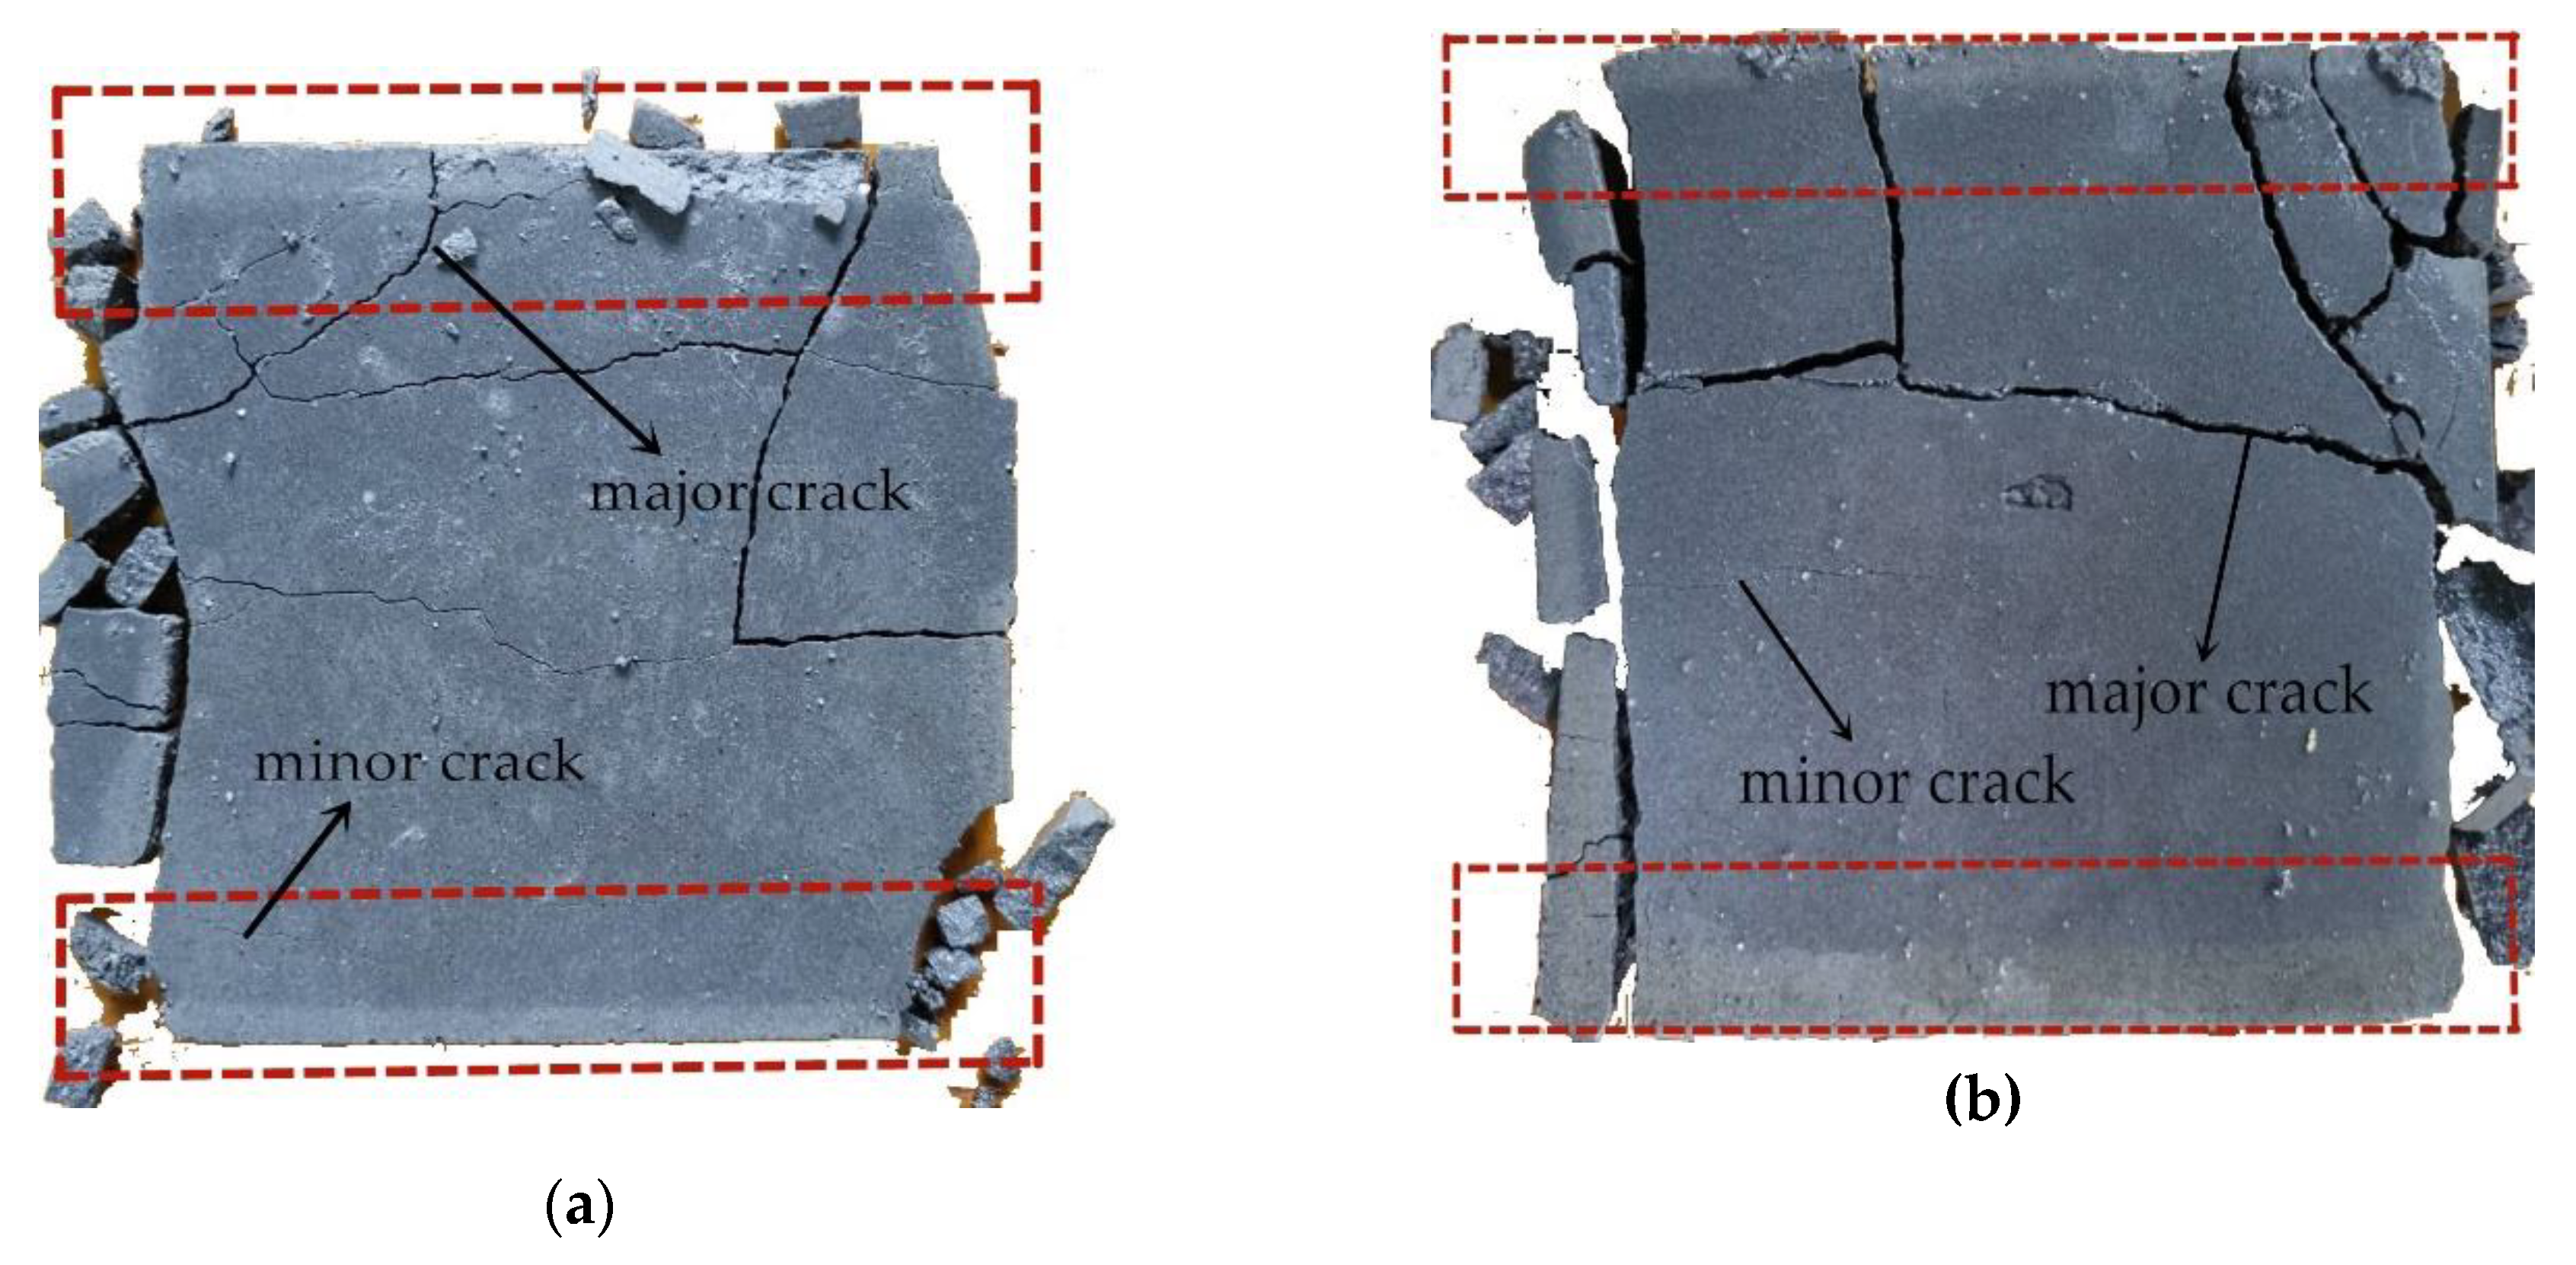
After the destructive loading test, shear failure occurred in the filling cement plates of two samples, a large number of through cracks appeared, and the structure lost its integrity. To distinguish the sizes of the cracks, cracks with a maximum opening greater than 0.5 mm were called large cracks and could be directly observed by the naked eye. Cracks with maximum openings of less than 0.5 mm were called small cracks and could be observed by microscope. Red dotted lines were marked on the upper and lower sides of the two filling plates. Due to the stress concentration, the cracks were most densely distributed on the upper and lower surfaces. It can be seen from the test results that the distribution frequency of major cracks and minor cracks in the upper part of the two samples filled with cement board was greater than that of the lower part, and, by observing the propagation morphology of the major cracks, the splitting effect was obvious. At the same time, transverse cracks were observable in the filling material, which indicated that the extrusion of the rock matrix was an important factor affecting the failure of the filling fracture. This shows that the filling part was affected by the seepage pressure and produced a radial stress component that greatly accelerated crack propagation and made the seepage channel run through from top to bottom. This shows that water pressure can promote crack development, which verifies the theory proposed in the previous section.
Combined with the development of the filling crack, we could obtain the change curve of the full stress–permeability coefficient of the filling fracture sample, as shown in Figure 10.
Figure 10 shows the full stress–permeability coefficient curve of the specimens with different fracture apertures under high confining pressure. It can be clearly seen that the failure of the filling fractured rocks was largely divided into three stages. The first stage was primarily the elastic stage. During this stage, the permeability coefficient continued to decrease with an increase in axial pressure, and the relationship between the two was basically linear. The shape of the sample was largely unchanged, and the integrity was largely maintained. The second stage was the elastoplastic stage. As the confining pressure rose, the permeability coefficient decreased slowly. The relationship between the two was similar to a negative exponential curve. The specimen experienced partial plastic deformation, but no macro cracks appear. The third stage was the failure stage. Here, the permeability coefficient of the specimen increased sharply, the mechanical properties of the fracture fillings were lost, and a large number of macro penetration cracks appeared in the samples. The formation of macro cracks could be clearly seen in the specimens, and the fracture fillings lost their integrity. However, there was a certain error caused by characterizing the failure process according to changes in the permeability coefficient. In the seepage test, the seepage flow was the average value over a period of time, so it was difficult to accurately locate.
7. Conclusions
In this study, the compaction effect coefficient δ was added to the classical matchstick model, and the volume strain principle was used to propose a permeability model for fractured rocks. Based on the Hertz contact theory, the mechanism of crack development between mineral particles under seepage pressure was analyzed, and a true triaxial seepage test was carried out on rock-like materials to obtain the change law of the permeability characteristics of the fractured rocks. Based on the above research, the following conclusions are drawn:
- (1)
- Under the elastic stage, the matchstick permeability model can describe the seepage characteristics of the infilled fractured rocks. The application of effective stress not only leads to changes in the aperture of the fracture but also to changes in the permeability properties of the filling. Adding the compaction effect coefficient δ to the model can better reflect this feature.
- (2)
- Under high confining pressure, after the axial pressure rises from 10 MPa to 30 MPa, the permeability coefficient of the n-1 specimen drops from 1.63 × 10⁻⁷ cm/s to 1.23 × 10⁻⁷ cm/s—a decline percentage of 24.54%. After increasing the axial pressure to 50 MPa, the permeability coefficient is further reduced to 0.99 × 10⁻⁷ cm/s, relative to the permeability when the axial pressure is 30 MPa, and the decline percentage is 19.51%. Obviously, as the axial pressure continues to increase, the downward trend of the permeability coefficient gradually becomes smaller, and this characteristic accords with the classical negative exponential model.
- (3)
- The results of the true triaxial seepage test show that during the axial loading process, the permeability of the fractured rocks undergoes three stages of rapid decline, stabilization, and rapid increases. Each stage corresponds to a different failure process of the filling fracture.Comparing the theoretical calculation results to the experimental results, the correlation coefficients of the experimental results and theoretical calculation values under various conditions are both greater than 0.95.
- (4)
- The application of seepage pressure will concentrate stress in the contact parts of the mineral particles inside the fracture. The value of the radial stress around the mineral particles has nothing to do with the sizes of the mineral particles, but is instead related to their arrangement and its physical and mechanical properties. The radial stress has a great effect on the cracking and penetration of cracks.
- (5)
- By analyzing the fracture fillings in the failure stage using a fracture microscope, it can be observed that there are lateral cracks distributed inside the joints, which reflects the squeezing effect of rock blocks on the fracture fillings. It can also be seen from the test results that the distribution frequency of major cracks and minor cracks on the upper part of samples is greater than that of the lower part. Thus, the effect of seepage pressure on crack growth is verified.
Author Contributions
Methodology, Z.Z., Z.H. and X.Q.; Experiment, Z.H., X.Q., C.L. and Y.H.; Formula Derivation, Z.Z. and Z.H.; Figures & Tables, Z.Z. and Z.H.; Writing, Z.Z. and Z.H.; Data analysis, Z.Z., Z.H. and X.Q.; Project Administration, Z.Z. and X.X.; Resources, Z.N., Z.Z. and X.X.; Funding Acquisition, Z.Z. and X.X. All authors have read and agreed to the published version of the manuscript.
Funding
This research was funded by the Fundamental Research Funds for the Central Universities and Postgraduate Research & Practice Innovation Program of Jiangsu Province (KYCX20_0451); National Natural Science Foundation of China (Grant No. 41831278,51709184 and 51579081); Central Public-interest Scientific Institution Basal Research Fund(Y118008).
Conflicts of Interest
The authors declare no conflict of interest.
References
- Beckwith, R. Hydraulic fracturing: The fuss, the facts, the Future. J. Pet. Technol. 2010, 62, 34–40. [Google Scholar] [CrossRef]
- Caulk, R.A.; Ghazanfari, E.; Perdrial, J.N.; Perdrial, N. Experimental investigation of fracture aperture and permeability change within Enhanced Geothermal Systems. Geothermics 2016, 62, 12–21. [Google Scholar] [CrossRef]
- Jiang, Z.; Ji, L. The laboratory study on behavior of permeability of rock along the complete stress -strain path. Chin. J. Geotech. Eng. 2001, 02, 153–156. (In Chinese) [Google Scholar]
- Ellsworth, W.L. Injection-induced earthquakes. Science 2013, 341, 142–143. [Google Scholar] [CrossRef]
- Kreipl, M.P.; Kreipl, A.T. Hydraulic fracturing fluids and their environmental impact: Then, today, and tomorrow. Environ. Earth Sci. 2017, 76, 160. [Google Scholar] [CrossRef]
- Lisuzzo, L.; Cavallaro, G.; Pasbakhsh, P.; Milioto, S.; Lazzara, G. Why does vacuum drive to the loading of halloysite nanotubes? The key role of water confinement. J. Colloid Interface Sci. 2019, 547, 361–369. [Google Scholar] [CrossRef] [Green Version]
- Elsworth, D.; Spiers, C.J.; Niemeijer, A.R. Understanding induced seismicity. Science 2016, 354, 1380–1381. [Google Scholar] [CrossRef]
- Wang, S.; Elsworth, D.; Liu, J. Permeability evolution during progressive deformation of intact coal and implications for instability in underground coal seams. Int. J. Rock Mech. Min. Sci. 2013, 58, 34–45. [Google Scholar] [CrossRef]
- Shen, L.; Chang, B. Application of stress-pore pressure coupling theory for porous media to the Xinfengjiang reservoir earthquakes. Pure Appl. Geophys. 1995, 145, 123–137. [Google Scholar] [CrossRef]
- Liu, X.; Feng, M.; Xi, A.; Yan, X.; Wu, Y.; Liu, C. Diagenesis and pore evolution of Carboniferous volcanic reservoirs in Dixi area, Kelameili Gas Field. Lithol. Reserv. 2016, 28, 38–48. [Google Scholar]
- Feng, M.; Liu, T.; Lin, T.; Liu, X.; Li, N.; Xi, A. Fracture Fillings and Implication of Fluid Activities in Volcanic Rocks: Dixi Area in Kelameili Gas Field, Junggar Basin, Northwestern China. Minerals 2019, 9, 154. [Google Scholar] [CrossRef] [Green Version]
- Wang, P.; Yang, T.; Xu, T.; Yu, Q.; Liu, H. A Model of Anisotropic Property of Seepage and Stress for Jointed Rock Mass. J. Appl. Math. 2013, 2013, 361–376. [Google Scholar] [CrossRef]
- Auradou, H. Influence of wall roughness on the geometrical, mechanical and transport properties of single fractures. J. Phys. D Appl. Phys. 2009, 42, 1–10. [Google Scholar] [CrossRef] [Green Version]
- Yang, T.; Jia, P.; Shi, W.; Wang, P.; Liu, H.; Yu, Q. Seepage–stress coupled analysis on anisotropic characteristics of the fractured rock mass around roadway. Tunn. Undergr. Space Technol. 2014, 43, 11–19. [Google Scholar] [CrossRef]
- Baghbanan, A.; Jing, L. Hydraulic properties of fractured rock masses with correlated fracture length and aperture. Int. J. Rock Mech. Min. Sci. 2007, 44, 704–719. [Google Scholar] [CrossRef]
- Lomize, G.M. Flow in Fractured Rock; Gosemergoizdat: Moscow, Russia, 1951; pp. 127–129. (In Russian) [Google Scholar]
- Louis, C. A Study of Groundwater Flow in Jointed Rock and Its Influence on the Stability of Rock Masses (Rock Mech.Res.Rep.10); Imperial College: London, UK, 1969. [Google Scholar]
- Nelson, R.A. An experimental study of fracture permeability in porous rock. In Proceedings of the 17th U.S. Symposium on Rock Mechanics, Snow Bird, UT, USA, 25–27 August 1976; pp. 2A6–12A6-1. [Google Scholar]
- Bandis, S.C.; Lumsden, A.C.; Barton, N.R. Fundamentals of rock joint deformation. Int. J. Rock. Mech. Min. Sci. Geomech. Abstr. 1983, 20, 249–268. [Google Scholar] [CrossRef]
- Barton, N.; Bandis, S.; Bakhtar, K. Strength, deformation and conductivity coupling of rock joints. Int. J. Rock Mech. Min. Sci. Geomech. Abstr. 1985, 22, 121–140. [Google Scholar] [CrossRef]
- Zheng, J.; Ju, Y.; Liu, H.; Zheng, L.; Wang, M. Numerical prediction of the decline of the shale gas production rate with considering the geomechanical effects based on the soft-hard Hooke’s model. Fuel 2016, 185, 362–369. [Google Scholar] [CrossRef] [Green Version]
- Takahashi, M.; Park, H.; Takahashi, N. True triaxial tests-using permeability and extensional stress parameters to simulate geological history in rocks. Geosyst. Eng. 2013, 16, 75–82. [Google Scholar] [CrossRef]
- Samuelson, J.; Elsworth, D.; Marone, C. Shear-induced dilatancy of fluid-saturated faults: Experiment and theory. J. Geophys. Res. Solid Earth 2009, 114, B12. [Google Scholar] [CrossRef] [Green Version]
- Zoback, M.D.; Byerlee, J.S. The effect of microcrack dilatancy on the permeability of westerly granite. J. Geophys. Res. 1975, 80, 752–755. [Google Scholar] [CrossRef]
- Zou, L.; Tarasov, B.; Dyskin, A.V.; Adhikary, D.; Pasternak, E.; Xu, W. Physical modeling of stress-dependent permeability infractured rocks. Rock Mech. Rock Eng. 2013, 46, 67–81. [Google Scholar] [CrossRef]
- Khosravi, A.; Serej, A.D.; Mousavi, S.M.; Haeri, S.M. Effect of hydraulic hysteresis and degree of saturation of infill materials on the behavior of an infilled rock fracture. Int. J. Rock Mech. Min. Sci. 2016, 88, 105–114. [Google Scholar] [CrossRef]
- Wu, Y.; Liu, J.; Chen, Z.; Elsworth, D.; Pone, D. A dual poroelastic model for co2-enhanced coalbed methane recovery. Int. J. Coal Geol. 2011, 86, 177–189. [Google Scholar] [CrossRef]
- Wei, Z.; Zhang, D. Coupled fluid-flow and geomechanics for triple-porosity/ dual-permeability modeling of coalbed methane recovery. Int. J. Rock Mech. Min. Sci. 2010, 47, 1242–1253. [Google Scholar] [CrossRef]
- Ma, H.; Liu, Q. Prediction of the peak shear strength of sandstone and mudstone joints infilled with high water–cement ratio grouts. Rock Mech. Rock Eng. 2017, 50, 2021–2037. [Google Scholar] [CrossRef]
- Yang, Y.; Tang, X.; Zheng, H.; Liu, Q.; Liu, Z. Hydraulic fracturing modeling using the enriched numerical manifold method. Appl. Math. Model. 2018, 53, 462–486. [Google Scholar] [CrossRef]
- Zhang, B.; Li, S.; Zhang, D.; Li, M.; Shao, D. Uniaxial compression mechanical property test, fracture and damage analysis of similar material of jointed rock mass with filled cracks. Rock Soil Mech. 2012, 33, 1647–1652. (In Chinese) [Google Scholar]
- Shang, X.; Wang, J.; Zhang, Z.; Gao, F. A three-parameter permeability model for the cracking process of fractured rocks under temperature change and external loading. Int. J. Rock Mech. Min. Sci. 2019, 123, 104106. [Google Scholar] [CrossRef]
- Mirzaghorbanali, A.; Nemcik, J.; Aziz, N. Effects of Cyclic Loading on the Shear Behaviour of Infilled Rock Joints Under Constant Normal Stiffness Conditions. Rock Mech. Rock Eng. 2014, 47, 1373–1391. [Google Scholar] [CrossRef]
- Wang, H.; Xu, W.; Shao, J. Experimental Researches on Hydro-Mechanical Properties of Altered Rock Under Confining Pressures. Rock Mech. Rock Eng. 2014, 47, 485–493. [Google Scholar] [CrossRef]
- Indraratna, B.; Haque, A.; Aziz, N. Shear behaviour of idealized infilled joints under constant normal stiffness. Géotechnique 1999, 49, 331–355. [Google Scholar] [CrossRef]
- Cristescu, N. A procedure to determine non-associated constitutive Equations for geomaterials. Int. J. Plast. 1994, 10, 103–131. [Google Scholar] [CrossRef]
- Liu, J.; Gao, J.; Zhang, X.; Jia, G.; Wang, D. Experimental study of the seepage characteristics of loaded coal under true triaxial conditions. Rock Mech. Rock Eng. 2019, 52, 2815–2833. [Google Scholar] [CrossRef]
- Berryman, J.G. Estimates and rigorous bounds on pore-fluid enhanced shear modulus in poroelastic media with hard and soft anisotropy. Int. J. Damage Mech. 2006, 15, 133–167. [Google Scholar] [CrossRef]
- Freed, A.D. Natural strain. J. Eng. Mater. Technol. 1995, 117, 379–385. [Google Scholar] [CrossRef]
- Ju, Y.; Wang, J.; Wang, H.; Zheng, J.; Pathegama, G.; Gao, F. CO2 permeability of fractured coal subject to confining pressures and elevated temperature: Experiments and modeling. Sci. China Technol. Sci. 2016, 59, 1931–1942. [Google Scholar] [CrossRef]
- Chen, D.; Pan, Z.; Shi, J.; Si, G.; Ye, Z.; Zhang, J. A novel approach for modelling coal permeability during transition from elastic to post-failure state using a modified logistic growth function. Int. J. Coal Geol. 2016, 163, 132–139. [Google Scholar] [CrossRef]
- Liu, X.; Liu, A.; Li, X. Experimental study of permeability of rock-like materials with filling fractures under high confining pressure. Chin. J. Rock Mech. Eng. 2012, 31, 1390–1398. [Google Scholar]
- Zhao, K.; Wang, H.; Xu, W.; Xia, J. Experimental study on seepage characteristics of rock-like materials with consecutive and filling fractures. Chin. J. Geotech. Eng. 2017, 39, 1130–1136. [Google Scholar]
- Lu, W.; Zhu, Z.; Que, X.; Zhang, C.; He, Y. Anisotropic constitutive model of intermittent columnar jointed rock masses based on the cosserat theory. Symmetry 2020, 12, 823. [Google Scholar] [CrossRef]
- Shang, X. Flow Mechanism and Productivity Model for Heat-Gas-Fluid-Solid Interactions on Permeability Enhancement in Heterogeneous Shale Volume Fracturing. Ph.D. Thesis, China University of Mining and Technology, Xuzhou, China, 2018. [Google Scholar]
- Niu, Z.; Zhu, Z.; Que, X. Constitutive Model of Stress-Dependent Seepage in Columnar Jointed Rock Mass. Symmetry 2020, 12, 160. [Google Scholar] [CrossRef] [Green Version]
- Que, X.; Zhu, Z.; Lu, W. Anisotropic constitutive model of pentagonal prism columnar jointed rock mass. Bull Eng. Geol. Environ. 2020, 79, 269–286. [Google Scholar] [CrossRef]
- Wang, F. Study on the Distribution of Dynamic and Static Stress Strain in Rock Impacted by Abrasive Slurry Jet. Ph.D. Thesis, China University of Mining and Technology, Xuzhou, China, 2018. [Google Scholar]
- Limido, J.; Espinosa, C.; Salaün, M.; Lacome, J.L. SPH method applied to high speed cutting modeling. Int. J. Mech. Sci. 2007, 49, 898–908. [Google Scholar] [CrossRef] [Green Version]
Figure 1.
Typical fractured rock mass: (a) columnar jointed rock mass; (b) schematic diagram of fractured rock.
Figure 1.
Typical fractured rock mass: (a) columnar jointed rock mass; (b) schematic diagram of fractured rock.

Figure 2.
Change curve of the permeability coefficient during the full stress–seepage of the fractured rocks.
Figure 2.
Change curve of the permeability coefficient during the full stress–seepage of the fractured rocks.

Figure 3.
Generalized model of fractured rocks.

Figure 4.
True triaxial seepage test system.

Figure 5.
Treatment method of the specimens for unidirectional fissure seepage.

Figure 6.
Rock-like specimens and flow curve: (a) fracture aperture of the specimens; (b) curve of the seepage discharge of the specimens.
Figure 6.
Rock-like specimens and flow curve: (a) fracture aperture of the specimens; (b) curve of the seepage discharge of the specimens.

Figure 7.
Model fitting to the permeability of the filling fracture specimens: (a) fracture aperture of 5 mm; (b) fracture aperture of 7.5 mm; (c) fracture aperture of 10 mm; (d) fracture aperture of 12.5 mm.
Figure 7.
Model fitting to the permeability of the filling fracture specimens: (a) fracture aperture of 5 mm; (b) fracture aperture of 7.5 mm; (c) fracture aperture of 10 mm; (d) fracture aperture of 12.5 mm.

Figure 8.
Schematic diagram of the Hertz contact of filling particles.

Figure 9.
Cement mortar filling board inside the sample: (a) plate thickness of 5 mm; (b) plate thickness of 10 mm.
Figure 9.
Cement mortar filling board inside the sample: (a) plate thickness of 5 mm; (b) plate thickness of 10 mm.

Figure 10.
Effect of the maximum principal stress loading failure process on the permeability changes in the specimens with infilled fractures: (a) fracture aperture of 5 mm; (b) fracture aperture of 7.5 mm; (c) fracture aperture of 10 mm; (d) fracture aperture of 12.5 mm.
Figure 10.
Effect of the maximum principal stress loading failure process on the permeability changes in the specimens with infilled fractures: (a) fracture aperture of 5 mm; (b) fracture aperture of 7.5 mm; (c) fracture aperture of 10 mm; (d) fracture aperture of 12.5 mm.


Table 1.
Parameter values of the permeability model.
| Specimen Type | σ2 = σ3 (MPa) | K0 (10−7cm/s) | Fracture | Rock | n | P (MPa) | Δσm | ||
|---|---|---|---|---|---|---|---|---|---|
| KJ(MPa) | γJ | KR(MPa) | γR | (MPa) | |||||
| n-1 | 2.0 | 1.635 | 130.0 | 0.048 | 360.0 | 0.952 | 3.0 | 1.5 | 0.833 |
| 5.0 | 1.873 | ||||||||
| n-2 | 2.0 | 2.865 | 130.0 | 0.070 | 360.0 | 0.930 | 3.0 | 1.5 | 0.833 |
| 5.0 | 2.457 | ||||||||
| n-3 | 2.0 | 3.708 | 130.0 | 0.091 | 360.0 | 0.909 | 3.0 | 1.5 | 0.833 |
| 5.0 | 2.987 | ||||||||
| n-4 | 2.0 | 5.652 | 130.0 | 0.111 | 360.0 | 0.889 | 3.0 | 1.5 | 0.833 |
| 5.0 | 5.210 | ||||||||
© 2020 by the authors. Licensee MDPI, Basel, Switzerland. This article is an open access article distributed under the terms and conditions of the Creative Commons Attribution (CC BY) license (http://creativecommons.org/licenses/by/4.0/).
Share and Cite
MDPI and ACS Style
Zhu, Z.; Niu, Z.; Que, X.; Liu, C.; He, Y.; Xie, X. Study on Permeability Characteristics of Rocks with Filling Fractures Under Coupled Stress and Seepage Fields. Water 2020, 12, 2782. https://doi.org/10.3390/w12102782
AMA Style
Zhu Z, Niu Z, Que X, Liu C, He Y, Xie X. Study on Permeability Characteristics of Rocks with Filling Fractures Under Coupled Stress and Seepage Fields. Water. 2020; 12(10):2782. https://doi.org/10.3390/w12102782
Chicago/Turabian StyleZhu, Zhende, Zihao Niu, Xiangcheng Que, Cheng Liu, Yanxin He, and Xinghua Xie. 2020. "Study on Permeability Characteristics of Rocks with Filling Fractures Under Coupled Stress and Seepage Fields" Water 12, no. 10: 2782. https://doi.org/10.3390/w12102782
Note that from the first issue of 2016, this journal uses article numbers instead of page numbers. See further details here.