Assessing Community Resilience to Urban Flooding in Multiple Types of the Transient Population in China


1
Evergrande School of Management, Wuhan University of Science and Technology, Wuhan 430065, China
2
Faculty of Computing, Engineering and the Built Environment, Birmingham City University, Birmingham B4 7BD, UK
*
Author to whom correspondence should be addressed.
Water 2020, 12(10), 2784; https://doi.org/10.3390/w12102784
Submission received: 31 August 2020
/
Revised: 2 October 2020
/
Accepted: 2 October 2020
/
Published: 6 October 2020
(This article belongs to the Special Issue Flood Risk Management and Resilience)
Abstract
:While various measures of mitigation and adaptation to climate change have been taken in recent years, many have gradually reached a consensus that building community resilience is of great significance when responding to climate change, especially urban flooding. There has been a dearth of research on community resilience to urban floods, especially among transient communities, and therefore there is a need to conduct further empirical studies to improve our understanding, and to identify appropriate interventions. Thus, this work combines two existing resilience assessment frameworks to address these issues in three different types of transient community, namely an urban village, commercial housing, and apartments, all located in Wuhan, China. An analytic hierarchy process–back propagation neural network (AHP-BP) model was developed to estimate the community resilience within these three transient communities. The effects of changes in the prioritization of key resilience indicators under different environmental, economic, and social factors was analyzed across the three communities. The results demonstrate that the ranking of the indicators reflects the connection between disaster resilience and the evaluation units of diverse transient communities. These aspects show the differences in the disaster resilience of different types of transient communities. The proposed method can help decision makers in identifying the areas that are lagging behind, and those that need to be prioritized when allocating limited and/or stretched resources.
1. Introduction
In recent years, the frequency and magnitude of climate damage related events, such as rainstorms, floods, and typhoons have increased in China, threatening the sustainable development of cities, and hindering economic and social development [1,2,3]. As the present trends of population growth and urbanization continue, it can be expected that more people will be exposed and that assets will be more concentrated in risk-prone areas. The collapse of transportation systems, and fatalities due to urban floods have occurred in resource-poor communities, primarily due to their greater vulnerability and poor disaster risk management systems. Transient population is a specific demographic phenomenon in China, and its definition is often based on household registration, and interpreted with time and space as elements. Therefore, in this study, we define the transient population as those who have left their registered district and county to live and work for more than one month in other districts and counties. The transient population community is socially and politically complex and characterized as being vulnerable to sudden disturbances and community conflicts, as well as to extreme weather events like rainstorms and floods [4]. The aftermath of recent urban floods has highlighted the need for a community to be prepared for, and be able to recover rapidly from, a sudden potentially disastrous event. This means that there is an ever-increasing need for special attention to be paid to the adaptation of this transient population to urban systems.
These adversities, caused by rapid urbanization and natural hazards, have promoted the need for further research into sustainable development and resilience [5]. The concepts of adaptation and resilience have become prominent in the urban risk reduction process [6,7]. The concept was first applied to the study of natural ecosystems by Holling [8], as “the persistence of relationships within a system and the ability of these systems to absorb, change and learn the variables, and still persist”. Resilience is a supplement to and sublimation of the concept of sustainable development [9], and concerns the welfare of human society in all spheres. In the field of social-ecological systems, planning, adaptation, and transformation actions are considered critical factors in the formation of resilient systems. Thus, the key to improving the resilience of social-ecological systems is to seek various approaches to maintain resilience, adapt or transform systems to reduce disaster risk, adapt to climate changes, and introduce new strategies to develop more sustainably and efficiently [10]. From this perspective resilience is generally considered the capacity to tolerate, absorb, cope with, and adjust to changing social or environmental conditions, while retaining key elements of structure, function, and identity [11,12].
Though there is no consensus today on a precise definition of resilience [13,14], and divergent views on its scope [15,16,17] and measurement, the scientific community agrees that resilience includes four aspects: prevention, preparation, response, and recovery. Resilience has also been applied to various fields, including physics, engineering, economics, psychology, sociology, anthropology, public health, geography, and disaster management [18,19]; and at different units of analysis, namely, individual, household, community, and regional levels [20]. The concept of resilience is useful in seeking to understand communities and the risks to which they are exposed in a holistic manner. In response to concerns about the consequences of the increased frequency and severity of disaster events, the notions of community resilience and resilient planning have gained increasing attention and interest over recent years in the fields of disaster and emergency management. International academic and policy circles have also acknowledged the necessity of strengthening communities’ resilience [21,22,23,24,25,26,27]. The resilience paradigm has been adopted by many major international development organizations since the Hyogo Framework for Action (HFA) in 2005. Remarkable among these was the Rockefeller Foundation’s Building Climate Change Resilience Initiative in 2007, which aimed to enhance vulnerable communities’ resilience to the effects of climate change. This paper discusses an initiative to assess community resilience in the specific context of the urban transient population.
As the concept of resilience has continued to be applied in several research fields, there has also been increased attention on the importance of developing methods and frameworks for its measurement [28]. Measuring community resilience to external pressures is a complex systematic problem that requires the examination of various components and their relationships within the community. Several scholars have constructed frameworks and indicator systems to measure community resilience from different perspectives, including the community disaster resilience framework (CDRF), the benchmark measurement indicator of community resilience (BRIC), the climate disaster resilience index (CDRI), and the community resilience framework to disaster (CRDSA), and so on [29]. Bruneau et al. [19] stated that community resilience exhibited four characteristics: robustness, redundancy, resourcefulness, and rapidity. Subsequently, they proposed the four dimensions of community resilience: technology, organization, society, and economy. Cutter, et al. [30] provided a place-based disaster resilience of place model (DROP), within coupled human-environment systems, that assessed disaster resilience at the local or community level, and which has been applied in many community resilience studies [31]. Furthermore, In 2010, Cutter et al. proposed the BRIC model based on the DROP, which provided a series of secondary indicators to evaluate community resilience [32,33]. The BRIC model has more extensive coverage of community resilience dimensions than others [34], and it is one of the most widely applied frameworks within the existing literature for quantifying community disaster resilience through index creation [35,36]. The operationalized version of the BRIC model was the first attempt to pass from a theoretical framework to an operationalized practice [23]. When it comes to vulnerability or resilience assessment, geographic information systems (GIS) have become powerful tools for identifying vulnerable communities and locations, at different scales [37,38,39]. There are also many studies that have conceived different GIS methods to predict, evaluate, and analyze the vulnerability and resilience of social environmental systems [40,41,42,43,44]. GIS can help governments, environmental agencies, and insurance companies to improve prevention, early warning mechanisms, and mitigation efforts using predictive analytics.
The resilience, adaptation, and transformation assessment and learning framework (RATALF) was developed in 2015 by the Commonwealth Scientific and Industrial Research Organization (CSIRO) in partnership with the Scientific and Technical Advisory Panel of the Global Environmental Facility (STAP/GEF) [45]. The framework leads users through a process of system description, assessing the system, and adaptive governance and management. The RATALF offered a structured approach to understanding and assessing resilience, and adaptive learning, so as to inform initiatives to build resilience of those social-ecological systems that contribute to agreed sustainability goals. The evaluation process of the RATALF evaluation system is resilient and repeatable [46], that is, the RATALF is not a conclusive resilience evaluation system, but a process to discuss resilience evaluation. Moreover, in the practical application of theory, some countries and research institutions have issued a series of complete evaluation systems and work manuals [45,47,48].
Although the term resilience has become a new paradigm of disaster management in places including Europe, Australia, and the US, the approach in China is still in the preliminary stage [49], and mainly focuses on the analysis of the concept of community resilience, the development of theoretical frameworks, and evaluation of index systems of resilience [50]. Despite the great achievements that have been attained in urban disaster reduction, the current models do not incorporate the concept of resilient communities into practical actions. As such, progress towards the measurement and implementation of strategies to achieve community resilience has been slow, and the absence of a systematic framework or understanding of the concept, even at the most basic level [20] has hampered progress.
The continuous growth of the transient population in China will accelerate the process of urbanization, and at the same time, increase the vulnerability of the population and assets exposed to disasters. The assessment of community resilience of the transient population, and identification of priorities for resilience indicators, would provide a useful scientific basis for urban disaster risk mitigation. The weight distribution of indicators is a critical segment in the process of decision-making and evaluation [51]. In this paper, the analytic hierarchy process (AHP) [52,53] method and the artificial neural network (ANN) [54,55,56,57] are combined to enhance the accuracy of assessing community resilience, whilst also giving consideration to the characteristics of different properties and reducing subjectivity. Therefore, this study represents one of the first attempts to develop an index-based measurement, based on the resilience adaptation transformation assessment (RATA) theory, and use of a hybrid AHP-BP method for the comparative assessment of flood resilience for the transient population in Wuhan. Operationalizing the community resilience of this transient population is particularly important for Chinese cities in light of the fact that these community groups are vulnerable to floods because of the community’s antecedent conditions (inherent vulnerability), and defects of the community management system.
2. Description of the Study Area
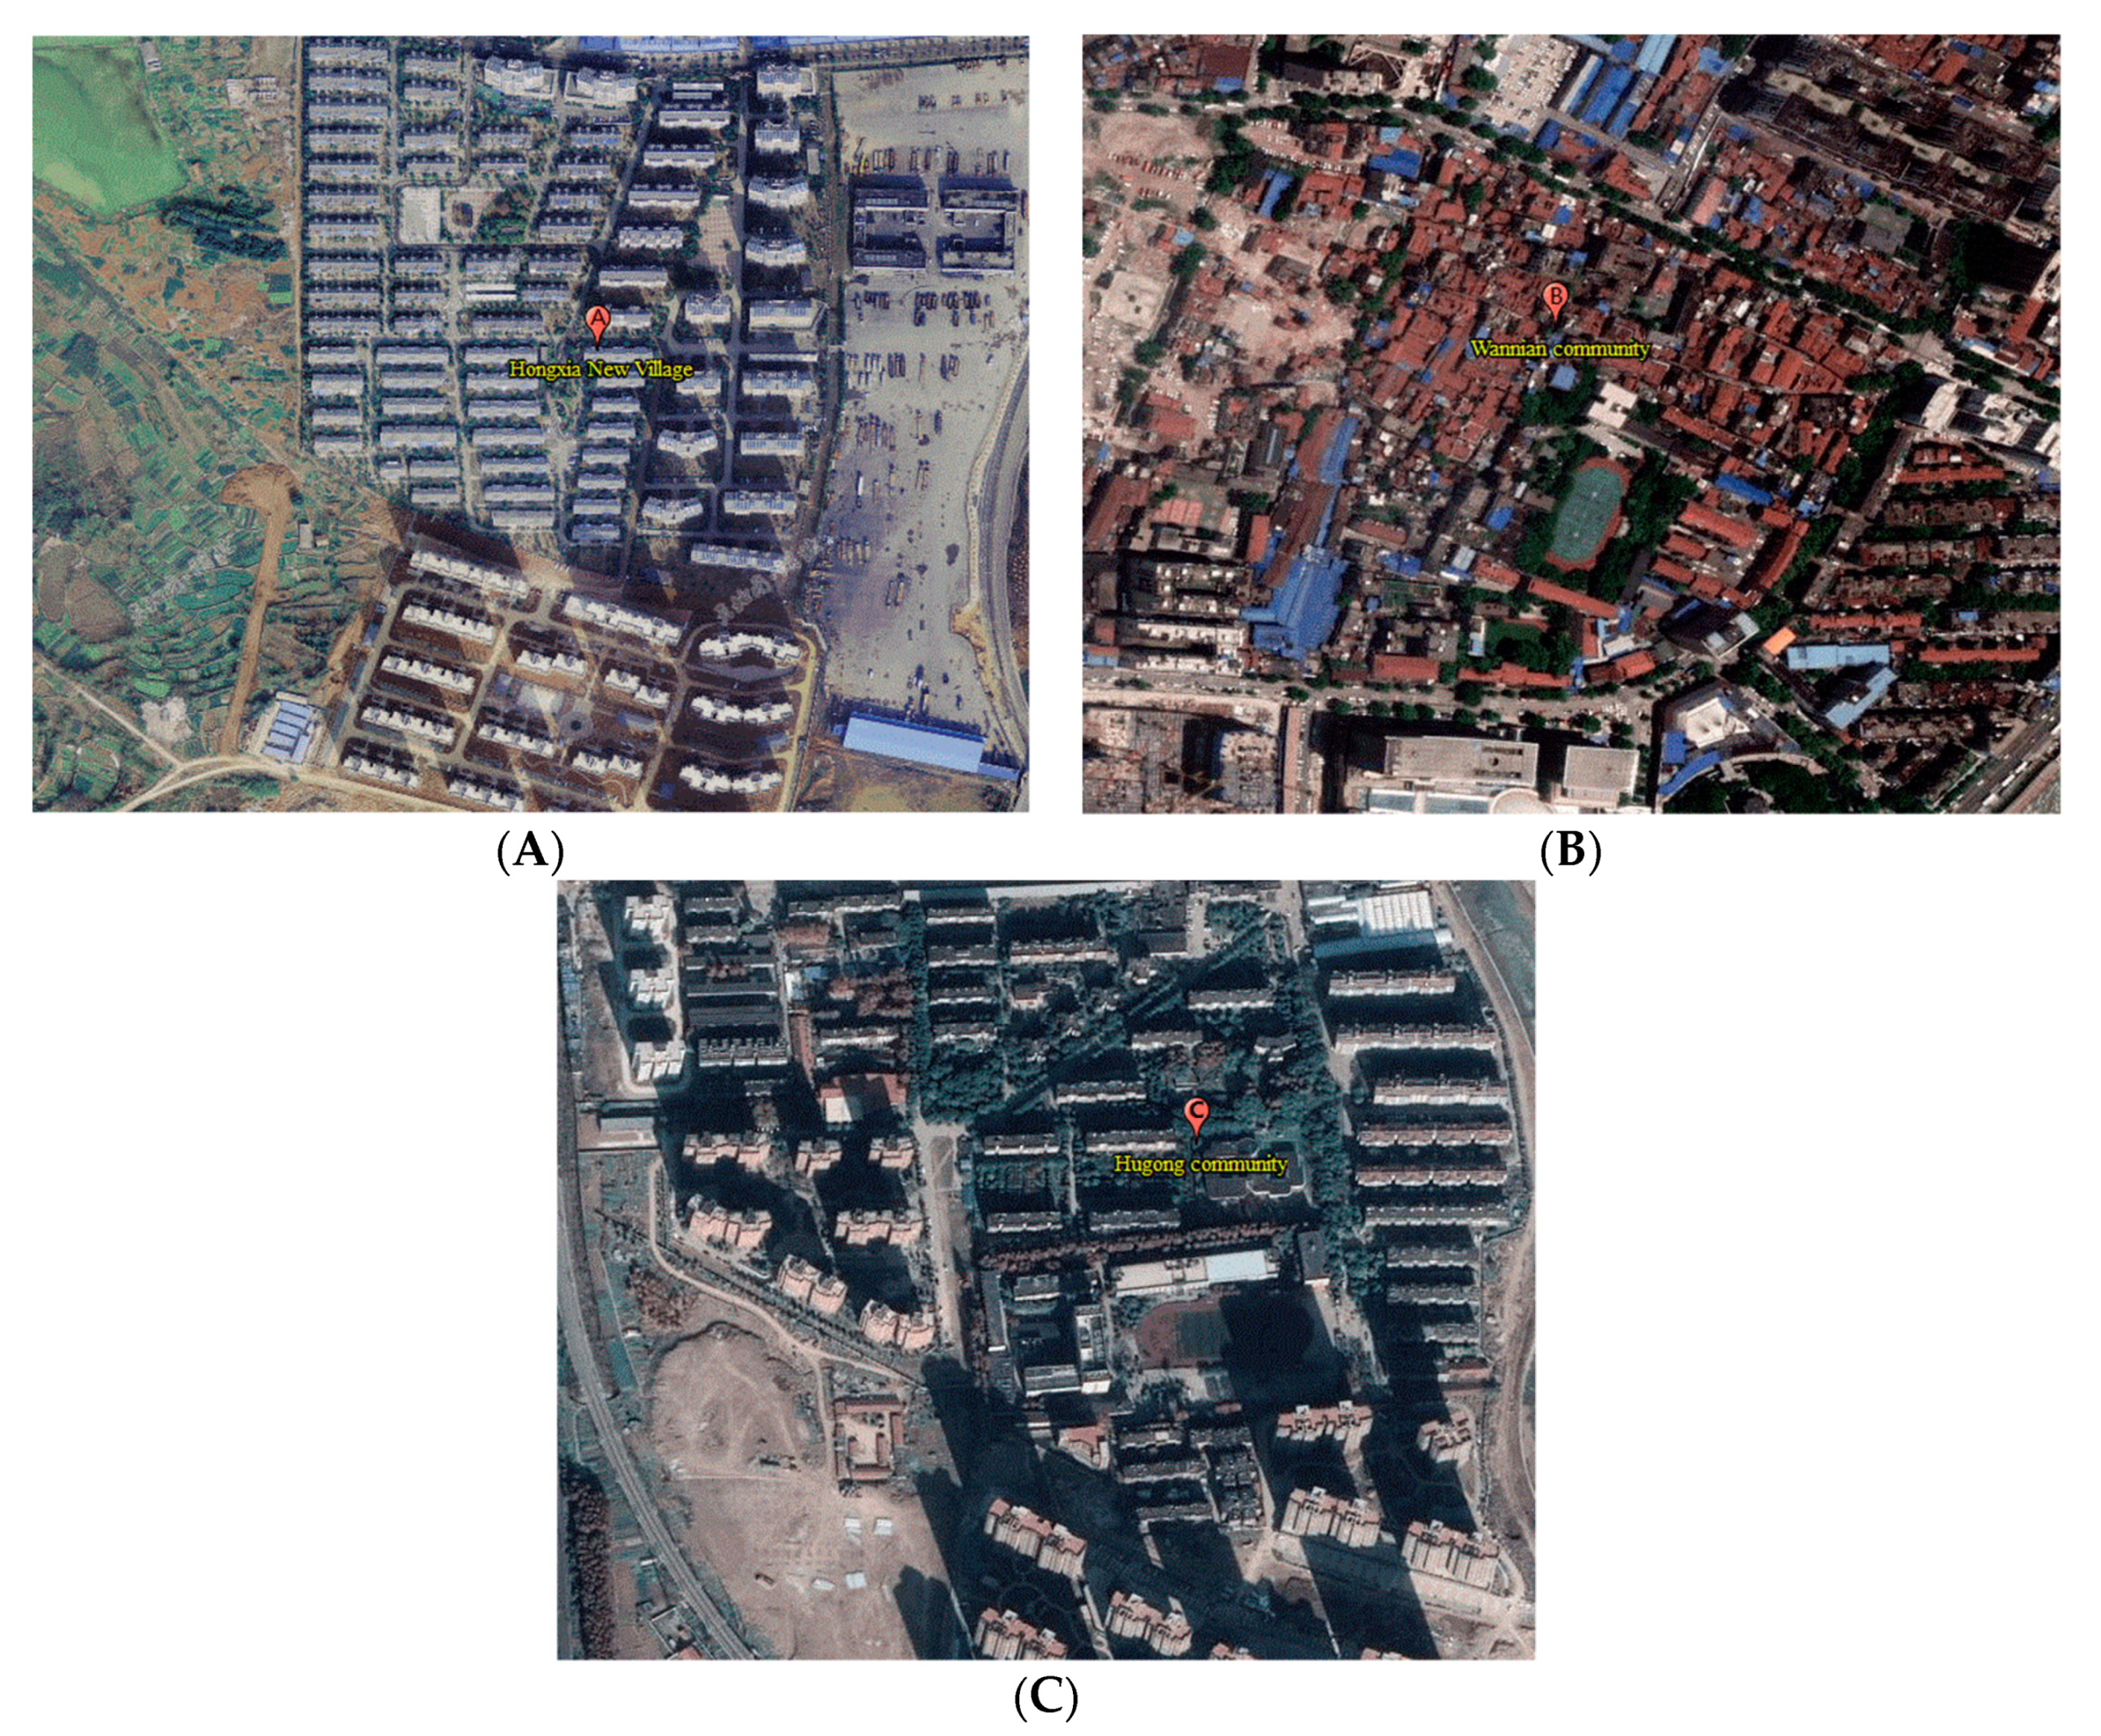
This study focuses on communities within the transient population distribution area in Wuhan, Hubei Province, China, which lies at the junction of the Yangtze River and the Han River (Figure 1). The features of its geographical location and climate makes Wuhan a serious flood hazard area. According to historical records, severe floods occurred in 1931, 1954, 1998, and 1999. In addition, from 30 June 2016 to 6 July 2016, the accumulative rainfall in Wuhan reached 582.3 mm. Up to 30 July 2016, flooding affected 13,274,200 people in the surrounding cities and counties. The flooding also caused about 30,000 houses to collapse, 1,317,300 hectares of crop damage, and the direct economic losses reached 3.168 billion Yuan. As a large and vulnerable group, the transient population community has become a frequent area of urban disasters, because of its disordered living space, high population density, and the lack of unified and effective management [4]. Three communities, namely, Hongxia community, Wannian community, and Hugong community, were selected as study areas in this work, in terms of the transient population community category (Figure 1).
Hongxia community is a new type of community established after the comprehensive transformation of the “village in the city” in Wuhan, and the renovation and improvement of housing and related supporting facilities. However, due to its remote location, economic development and infrastructure facilities still lag behind in this urban district.
The Wannian community is a commercial and residential community that is located in the old town of Jianghan District, where the infrastructure is relatively sound but buildings are poor quality, with a disorderly architectural layout and poor sanitation conditions. Due to the superior geographical location and the surrounding commercial development, most migrants in Wannian choose to rent in the old community in the city center, for the convenience of work and education.
Hugong community residents almost completely rely on employers to allocate housing. Although the building layout in this community is orderly, the road system is poor, with deficient infrastructure facilities, and the number of surrounding businesses is relatively small. Owing to work needs and low rents, many transient population choose to live in apartments.
According to relevant statistics from the Wuhan Municipal Bureau of Statistics and the Information Center of the Planning Institute [58], from the perspective of socio-demographic attributes, 78% of the transient population have a per capita monthly income of less than 3500 yuan, which is lower than the average monthly salary of the national population. From the perspective of social spatial distribution, the density of the transient population in Wuhan is distributed in a circle pattern, of high outside and low inside. The communities with higher density are mostly distributed in the old city, and the per capita living area is mostly 20–35 square meters. Generally speaking, due to the impact of low incomes, housing prices, and other factors, the transient population usually rents in areas with convenient transportation, convenient living, and low rents, which are mostly villages and old towns [59]. Therefore, these communities live in mostly poor environmental conditions, with restricted internal space, inadequate public services, and facilities. Living in such a harsh environment, with insufficient public services and facilities, the transient population are more vulnerable than other community groups in terms of economic, social, and physical wellbeing.
3. Methodology
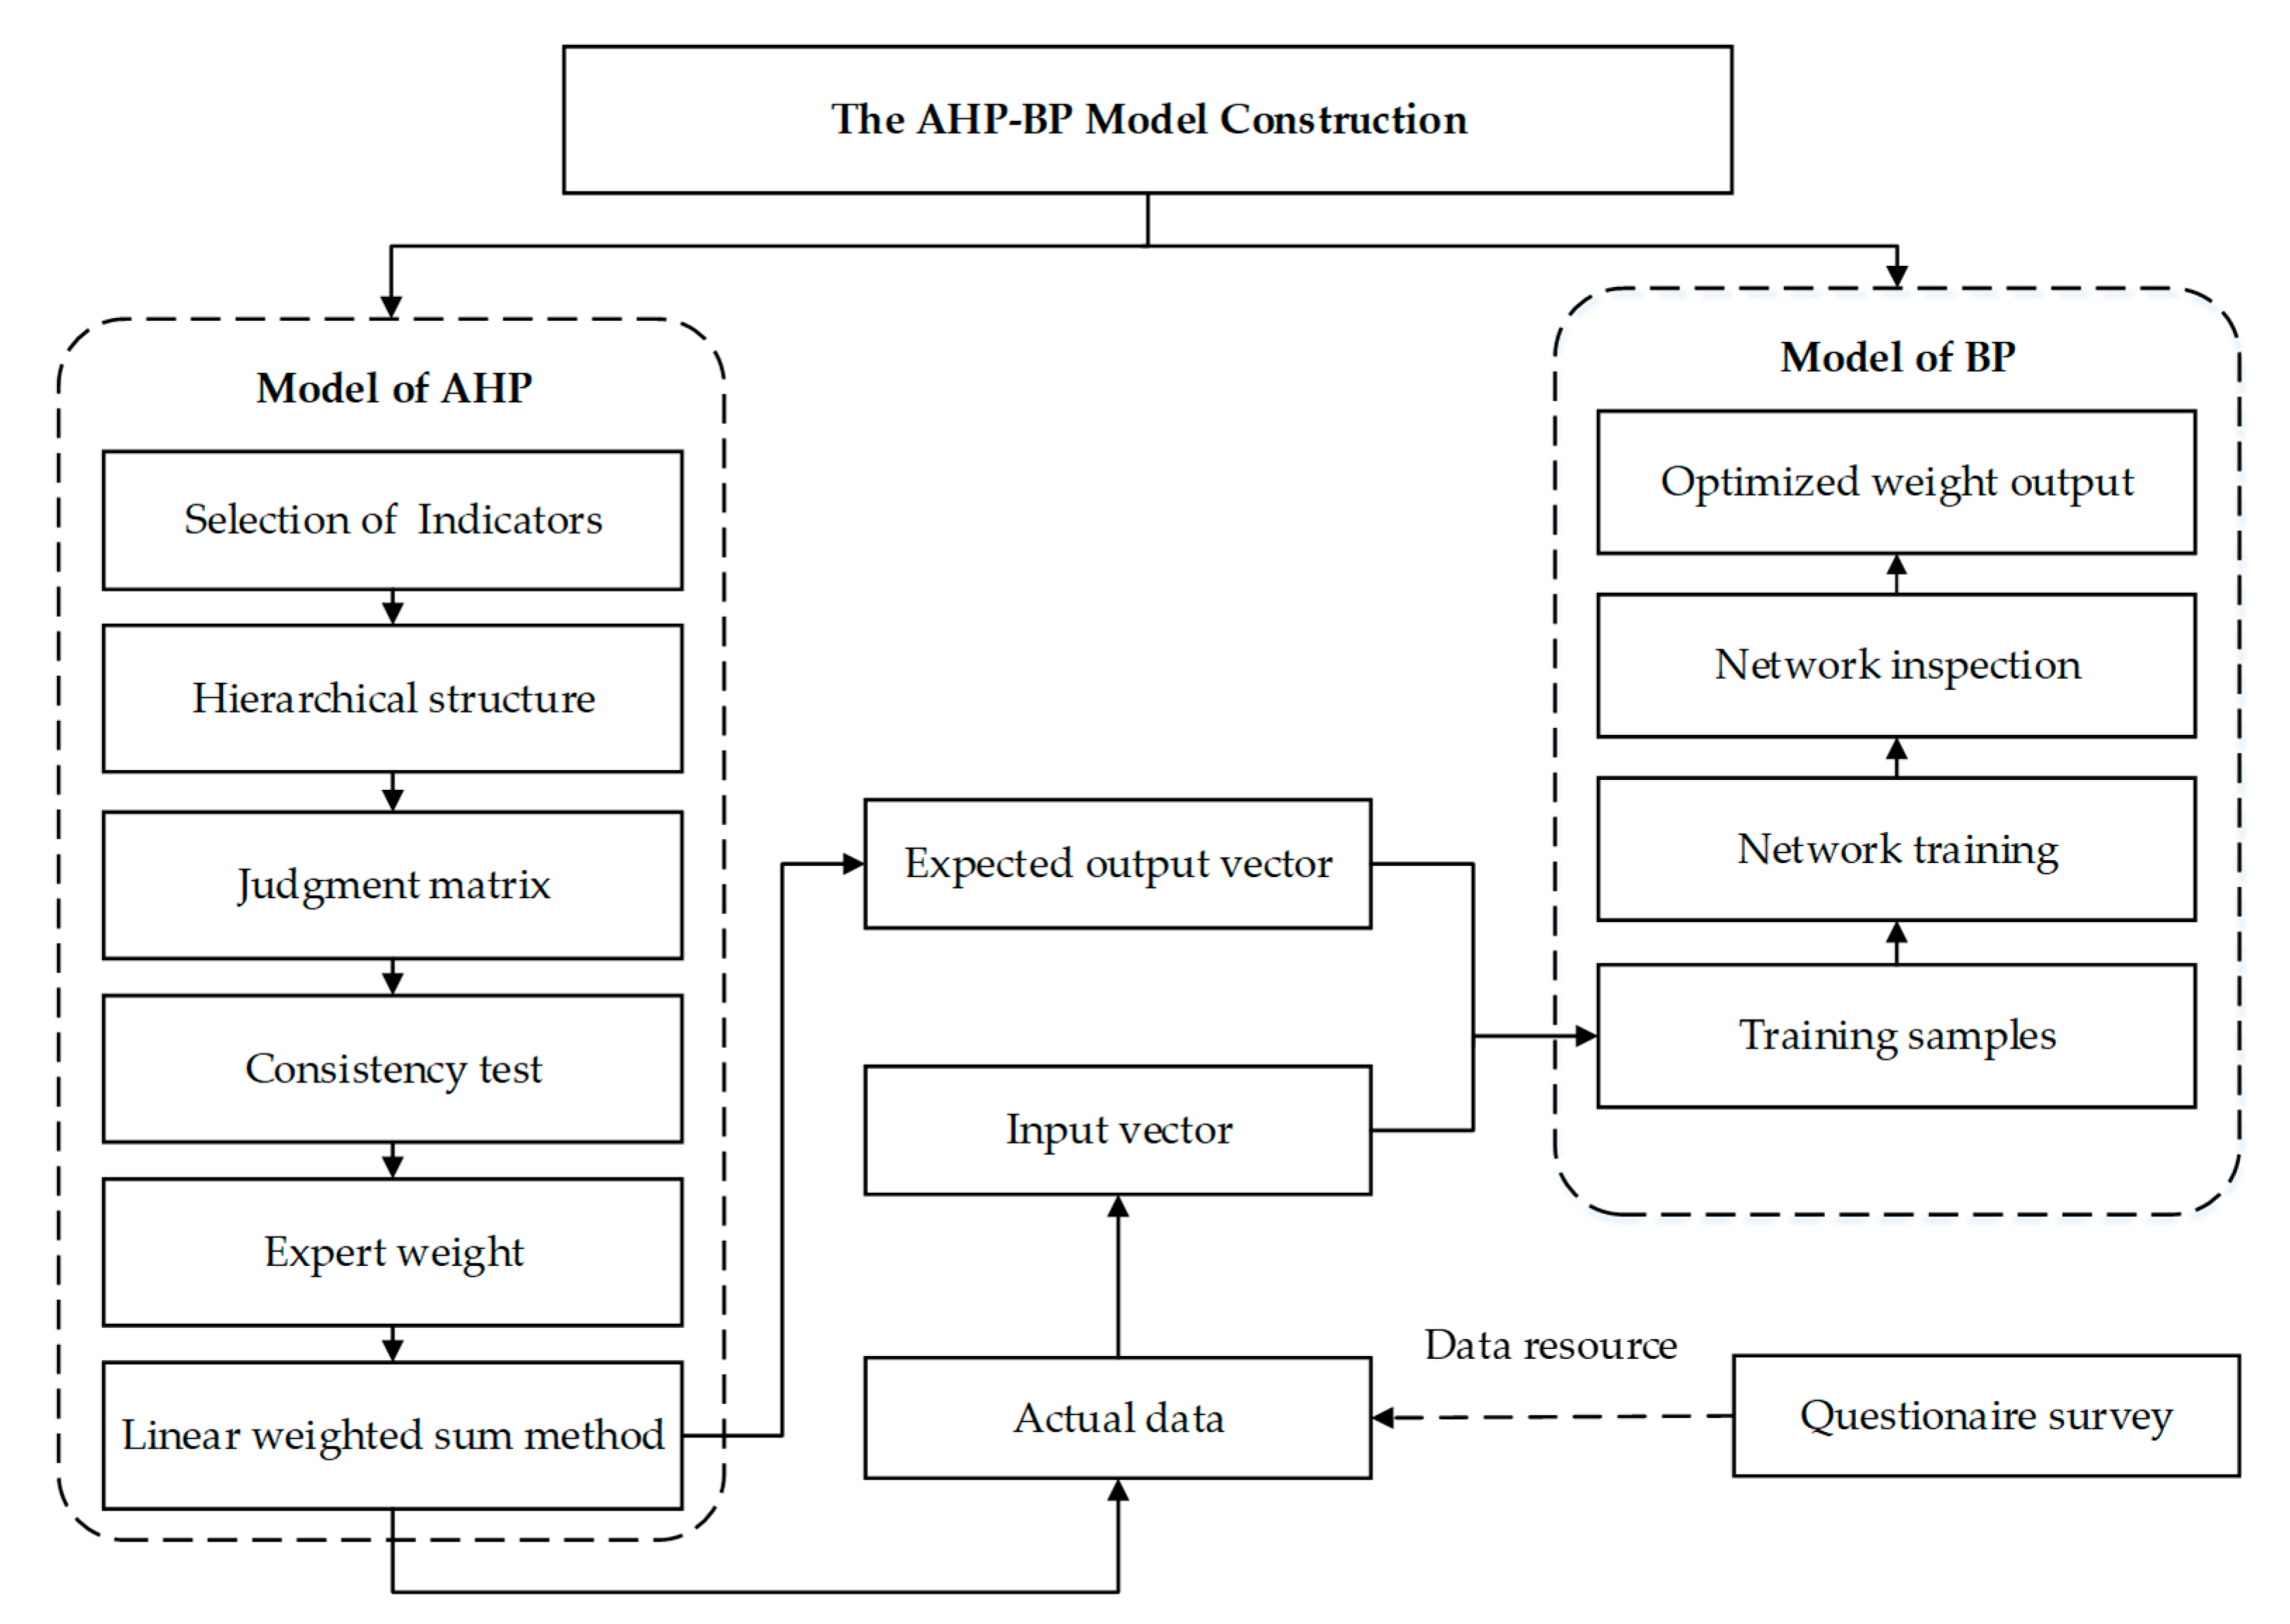
Figure 2 shows the approach used for establishing the AHP–BP model framework. The methodology consists of four components: (1) selecting relevant indicators; (2) establishing indicator hierarchy model, and applying AHP method to determine the initial weights of each indicator; (3) calculating the linear weight values between the actual data collected in the questionnaire survey and the initial weight value, which were taken as the expected output of the BP neural network to establish the AHP–BP combination model, in order to estimate the three transient population communities’ resilience; and finally (4) distinguishing the difference of the three communities’ resilience reasonably and effectively, according to the optimized indicator weights of the AHP–BP model.
3.1. Data Collection
Based on the research theme of the disaster resilience of the transient population and urban communities, a questionnaire survey was designed to cover four aspects: community space construction, economic development, community management system, and community social capital. Questionnaires were used to collect data from the transient population in the three types of community: urban village (Hongxia), commercial housing (Hugong), and apartment (Wannian). The questionnaire adopted a five-point variable Likert scale to gauge the respondents views. Ultimately, 265 valid questionnaires, which included 85, 92, and 88 valid questionnaires in the Hongxia, Hugong, and Wannian communities were effectively recovered, respectively. A reliability test was carried out on the basis of the questionnaire results. Cronbach’s alpha was 0.88, indicating that the survey results have scientific credibility.
3.2. Indicator Selection
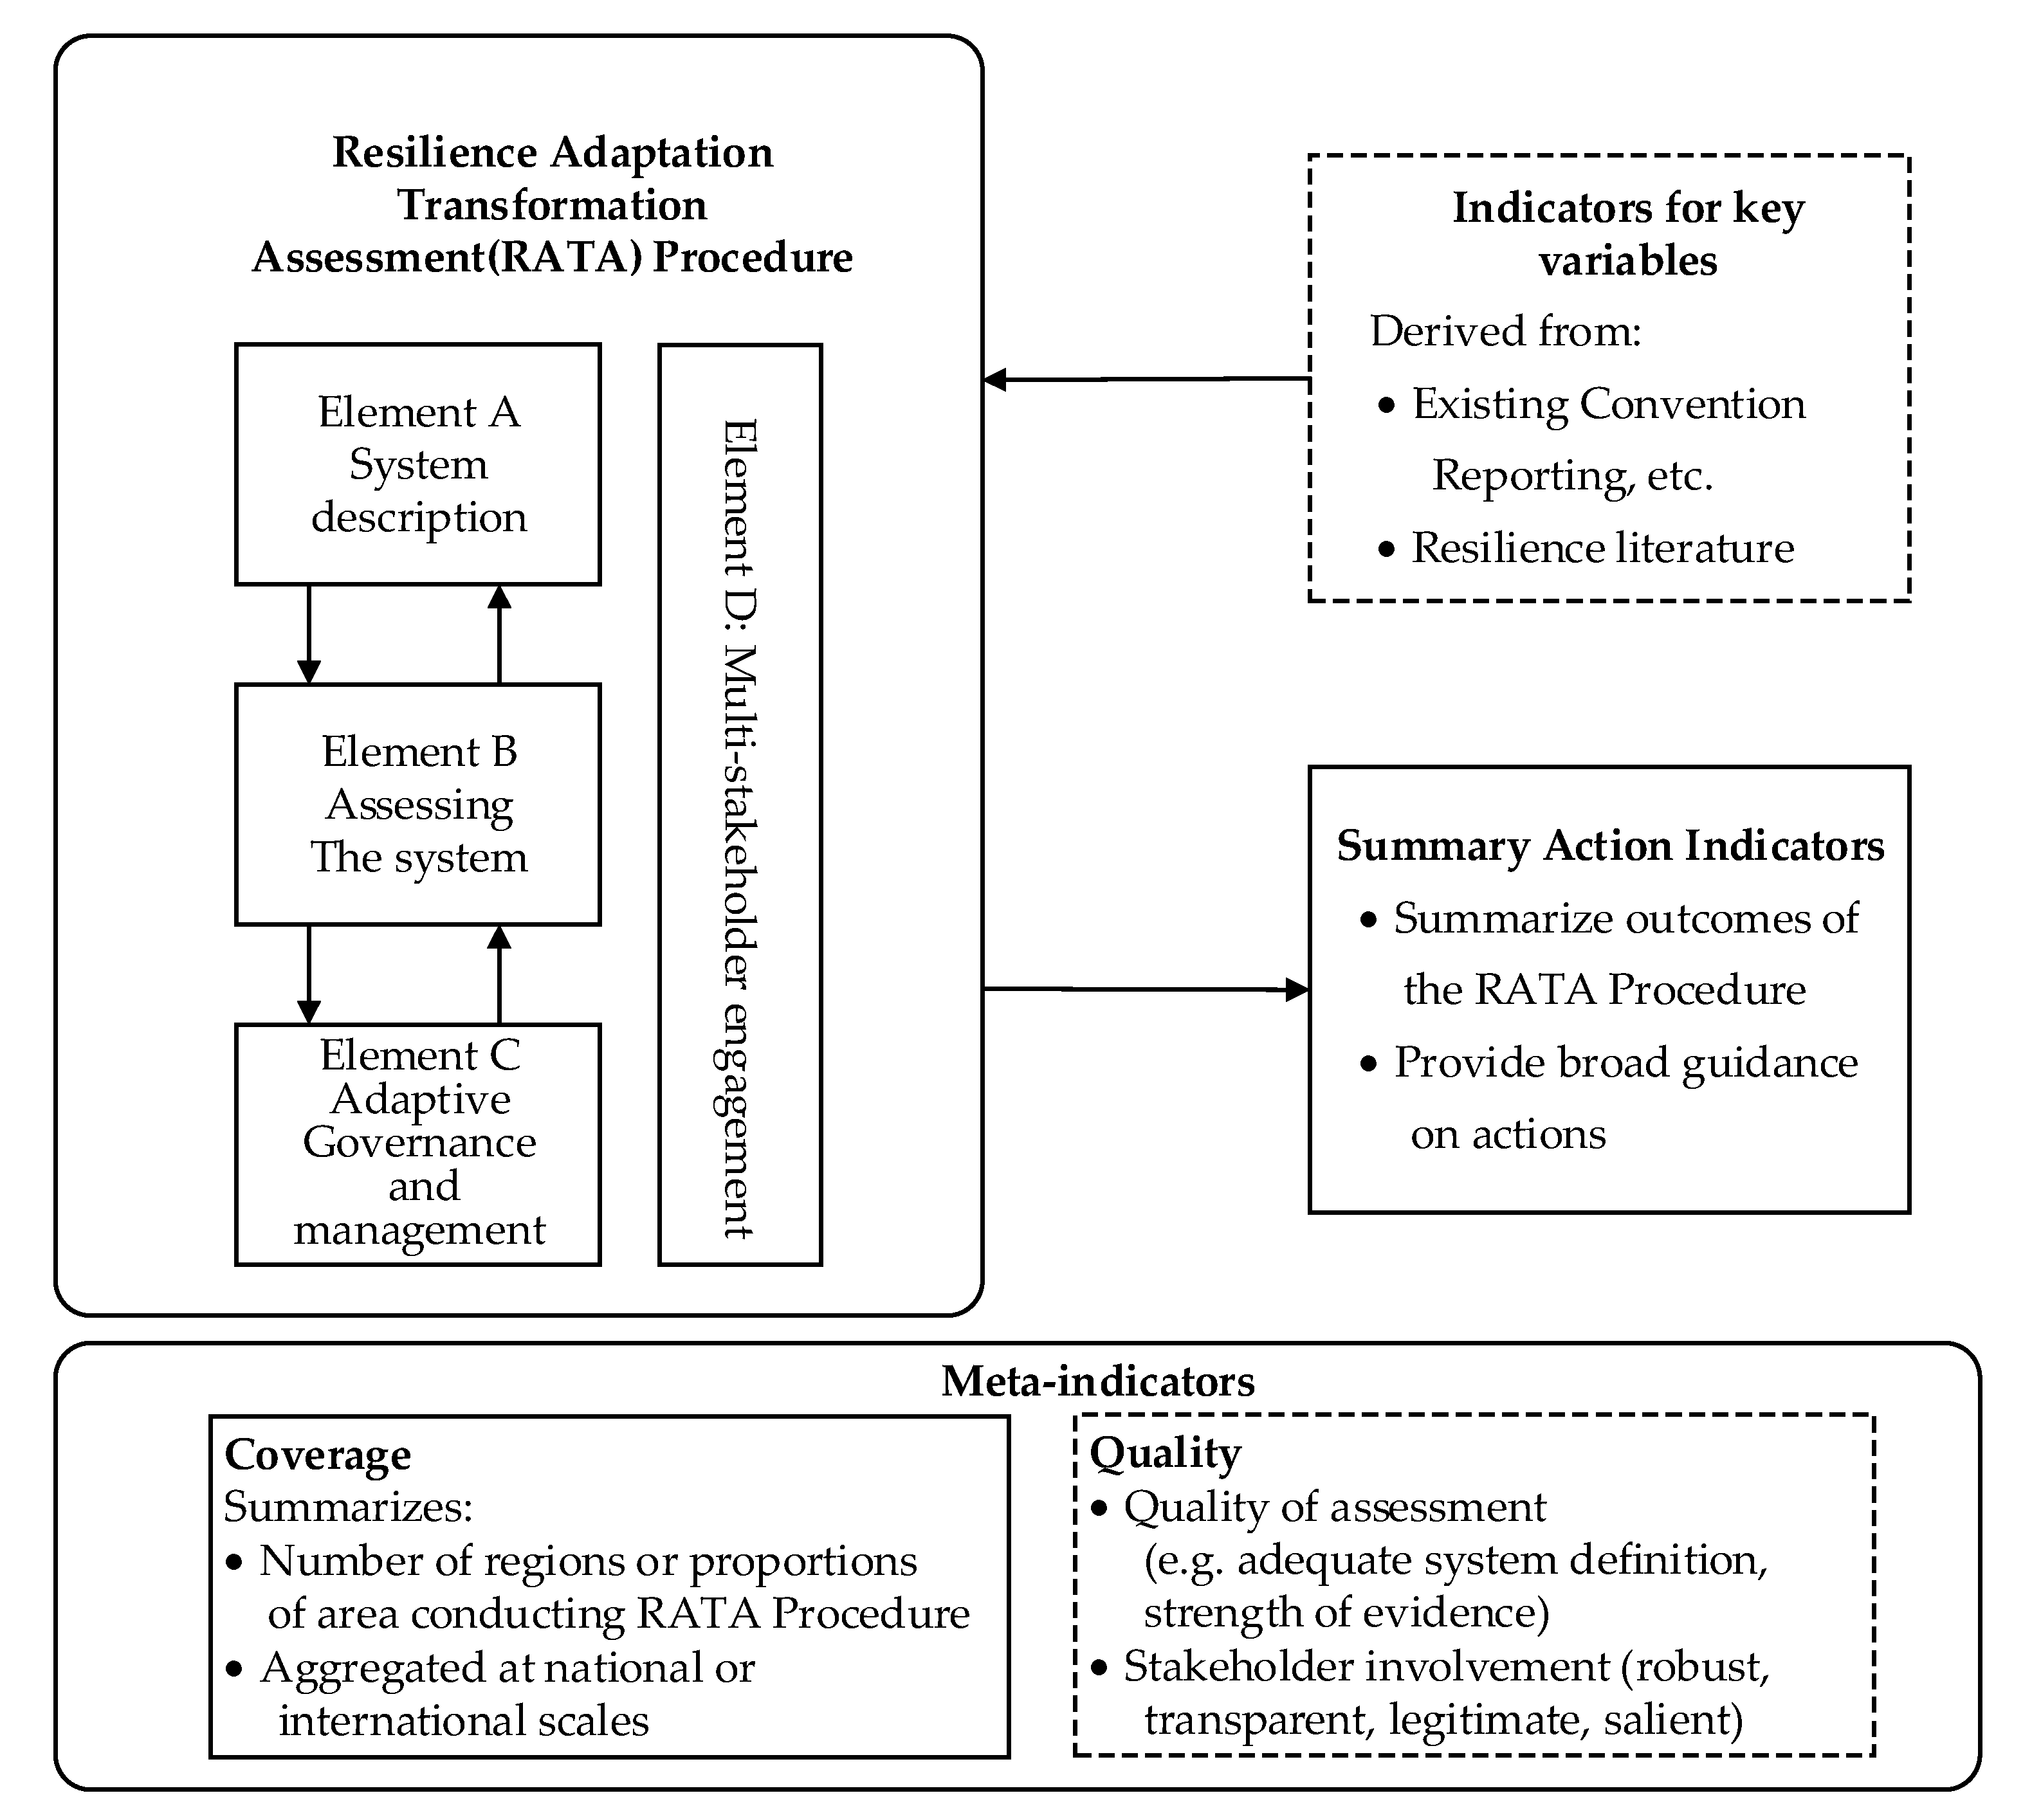
The indicators were selected on the basis of the RATA framework [45], and the concrete indicators were filtered based on the BRIC framework [32]. The RATA procedure, which is a step-by-step iterative method for assessment, refers to the core of the RATA framework (Figure 3). It is conducted at focal (sub-national) scale, ideally with multi-stakeholder engagement [20]. The application of RATA was in order to fully consider the disaster resilience of the community, including material and spatial factors, social composition, social management, and community capital, so as to pay more attention to the disaster prevention ability of the community. Cutter et al. proposed constructing a resilience evaluation index system from six aspects including economic resilience, social resilience, environmental resilience, community resilience, infrastructure resilience, and organizational resilience. This model focuses on the ability of the social system, ecological environment, and buildings to cope with disaster impacts. In general, the BRIC framework considers the concept of community resilience as pre-event inherent resilience (robustness) and post-event adaptive (transformation) resilience [33], and includes the extensive coverage of community resilience dimensions compared with the other dimensions. The application of RATA was to ensure full consideration of the disaster resilience of the community, including material and spatial factors, social composition, and social management; and includes the extensive coverage of community resilience dimensions compared with the other dimensions.
Although standards for assuring the variables are widespread within the existing indicator literature, no unified indicators or frameworks for quantifying community resilience are available to date. The framework proposed in this study is based on the theory of RATA, and the selected supplementary indicators that are contained in BRIC. Guided by the theory of RATA, the first step was to describe the system and identify exogenous disturbances and endogenous variations that may cause changes in the urban community system. Exogenous interference mainly refers to the identification of various disasters that communities are prone to, and endogenous variation comes from the factors influencing the vulnerability and resilience of communities. According to the degree to which the transient population community can meet the actual living needs of urban residents in terms of population characteristics and residential forms, it can be divided into urban villages, commercial housing, and apartments. Furthermore, the inherent differences between China and the west, as well as the relevant characteristics of the transient population community, were considered. A total of 16 indicators were selected after integrating the characteristics of the transient community and indicators mentioned in the existing literature. Table 1 presents the selected indicators and their corresponding dimensions.
3.3. Indicators’ Hierarchy Model and Initial Weight Determination
3.3.1. Establishing the Hierarchy Model
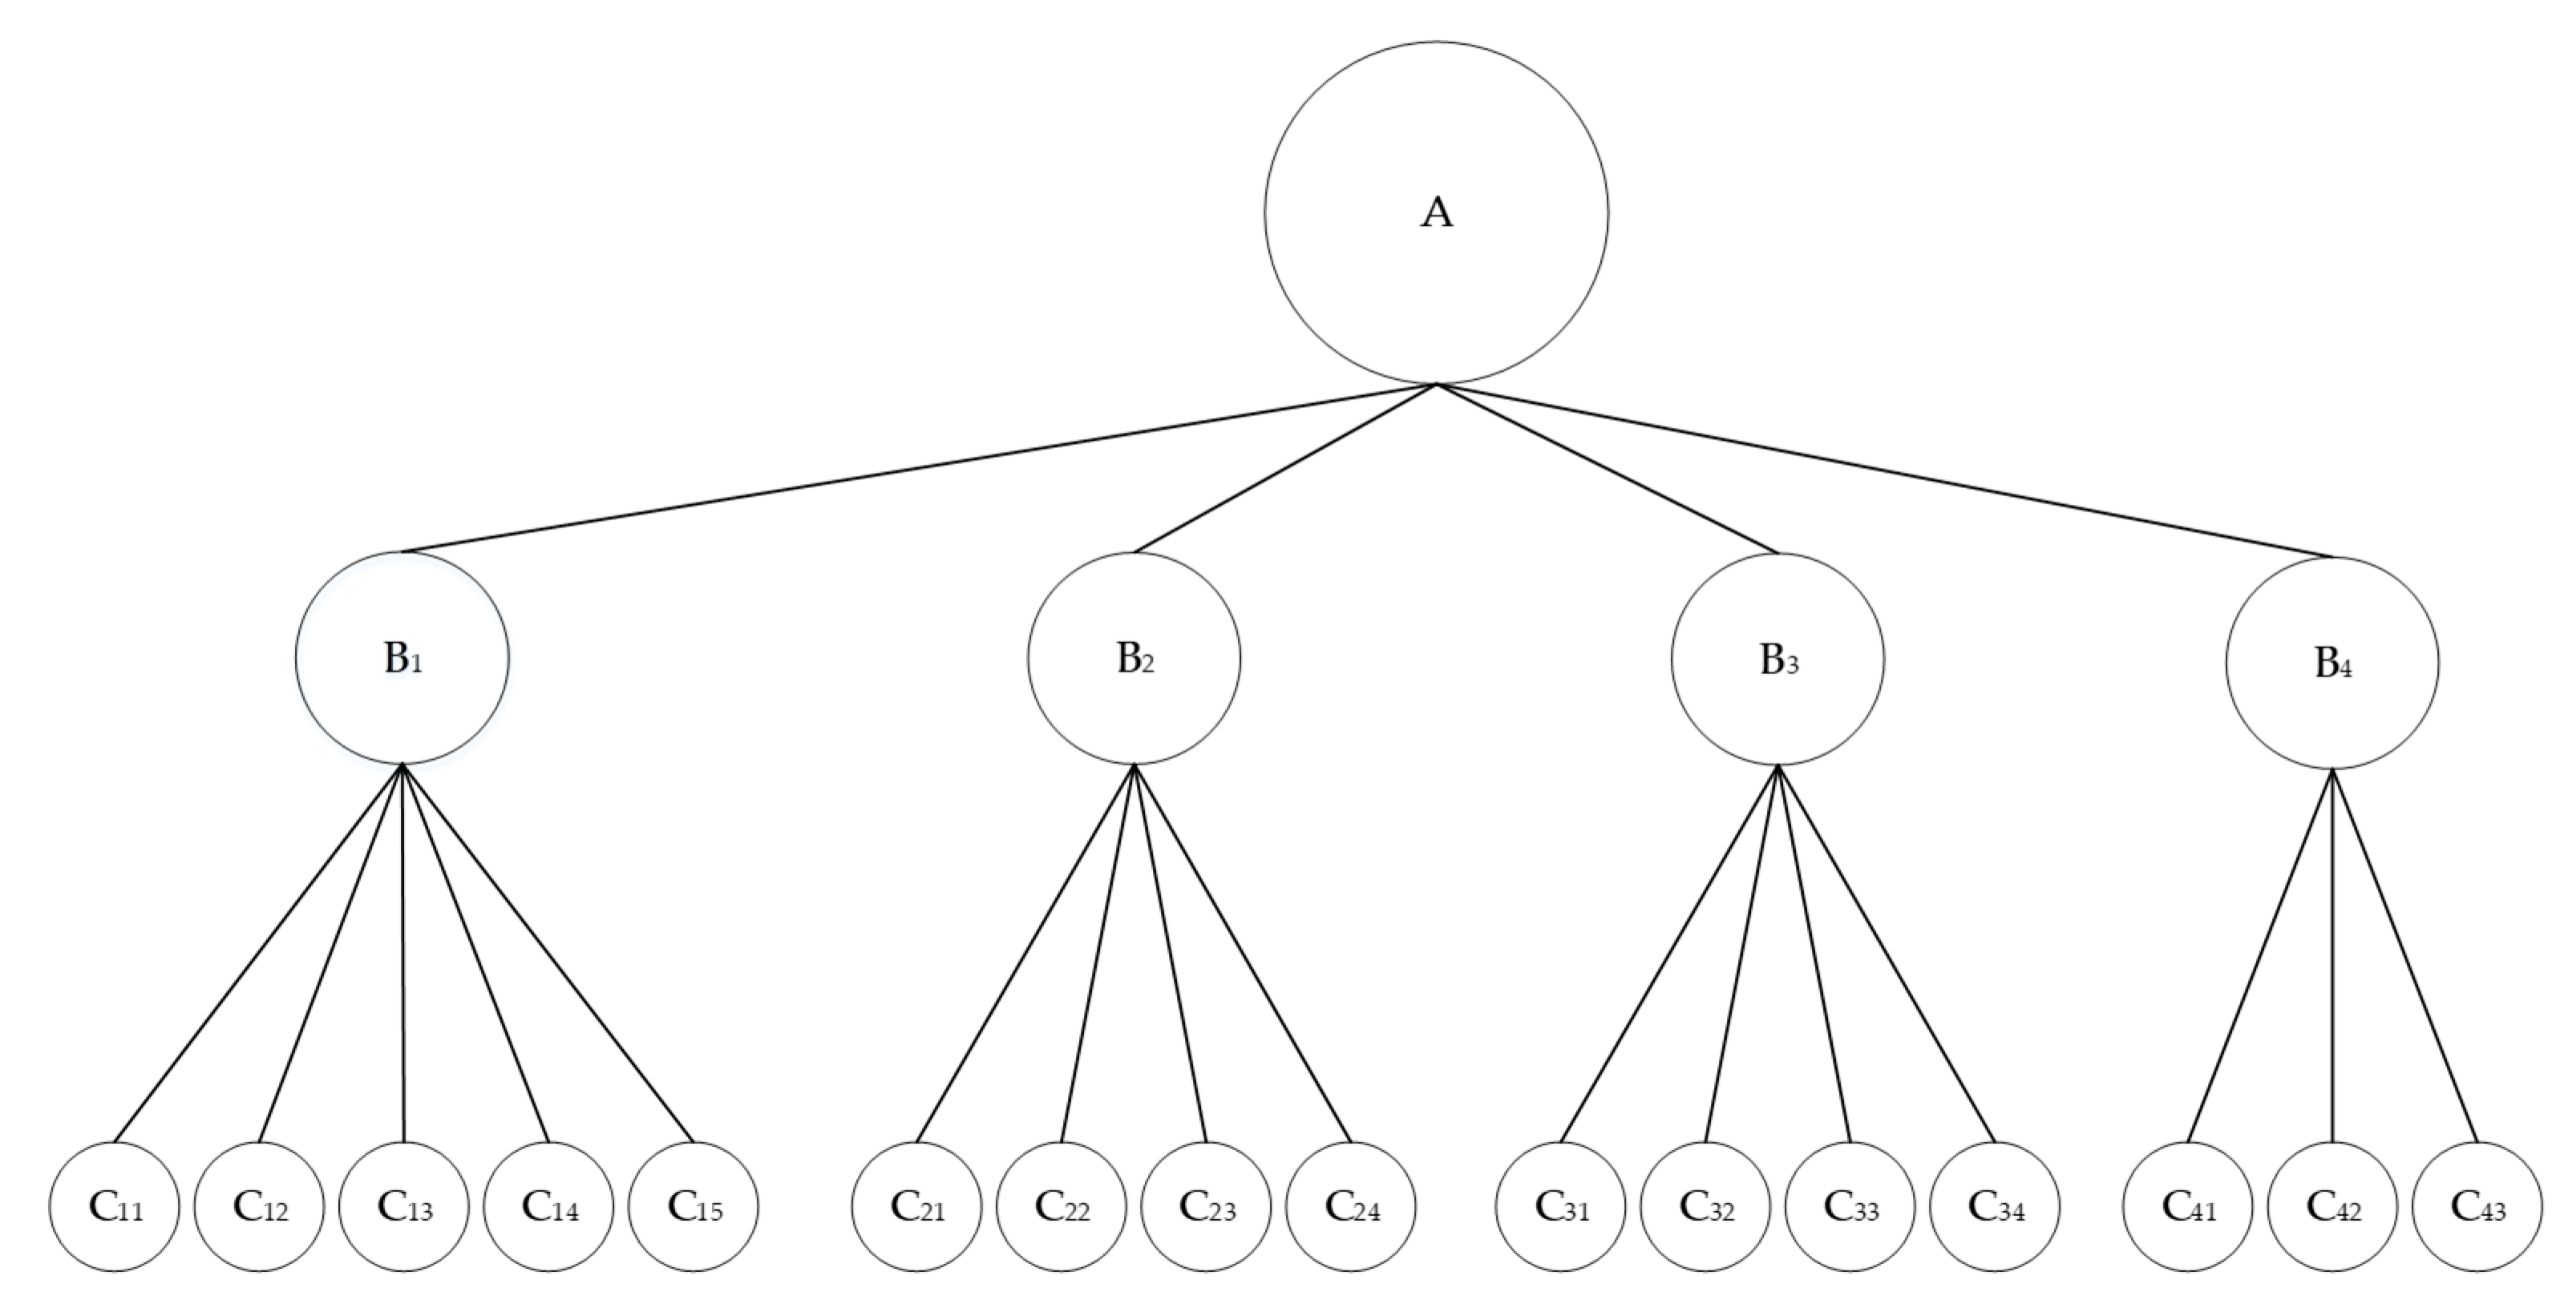
Figure 4 shows the indicator hierarchy model. The first layer corresponds to the target layer (A), which represents the community resilience of the transient population. The second layer refers to the criterion layer (Bi), which represents the selected dimensions, namely, community space construction, economic development, communities’ management system, and community capital. The third layer represents the scheme layer (Cij), which consists of 16 indicators (Table 1).
3.3.2. Applying AHP Method to Calculate the Initial Weights
A questionnaire on the importance of urban community disaster resilience, and the evaluation index of the transient population was developed and distributed to experts. A pairwise comparison of the factors at each layer was performed by using a one to nine scale method. Then, the findings were recorded in Yaahp, which could directly verify the consistency of the results. Lastly, the eigenvalue, the weights (wj) of the indicators’ scheme layer, and the weights (w0) of the criterion layer of dimensions could be outputted.
3.4. Construction of the AHP–BP Combination Model and Resilience Estimation
The AHP method is widely used in evaluating and determining weights, but subjective factors affect the accuracy of evaluation. Nevertheless, the ANN method can effectively weaken artificial factors and systematically identify the unknown relationship among various indicators, using a trained neural network for positive knowledge reasoning to determine the weight of the indicators [55]. Superior to traditional logical reasoning calculation, ANN has a simple structure, a steady operation state, a strong nonlinear mapping ability, and a high computational accuracy [54,56,60]. A AHP–BP combination model was constructed to realize the initial determination and optimization of indicator weights, and to reduce the influence of subjective randomness and uncertainty of the AHP method (Figure 2). The specific steps of establishing the AHP-BP model in this study are presented as follows:
3.4.1. Sample Collection and Processing
n training samples were determined by collecting the actual data of the three types of transient community resilience indicators as the input vector, and each training sample has m indicators:
Furthermore, combined with the expert weights obtained by the AHP method, the linear weight value was calculated as the output vector: Y. The calculation method is presented as follows:
where uij is the score of the ith sample and the jth indicator, wj is the weight of each indicator, and Y = ().
After normalization, X and Y are denoted by X’ and Y’, respectively; and the network training samples were obtained.
3.4.2. Determining the Network Parameters
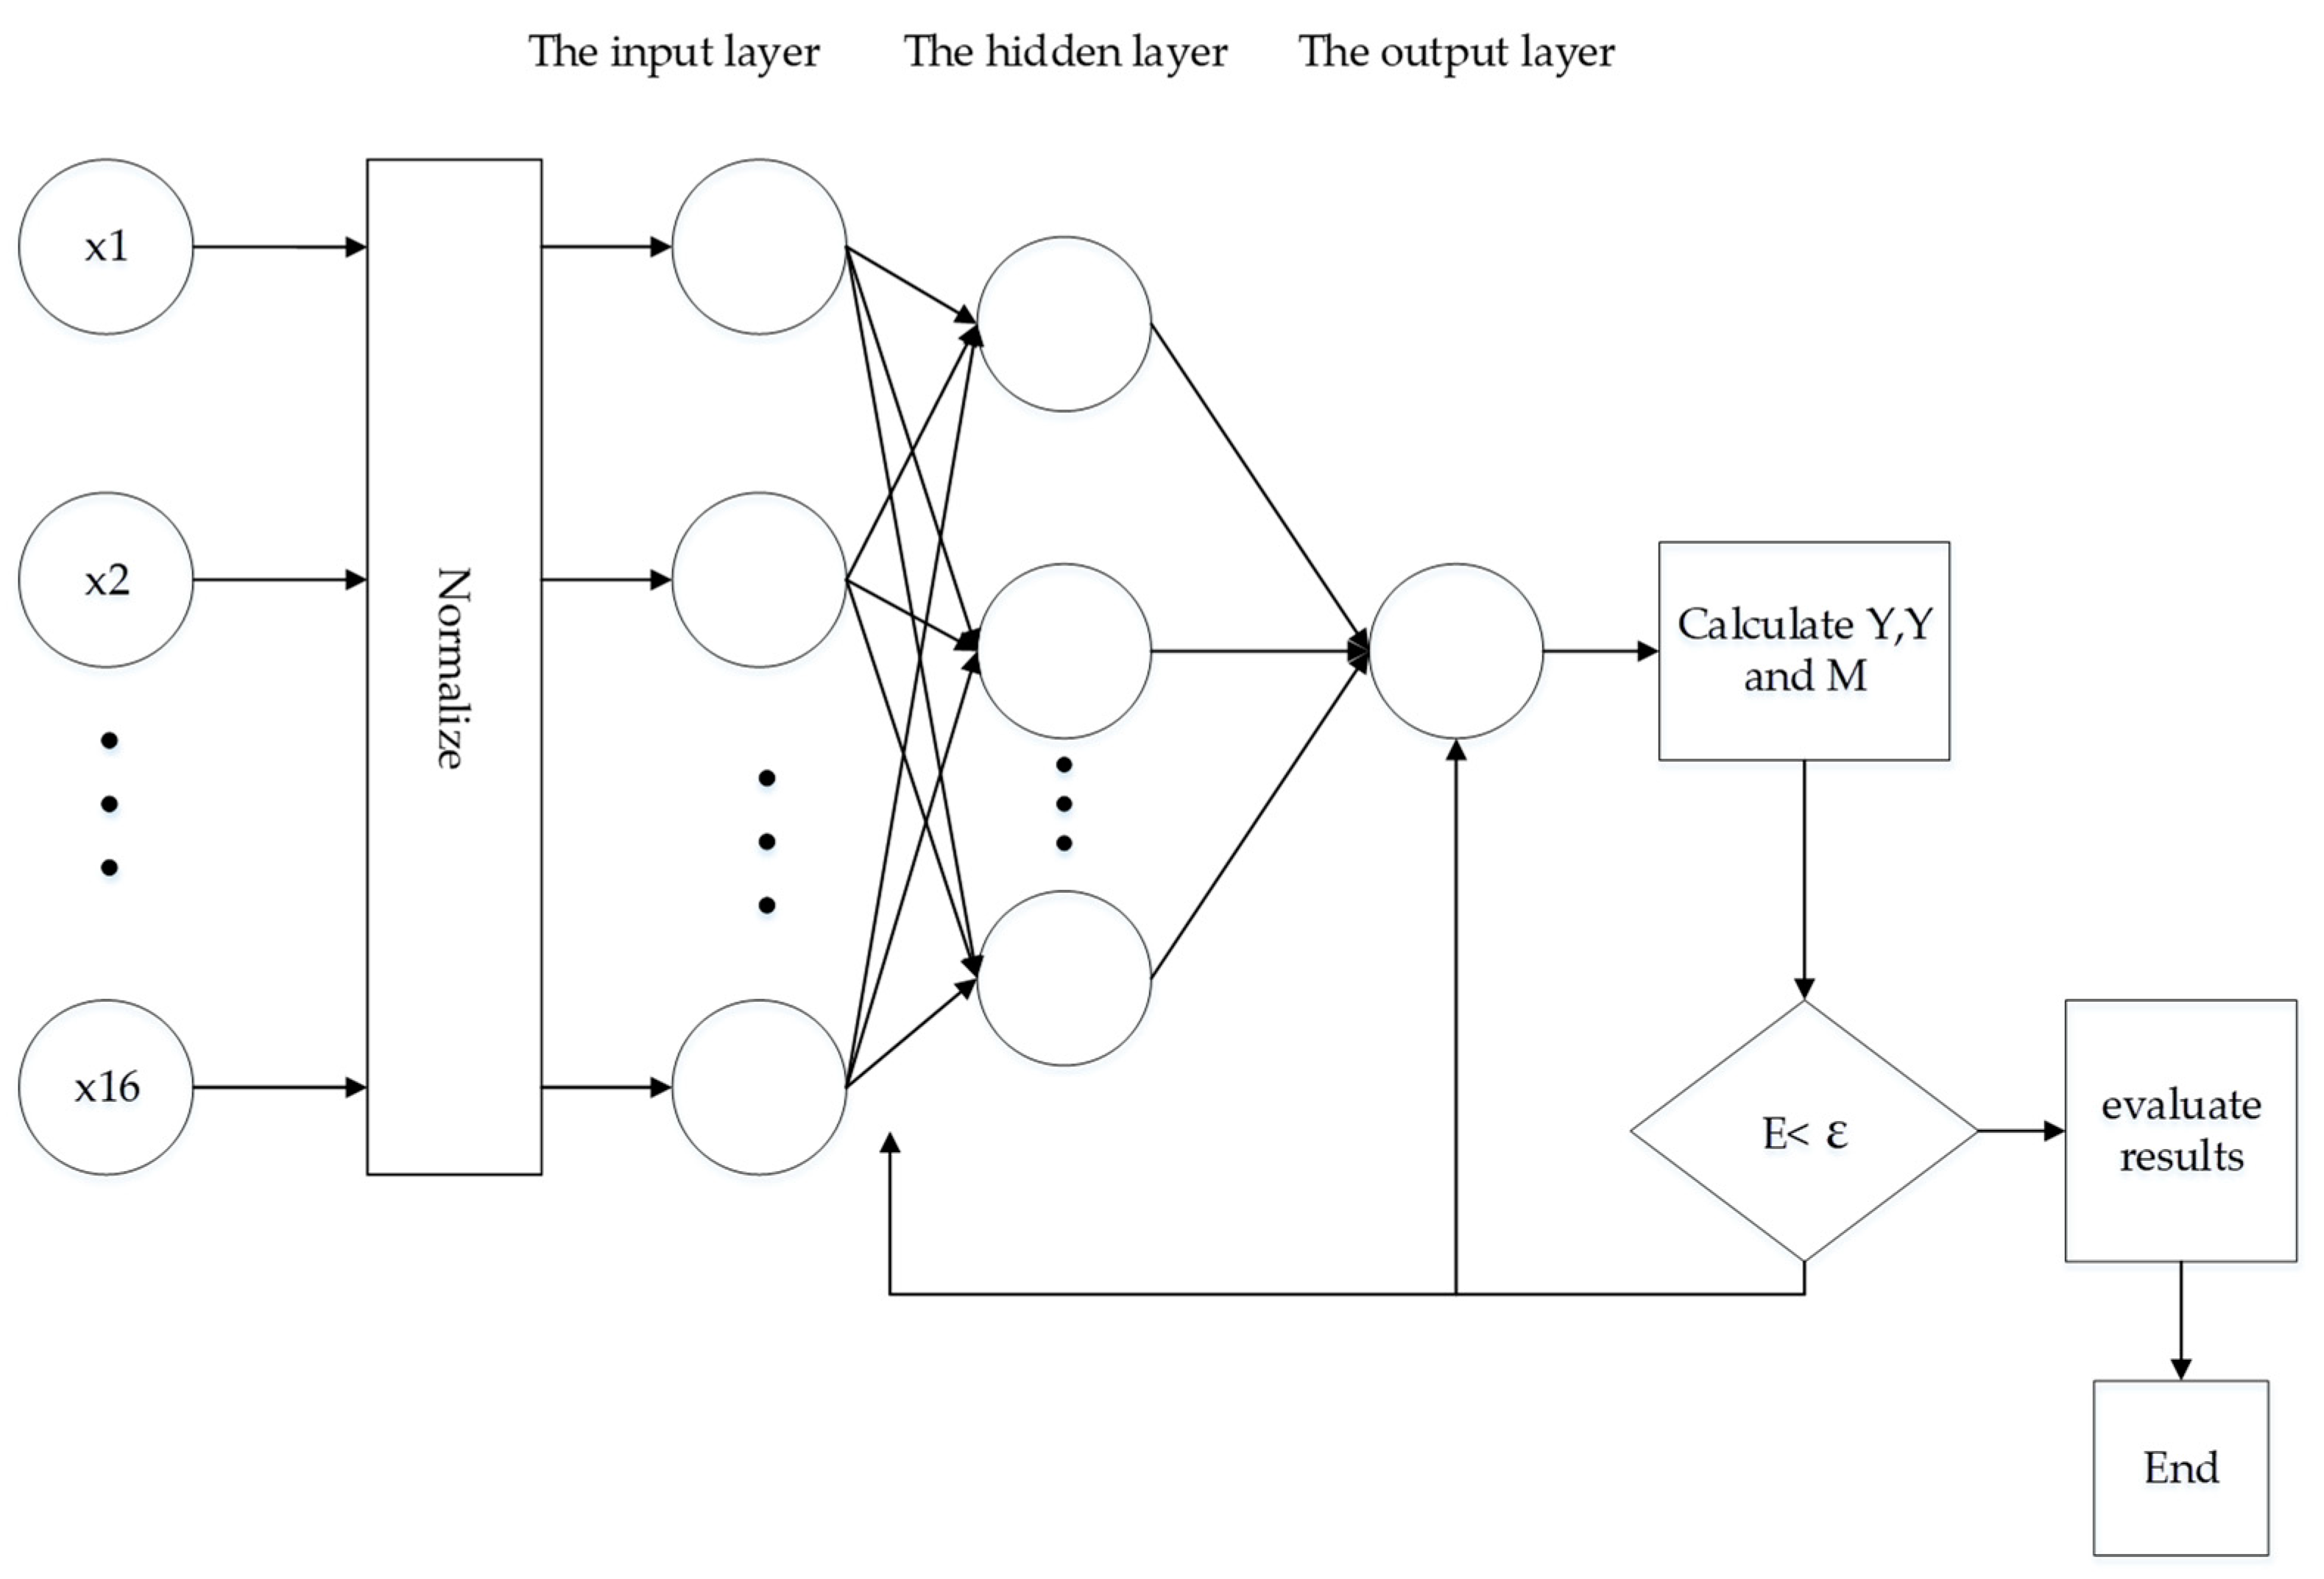
A BP neural network realizes a mapping function from input to output, and mathematical theory has proved that this network can realize any complex nonlinear mapping function, thereby making it particularly suitable for solving complex problems with internal mechanisms. In this study, a three-layer BP network, with one hidden layer, was selected to evaluate the resilience of the transient population community. The BP network contained 16 nodes in the input layer and 1 node in the output layer. The number of nodes in the hidden layer was determined on the basis of the hidden layer design empirical formula.
where m is the number of input layer nodes, l is the number of output layer nodes, p is the number of hidden layer nodes, and c is a constant between 1 and 10.
In this study, the transfer function of hidden layer neurons adopted the Sigmoid function. The learning and training functions adopted “trainbfg,” which refers to a variable gradient algorithm that is suitable for small networks. For the BP neural network (Figure 5), let d be the number of iterations, and in the Newton algorithm, the weights and thresholds of each layer were modified according to the following formula:
where is the connection weight vector or threshold vector between layers in the dth iteration; is the gradient vector of each weight or threshold of the output error of the neural network in the dth iteration; and the negative sign represents the opposite direction of the gradient, that is, the fastest descending direction of the gradient. is the total error performance function of the neural network output in the dth iteration, which is designed as mean square error (MSE). is the Hessian matrix (second derivative) of the error performance function under the current weight and threshold.
The other training parameters selected included: the learning rate “lr” was selected as 0.01, the “mo + mentum” was selected as 0.90, the “max_epoch” was set as 1000, and the “err_goal” was set as ε = 10−5.
3.4.3. Network Training and Estimation of the Three Communities’ Resilience
The sample data of the three selected communities were trained by using the toolbox of the MATLAB software (version 2017b, MathWorks, Beijing, China). The MSE E between the actual evaluation value Y * and the ideal evaluation value Y of each sample tends to minimum, which is regarded as the optimal algorithm criterion of a neural network. When the training results reached the requirements of network accuracy (E), the comparison line graph of the expected value and the actual value, and their relative error variation graph was outputted. Then, the connection weight matrix (wki) was outputted from the input layer to the hidden layer, and the connection weight matrix (wjk) from the hidden layer to the output layer. Next, the correlation significance coefficient (rij), relevant index (Rij), and absolute influence coefficient (Sij) were calculated. The specific formula is expressed as follows:
where i is the input unit of the neural network, i = 1, 2, 3…m; j is the output unit of the neural network, j = 1; k is the hidden unit of the neural network, k = 1, 2, 3… p; wki is the weight coefficient between neuron i in the input layer and neuron k in the hidden layer; wjk is the weight coefficient between neuron j in the output layer and neuron k in the hidden layer; and Sij is the target weight.
The mean of linear values between the actual data collected in the questionnaire survey and the optimized weight by the network is the resilience value of the community. Ultimately, the actual situation of the different communities can be reflected by analyzing and comparing the output weights and the resilience values of the three communities.
4. Results and Analysis
4.1. Calculation of Initial Weights of Indicators at All Layers
The initial indicator weights were calculated by Yaahp, based on the AHP method (Figure 6). Yaahp is an analytic hierarchy process auxiliary software that provides assistance in model construction, calculation, and analysis in the decision-making process, using an analytic hierarchy process. The weight of community space construction dimension was 0.4586, which is nearly half of the sum of all dimensions. The calculation results show that the weight deviation of the calculated indicators was large, which lacks objectivity and reliability. Therefore, the weight value obtained by the experts must be optimized to improve the poor effectiveness and practicability of the index weight value caused by the strong subjective arbitrariness of expert weight scoring.
4.2. Calculation of Initial Weights of Indicators at All Layers
4.2.1. Expected Output Vector of the AHP–BP Neural Network
According to the questionnaire survey results and the confirmed initial weight value, the output vector that corresponds to each input was calculated by using Equations (2) and (3). The partial expected output vector results of the urban village community are shown in Table 2.
4.2.2. Expected Output Vector of the AHP–BP Neural Network
The network was trained using the constructed training samples. The BP learning algorithm uses the least square method and gradient search techniques to minimize the MSE between the actual and the expected output values of the network [55]. This study conducted network training according to samples from the three communities.
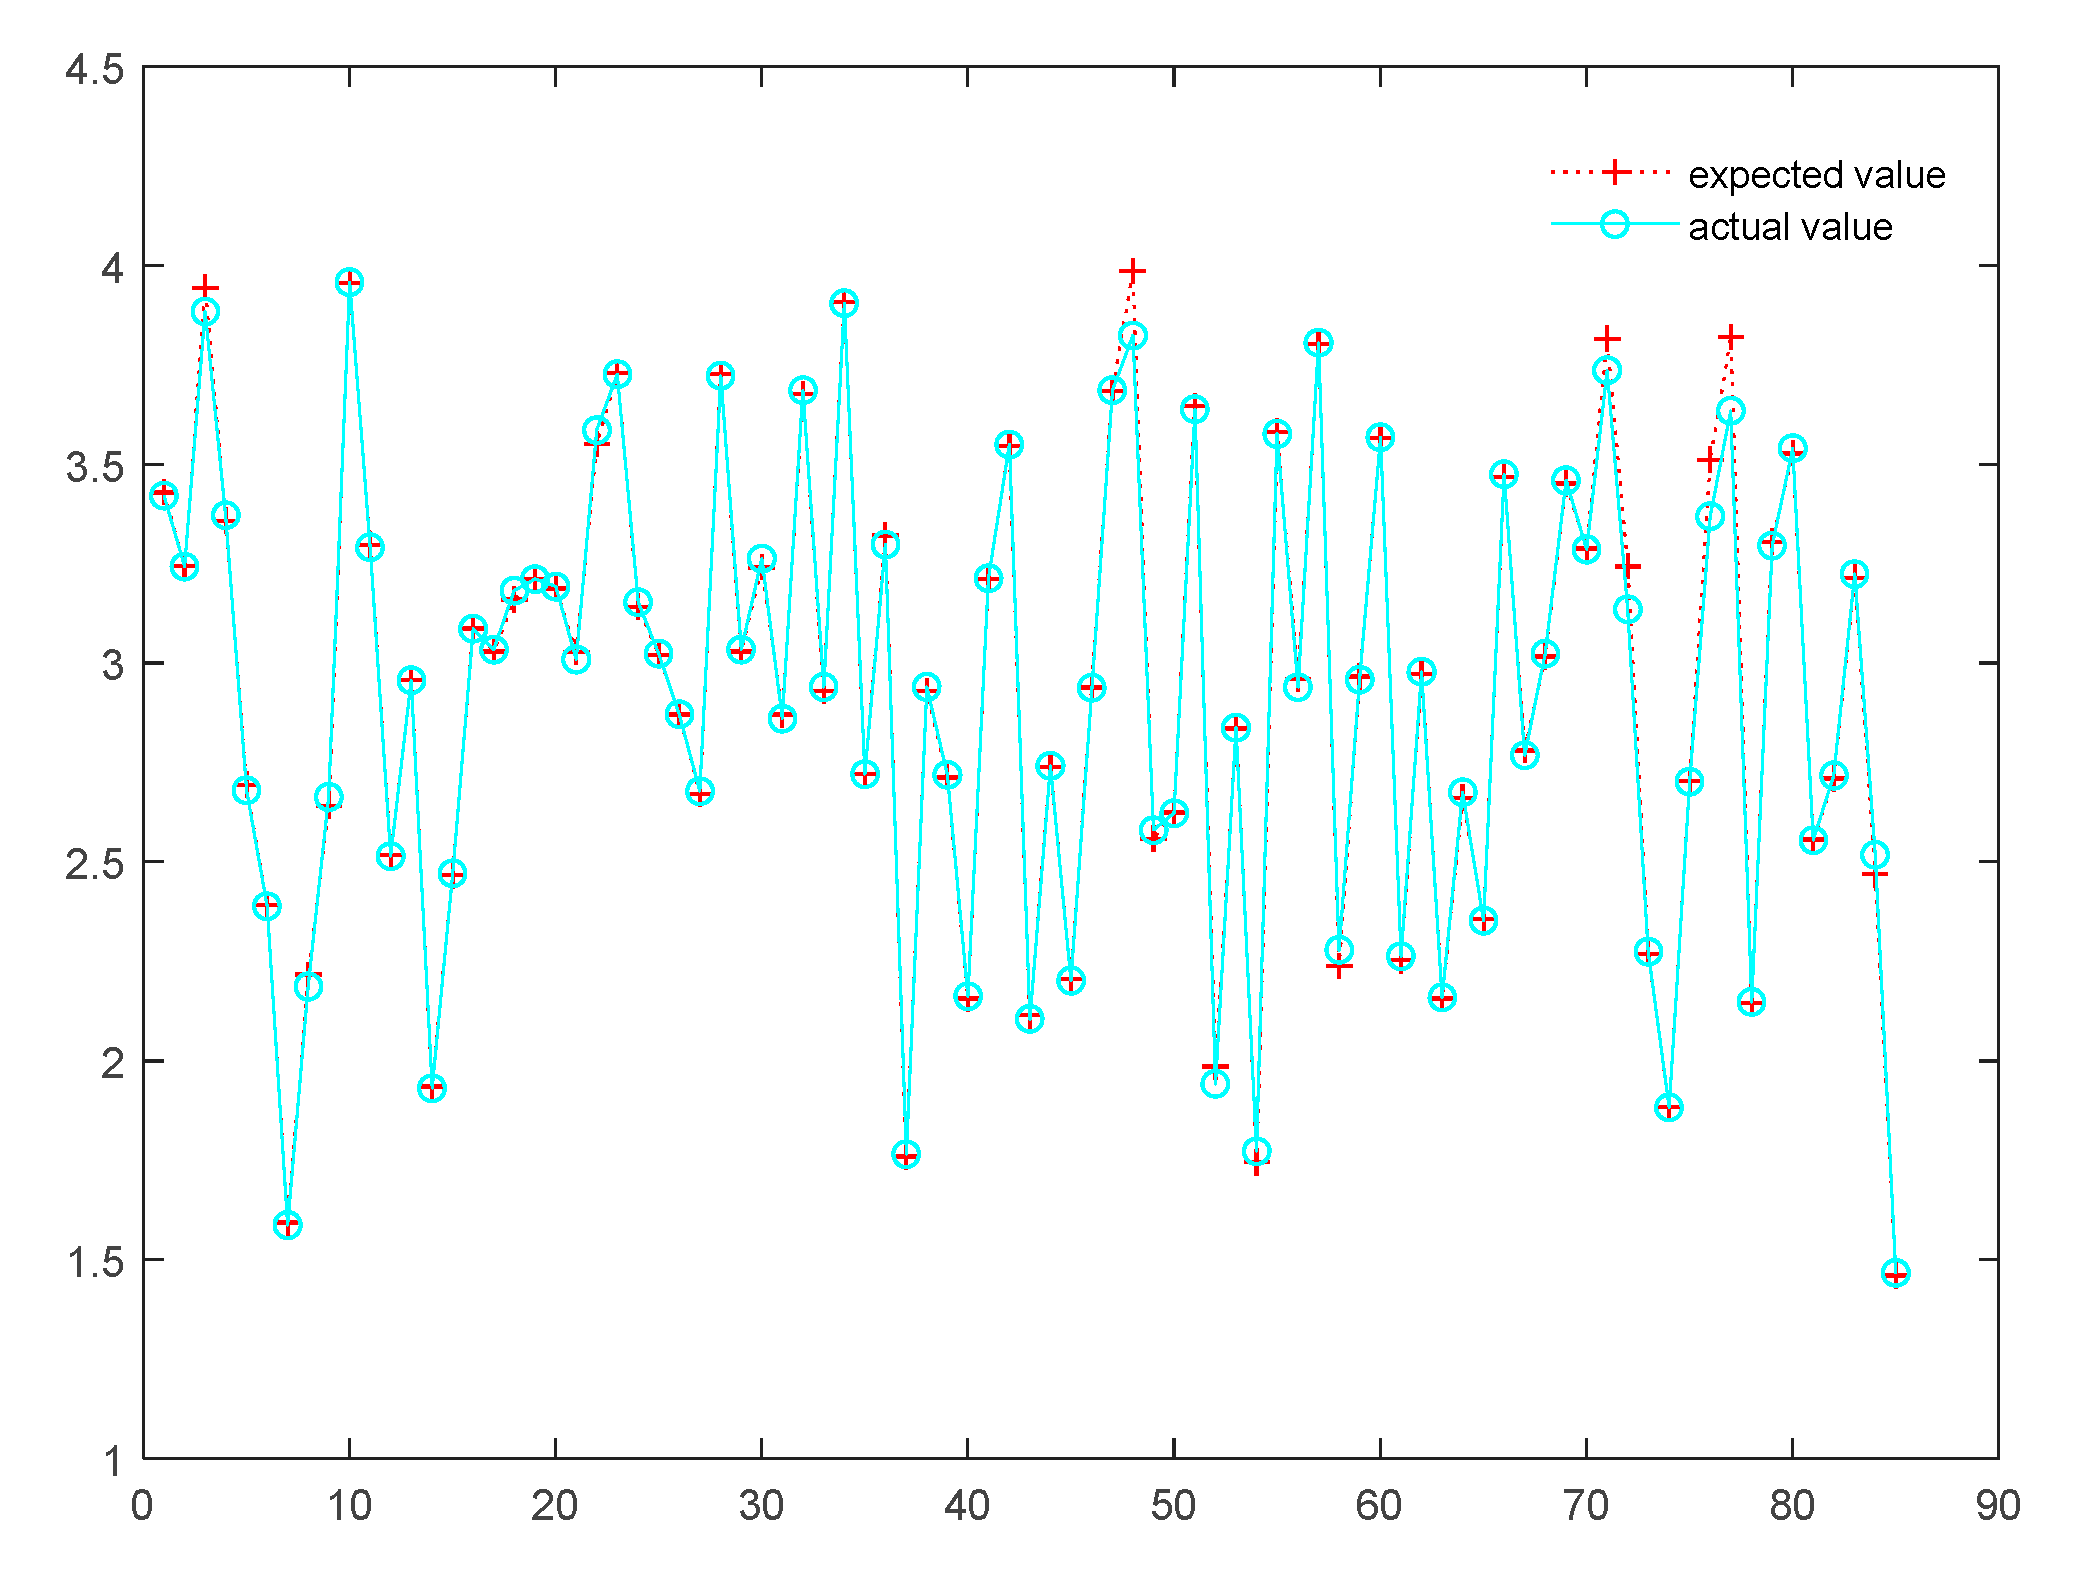
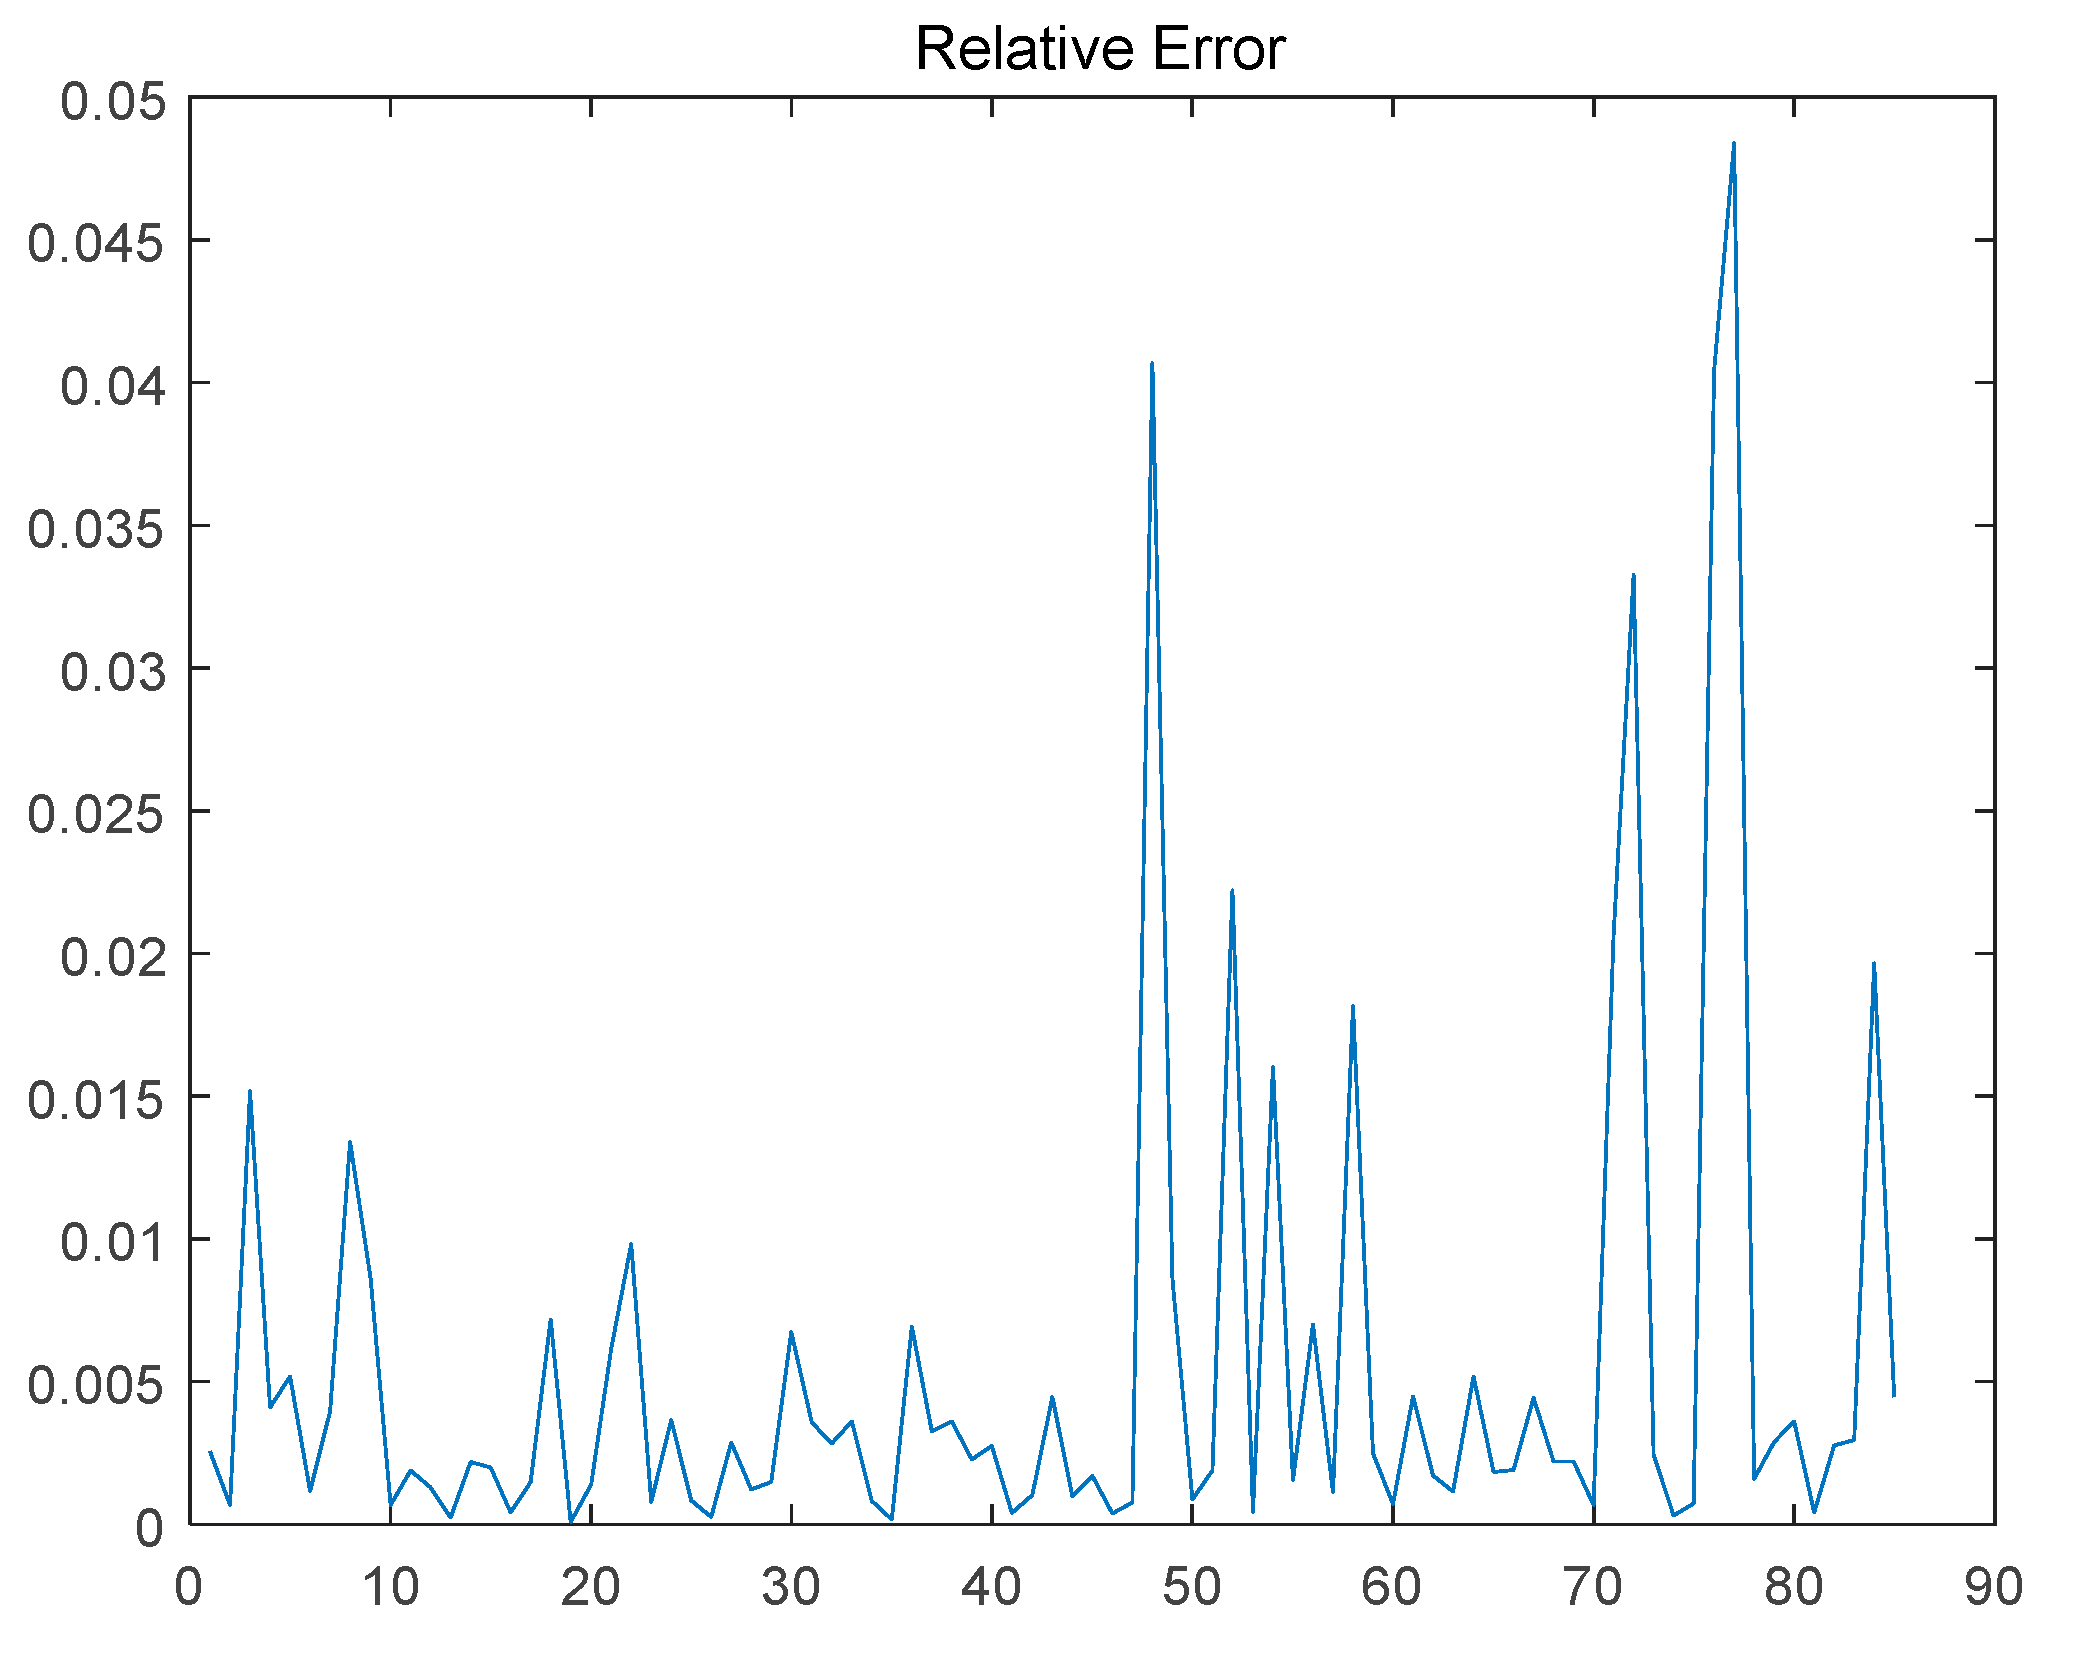
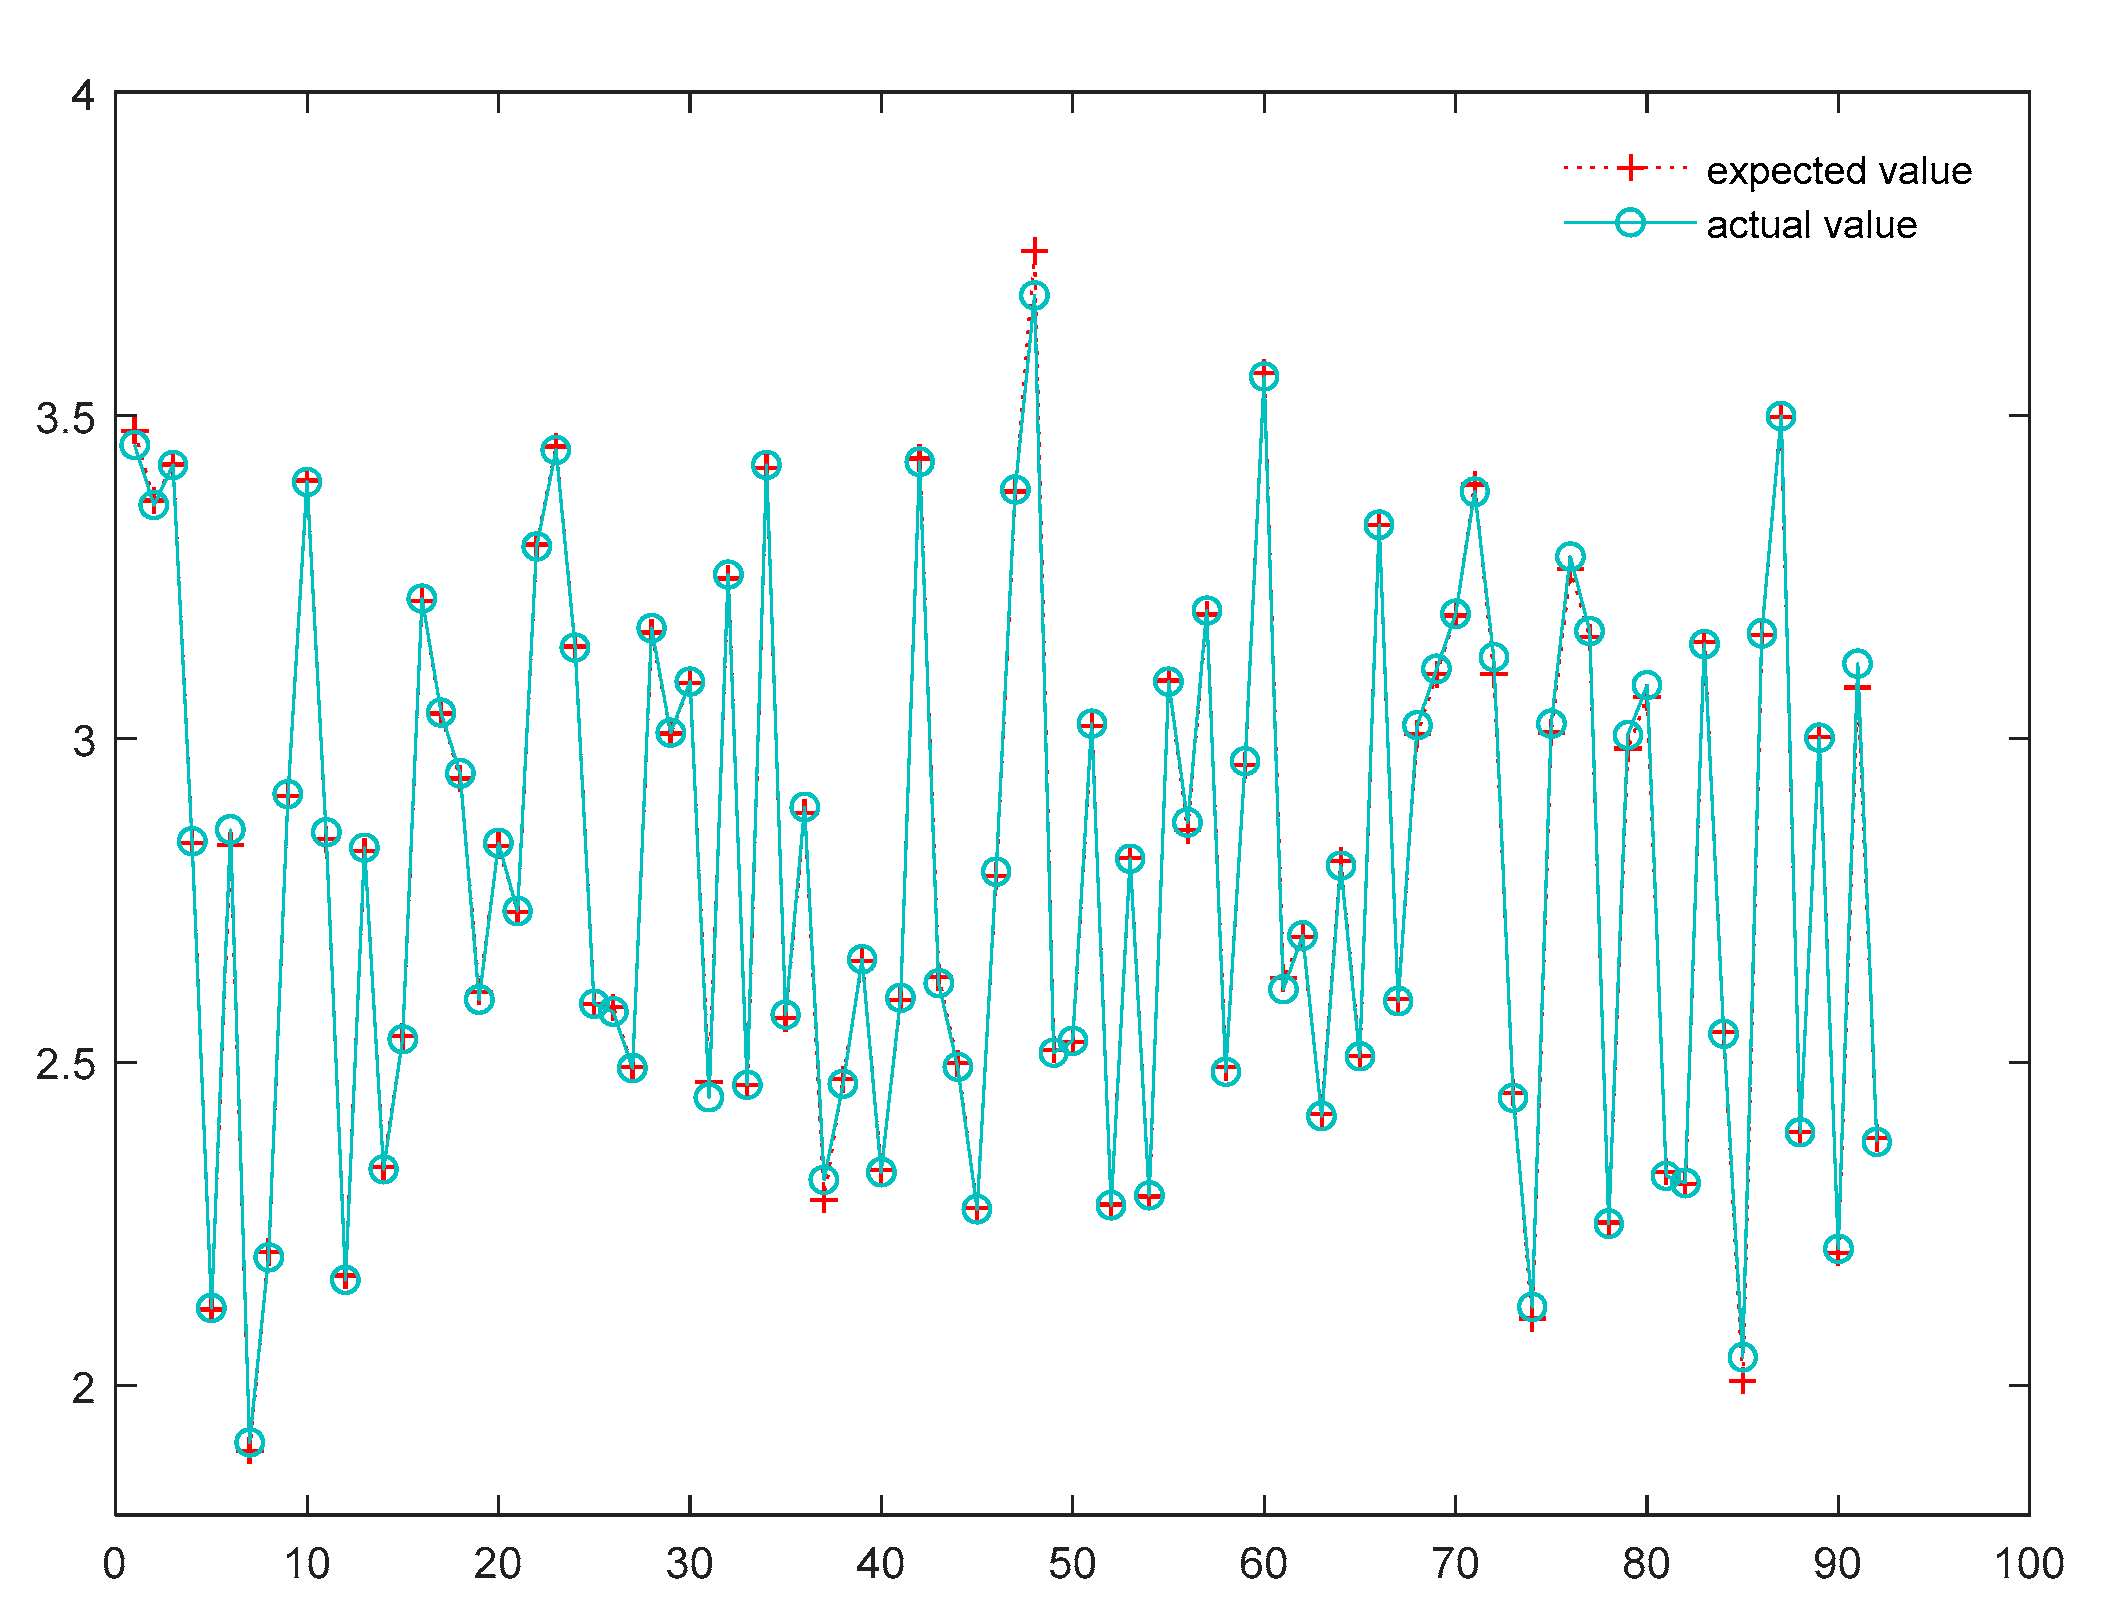
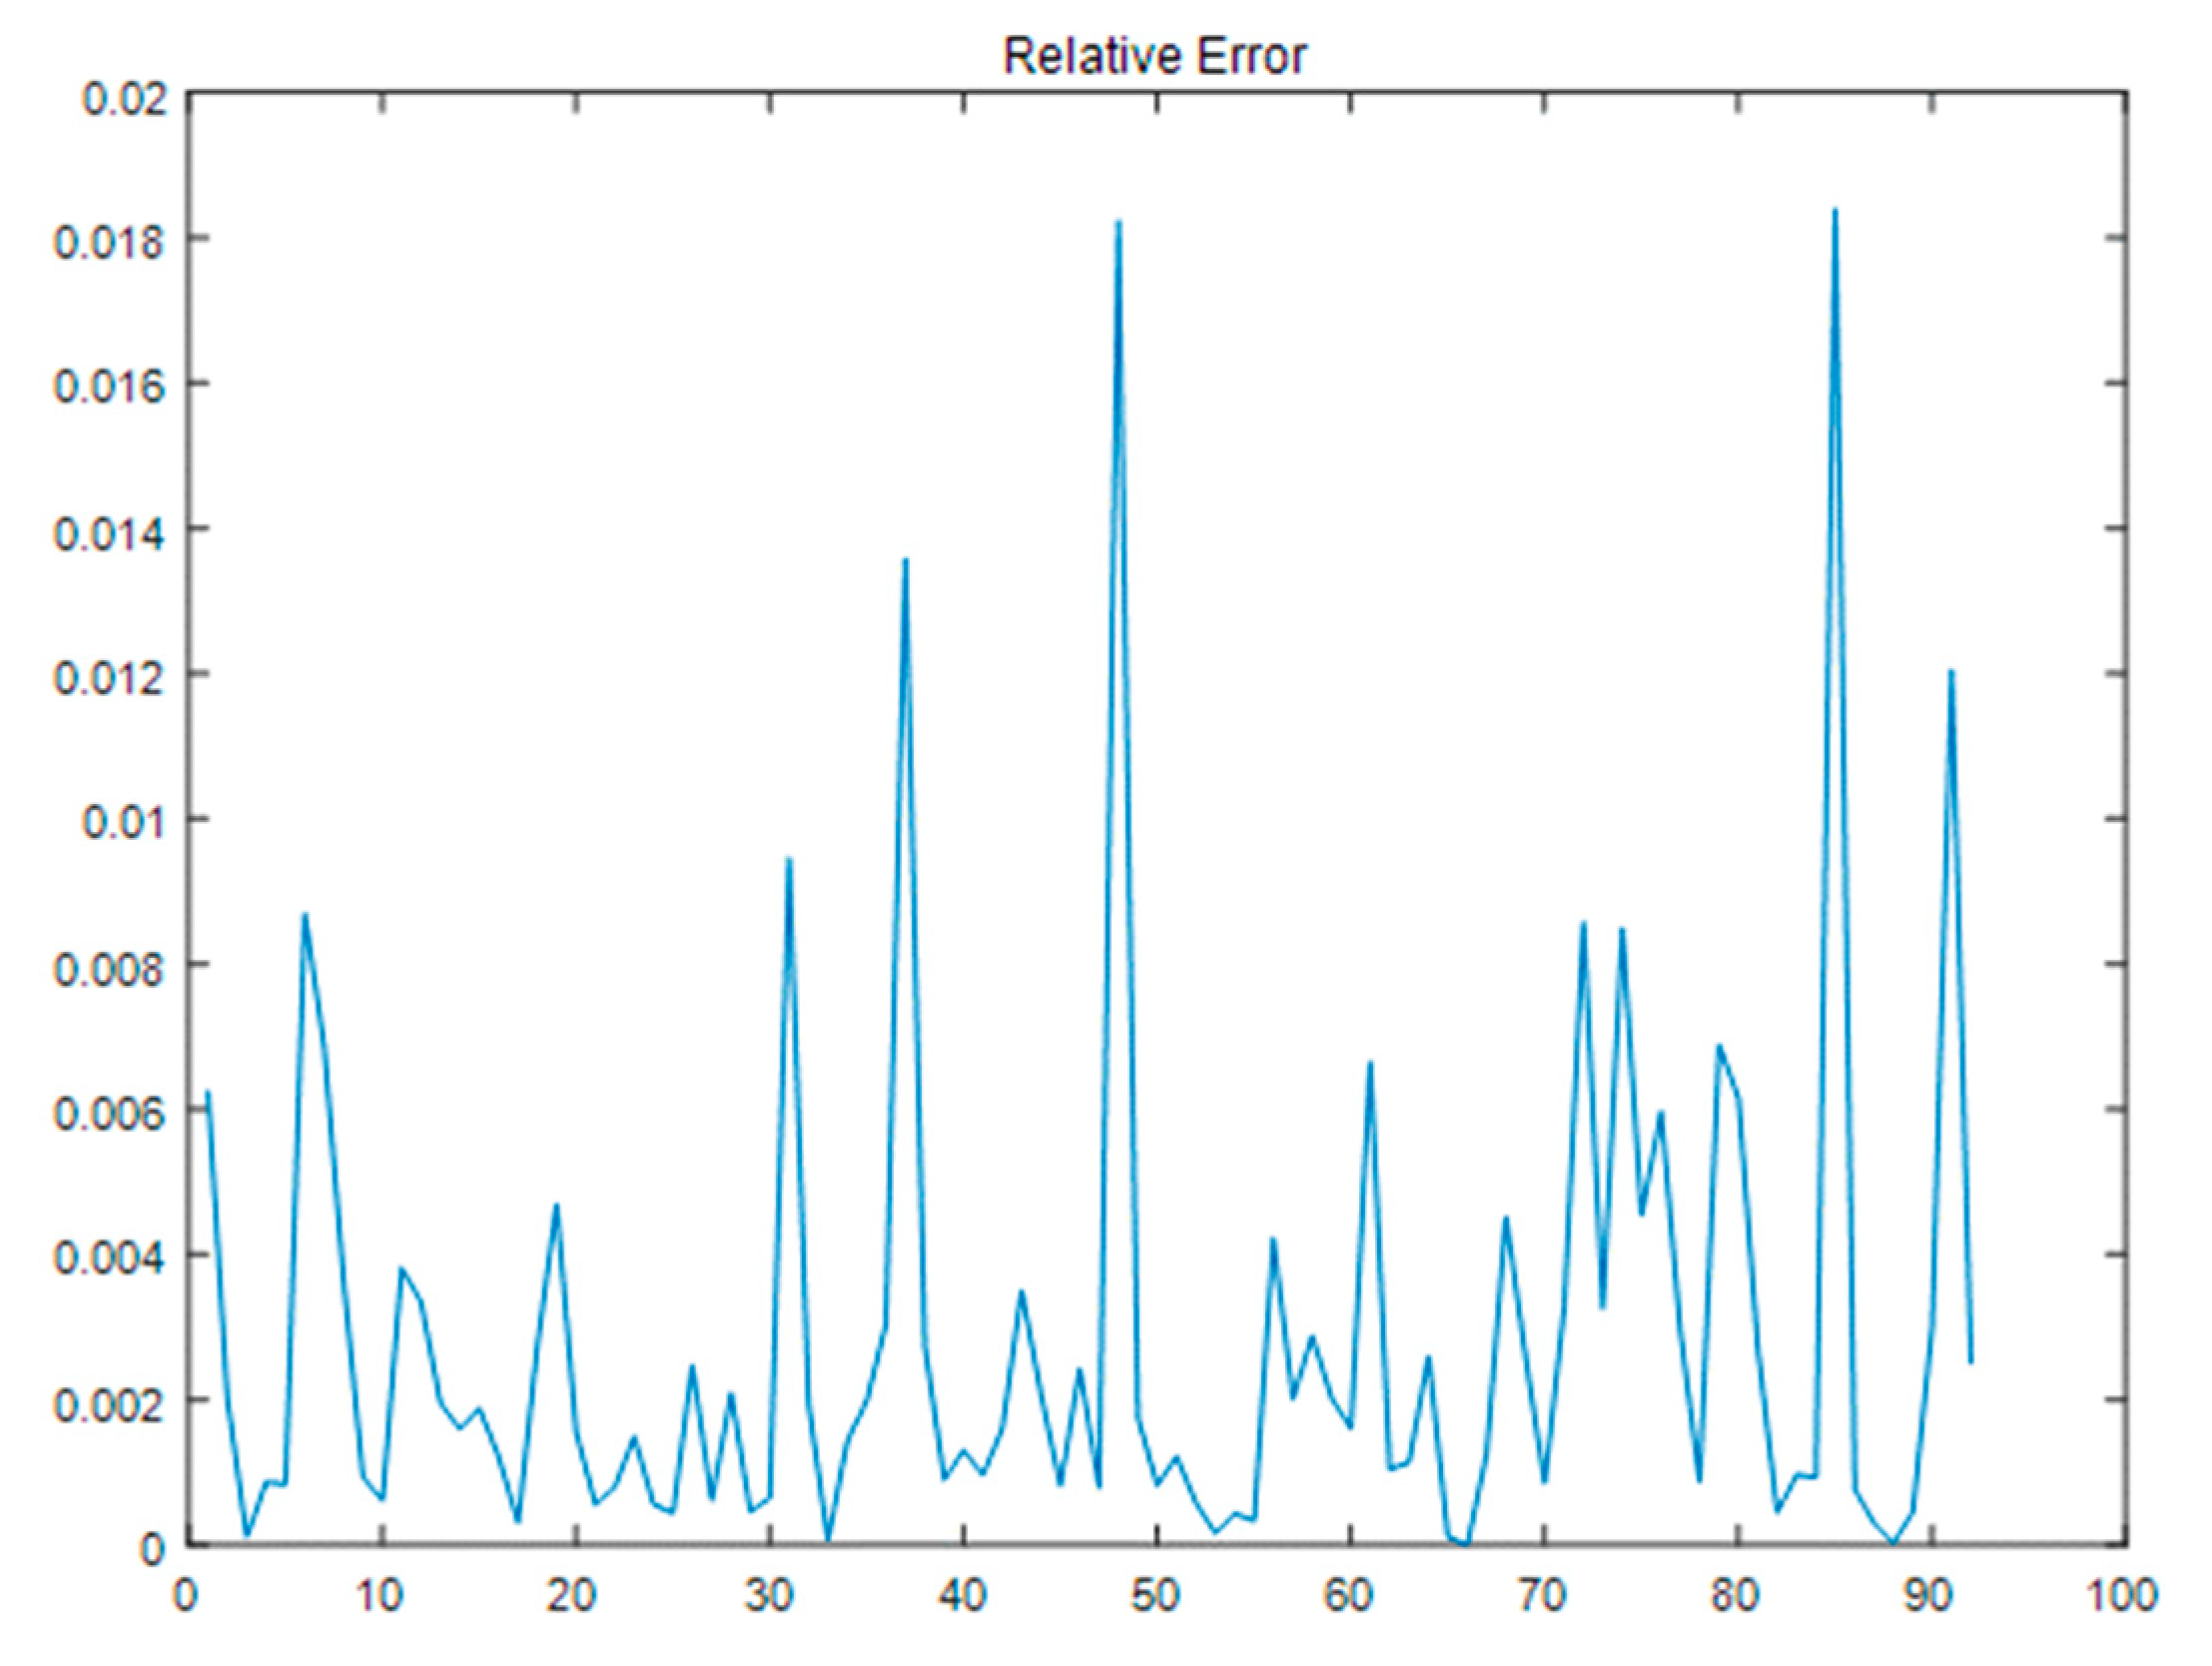
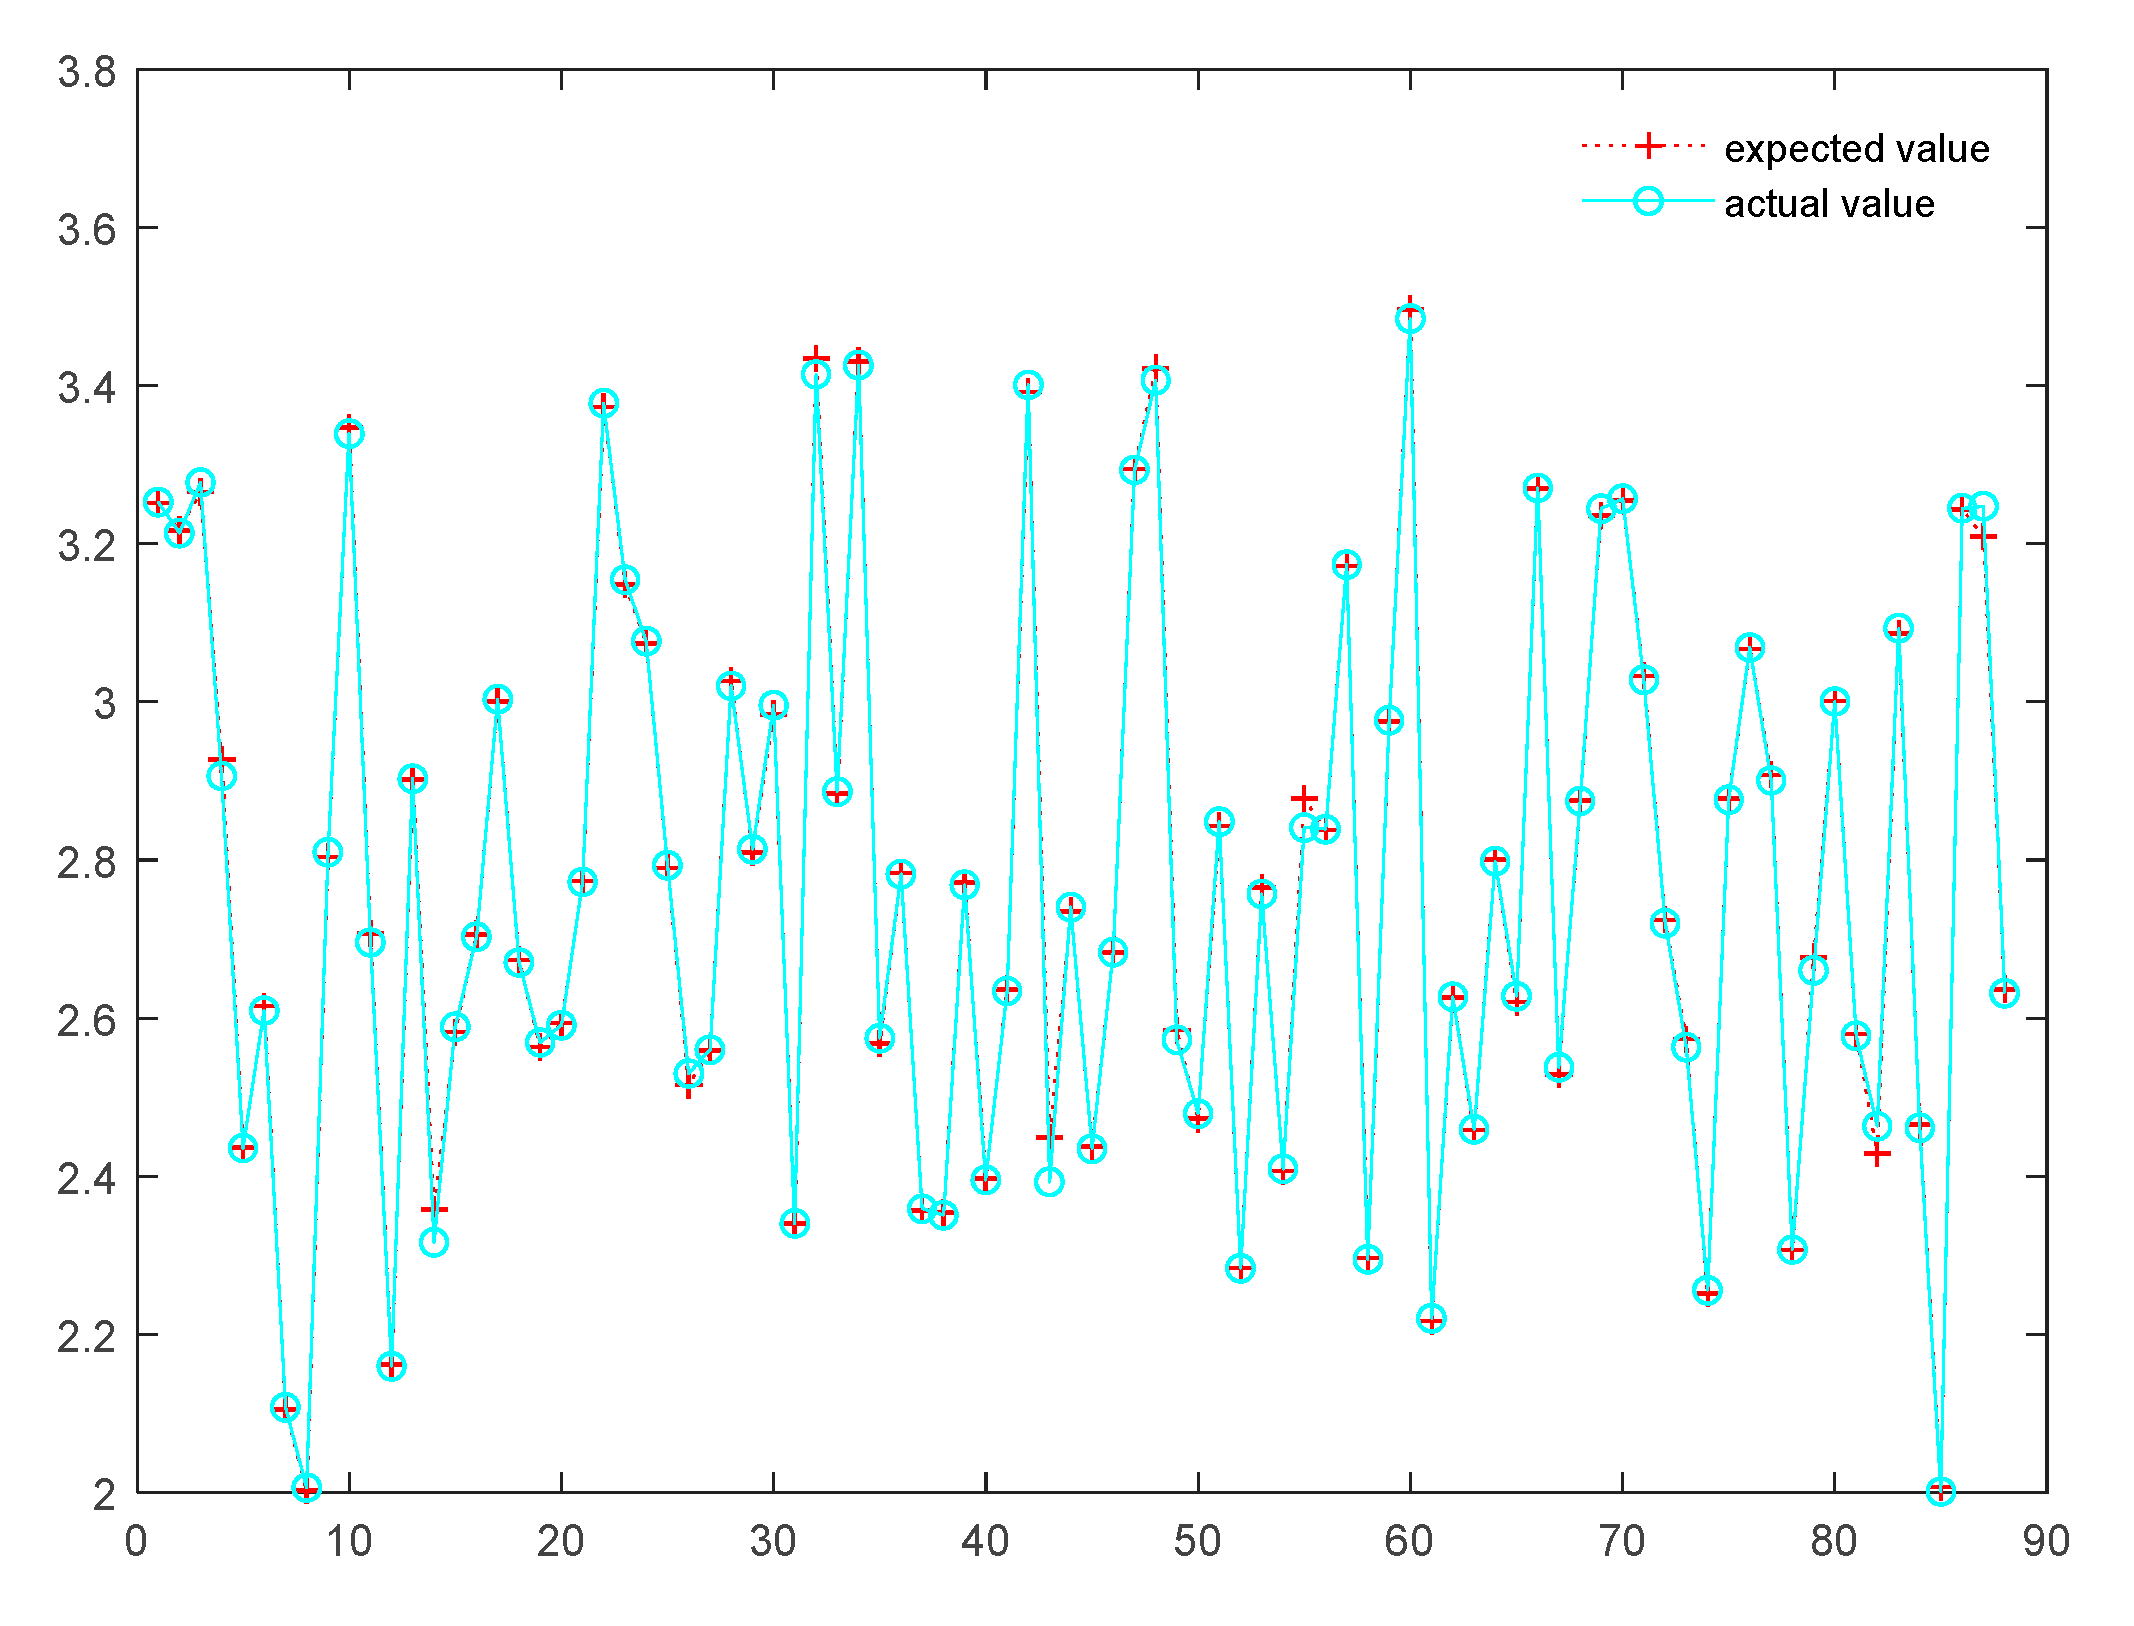
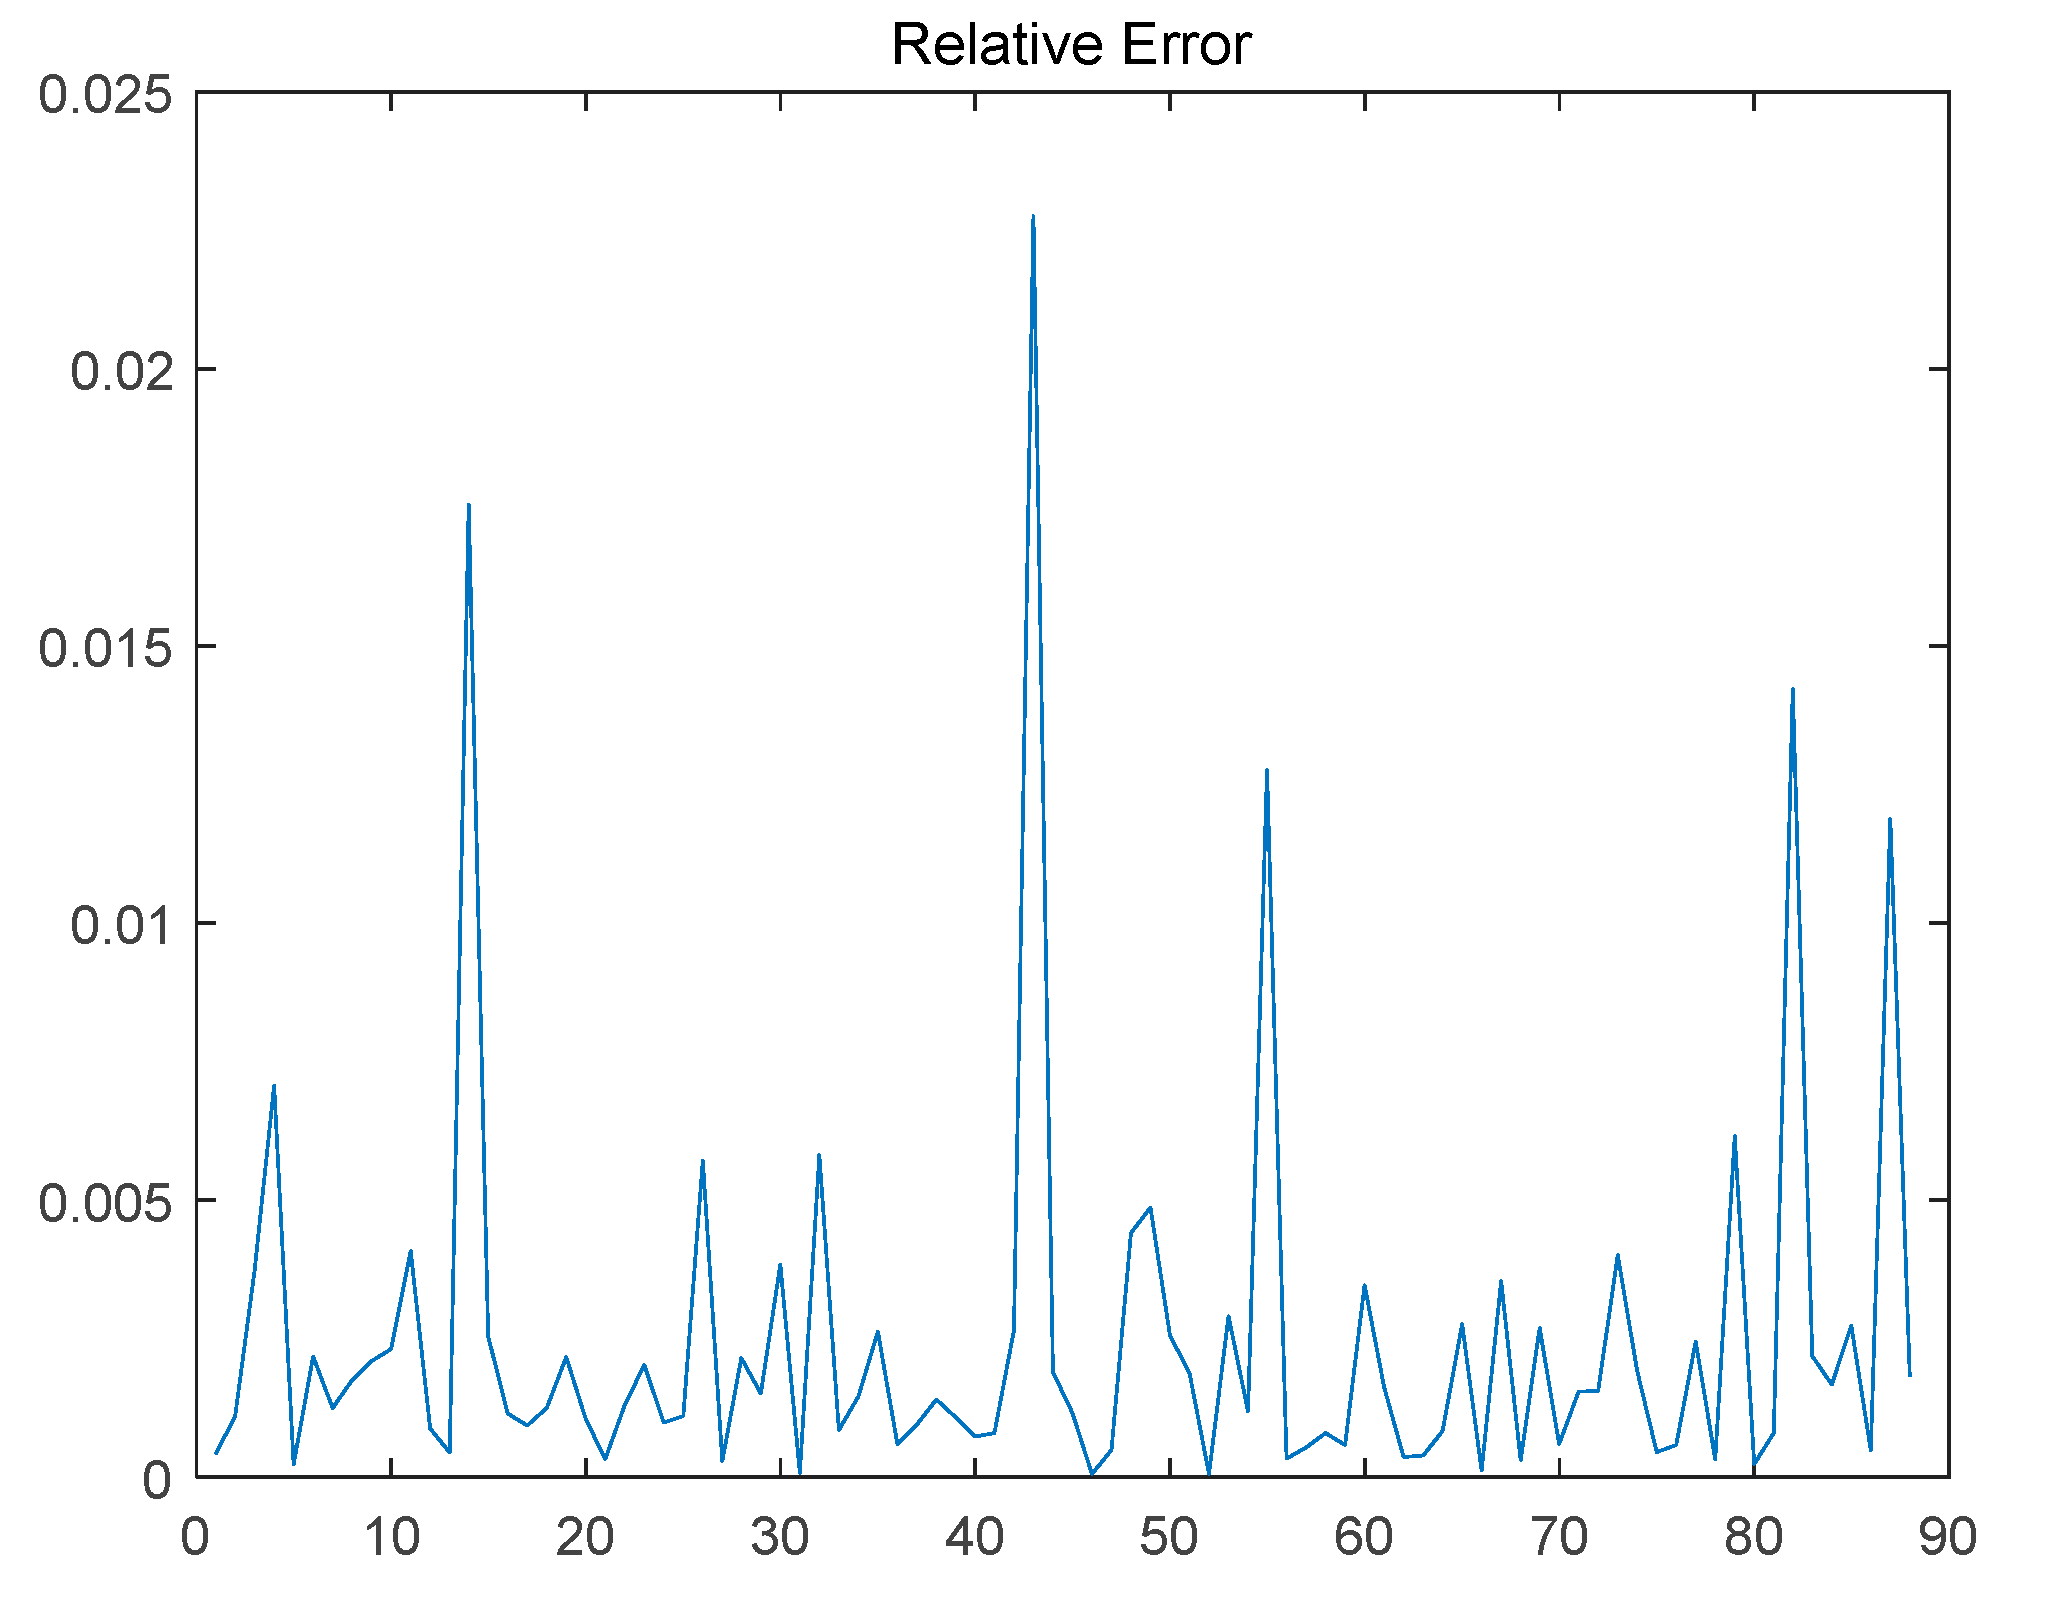
Through continuous training analysis, the number of hidden layer nodes in the network structure of the Hongxia community was determined as seven. After 87 iterations of adjustment, the accuracy reached 9.41 × 10⁻⁶, which was less than the target accuracy of 10−5. The network output results and error calculation are shown in Table A1, which shows that the actual network output of the training samples has a certain deviation from the expert evaluation values. In addition, the maximum relative error of the test was 0.0509, which was within the acceptable range in the resilience evaluation. Therefore, the network output weight value was effective and reliable. Similarly, the number of hidden layer nodes in the two other community network structures was eight and seven, the training errors reached 9.99 × 10⁻⁶ and 9.68 × 10⁻⁶, and the maximum relative errors of the test were 0.0186 and 0.0233. The Appendix A Table A1, Table A2 and Table A3 present the specific data, and Figure A1, Figure A2, Figure A3, Figure A4, Figure A5 and Figure A6 show that the neural network training results were rational. Therefore, the BP neural network could approximate the complex nonlinear resilience evaluation process by simply compounding the neuron functions. Combined with the BP neural network model of the AHP, the community resilience evaluation method was improved, and its analysis and results have broad application prospects.
4.2.3. Weight Analysis of the Three Communities’ Indicators
After training the network, the weights (wki) were outputted between the input and hidden layers and the weights (wjk). Finally, the optimized weights (Sij) of the three communities’ indicators were obtained by using Equations (6)–(10). Table 3 shows that the weights of some indicators changed greatly after BP network optimization. Actually, the weight value aims to make a reasonable and effective distinction of the difference in disaster resilience among various transient population communities, rather than the standard of importance and effect [47]. A factor may play an important role in evaluating the disaster resilience of a certain community, but it may not play an equally important role in distinguishing the quality distinction of different communities’ disaster resilience. Therefore, the three communities had diverse rankings of weights, and the value assigned to each of the indicators was also diverse.
Specifically, the weight of building quality (C11) ranked first among the three community resilience indicators, but the proportion of building quality resilience of the Wannian community was higher than those of the two other communities, indicating that the quality of building facilities in old communities was worse than those in the other communities. Therefore, old urban communities must strengthen building quality (i.e., “hard” power) to improve their disaster resilience. The communities of Hongxia and Hugong are more geographically remote and economically backward than Wannian. Thus, they have fewer resources to supply. Their weights were 0.0574 and 0.0472, that is, they should focus on material reserves (C24) to enhance the resilience of their communities. The emergency management (C43) weights of the three communities correspond to 0.0941, 0.1291, and 0.1057, which accounts for a large proportion in the community management system. Therefore, strengthening emergency management for these transient communities can effectively promote the improvement of their resilience. Furthermore, the survey showed that residents within the transient population community generally lack disaster awareness and have limited communication with one another. The Table 3 also shows that emergency management (C43) ranks relatively high.
In general, the proportion of community space construction was more than 40%, indicating that the spatial construction of the transient population communities is insufficient. Most transient communities are located in older parts of the city with poor building quality, narrow roads, and inferior system connectivity, thereby causing great difficulties in emergency management. Moreover, the transient community has a large population density, which is not conducive to the timely evacuation of residents. The economic development percentage was approximately 15%. Although its proportion is not high, it is an important basis for coping with disasters. In addition, most of the transient population have a low income, and reside in old urban areas, which have a relatively weak economy. The community management system, which accounts for approximately 24.5%, is also an important dimension in evaluating community resilience. Compared with the communities where permanent residents live, the community management system of the transient population is relatively loose and informal; hence, more efforts are needed to be taken to improve their community management systems. In addition to strengthening the “hard” power of communities, “soft” power should also be given greater attention. “Soft” power refers to community or social capital that accounts for approximately 20%, thereby implying an emotional connection to one’s neighborhood or city, somewhat apart from connections to the specific people who live there. However, the residents of the transient population community have less dealings, and their sense of community belonging is weak due to the frequent change in living place. The government should give more care and power to the transient population, and communities must develop economic resources, reduce risk and resource inequities, and attend to their areas with the greatest social vulnerability [61,62].
4.2.4. Analysis of the Resilience of the Three Communities
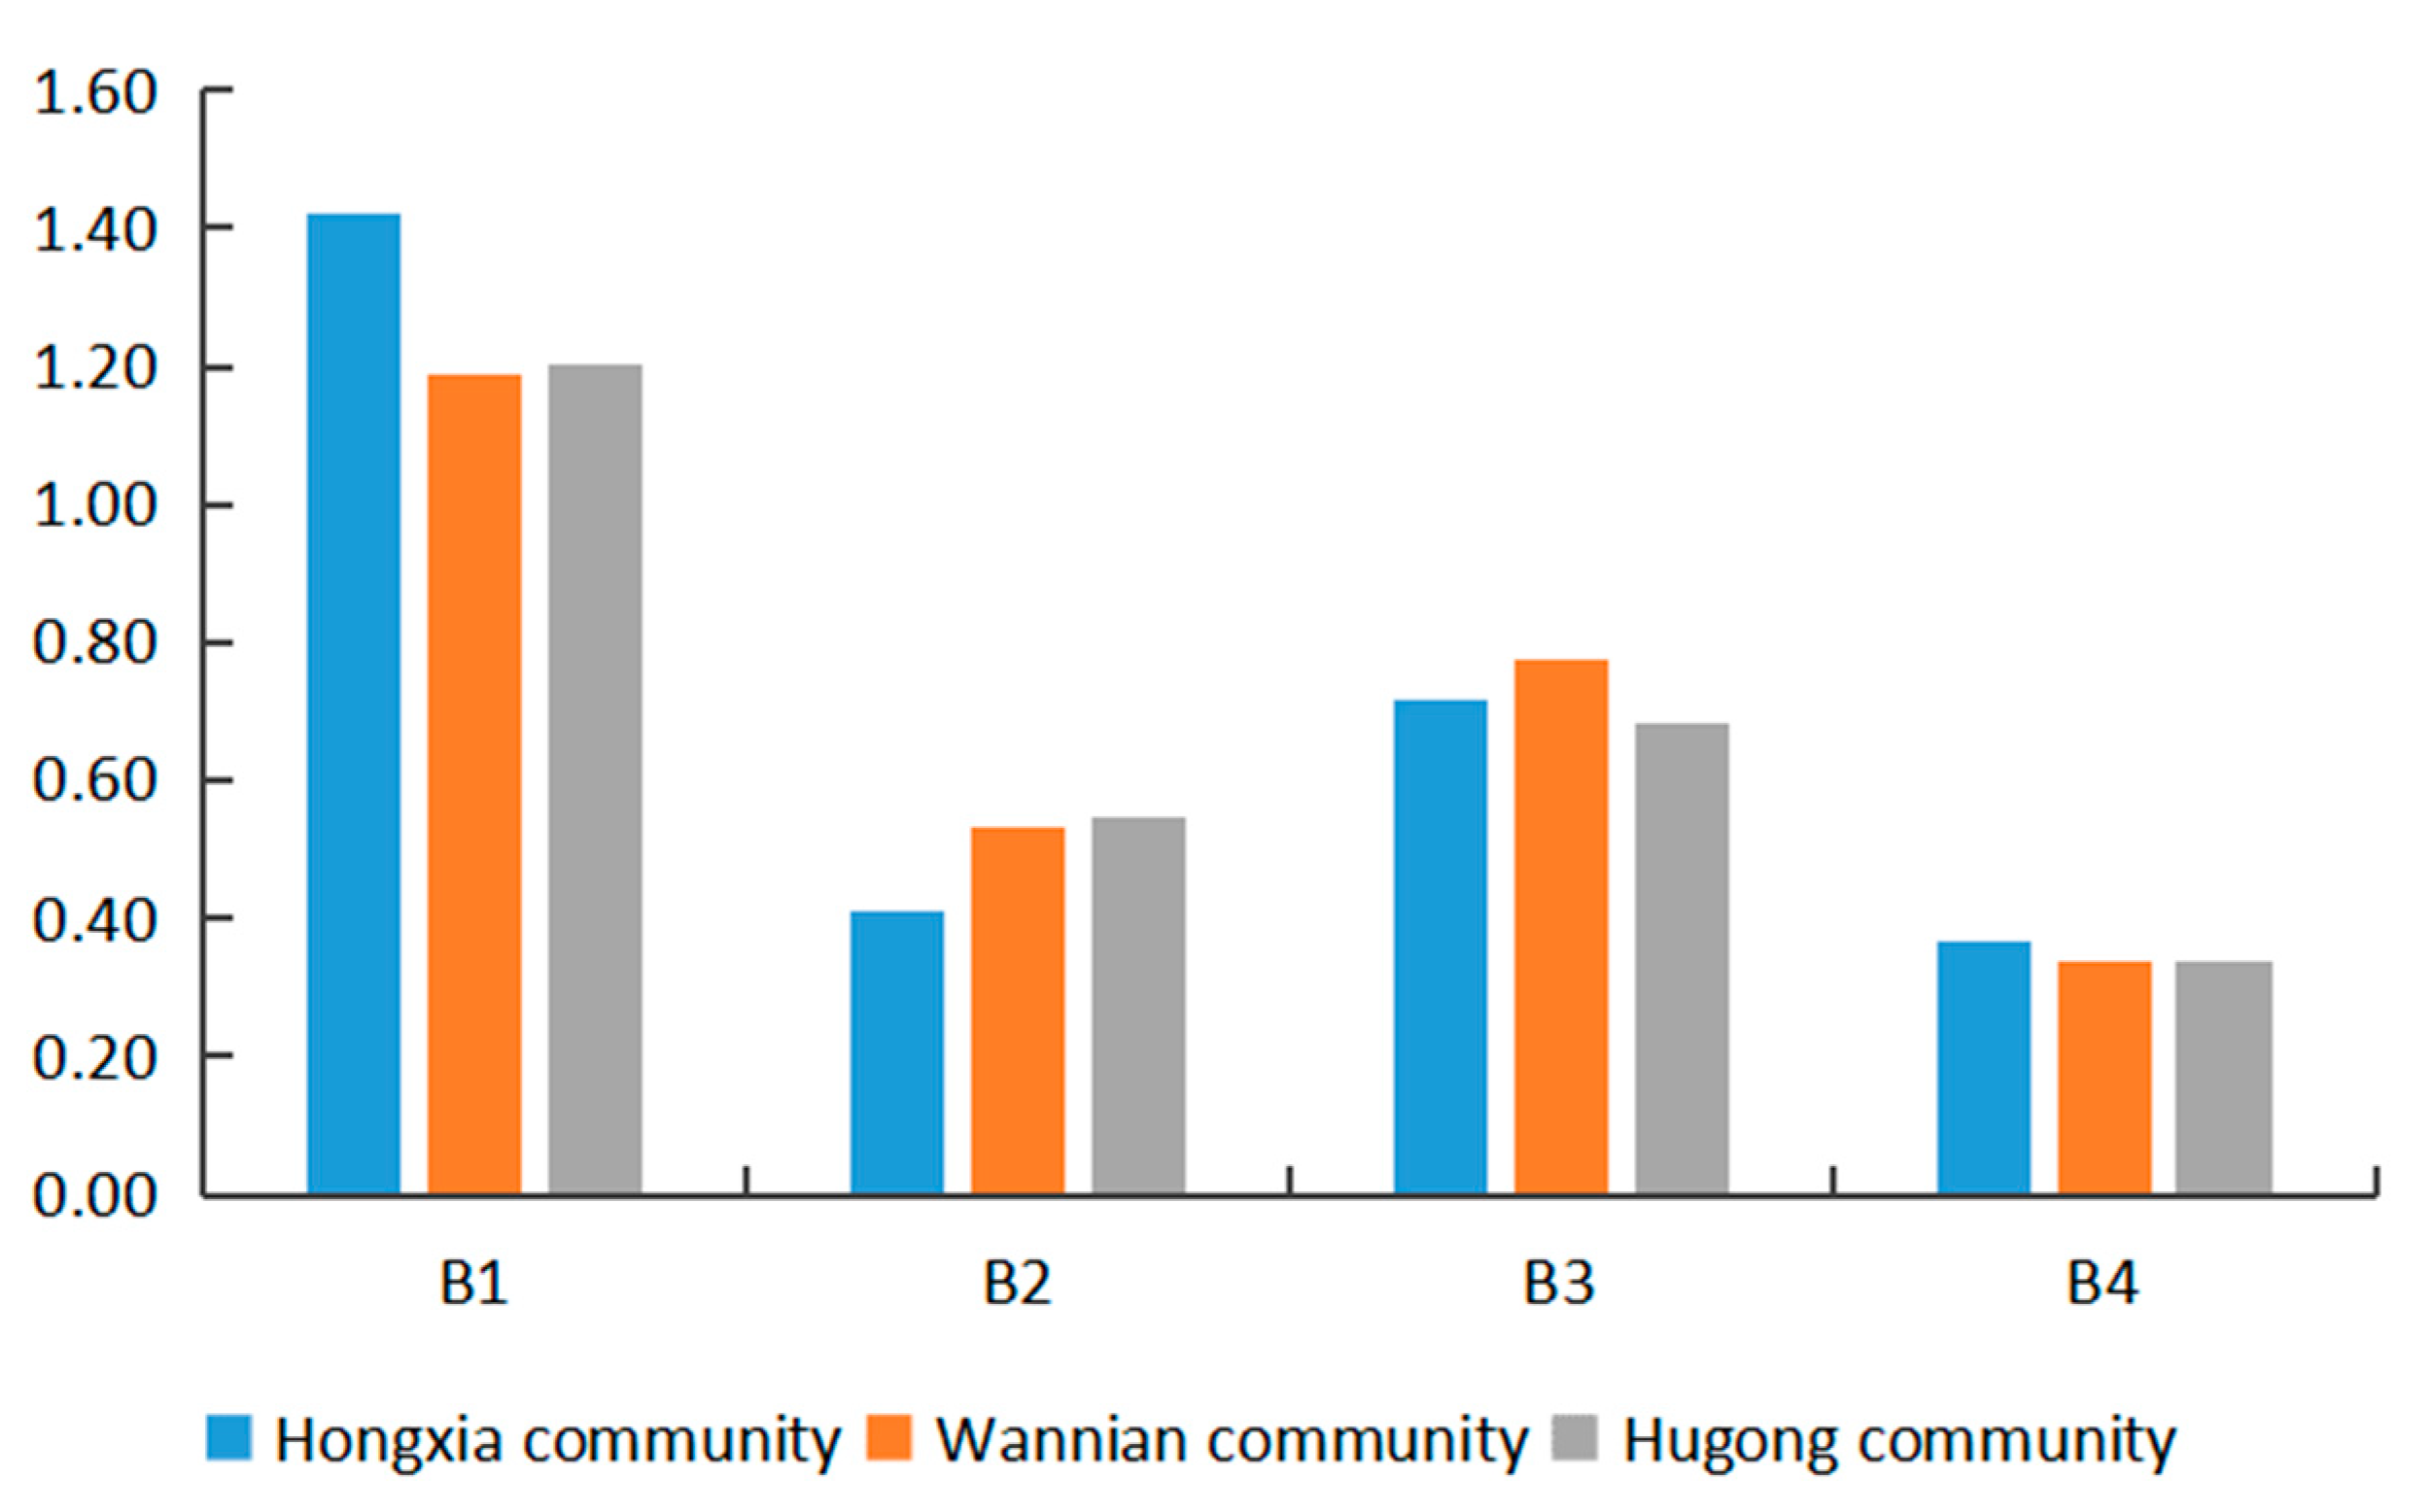
After the above optimization weights were calculated, the resilience indexes of the three communities could be obtained by linear weighting of the values and the collected data. Finally, the total averaged score was calculated, with 2.91 in the urban village, 2.83 in the commercial housing in the old city, and 2.77 in the apartments, respectively. Figure 7 shows that Hongxia community had the best resilience in the community space construction (B1) dimension, since it is a new community, where the community space construction is relatively comprehensive. However, this area was not resilient to the economic development (B2) dimension due to its remote location. Wannian community is located in the center of the city, so it has quite comprehensive community management systems, and abundant resources, which allow a quick response in the event of disasters. These three communities, in which the sense of belonging of the transient population is still weak, suffer poor resilience in terms of the community capital (B4). The priority of community resilience is shown: Hongxia community has the highest level, followed by Wannian community, and the Hugong community is relatively weak at coping with serious disasters.
5. Conclusions
A new framework for comprehensively quantifying different types of transient community resilience to urban flooding has been established. This adopts the use of the RATA and BRIC frameworks by considering the characteristics of the transient population community; differences in the resilience indicators across three communities were distinguished by comparing the weighted values of the three transient population communities [32,45,63]. The resilience of the three communities in different dimensions were also compared and analyzed.
In this work, a weight determination model, combining AHP and a BP neural network, was established, aiming at the limitation of existing weight determination methods by investigating ANN. The analysis shows that the artificial factors of the AHP method are effectively reduced by combining subjective and objective weight determination methods. Moreover, the weight calculated by the AHP–BP neural network and its ranking reflects the connection between disaster resilience and evaluation units of different transient population communities, and its value lays the foundation for the re-calculation of community resilience values. Some major conclusions can be drawn as follows:
- A new framework based on the RATA framework has been developed. Indicators for the characteristics of the transient population were selected according to the BRIC model and used to quantify the community resilience of the transient population. On the strength of a large amount of literature and relevant theories, 16 indicators were confirmed and divided into four dimensions: community space construction (B1), economic development (B2), community management system (B3), and community capital (B4).
- A three-level evaluation network was constructed by using AHP. After the judgment matrix was assigned by experts, Yaahp software was used to calculate the weight directly. Thus, the initial weight was obtained as the basis for calculating the output samples of the BP neural network.
Each indicator is quantified, and the weights of each community were calculated by using the neural network training results. The weights obtained by the AHP–BP neural network model were more effective and practical than those obtained by the expert method. Moreover, the resilience of three transient population communities, namely, urban village, commercial housing, and apartment, were evaluated. On the basis of the results of the three communities, the weights and ranking of various indicators in different transient population communities were also diverse. This demonstrates the need to consider the needs of different communities when developing appropriate interventions to effectively improve community resilience. According to domestic research on the transient population, most cities have similar settlement features and management systems. Thus, these procedures can be incorporated into a new thinking that can promote the evaluation of transient community resilience through the use of multiple indicators, and can generally be applied to other cities with similar economic development and urban management systems. However, the main factors influencing resilience of transient population will change according to the economic development, risk exposure, and vulnerability, as well as other objective factors in the management of the population. Therefore, for future works, we will focus on the application of this assessment approach. It is necessary to apply GIS to help dynamically grasp the changes in the transient population communities in various regions, so as to help governments, environmental agencies, and insurance companies to improve prevention, early warning mechanisms, and mitigation efforts using predictive analytics.
Author Contributions
All authors were involved in the production and writing of the manuscript. Supervision, D.P.; Project administration, W.X., L.X. All authors have read and agreed to the published version of the manuscript.
Funding
The research was funded by the National Natural Science Foundation of China [grant number, 71503194]; the Youth Foundation of Education Department of Hubei Province [grant number, 17Q043]; and the Centre for Service Science and Engineering Foundation of WUST [grant number, CSSE2017GA02].
Conflicts of Interest
The author declare that they have no conflict of interest.
Appendix A

Table A1.
Network output results of Hongxia community.
| Actual Value | Expected Value | Relative Error | Actual Value | Expected Value | Relative Error | ||
|---|---|---|---|---|---|---|---|
| 1 | 3.4214 | 3.4302 | 0.0026 | 45 | 2.2020 | 2.2057 | 0.0017 |
| 2 | 3.2429 | 3.2451 | 0.0007 | 46 | 2.9380 | 2.9391 | 0.0004 |
| 3 | 3.8847 | 3.9445 | 0.0154 | 47 | 3.6868 | 3.6840 | 0.0008 |
| 4 | 3.3722 | 3.3584 | 0.0041 | 48 | 3.8246 | 3.9868 | 0.0424 |
| 5 | 2.6801 | 2.6941 | 0.0052 | 49 | 2.5801 | 2.5581 | 0.0085 |
| 6 | 2.3887 | 2.3915 | 0.0012 | 50 | 2.6227 | 2.6250 | 0.0009 |
| 7 | 1.5867 | 1.5930 | 0.0040 | 51 | 3.6390 | 3.6459 | 0.0019 |
| 8 | 2.1869 | 2.2166 | 0.0136 | 52 | 1.9420 | 1.9861 | 0.0227 |
| 9 | 2.6636 | 2.6409 | 0.0085 | 53 | 2.8374 | 2.8362 | 0.0004 |
| 10 | 3.9586 | 3.9559 | 0.0007 | 54 | 1.7727 | 1.7447 | 0.0158 |
| 11 | 3.2918 | 3.2980 | 0.0019 | 55 | 3.5769 | 3.5824 | 0.0015 |
| 12 | 2.5148 | 2.5180 | 0.0013 | 56 | 2.9398 | 2.9606 | 0.0071 |
| 13 | 2.9569 | 2.9576 | 0.0002 | 57 | 3.8062 | 3.8020 | 0.0011 |
| 14 | 1.9309 | 1.9351 | 0.0022 | 58 | 2.2792 | 2.2385 | 0.0179 |
| 15 | 2.4716 | 2.4667 | 0.0020 | 59 | 2.9588 | 2.9662 | 0.0025 |
| 16 | 3.0864 | 3.0877 | 0.0004 | 60 | 3.5683 | 3.5658 | 0.0007 |
| 17 | 3.0345 | 3.0300 | 0.0015 | 61 | 2.2631 | 2.2530 | 0.0045 |
| 18 | 3.1826 | 3.1599 | 0.0071 | 62 | 2.9783 | 2.9732 | 0.0017 |
| 19 | 3.2114 | 3.2117 | 0.0001 | 63 | 2.1596 | 2.1571 | 0.0011 |
| 20 | 3.1929 | 3.1884 | 0.0014 | 64 | 2.6753 | 2.6615 | 0.0052 |
| 21 | 3.0095 | 3.0281 | 0.0062 | 65 | 2.3528 | 2.3571 | 0.0018 |
| 22 | 3.5865 | 3.5516 | 0.0097 | 66 | 3.4753 | 3.4687 | 0.0019 |
| 23 | 3.7269 | 3.7298 | 0.0008 | 67 | 2.7685 | 2.7808 | 0.0044 |
| 24 | 3.1534 | 3.1419 | 0.0036 | 68 | 3.0236 | 3.0170 | 0.0022 |
| 25 | 3.0238 | 3.0213 | 0.0008 | 69 | 3.4598 | 3.4522 | 0.0022 |
| 26 | 2.8717 | 2.8710 | 0.0003 | 70 | 3.2862 | 3.2884 | 0.0007 |
| 27 | 2.6781 | 2.6705 | 0.0029 | 71 | 3.7371 | 3.8158 | 0.0211 |
| 28 | 3.7230 | 3.7275 | 0.0012 | 72 | 3.1358 | 3.2437 | 0.0344 |
| 29 | 3.0345 | 3.0300 | 0.0015 | 73 | 2.2744 | 2.2689 | 0.0024 |
| 30 | 3.2635 | 3.2416 | 0.0067 | 74 | 1.8827 | 1.8833 | 0.0003 |
| 31 | 2.8606 | 2.8708 | 0.0036 | 75 | 2.7024 | 2.7044 | 0.0007 |
| 32 | 3.6866 | 3.6762 | 0.0028 | 76 | 3.3696 | 3.5116 | 0.0421 |
| 33 | 2.9404 | 2.9298 | 0.0036 | 77 | 3.6349 | 3.8198 | 0.0509 |
| 34 | 3.9055 | 3.9087 | 0.0008 | 78 | 2.1482 | 2.1448 | 0.0016 |
| 35 | 2.7209 | 2.7214 | 0.0002 | 79 | 3.2961 | 3.3057 | 0.0029 |
| 36 | 3.2986 | 3.3217 | 0.0070 | 80 | 3.5409 | 3.5282 | 0.0036 |
| 37 | 1.7651 | 1.7594 | 0.0032 | 81 | 2.5552 | 2.5562 | 0.0004 |
| 38 | 2.9404 | 2.9298 | 0.0036 | 82 | 2.7177 | 2.7102 | 0.0028 |
| 39 | 2.7193 | 2.7131 | 0.0023 | 83 | 3.2244 | 3.2149 | 0.0030 |
| 40 | 2.1626 | 2.1567 | 0.0027 | 84 | 2.5181 | 2.4695 | 0.0193 |
| 41 | 3.2136 | 3.2123 | 0.0004 | 85 | 1.4663 | 1.4598 | 0.0044 |
| 42 | 3.5499 | 3.5463 | 0.0010 | ||||
| 43 | 2.1052 | 2.1146 | 0.0045 | ||||
| 44 | 2.7420 | 2.7393 | 0.0010 |
Table A2.
Network output results of Wannina community.
| Actual Value | Expected Value | Relative Error | Actual Value | Expected Value | Relative Error | ||
|---|---|---|---|---|---|---|---|
| 1 | 3.4541 | 3.4758 | 0.0063 | 47 | 3.3854 | 3.3827 | 0.0008 |
| 2 | 3.3614 | 3.3682 | 0.0020 | 48 | 3.6857 | 3.7541 | 0.0186 |
| 3 | 3.4234 | 3.4238 | 0.0001 | 49 | 2.5147 | 2.5191 | 0.0017 |
| 4 | 2.8415 | 2.8391 | 0.0009 | 50 | 2.5333 | 2.5312 | 0.0008 |
| 5 | 2.1198 | 2.1180 | 0.0008 | 51 | 3.0234 | 3.0197 | 0.0012 |
| 6 | 2.8598 | 2.8352 | 0.0086 | 52 | 2.2789 | 2.2802 | 0.0006 |
| 7 | 1.9119 | 1.8989 | 0.0068 | 53 | 2.8149 | 2.8153 | 0.0002 |
| 8 | 2.1983 | 2.2063 | 0.0036 | 54 | 2.2938 | 2.2928 | 0.0004 |
| 9 | 2.9145 | 2.9118 | 0.0009 | 55 | 3.0886 | 3.0896 | 0.0003 |
| 10 | 3.3972 | 3.3993 | 0.0006 | 56 | 2.8706 | 2.8585 | 0.0042 |
| 11 | 2.8554 | 2.8446 | 0.0038 | 57 | 3.1983 | 3.1919 | 0.0020 |
| 12 | 2.1632 | 2.1705 | 0.0034 | 58 | 2.4848 | 2.4920 | 0.0029 |
| 13 | 2.8317 | 2.8262 | 0.0019 | 59 | 2.9653 | 2.9593 | 0.0020 |
| 14 | 2.3345 | 2.3382 | 0.0016 | 60 | 3.5601 | 3.5658 | 0.0016 |
| 15 | 2.5351 | 2.5399 | 0.0019 | 61 | 2.6126 | 2.6301 | 0.0067 |
| 16 | 3.2169 | 3.2130 | 0.0012 | 62 | 2.6958 | 2.6930 | 0.0010 |
| 17 | 3.0402 | 3.0393 | 0.0003 | 63 | 2.4165 | 2.4193 | 0.0011 |
| 18 | 2.9466 | 2.9385 | 0.0027 | 64 | 2.8039 | 2.8112 | 0.0026 |
| 19 | 2.5968 | 2.6090 | 0.0047 | 65 | 2.5088 | 2.5091 | 0.0001 |
| 20 | 2.8389 | 2.8345 | 0.0015 | 66 | 3.3308 | 3.3308 | 0.0000 |
| 21 | 2.7337 | 2.7322 | 0.0006 | 67 | 2.5944 | 2.5977 | 0.0013 |
| 22 | 3.2974 | 3.3000 | 0.0008 | 68 | 3.0211 | 3.0075 | 0.0045 |
| 23 | 3.4465 | 3.4516 | 0.0015 | 69 | 3.1082 | 3.1001 | 0.0026 |
| 24 | 3.1411 | 3.1429 | 0.0006 | 70 | 3.1932 | 3.1905 | 0.0009 |
| 25 | 2.5904 | 2.5893 | 0.0004 | 71 | 3.3821 | 3.3932 | 0.0033 |
| 26 | 2.5782 | 2.5846 | 0.0025 | 72 | 3.1263 | 3.0997 | 0.0085 |
| 27 | 2.4908 | 2.4923 | 0.0006 | 73 | 2.4448 | 2.4528 | 0.0033 |
| 28 | 3.1711 | 3.1645 | 0.0021 | 74 | 2.1216 | 2.1037 | 0.0084 |
| 29 | 3.0093 | 3.0079 | 0.0005 | 75 | 3.0233 | 3.0096 | 0.0045 |
| 30 | 3.0882 | 3.0862 | 0.0006 | 76 | 3.2820 | 3.2625 | 0.0059 |
| 31 | 2.4454 | 2.4687 | 0.0095 | 77 | 3.1666 | 3.1573 | 0.0029 |
| 32 | 3.2538 | 3.2475 | 0.0019 | 78 | 2.2502 | 2.2522 | 0.0009 |
| 33 | 2.4649 | 2.4647 | 0.0001 | 79 | 3.0056 | 2.9851 | 0.0068 |
| 34 | 3.4236 | 3.4187 | 0.0014 | 80 | 3.0832 | 3.0643 | 0.0061 |
| 35 | 2.5732 | 2.5681 | 0.0020 | 81 | 2.3240 | 2.3303 | 0.0027 |
| 36 | 2.8946 | 2.8858 | 0.0030 | 82 | 2.3130 | 2.3120 | 0.0004 |
| 37 | 2.3181 | 2.2870 | 0.0134 | 83 | 3.1464 | 3.1494 | 0.0010 |
| 38 | 2.4665 | 2.4733 | 0.0028 | 84 | 2.5440 | 2.5464 | 0.0009 |
| 39 | 2.6593 | 2.6569 | 0.0009 | 85 | 2.0437 | 2.0068 | 0.0181 |
| 40 | 2.3299 | 2.3329 | 0.0013 | 86 | 3.1631 | 3.1607 | 0.0008 |
| 41 | 2.5993 | 2.5968 | 0.0010 | 87 | 3.4990 | 3.4979 | 0.0003 |
| 42 | 3.4283 | 3.4338 | 0.0016 | 88 | 2.3916 | 2.3915 | 0.0000 |
| 43 | 2.6221 | 2.6313 | 0.0035 | 89 | 3.0015 | 3.0029 | 0.0005 |
| 44 | 2.4927 | 2.4979 | 0.0021 | 90 | 2.2114 | 2.2048 | 0.0030 |
| 45 | 2.2727 | 2.2745 | 0.0008 | 91 | 3.1162 | 3.0791 | 0.0119 |
| 46 | 2.7947 | 2.7879 | 0.0024 | 92 | 2.3766 | 2.3826 | 0.0025 |
Table A3.
Network output results of Hugong community.
| ž | Actual Value | Expected Value | Relative Error | Actual Value | Expected Value | Relative Error | |
|---|---|---|---|---|---|---|---|
| 1 | 3.2530 | 3.2516 | 0.0004 | 45 | 2.4351 | 2.4379 | 0.0012 |
| 2 | 3.2138 | 3.2173 | 0.0011 | 46 | 2.6833 | 2.6835 | 0.0001 |
| 3 | 3.2778 | 3.2656 | 0.0037 | 47 | 3.2936 | 3.2952 | 0.0005 |
| 4 | 2.9064 | 2.9271 | 0.0071 | 48 | 3.4071 | 3.4222 | 0.0044 |
| 5 | 2.4358 | 2.4364 | 0.0002 | 49 | 2.5726 | 2.5852 | 0.0049 |
| 6 | 2.6098 | 2.6155 | 0.0022 | 50 | 2.4793 | 2.4730 | 0.0025 |
| 7 | 2.1079 | 2.1053 | 0.0012 | 51 | 2.8488 | 2.8435 | 0.0019 |
| 8 | 2.0064 | 2.0029 | 0.0017 | 52 | 2.2839 | 2.2838 | 0.0001 |
| 9 | 2.8102 | 2.8043 | 0.0021 | 53 | 2.7573 | 2.7653 | 0.0029 |
| 10 | 3.3394 | 3.3471 | 0.0023 | 54 | 2.4094 | 2.4066 | 0.0012 |
| 11 | 2.6960 | 2.7070 | 0.0041 | 55 | 2.8411 | 2.8778 | 0.0129 |
| 12 | 2.1600 | 2.1619 | 0.0009 | 56 | 2.8392 | 2.8382 | 0.0003 |
| 13 | 2.9032 | 2.9019 | 0.0004 | 57 | 3.1739 | 3.1722 | 0.0005 |
| 14 | 2.3165 | 2.3579 | 0.0179 | 58 | 2.2950 | 2.2968 | 0.0008 |
| 15 | 2.5893 | 2.5827 | 0.0025 | 59 | 2.9769 | 2.9752 | 0.0006 |
| 16 | 2.7030 | 2.7061 | 0.0011 | 60 | 3.4849 | 3.4970 | 0.0035 |
| 17 | 3.0035 | 3.0007 | 0.0009 | 61 | 2.2205 | 2.2169 | 0.0016 |
| 18 | 2.6707 | 2.6740 | 0.0012 | 62 | 2.6272 | 2.6263 | 0.0004 |
| 19 | 2.5695 | 2.5639 | 0.0022 | 63 | 2.4595 | 2.4585 | 0.0004 |
| 20 | 2.5913 | 2.5940 | 0.0010 | 64 | 2.7986 | 2.8009 | 0.0008 |
| 21 | 2.7725 | 2.7734 | 0.0003 | 65 | 2.6279 | 2.6207 | 0.0028 |
| 22 | 3.3780 | 3.3736 | 0.0013 | 66 | 3.2708 | 3.2704 | 0.0001 |
| 23 | 3.1550 | 3.1486 | 0.0020 | 67 | 2.5379 | 2.5289 | 0.0035 |
| 24 | 3.0771 | 3.0741 | 0.0010 | 68 | 2.8748 | 2.8757 | 0.0003 |
| 25 | 2.7935 | 2.7904 | 0.0011 | 69 | 3.2447 | 3.2360 | 0.0027 |
| 26 | 2.5302 | 2.5158 | 0.0057 | 70 | 3.2571 | 3.2552 | 0.0006 |
| 27 | 2.5602 | 2.5595 | 0.0003 | 71 | 3.0283 | 3.0330 | 0.0015 |
| 28 | 3.0204 | 3.0269 | 0.0022 | 72 | 2.7204 | 2.7246 | 0.0016 |
| 29 | 2.8139 | 2.8097 | 0.0015 | 73 | 2.5634 | 2.5737 | 0.0040 |
| 30 | 2.9959 | 2.9845 | 0.0038 | 74 | 2.2561 | 2.2518 | 0.0019 |
| 31 | 2.3407 | 2.3405 | 0.0001 | 75 | 2.8765 | 2.8778 | 0.0004 |
| 32 | 3.4145 | 3.4345 | 0.0058 | 76 | 3.0691 | 3.0673 | 0.0006 |
| 33 | 2.8866 | 2.8842 | 0.0008 | 77 | 2.9009 | 2.9080 | 0.0025 |
| 34 | 3.4261 | 3.4311 | 0.0015 | 78 | 2.3074 | 2.3067 | 0.0003 |
| 35 | 2.5748 | 2.5681 | 0.0026 | 79 | 2.6606 | 2.6771 | 0.0062 |
| 36 | 2.7824 | 2.7841 | 0.0006 | 80 | 3.0008 | 3.0015 | 0.0002 |
| 37 | 2.3592 | 2.3570 | 0.0009 | 81 | 2.5779 | 2.5799 | 0.0008 |
| 38 | 2.3509 | 2.3542 | 0.0014 | 82 | 2.4635 | 2.4290 | 0.0140 |
| 39 | 2.7688 | 2.7718 | 0.0011 | 83 | 3.0933 | 3.0866 | 0.0022 |
| 40 | 2.3956 | 2.3973 | 0.0007 | 84 | 2.4614 | 2.4655 | 0.0017 |
| 41 | 2.6346 | 2.6367 | 0.0008 | 85 | 2.0013 | 2.0068 | 0.0027 |
| 42 | 3.4012 | 3.3922 | 0.0026 | 86 | 3.2451 | 3.2436 | 0.0005 |
| 43 | 2.3932 | 2.4489 | 0.0233 | 87 | 3.2476 | 3.2095 | 0.0117 |
| 44 | 2.7406 | 2.7354 | 0.0019 | 88 | 2.6318 | 2.6366 | 0.0018 |
Figure A1.
Comparison of output value with expected value in Hongxia community.

Figure A2.
Relative error variation of Hongxia community.

Figure A3.
Comparison of output value with expected value of Wannian community.

Figure A4.
Relative error variation of Wannian community.

Figure A5.
Comparison of output value with expected value of Hugong community.

Figure A6.
Relative error variation of Hugong community.

References
- Khalili, S.; Harre, M.; Morley, P. A temporal framework of social resilience indicators of communities to flood, case studies: Wagga wagga and kempsey, nsw, Australia. Int. J. Disast. Risk Reduct. 2015, 13, 248–254. [Google Scholar] [CrossRef]
- Zhang, H.; Liu, Y.L.; Feng, J.Y. Impact of urbanization quality and urban resilience on flood disaster risk:Based on panel data of 11 prefecture-level cities in Shanxi. Econ. Probl. 2020, 114–120. [Google Scholar]
- Hou, J.; Lv, J.; Chen, X.; Yu, S. China’s regional social vulnerability to geological disasters: Evaluation and spatial characteristics analysis. Nat. Hazards 2016, 84, 97–111. [Google Scholar] [CrossRef]
- Yu, H.L.; Jian, Z. An analysis study on derived calamities of transient population settlement and it’s preventive strategies. Archit. Cult. 2015, 97–99. [Google Scholar]
- Malhi, G.S.; Das, P.; Bell, E.; Mattingly, G.; Mannie, Z. Modelling resilience in adolescence and adversity: A novel framework to inform research and practice. Transl. Psychiatry 2019, 9, 316. [Google Scholar] [CrossRef] [PubMed] [Green Version]
- Lu, P.; Stead, D. Understanding the notion of resilience in spatial planning: A case study of Rotterdam, The Netherlands. Cities 2013, 35, 200–212. [Google Scholar] [CrossRef]
- Shen, J.K.; Wang, Y.C. A framework of urban community planning and design based on the characteristics of resilience. Landsc. Archit. 2017, 98–106. [Google Scholar]
- Holling, C.S. Resilience and stability of ecological systems. Annu. Rev. Ecol. Syst. 1973, 4, 1–23. [Google Scholar] [CrossRef] [Green Version]
- Liang, J.; Li, Y. Resilience and sustainable development goals based social-ecological indicators and assessment of coastal urban areas—A case study of dapeng new district, shenzhen, china. Watershed Ecol. Environ. 2020, 2, 6–15. [Google Scholar] [CrossRef]
- Nguyen, H.L.; Akerkar, R. Modelling, measuring, and visualising community resilience: A systematic review. Sustainability 2020, 12, 7896. [Google Scholar] [CrossRef]
- Tai, H.-S. Resilience for whom? A case study of taiwan indigenous people’s struggle in the pursuit of social-ecological resilience. Sustainability 2020, 12, 7472. [Google Scholar] [CrossRef]
- Cinner, J.E.; Barnes, M.L. Social dimensions of resilience in social-ecological systems. One Earth 2019, 1, 51–56. [Google Scholar] [CrossRef] [Green Version]
- Aldunce, P. Framing disaster resilience. Disaster Prev. Manag. 2014, 23, 252–270. [Google Scholar] [CrossRef]
- Kontokosta, C.E.; Malik, A. The resilience to emergencies and disasters index: Applying big data to benchmark and validate neighborhood resilience capacity. Sustain. Cities. Soc. 2018, 36, 272–285. [Google Scholar] [CrossRef]
- Linkov, I.; Palma-Oliveira, J. Resilience and Risk: Methods and Application in Environment, Cyber and Social Domains; Springer: Berlin, Germany, 2017. [Google Scholar]
- Florin, M.-V.; Linkov, I. IRGC Resource Guide on Resilience; International Risk Governance Center (IRGC): Geneva, Switzerland, 2018. [Google Scholar]
- Cutter, S.L. The changing context of hazard extremes: Events, impacts, and consequences. J. Extrem. Events 2016, 3, 1671005. [Google Scholar] [CrossRef]
- Norris, F.H.; Stevens, S.P.; Pfefferbaum, B.; Wyche, K.F.; Pfefferbaum, R.L. Community resilience as a metaphor, theory, set of capacities, and strategy for disaster readiness. Am. J. Community Psychol. 2008, 41, 127–150. [Google Scholar] [CrossRef] [PubMed]
- Bruneau, M.; Chang, E.S.; Eguchi, R.T.; Lee, G.C.; O’Rourke, D.T.; Reinhorn, A.; Shinozuka, M.; Tierney, K.; Wallace, W.; Winterfeldt, D. A framework to quantitatively assess and enhance the seismic resilience of communities. Earthq. Spectra 2003, 19, 733–752. [Google Scholar] [CrossRef] [Green Version]
- Cutter, S.L.; Barnes, L.; Berry, M.; Burton, C.; Evans, E. Community and regional resilience: Perspectives from hazards, disasters, and emergency management. Geography 2008, 1, 2301–2306. [Google Scholar]
- Building Urban Resilience: Principles, Tools and Practice; World Bank Group: Washington, DC, USA, 2013.
- Holz, E. Trends in Urban Resilience 2017; United Nations Human Settlements Programme: Nairobi, Kenya, 2017. [Google Scholar]
- Moghadas, M.; Asadzadeh, A.; Vafeidis, A.; Fekete, A.; Kötter, T. A multi-criteria approach for assessing urban flood resilience in Tehran, Iran. Int. J. Disast. Risk. Reduct. 2019, 35, 101069. [Google Scholar] [CrossRef]
- United Nations. Transforming Our World: The 2030 Agenda for Sustainable Development; United Nations Human Settlements Programme: Nairobi, Kenya, 2015. [Google Scholar]
- Rossano, L. Hyogo Framework for Action 2005–2015: Building the Resilience of Nations and Communities to Disasters; United Nations: New York, NY, USA, 2011. [Google Scholar]
- Tepper, F. Sendai framework for disaster risk reduction 2015–2030. Int. J. Disast. Risk. Sci. 2015, 210–233. [Google Scholar]
- Adedeji, T.; Proverbs, D.; Xiao, H.; Cobbing, P.; Oladokun, V. Making birmingham a flood resilient city: Challenges and opportunities. Water 2019, 11, 1699. [Google Scholar] [CrossRef] [Green Version]
- Rus, K.; Kilar, V.; Koren, D. Resilience assessment of complex urban systems to natural disasters: A new literature review. Int. J. Disast. Risk. Reduct. 2018, 31, 311–330. [Google Scholar] [CrossRef]
- Li, D.Z.; Wu, J.; Cui, P. Research on the disaster resilience evaluation index system of urban community complex ecosystem. Constr. Econ. 2018, 39, 92–96. [Google Scholar]
- Cutter, S.L.; Barnes, L.; Berry, M.; Burton, C.; Evans, E.; Tate, E.; Webb, J. A place-based model for understanding community resilience to natural disasters. Glob. Environ. Chang. 2008, 18, 598–606. [Google Scholar] [CrossRef]
- Xu, W.; Zhong, M.; Hong, Y.; Lin, K. Enhancing community resilience to urban floods with a network structuring model. Saf. Sci. 2020, 127, 104699. [Google Scholar] [CrossRef]
- Cutter, S.L.; Burton, C.G.; Emrich, C.T. Disaster resilience indicators for benchmarking baseline conditions. J. Homel. Secur. Emerg. 2010, 7, 1271–1283. [Google Scholar] [CrossRef]
- Susan, L.; Kevin, D.; Emrich, C.T. The geographies of community disaster resilience. Glob. Environ. Chang. 2014, 29, 65–77. [Google Scholar]
- Asadzadeh, A.; Kötter, T.; Salehi, P.; Birkmann, J. Operationalizing a concept: The systematic review of composite indicator building for measuring community disaster resilience. Int. J. Disast. Risk. Reduct. 2017, 25, 147–162. [Google Scholar] [CrossRef]
- Cutter, S.; Ash, K.; Emrich, C. Urban–rural differences in disaster resilience. Ann. Am. Assoc. Geogr. 2016, 106, 1236–1252. [Google Scholar] [CrossRef]
- Singh-Peterson, L.; Salmon, P.; Goode, N.; Gallina, J. Translation and evaluation of the baseline resilience indicators for communities on the sunshine coast, Queensland Australia. Int. J. Disast. Risk. Re. 2014, 10, 116–126. [Google Scholar] [CrossRef]
- Macharia, D.K.E.; Kindberg, L.; Koech, G.; Ndungu, L.; Wahome, A.; Mugo, R. Mapping climate vulnerability of river basin communities in tanzania to inform resilience interventions. Sustainability 2020, 12, 4102. [Google Scholar] [CrossRef]
- Hagenlocher, M.; Lang, S.; Hölbling, D.; Tiede, D.; Kienberger, S. Modeling hotspots of climate change in the sahel using object-based regionalization of multidimensional gridded datasets. IEEE J. Sel. Top. Appl. Earth Obs. Remote Sens. 2014, 7, 229–234. [Google Scholar] [CrossRef]
- de Sherbinin, A.; Bukvic, A.; Rohat, G.; Gall, M.; McCusker, B.; Preston, B.; Apotsos, A.; Fish, C.; Kienberger, S.; Muhonda, P.; et al. Climate vulnerability mapping: A systematic review and future prospects. Wires Clim. Chang. 2019, 10, e600. [Google Scholar] [CrossRef]
- Sritart, H.M.H.; Kanbara, S.; Hara, T. Methodology and application of spatial vulnerability assessment for evacuation shelters in disaster planning. Sustainability 2020, 12, 7355. [Google Scholar] [CrossRef]
- Schaefer, M.; Thinh, N.X.; Greiving, S. How can climate resilience be measured and visualized? Assessing a vague concept using gis-based fuzzy logic. Sustainability 2020, 12, 635. [Google Scholar] [CrossRef] [Green Version]
- Sung, C.-H.; Liaw, S.-C. A gis approach to analyzing the spatial pattern of baseline resilience indicators for community (bric). Water 2020, 12, 1401. [Google Scholar] [CrossRef]
- McGill, R. Urban resilience—An urban management perspective. J. Urban Manag. 2020, 9, 372–381. [Google Scholar] [CrossRef]
- Huang, W.; Ling, M. System resilience assessment method of urban lifeline system for gis. Comput. Environ. Urban. Syst. 2018, 71, 67–80. [Google Scholar] [CrossRef]
- O’Connell, D.; Walker, B.; Abel, N.; Grigg, N. The Resilience, Adaptation and Transformation Assessment Framework: From Theory to Application; CSIRO: Canberra, Australia, 2015. [Google Scholar]
- Yang, M.X.; Huang, B.; Cui, C.; Xiao, Z.P. Review and prospect: Urban disaster resilience. Urban. Plan. Forum 2016, 48–55. [Google Scholar]
- Alliance, R. Assessing Resilience in Social-Ecological Systems: Workbook for Practitioners, Version 2.0; The Resilience Alliance: Stockholm, Sweden, 2010; pp. 1–54. [Google Scholar]
- Walker, B.H.; Abel, N.; Anderies, J.M.; Ryan, P. Resilience, adaptability, and transformability in the goulburn-broken catchment, australia. Ecol. Soc. 2009, 14, 1698–1707. [Google Scholar] [CrossRef]
- Li, Y.; Zhai, G.F. China’s urban disaster resilience evaluation and promotion. Planners 2017, 5–11. [Google Scholar]
- Zhou, L.M.; Yuan, W.Q. Disaster management marching toward resilient city. Comp. Econ. Soc. Syst. 2017, 22–33. [Google Scholar]
- Li, Y.L.; Wu, C.; Zhang, X.F. An evaluator’s weight allocation considering network peer effects. J. Manag. Sci. China 2016, 19, 32–44. [Google Scholar]
- Khalil, N.; Kamaruzzaman, S.N.; Baharum, M.R. Ranking the indicators of building performance and the users’ risk via analytical hierarchy process (ahp): Case of malaysia. Ecol. Indic. 2016, 71, 567–576. [Google Scholar] [CrossRef]
- Mahtani, U.S.; Garg, C.P. An analysis of key factors of financial distress in airline companies in india using fuzzy ahp framework. Transp. Res. Part A Pol. Pract. 2018, 117, 87–102. [Google Scholar] [CrossRef]
- Basheer, I.A.; Hajmeer, M. Artificial neural networks: Fundamentals, computing, design, and application. J. Microbiol. Meth. 2000, 43, 3–31. [Google Scholar] [CrossRef]
- Liu, M.; Sun, S.D. Research on method of computing indicator weight for e-commerce development level estimaion based on ann. Soft Sci. 2006, 136–139. [Google Scholar]
- Yang, J.G.; Wang, M.P.; Li, B.Z.; Lyu, Z.-J. Comprehensive evaluation of spindle performance based on ahp and bp neural network. Mach. Des. Manuf. 2012, 272–274. [Google Scholar]
- Xia, J.G.; Shen, W.J. Study on the integrated price in a section demarcated for land expropriation based on the model of the bp neural network. Econ. Geogr. 2007, 1015–1017. [Google Scholar]
- Zhao, J.; Jiandong, P. A study on spatial distribution characteristics of floating population in large central cities based on community scale: A case study of wuhan. Urban. Archit. 2018, 32–35. [Google Scholar]
- Peng, J.D.; Jing, W.J. Analysis of the characteristics of floating population in wuhan—A survey report from 30 typical communities. Rational planning for sustainable development. In Proceedings of the China Urban Planning Annual Conference 2017 (12 Urban and Rural Governance and Policy Studies), London, UK, 5–6 May 2017. [Google Scholar]
- Yu, J.Y.; Zhou, X.J. The realization and application of meta-synthesis. Syst. Eng. Theory Pract. 2002, 22, 26–32. [Google Scholar]
- Wang, Y.; Zhui, L.; Liu, Z. Research on the evaluation of the level of economic integration of floating population in china based on the three stage grey clustering method. Popul. Econ. 2019, 42–56. [Google Scholar]
- Speculum Artium Cundill, G.; Carlos Bezerra, J.; De Vos, A.; Ntingana, N. Beyond benefit sharing: Place attachment and the importance of access to protected areas for surrounding communities. Ecosyst. Serv. 2017, 28, 140–148. [Google Scholar] [CrossRef]
- Meng, L.J.; Yun, Y.X.; Ren, L.J. An existing community disaster relief strategy based on the rata resilience evaluation system-taking the existing community of dongxing road in hedong district, tianjin as an example. Planning for 60 years: Achievements and challenges. In Proceedings of the 2016 China Urban Planning Annual Conference (01 Urban Safety and Disaster Prevention Planning), Shanghai, China, 15–21 August 2016. [Google Scholar]
Figure 1.
Map of the study area (A): Hongxia community; (B): Wannian community; (C): Hugong community.
Figure 1.
Map of the study area (A): Hongxia community; (B): Wannian community; (C): Hugong community.

Figure 2.
Analytic hierarchy process–back propagation (AHP-BP) model of building process diagram.

Figure 3.
The resilience, adaptation and transformation assessment and learning framework. Source: O’ConneH, et al. 2015 [45].
Figure 3.
The resilience, adaptation and transformation assessment and learning framework. Source: O’ConneH, et al. 2015 [45].

Figure 4.
The model of community resilience hierarchy of transient population.

Figure 5.
The construction of the BP model.

Figure 6.
Initial weights of the transient population community resilience to disaster.

Figure 7.
The resilience of three population communities in each dimension.

Table 1.
List of hierarchical structure, and indicator descriptions.
| The Target Layer | The Criterion Layer (Bi) | Symbols (Cij) | The Indicator Layer | Description |
|---|---|---|---|---|
| The transient population community resilience to disaster (A) | Community space construction (B1) | C11 | Construction quality | Disaster prevention level, quality of building facilities |
| C12 | Disaster evacuation capability | The width of the evacuation road meets the demand | ||
| C13 | Emergency shelters | Whether there is a temporary shelter, and its space reasonably | ||
| C14 | Disaster prevention marking system | The completeness of the disaster prevention identification system | ||
| C15 | Lifeline system | Whether the infrastructure is comprehensive | ||
| Economic development (B2) | C21 | Disaster insurance | Household property comprehensive insurance, personal accident insurance, etc. bought by residents to prevent losses caused by natural disasters | |
| C22 | Employment situation | Employment status of transient population, economic income | ||
| C23 | Commercial scale | The number and scale of businesses in the community reflect the community economy | ||
| C24 | Material reserve system | The provision of materials prepared by the community committee in response to the disaster | ||
| Community management system (B3) | C31 | Community committee management | Number, quality, and standard of responsibility of community managers | |
| C32 | Community communication network | Construction of community communication network (Interchange and share information within community) | ||
| C33 | Emergency management | Relevant emergency management regulations, publicity and related drills | ||
| C34 | Disaster prevention publicity and education | The community’s propaganda of disasters, including mobile phone text messages, community banners, bulletin boards, leaflets and other disaster-related reminders, drills, etc. | ||
| Community capital (B4) | C41 | Disaster awareness | Level of knowledge and concern about flood | |
| C42 | Social network relationship | The form and frequency of getting along between neighbors | ||
| C43 | Community attachment | Transient population group’s sense of belonging to a community or place |
Table 2.
Partial samples and results of the urban village community.
| C 11 | C 12 | C 13 | C 14 | C 15 | C 21 | C 22 | C 23 | C 24 | C 31 | C 32 | C 33 | C 34 | C 41 | C 42 | C 43 | Score | |
|---|---|---|---|---|---|---|---|---|---|---|---|---|---|---|---|---|---|
| 1 | 3 | 3 | 3 | 4 | 3 | 5 | 5 | 3 | 3 | 3 | 5 | 3 | 3 | 5 | 3 | 3 | 3.4302 |
| 2 | 3 | 5 | 3 | 3 | 3 | 3 | 3 | 3 | 3 | 3 | 3 | 3 | 3 | 3 | 4 | 3 | 3.2451 |
| 3 | 4 | 5 | 5 | 5 | 4 | 3 | 3 | 3 | 4 | 2 | 5 | 3 | 4 | 4 | 3 | 4 | 3.9445 |
| 4 | 5 | 3 | 5 | 4 | 2 | 5 | 3 | 1 | 3 | 4 | 3 | 3 | 4 | 2 | 2 | 4 | 3.3584 |
| 5 | 3 | 3 | 3 | 2 | 3 | 3 | 3 | 3 | 2 | 3 | 3 | 4 | 3 | 2 | 2 | 3 | 2.6941 |
| 6 | 3 | 3 | 3 | 4 | 2 | 5 | 3 | 1 | 3 | 3 | 1 | 1 | 2 | 1 | 4 | 3 | 2.3915 |
| 7 | 2 | 1 | 1 | 2 | 1 | 1 | 1 | 1 | 1 | 1 | 3 | 1 | 2 | 2 | 3 | 2 | 1.5930 |
| 8 | 3 | 3 | 3 | 1 | 1 | 1 | 3 | 1 | 1 | 3 | 1 | 2 | 1 | 2 | 4 | 3 | 2.2166 |
| 9 | 3 | 3 | 3 | 3 | 2 | 3 | 3 | 3 | 2 | 3 | 3 | 2 | 2 | 2 | 3 | 2 | 2.6409 |
| 10 | 5 | 5 | 3 | 5 | 4 | 5 | 5 | 3 | 3 | 4 | 3 | 4 | 4 | 3 | 3 | 3 | 3.9559 |
| 11 | 4 | 3 | 5 | 4 | 4 | 3 | 3 | 3 | 4 | 3 | 3 | 3 | 3 | 2 | 2 | 2 | 3.2980 |
| 12 | 3 | 3 | 3 | 2 | 2 | 3 | 3 | 3 | 2 | 2 | 3 | 2 | 2 | 1 | 3 | 3 | 2.5180 |
| 13 | 4 | 3 | 3 | 4 | 3 | 1 | 1 | 3 | 2 | 3 | 3 | 3 | 2 | 2 | 3 | 3 | 2.9576 |
| 14 | 3 | 1 | 3 | 2 | 1 | 1 | 1 | 1 | 1 | 3 | 3 | 1 | 1 | 1 | 4 | 3 | 1.9351 |
| … | … | … | … | … | … | … | … | … | … | … | … | … | … | … | … | … | … |
| 85 | 2 | 1 | 1 | 1 | 2 | 1 | 1 | 1 | 1 | 2 | 1 | 2 | 1 | 1 | 2 | 2 | 1.4598 |
Table 3.
Comparison of weights of each model indicator.
| Index | Expert Weights | Rank | Hongxia Community | Rank | Wannian Community | Rank | Hugong Community | Rank |
|---|---|---|---|---|---|---|---|---|
| C11 | 0.1831 | 1 | 0.1103 | 1 | 0.1556 | 1 | 0.1496 | 1 |
| C12 | 0.0971 | 3 | 0.1081 | 2 | 0.0979 | 4 | 0.1187 | 2 |
| C13 | 0.0783 | 5 | 0.0931 | 4 | 0.0751 | 7 | 0.0766 | 6 |
| C14 | 0.0314 | 11 | 0.0407 | 12 | 0.0102 | 16 | 0.0297 | 13 |
| C15 | 0.0688 | 6 | 0.0898 | 5 | 0.0869 | 5 | 0.0595 | 8 |
| C21 | 0.0271 | 15 | 0.0205 | 16 | 0.0332 | 11 | 0.0381 | 11 |
| C22 | 0.0211 | 16 | 0.0277 | 14 | 0.0229 | 14 | 0.0224 | 14 |
| C23 | 0.0659 | 7 | 0.0485 | 10 | 0.0756 | 6 | 0.0835 | 5 |
| C24 | 0.0295 | 12 | 0.0574 | 9 | 0.0377 | 10 | 0.0472 | 9 |
| C31 | 0.0272 | 14 | 0.0583 | 8 | 0.0305 | 13 | 0.0211 | 15 |
| C32 | 0.0588 | 8 | 0.0709 | 7 | 0.0588 | 8 | 0.0731 | 7 |
| C33 | 0.1017 | 2 | 0.0941 | 3 | 0.1291 | 2 | 0.1057 | 3 |
| C34 | 0.0386 | 10 | 0.0412 | 11 | 0.0402 | 9 | 0.0357 | 12 |
| C41 | 0.0924 | 4 | 0.0764 | 6 | 0.1028 | 3 | 0.0840 | 4 |
| C42 | 0.0509 | 9 | 0.0373 | 13 | 0.0317 | 12 | 0.0461 | 10 |
| C43 | 0.0281 | 13 | 0.0255 | 15 | 0.0118 | 15 | 0.0080 | 16 |
© 2020 by the authors. Licensee MDPI, Basel, Switzerland. This article is an open access article distributed under the terms and conditions of the Creative Commons Attribution (CC BY) license (http://creativecommons.org/licenses/by/4.0/).
Share and Cite
MDPI and ACS Style
Xu, W.; Xiang, L.; Proverbs, D. Assessing Community Resilience to Urban Flooding in Multiple Types of the Transient Population in China. Water 2020, 12, 2784. https://doi.org/10.3390/w12102784
AMA Style
Xu W, Xiang L, Proverbs D. Assessing Community Resilience to Urban Flooding in Multiple Types of the Transient Population in China. Water. 2020; 12(10):2784. https://doi.org/10.3390/w12102784
Chicago/Turabian StyleXu, Wenping, Lingli Xiang, and David Proverbs. 2020. "Assessing Community Resilience to Urban Flooding in Multiple Types of the Transient Population in China" Water 12, no. 10: 2784. https://doi.org/10.3390/w12102784
Note that from the first issue of 2016, this journal uses article numbers instead of page numbers. See further details here.