Development of a Hydrological Drought Forecasting Model Using Weather Forecasting Data from GloSea5


1
Department of Civil & Environmental Engineering, Sejong University, 209 Neungdong-ro, Gwangjin-Gu, Seoul 05006, Korea
2
Department of Civil & Environmental Engineering, Juongbu University, 305 Dongheon-ro, Deogyang-gu, Goyang-si, Gyeonggi-do 10279, Korea
*
Author to whom correspondence should be addressed.
Water 2020, 12(10), 2785; https://doi.org/10.3390/w12102785
Submission received: 28 August 2020
/
Revised: 3 October 2020
/
Accepted: 5 October 2020
/
Published: 6 October 2020
(This article belongs to the Section Hydrology)
Abstract
:This study developed a hydrological drought forecasting framework linked to the meteorological model and land surface model (LSM) considering hydrologic facilities and evaluated the feasibility of the Modified Surface Water Supply Index (MSWSI) for drought forecasts in South Korea. The Global Seasonal Forecast System version 5 (GloSea5) and variable infiltration capacity (VIC) models were adapted for meteorological and hydrological models for ensemble weather forecasts and corresponding hydrologic river and dam inflow forecasts, respectively. Instead of direct use for weather and runoff forecasts, the anomaly between the ensemble forecast and hindcast data for each month was computed. Then, the monthly forecasted weather and runoff were obtained by adding this anomaly and the statistical nominal values obtained from the average monthly runoff during the last 30 years. For the selection of drought index duration, past historical observation data and drought records were used, and the 3-month period of the MSWSI outperformed any other durations in the study area. In addition, the simulated monthly river and dam inflows agreed well with the observed inflows; therefore, the model-driven runoff data from the VIC model were usable for hydrological drought forecasts. A case study result for the 2015–2016 drought event demonstrated that the hydrological drought forecasting framework suggested in this study is reliable for drought forecasting up to a 2-month forecast lead time. It is therefore concluded that the proposed framework linked with GloSea5, the VIC model and MSWSI(3) provides useful information for supporting decision-making related to water supply and management.
1. Introduction
Drought forecasting is one of the most important natural disaster problems that humans must deal with, and various methods have been developed by many countries. The Climate Prediction Center (CPC) has provided various kinds of meteorological forecasting information using the Climate Forecast System (CFS), which combines the Medium Range Forecast (MRF) model and the Modular Ocean Model version 3 (MOM3) model, since 2002. For meteorological drought forecasting, the forecasted precipitation and temperature data for mid- to long-term durations were used as input data for meteorological drought indices, such as the Standardized Precipitation Index (SPI) and Palmer Drought Severity Index (PDSI) e.g., [1,2,3,4,5].
Hydrological droughts occur due to a lack of runoff, surface water and groundwater, and they represent the current natural hydrological conditions. Various hydrological drought indices have been used to quantitatively assess hydrological drought conditions e.g., [6,7,8,9]. However, data collection for hydrological drought assessment and forecasting is difficult in basins without gauges due to the lack of required observed and forecasted hydrologic information. Land surface models (LSMs) have been used frequently to solve these problems. Shukla and Wood used the simulated runoff data from LSMs and verified the applicability of the Standardized Runoff Index (SRI) in the United States [10]. Wang et al. used a hydro-agronomic model to assess the changes in drought intensity, frequency and duration using the SRI and Standardized Soil Water Index (SSWI) for hydrological and agricultural drought problems [11]. Tigkas et al. used the simulated results of the Medbasin rainfall–runoff model for the Streamflow Drought Index (SDI) to analyze the hydrological droughts in small basins with narrow topographical characteristics and to assess the change in drought severity considering climate change [12]. Jung and Chang analyzed the spatial variation in the occurrence of hydrological drought with future climate change using the Precipitation Runoff Modeling System (PRMS) and the relative Standardized Runoff Index (rSRI) [13]. In addition, hydrological drought indices have been utilized to account for hydrologic facilities such as reservoirs and dams. Some studies have used the Surface Water Supply Index (SWSI) to include those facilities in hydrological drought assessments e.g., [14,15,16,17]. However, all the studies were limited to assessing hydrological drought conditions and not forecasting.
Meteorological models and LSMs have been linked to obtain the information required for hydrological drought forecasting. The forecasted runoff, soil moisture and groundwater calculated from an LSM are processed to the percentile information of the hydrological drought forecast for each period (6–10 days, 8–14 days, month and season). Luo and Wood at Princeton University (PU) applied ensemble weather forecasting information from Climate Forecast System version 2 (CFSv2) as LSM input data and then calculated the runoff and soil moisture to provide weekly hydrological forecasting information [18]. In addition, several weather forecasting datasets produced by the CFSv2 and the Development of a European Multi-model Ensemble System for Seasonal to Interannual Prediction (DEMETER) models of the European Union were converted to an integrated ensemble system that produces drought forecasting information by linking the hydrologic model for the National Centers for Environmental Prediction/Environmental Modeling Center (NCEP/EMC) in the United States. Additionally, various weather forecasting models have been used to predict hydrological drought. Fundel et al. compared monthly average forecasts of drought indicators using the European Centre for Medium-Range Weather Forecast (ECMWF) model in the Thur River basin [19]. Sheffield et al. developed a drought monitoring and seasonal hydrological forecast system for sub-Saharan Africa using CFSv2 [20]. However, none of these studies considered the condition of hydrologic facilities such as reservoirs and dams.
South Korea, with a temperate climate, has experienced drought damage in the winter and spring seasons. In particular, short-term and long-term droughts usually occur cyclically every 2 to 3 years and every 5 to 7 years, respectively. However, since 2000, a drought has occurred almost every year, and the damage caused by these droughts has increased significantly. In this study, we develop a hydrological drought forecasting framework linked to the meteorological model and LSM considering the hydrologic facilities and evaluate the feasibility of using the modified SWSI in South Korea.
2. Study Area and Data
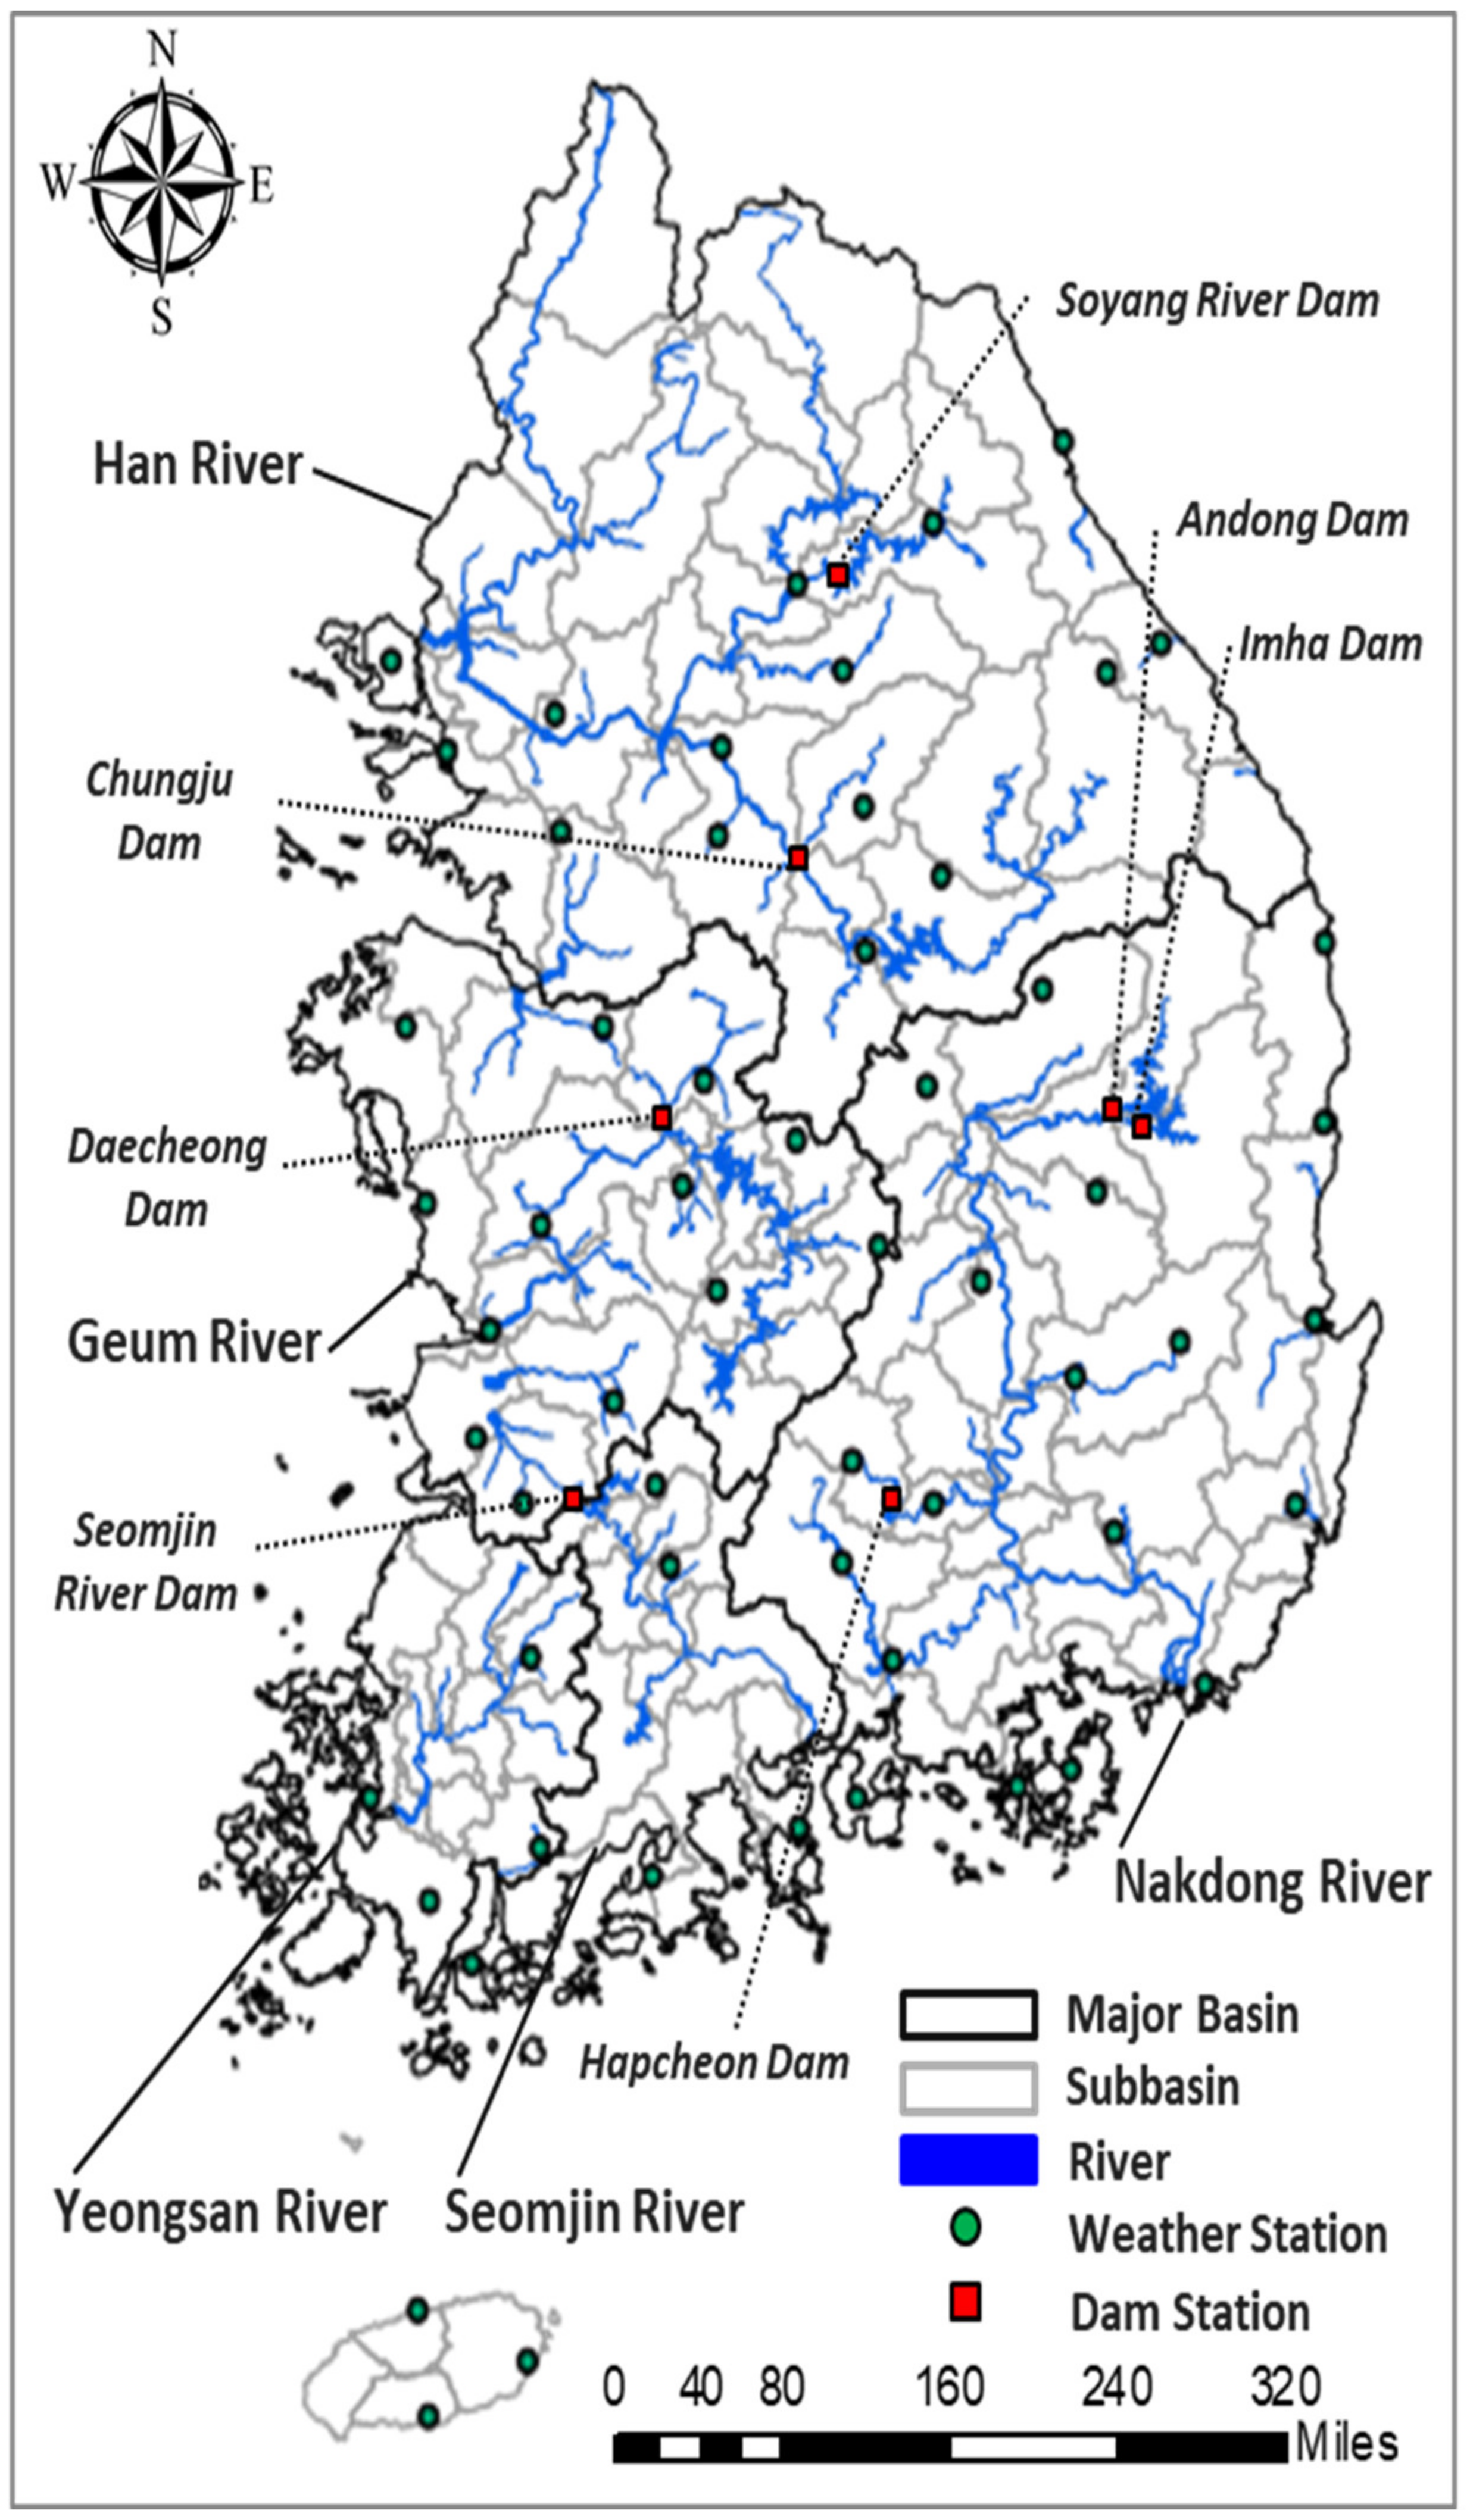
The study area is South Korea, which consists of five major river basins (Han River, Nakdong River, Geum River, Seomjin River and Yeongsan River basins). The locations of the five river basins, six multipurpose dams and 59 weather stations used in this study are presented in Figure 1. The Han River basin is the largest basin with an area of approximately 35,770 km2, and the Nakdong River basin is recognized as the longest river basin with a total length of 525 km. The climate of South Korea is dominated by various geographic and extreme seasonal weather conditions. The seasonal climate of South Korea is affected by the monsoon in summer and Siberian cold weather in winter [21]. The wet season in South Korea constitutes approximately 67% of the annual precipitation from July to September, which causes an increase in the vulnerability to drought during the dry season from October to March [22]. The data periods of observed meteorological and hydrological data were from 1981 to 2016, and those data were collected from the Korea Meteorological Administration (KMA) and Ministry of Land, Infrastructure and Transportation (MOLIT). Additionally, the forecasted meteorological data of the GloSea5 were obtained from the KMA. The hindcast data period of GloSea5 is 1996–2009, and the forecast data period for the case study is 2015 and 2016.
3. Methods of Hydrological Drought Forecasting
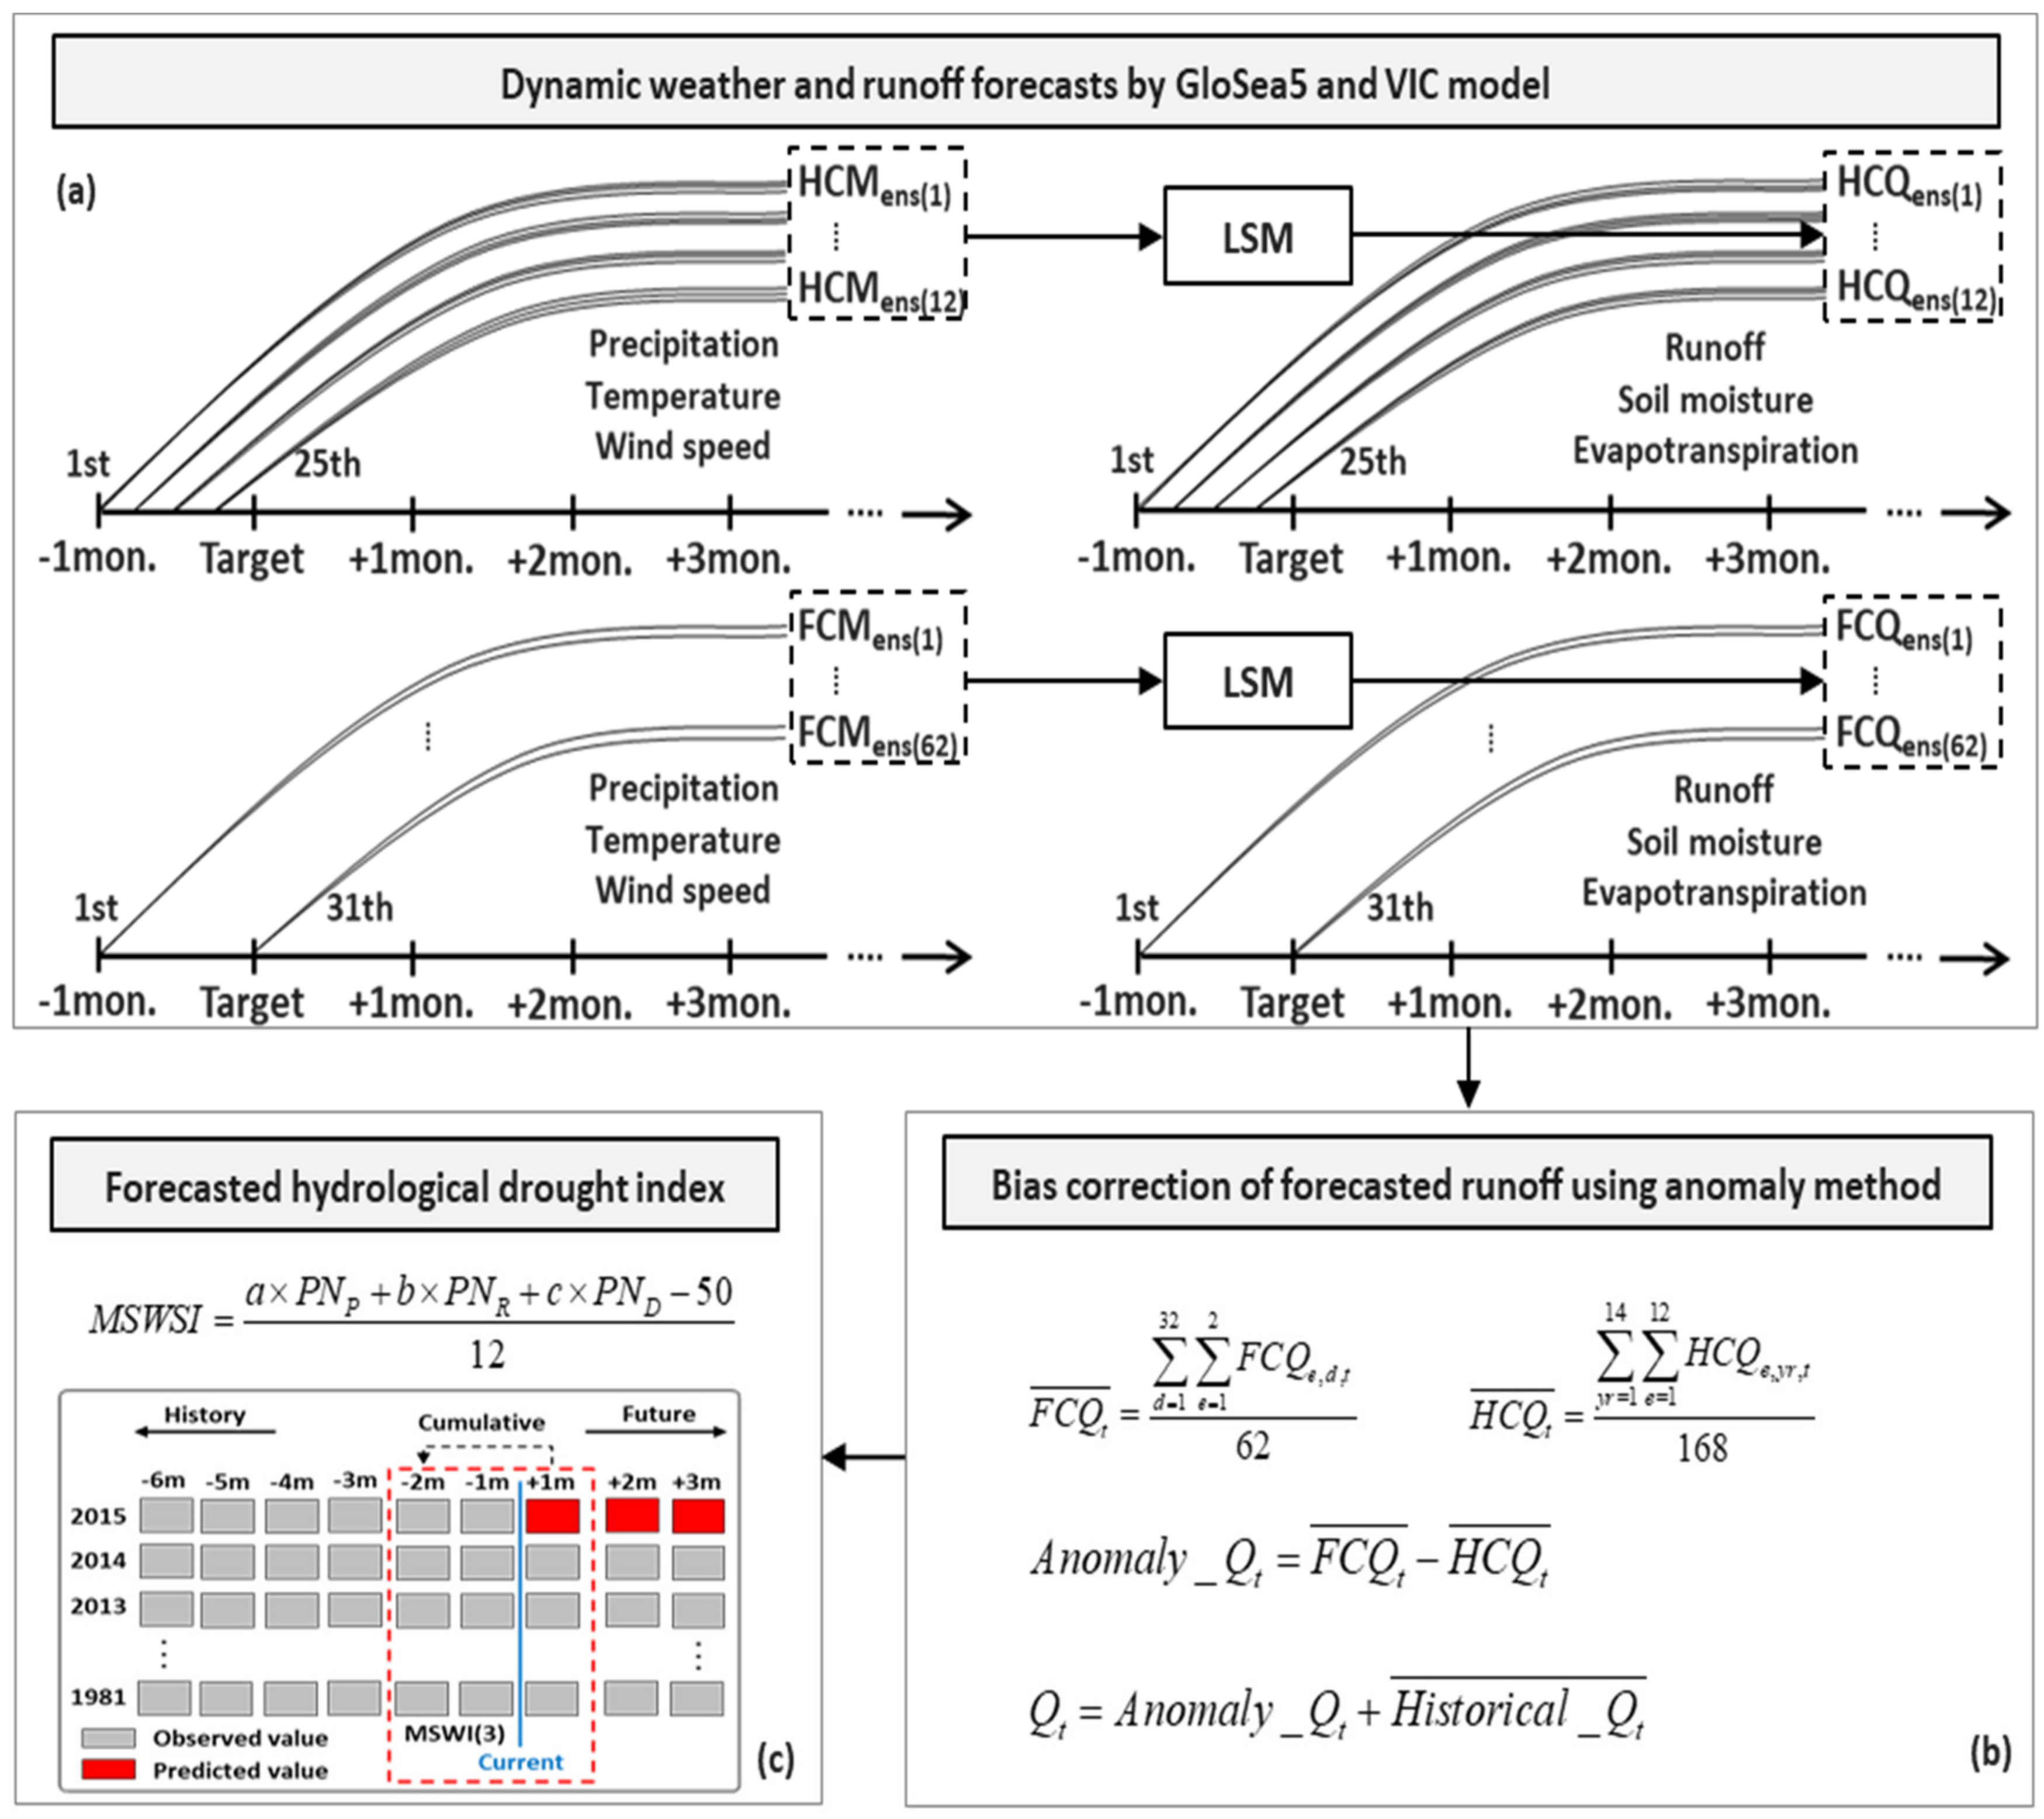
Figure 2 shows the outlines of the hydrological drought forecasting framework proposed in this study. GloSea5 and variable infiltration capacity (VIC) models are used for monthly and seasonal weather forecasting and hydrological runoff forecasting, respectively. The Modified Surface Water Supply Index (MSWSI) is adapted as an indicator of hydrological drought assessment and forecasting.
The GloSea5 model by the Met Office, currently being used for real-time monthly and seasonal weather forecasting work by the KMA, is used for the ensemble weather forecasting component of the hydrological drought forecasting framework. This model was established based on the Hadley Centre Global Environment Model version 3 (HadGEM3), which was used in the latest seasonal climate prediction system of the Met Office. HadGEM3 is a coupled general circulation model that combines atmosphere, ocean, sea ice and land models. The unified model (UM) is used as the atmospheric model, and the Met Office Surface Exchange Scheme is combined with the land models. The Nucleus for European Modeling of the Ocean and the Los Alamos sea ice model are used as the ocean and sea ice models, respectively. Each model is combined for atmosphere–ocean flux exchange using the Ocean Atmosphere Sea Ice Soil (OASIS) coupler [23]. For the monthly and seasonal weather forecast by the KMA, the hindcast (HCST) data of GloSea5 are simulated on the 1st, 9th, 17th and 25th days of each month to produce three ensemble members from an atmospheric analysis field and ocean and sea ice initial fields for each starting day. The 12 ensemble members of HCST data (HCMens(1)–(12)) are obtained for each month. The HCST data period is 14 years, i.e., from 1996 to 2009, and the model integration is conducted for each ensemble member for 7 months. On the other hand, the forecast (FCST) data are simulated to generate two ensemble members every day and to collect 62 ensemble members (FCMens(1) – (62)) each month. The time span of model integration is the same as that of HCST. The detailed characteristics of GloSEa5 are summarized in Table 1. In this study, two types of weather forecast data with precipitation, temperature and wind speed are used as input data for the LSM.
The VIC model developed by Liang et al. was used as the LSM for runoff analysis in this study [24]. This model is a distributed model that simulates water and energy fluxes based on the hydrological process of mutual interactions among the atmosphere, vegetation and soil. This model can be conveniently and directly linked to a meteorological model and allows for the use of a variety of spatial resolutions for model applications. The forecasted ensemble runoffs (FCQens(1)–(62)) for the calculated FCST period include various error sources due to the uncertainties of GloSea5 model parameters and input data. Therefore, instead of the direct use of forecasted ensemble runoffs, the anomaly scheme between FCQens(1)–(62) and HCQens(1)–(168) (hindcasted ensemble runoffs obtained from 12 months × 14 years) is used to reduce the uncertainties of forecasted meteorological and hydrological variables ((1)–(3)).
where and are the average values of the 62 ensembles of and the 168 ensembles of , respectively. The subscripts e, d, t and yr denote the ensemble number, day, month and year, respectively. denotes the nominal runoff value obtained from the average value of monthly runoff during the past 30 years (1981-2010 in this study). The variable in (4) is the forecasted monthly runoff for each month t and is used to estimate the forecasted hydrological drought index. The forecasted monthly runoff is added to create the forecasted cumulative runoff for the forecast lead times.
The MSWSI is used as an index to assess the hydrological drought conditions in this study. The modified version of the original SWSI [14] considers the topographical and hydrometeorological characteristics of South Korea.
where denotes the non-exceedance probability of variable i and subscripts P, R and D indicate the components of precipitation, runoff and dam inflow, respectively. The calculation process of the MSWSI is as follows: 1) calculate the monthly average and maximum values for each hydrological factor, 2) calculate the dimensionless coefficient and sum for each hydrological factor, 3) estimate the first factor according to the input factor and monthly weighting and 4) apply the monthly weighting and re-calculate the sum and dimensionless coefficients. The weighting factor is calculated in consideration of the hydrological factors and monthly contributions according to the seasonal characteristics of each subbasin [15,25]. This study also adopted this method to calculate the weighting coefficients. Table 2 shows the nine classes of the MSWSI.
4. Selection of Drought Index Duration
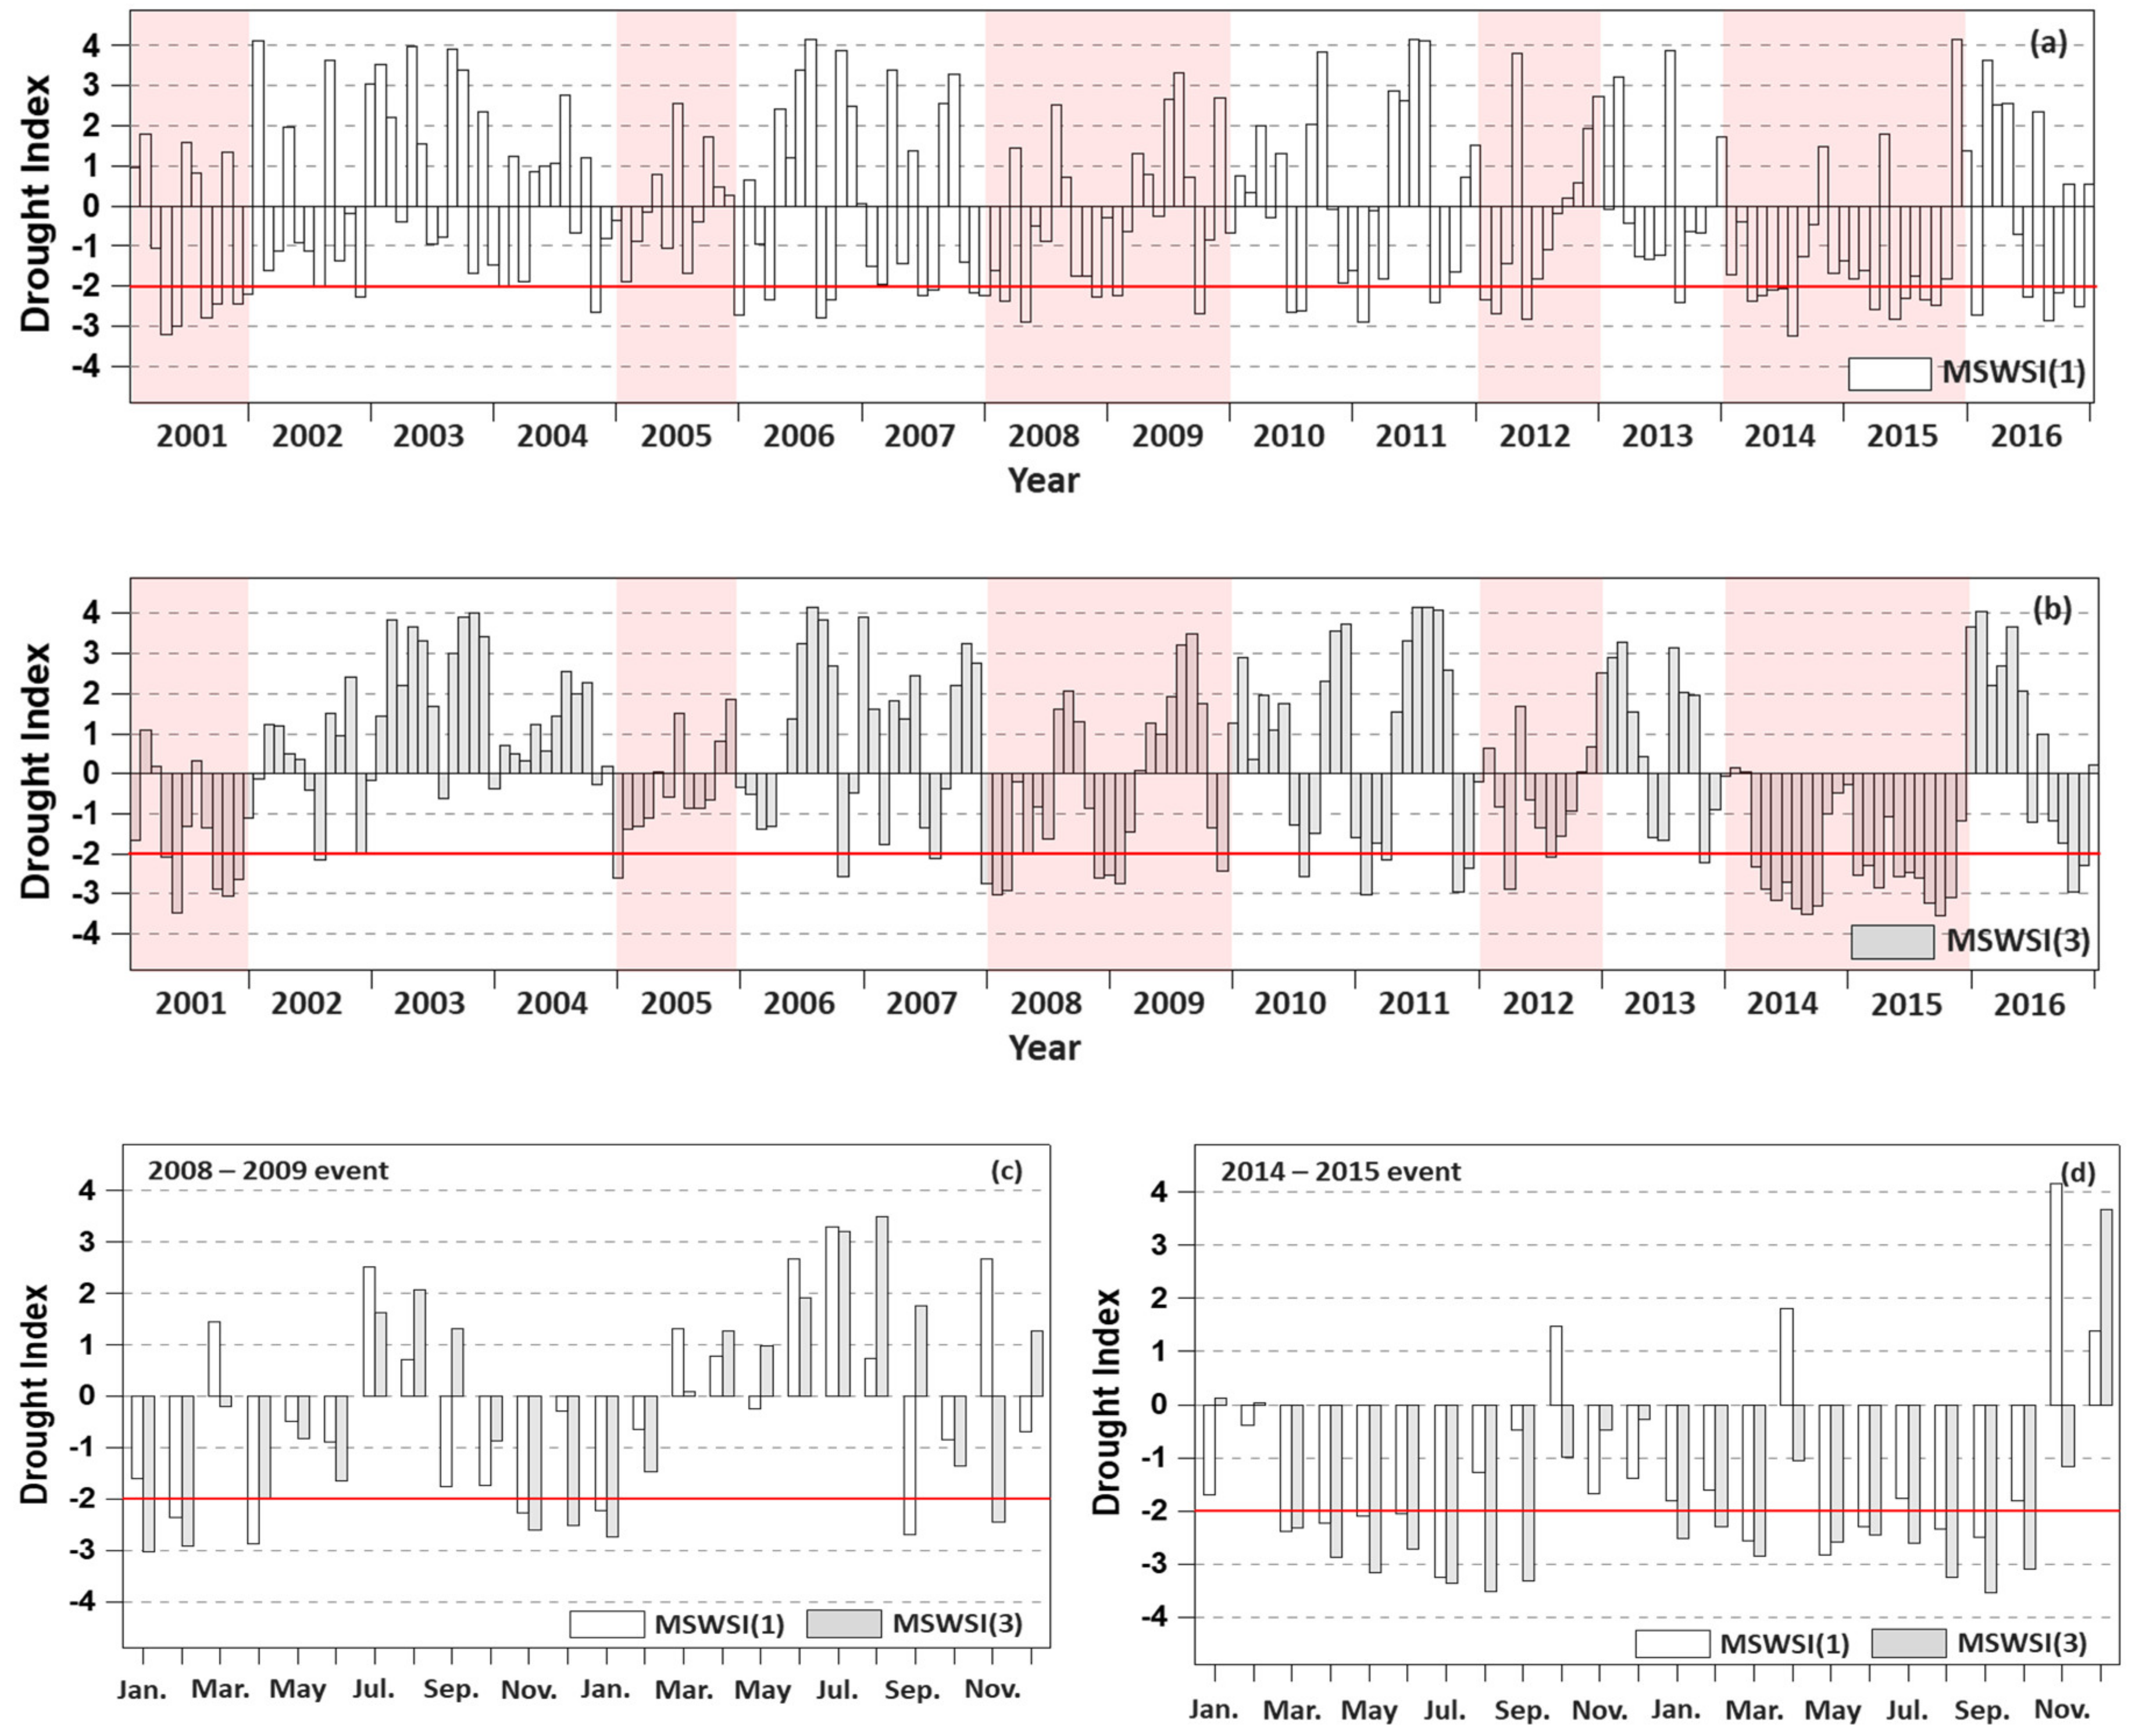
Drought is a temporal water shortage phenomenon that occurs over a relatively long period of time compared to the flood period. The values of the MSWSI(1) obtained from monthly precipitation, river discharge and dam inflow data have been widely used as indicators for judging hydrologic drought conditions. However, it is necessary to determine a reasonable duration of input data for the MSWSI indicator, although the durations are highly dependent on local geographical and hydrometeorological conditions.
In this study, various data durations for the input data of the MSWSI were tested, and as a typical example, the behaviors of MSWSI(1) and MSWSI(3) for 1-month and 3-month durations in the subbasin of the Soyang River dam are shown in Figure 3. As shown in Table 2, the threshold value for moderate drought is −2.0. Unlike MSWSI(1), the values of MSWSI(3) clearly distinguish between dry and wet conditions in the drought events of 2001, 2005, 2008–2009, 2012 and 2014–2015. In particular, MSWSI(1) had difficulty determining the drought intensities and durations because of repeated changes in dry and wet conditions in 2008–2009 and 2014–2015, while MSWSI(3) showed persistent droughts (Figure 3c,d). In this sense, MSWSI(3) is expected to provide a better representation of hydrologic drought conditions considering precipitation, river discharge and dam inflow during 3-month periods.
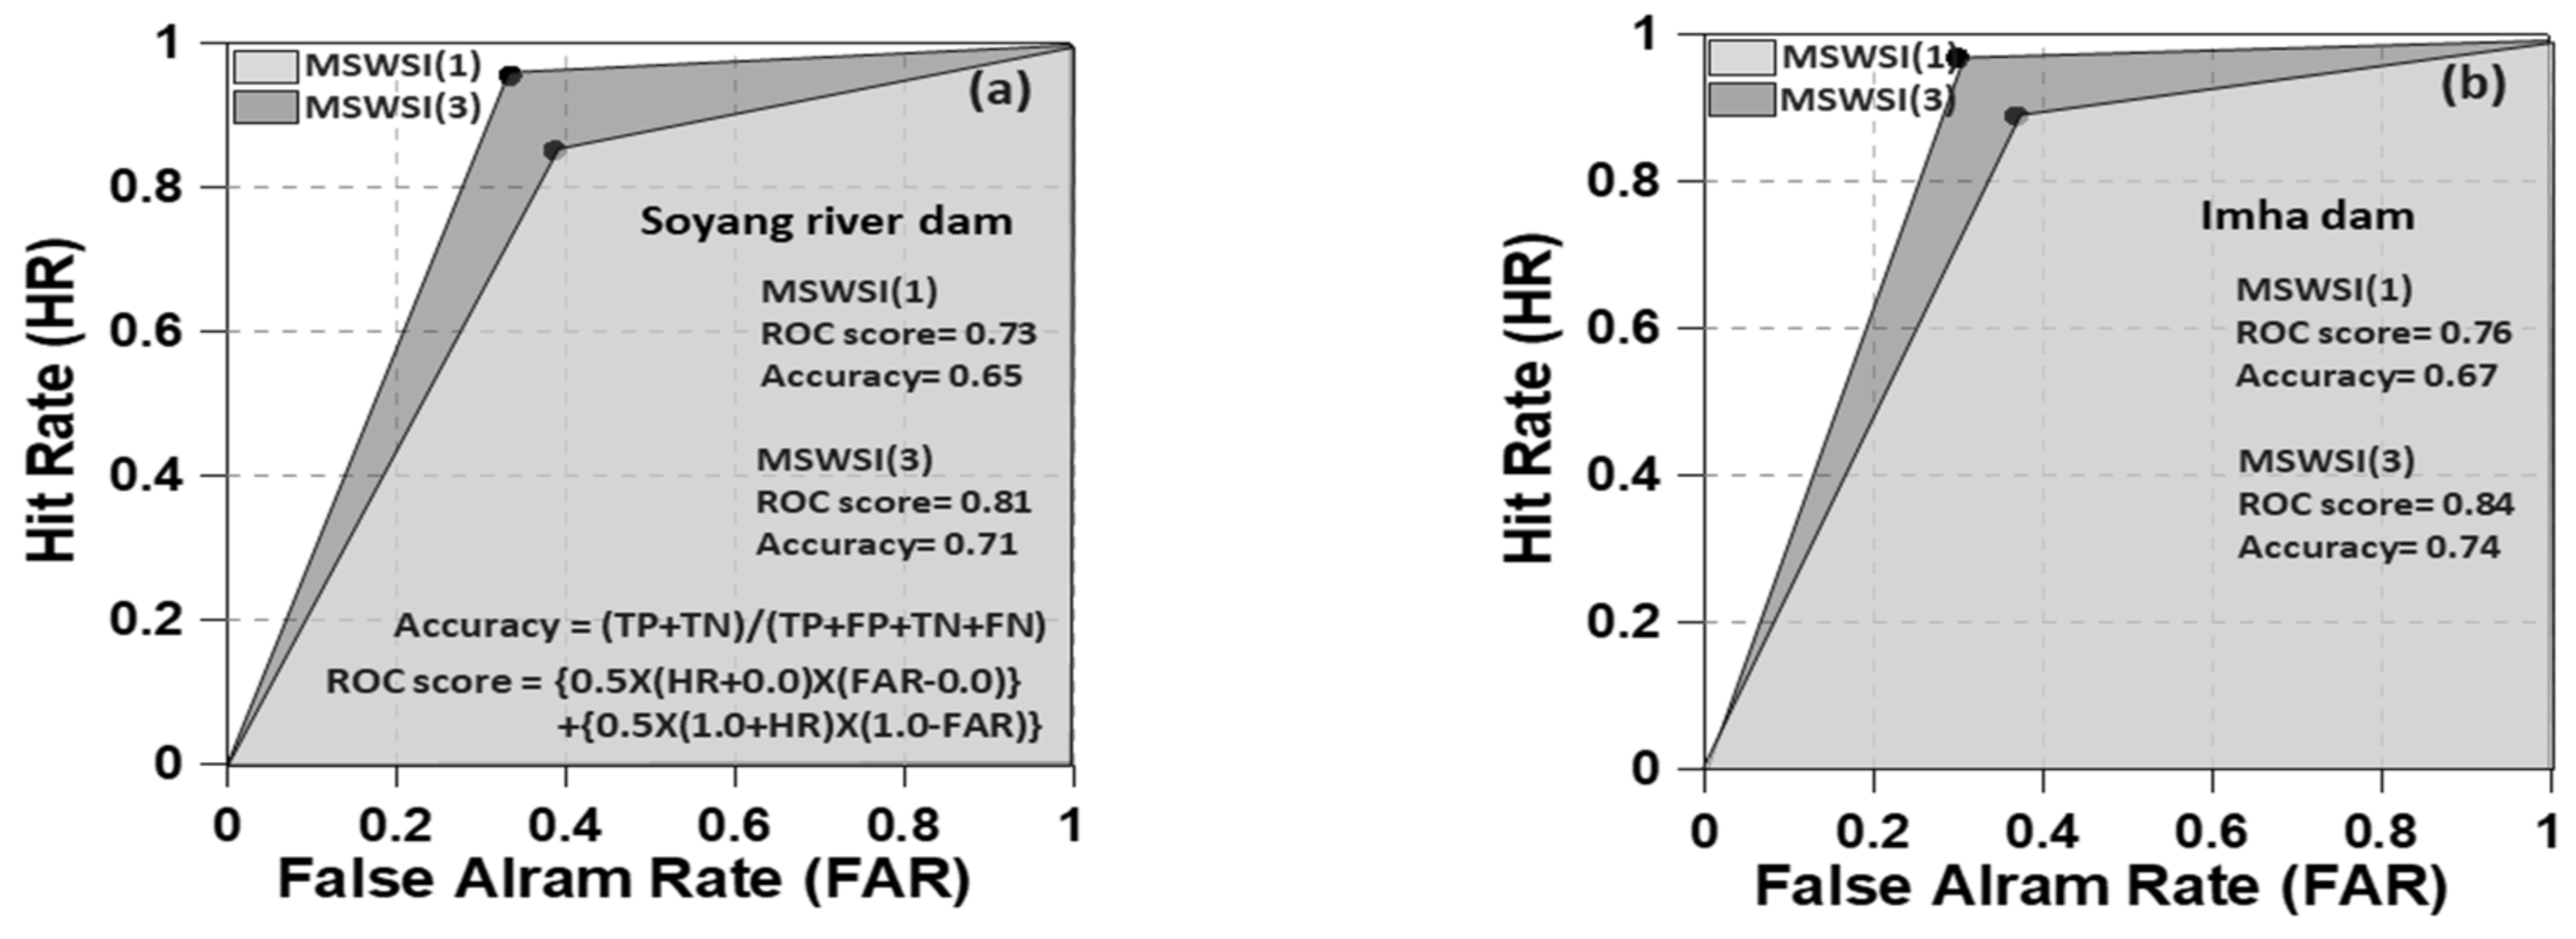
To assess the usability of MSWSI(3), a receiver operating characteristic (ROC) analysis was performed using SPI(3) from 1983–2016. Figure 4 shows the accuracy and ROC scores for the two selected subbasins. Generally, the closer the accuracy is to 1, the greater the usability of the MSWSI is. The accuracy of MSWSI(1) was calculated from 0.65 to 0.67 and the ROC score was from 0.73 to 0.76, while the accuracy of MSWSI(3) was from 0.71 to 0.77 and the ROC score was from 0.81 to 0.86. Therefore, it can be seen that the MSWSI of 3-month durations of hydrological drought prospects was highly available.
5. Land Surface Model (LSM)-Based MSWSI(3) Performance
5.1. Evaluation of Runoff Simulation
The hydrological drought indicator used in this study, MSWSI(3), requires precipitation, runoff and dam inflow data as input data. These observation data for the last 3 months can be used to judge the current hydrologic drought conditions; however, model-driven runoff data should be adapted for the future prediction of hydrologic drought indicators. The VIC model is used to forecast runoff by using the forecasted precipitation of GloSea5. Therefore, it is necessary to evaluate the accuracy of model-driven runoff forecast data compared to the observation data.
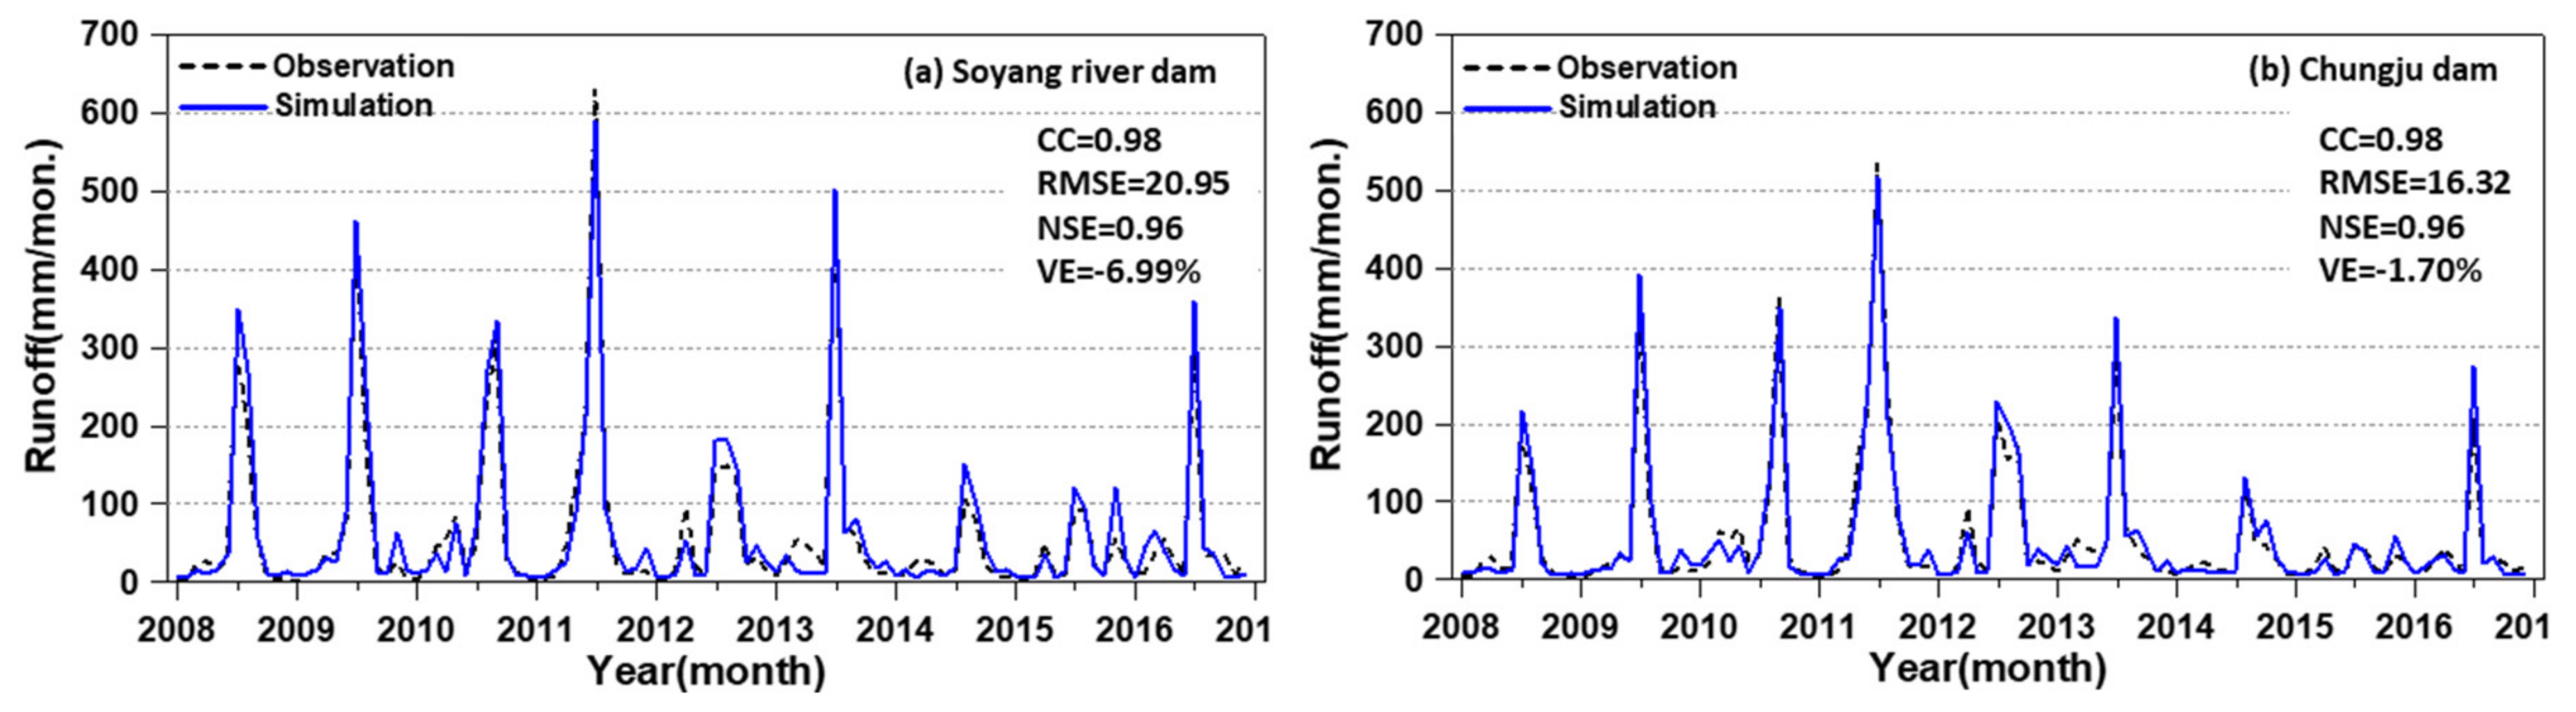
In this study, the VIC model was constructed with a spatial resolution of 1/8° (approximately 12.5 km) over South Korea. The topographic and historical observed meteorological data (e.g., precipitation, maximum and minimum temperature and average wind speed) were adjusted to the gridded data for this resolution, and the daily runoffs were simulated for the period of January 1, 1981–December 31, 2016. The data period of 1981–2007 was used for model calibration and that of 2008–2016 was used for model verification. Figure 5 shows the time series of observed and simulated runoffs for the verification period for the selected subbasins in this study area. As shown in the figure, the simulated runoffs agree well with the observed runoffs. CC, RMSE, NSE and VE in the figure represent the correlation coefficient, root mean square error, Nash–Sutcliffe efficiency and volume error, respectively, and those statistical values are calculated from Table 3.
The statistical results between the simulated and observed runoff show that the CC ranges from 0.96–0.98, RMSE ranges from 14.36–20.95, NSE ranges from 0.82–0.96 and VE ranges from -12.15~-1.70. It can be concluded that the model-driven monthly runoff accumulated from the daily simulated runoffs for each month is acceptable as an input of MSWSI(3) for the future prediction of hydrological drought.
5.2. Evaluation of MSWSI(3) Based On Simulated Runoff
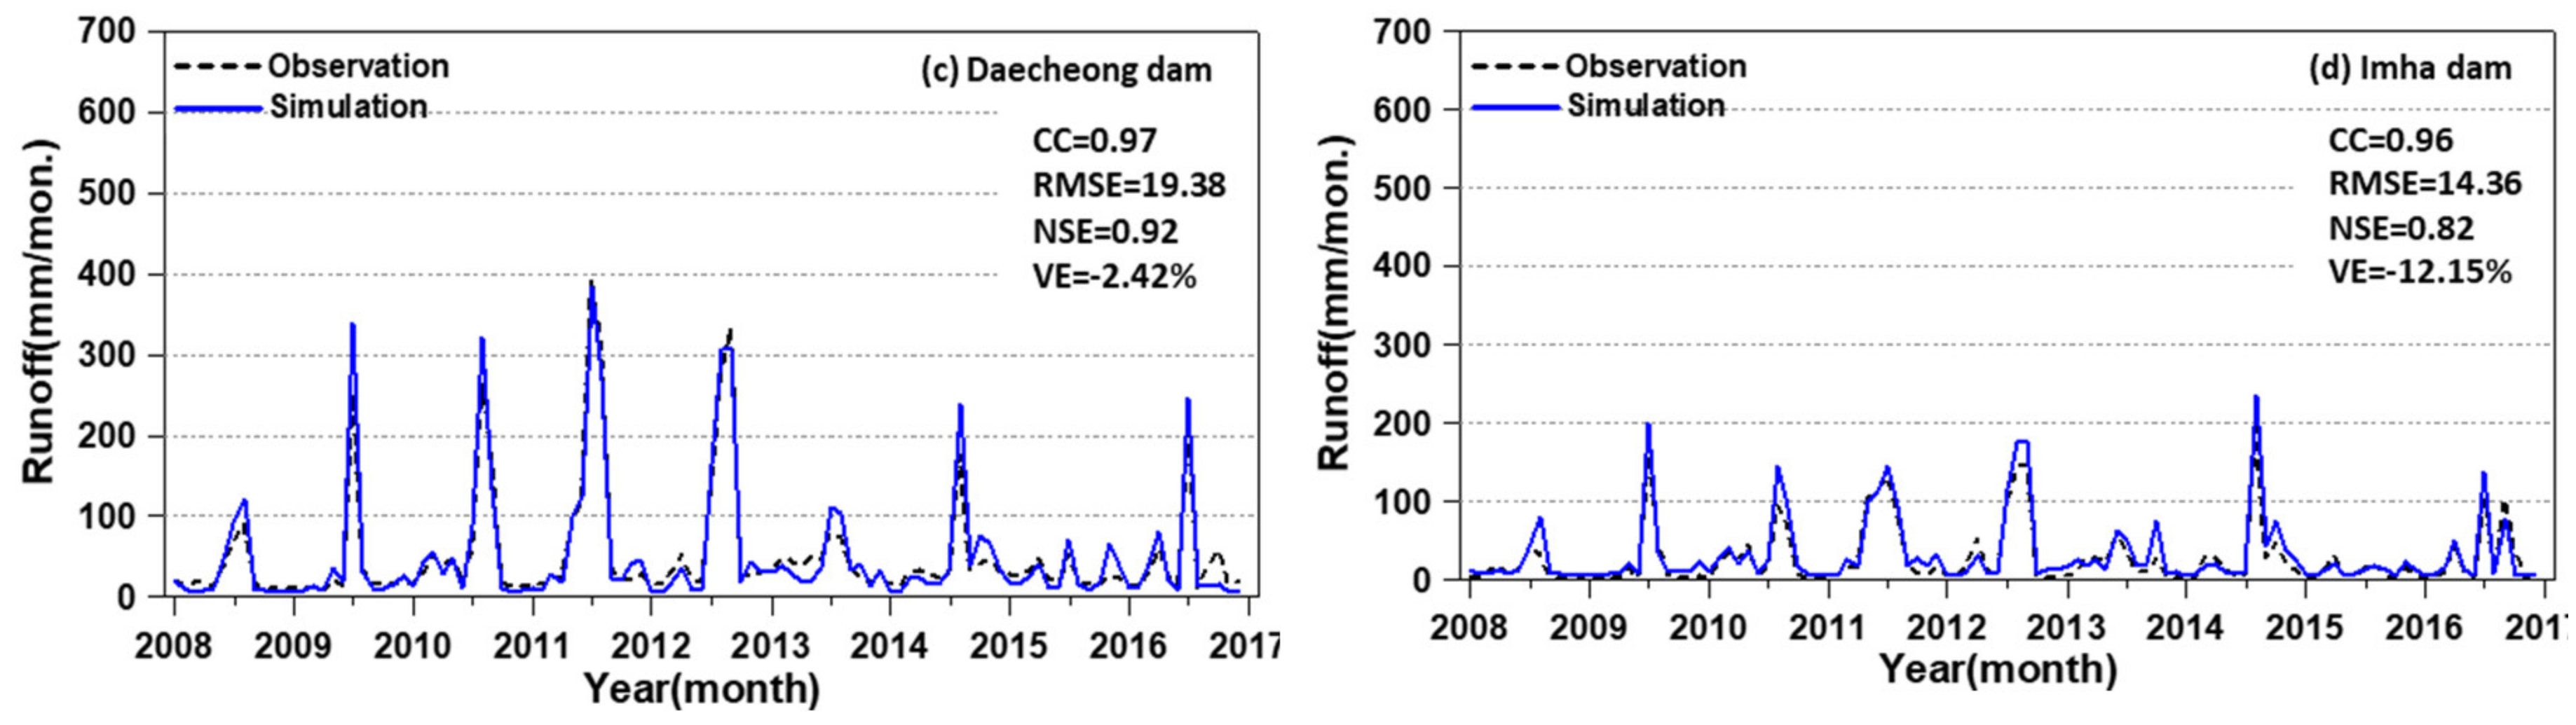
Graphical and statistical analyses were performed to evaluate the performance of MSWSI(3) for the drought period of 2015–2016 (hereafter the 2015-2016 drought) when the simulated and observed runoffs were used. The upper panel of Figure 6 shows the classification of the subbasin depending on the dominant variables in (5) with 60 precipitation basins, 40 river basins and 17 dam basins. The precipitation basins are affected by precipitation only, while the river and dam basins are affected by runoff and dam inflows in addition to precipitation, respectively. The lower panel of Figure 6 represents the values of MSWSI(3) obtained from both observed and simulated data for the three different basin types. The CC and RMSE values of the precipitation subbasin are 1.0 and 0.0, respectively, because the precipitation subbasins require only precipitation data. Moreover, it can be seen that the values of MSWSI(3) obtained by using simulated runoffs agree well with those of observed runoffs for runoff basins and dam basins. The CCs of those values ranged from 0.81–0.90, and the RMSEs ranged from 0.97–1.33. Therefore, it is concluded that the values of MSWSI(3) obtained from simulated runoff are expected to be suitable for hydrological drought prediction.
6. Hydrological Drought Forecasting Performance for 2015-2016 Drought Events
6.1. Predictability Analysis of Forecast Lead Times
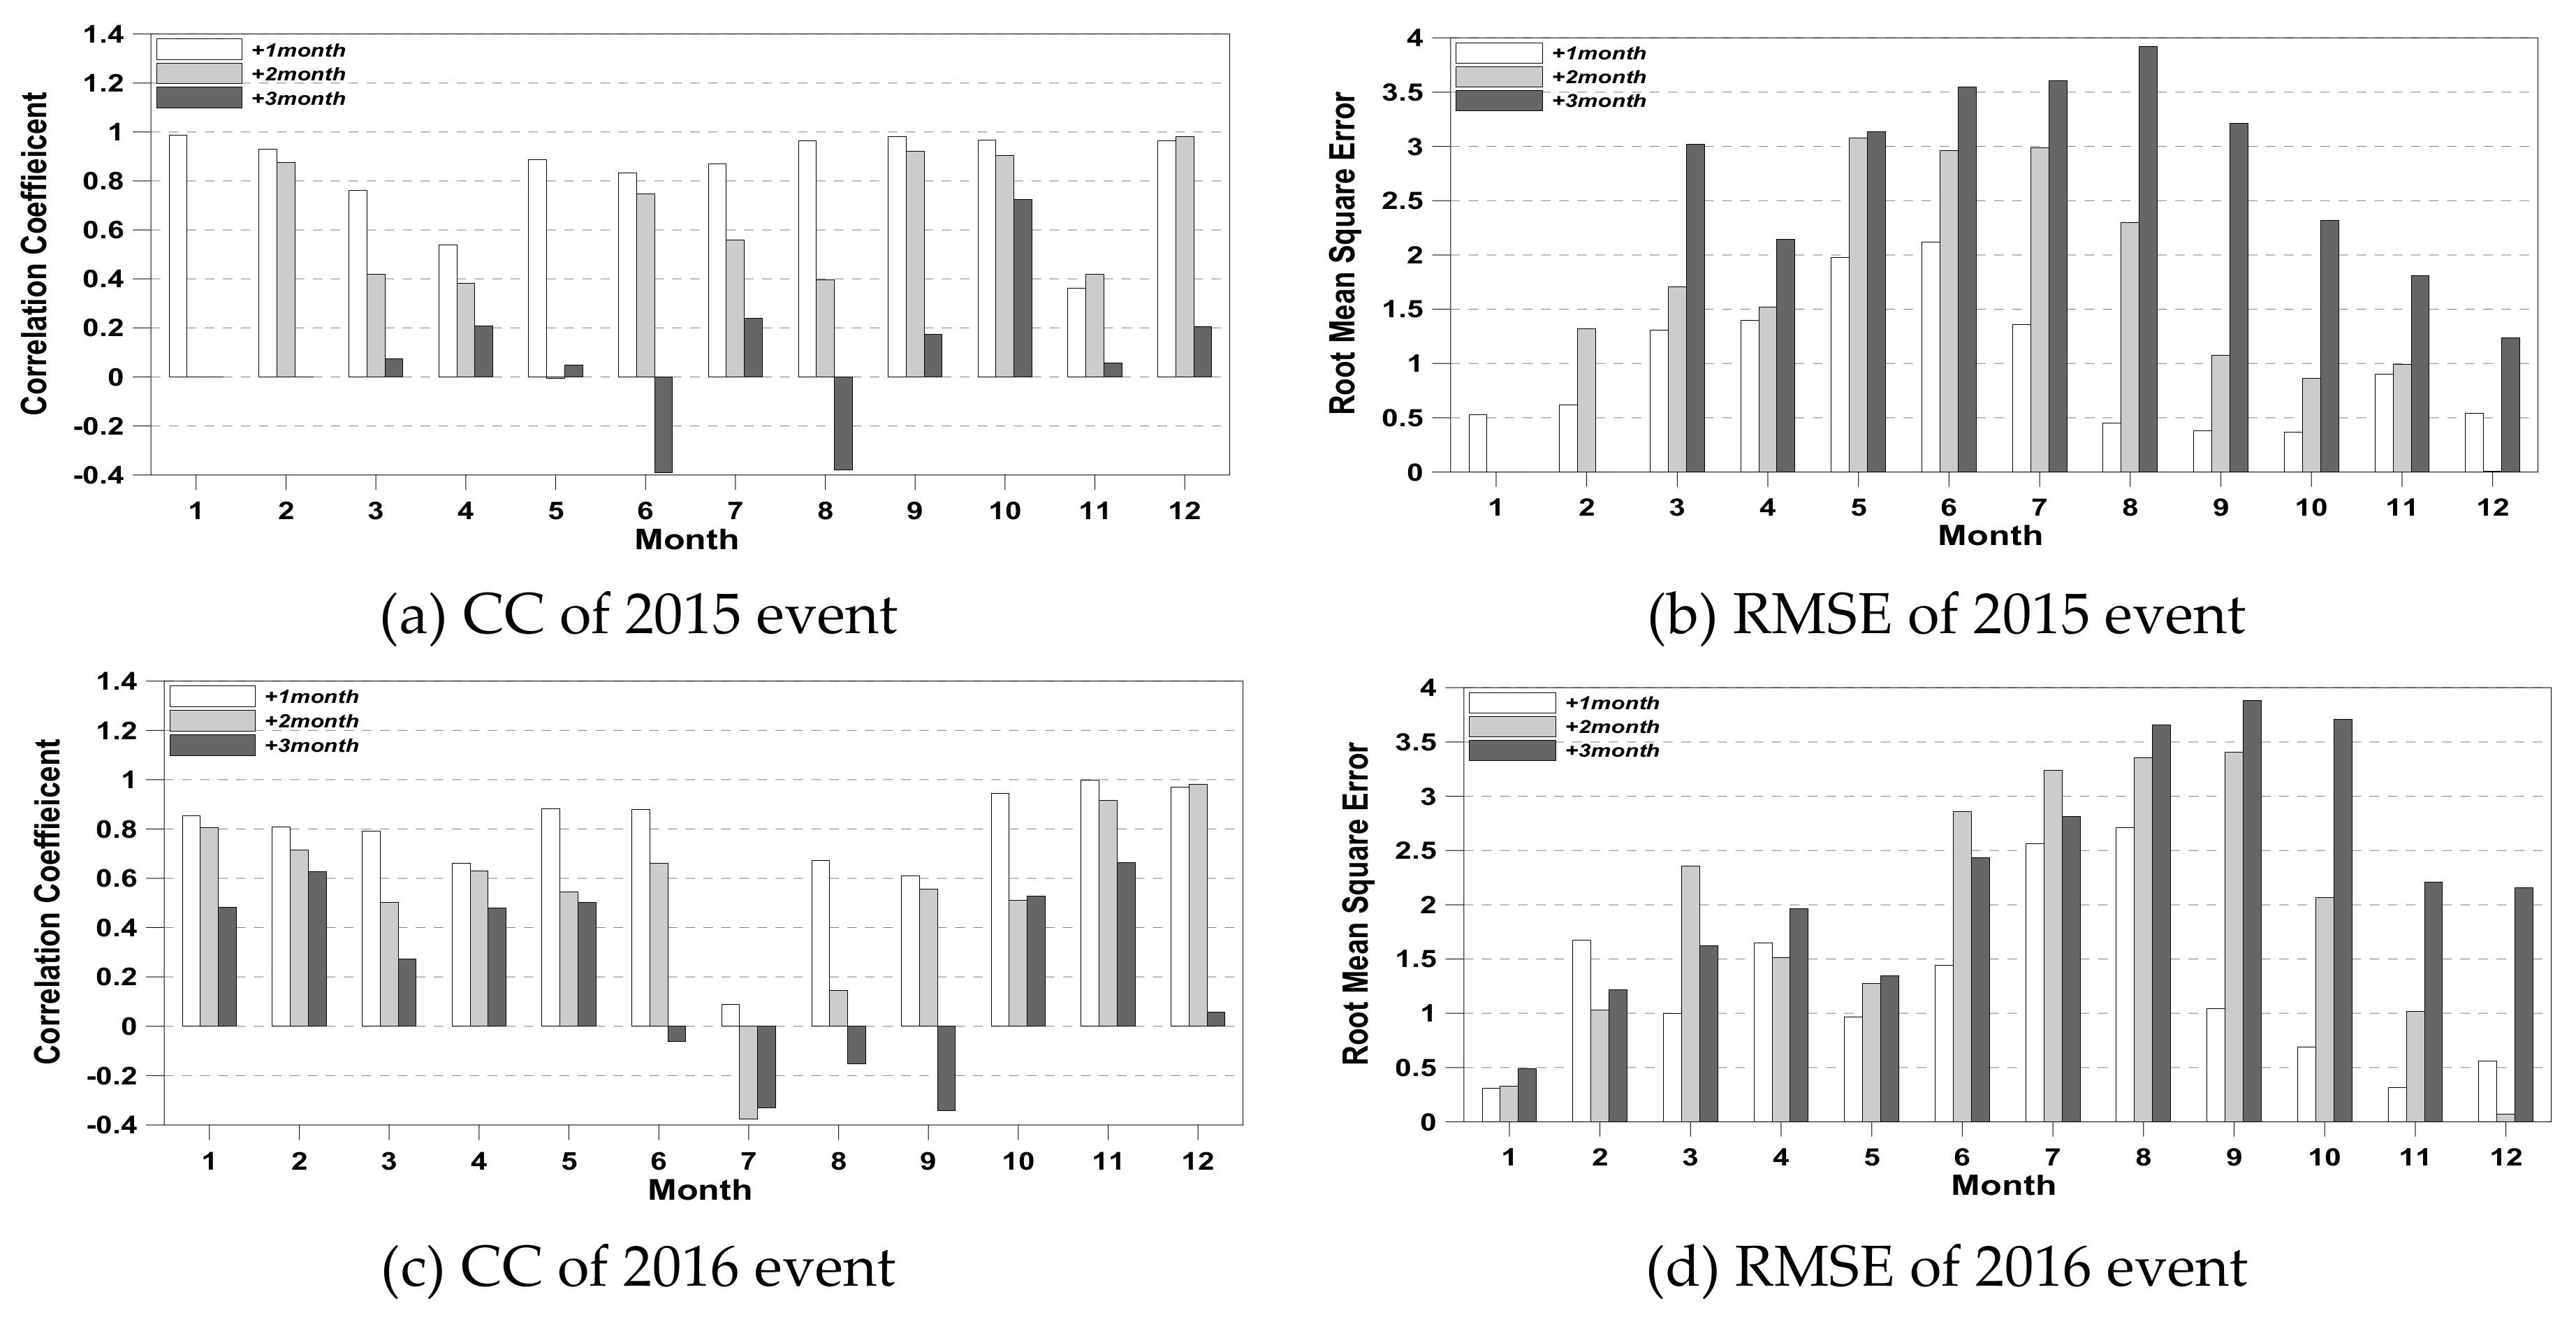
Figure 7 represents the results of the statistical analysis for each month of the 2015-2016 drought period, which was recorded as one of the most severe droughts in South Korea. The CC and RMSE of MSWSI(3) between the observed and forecasted values for 1-month, 2-month and 3-month forecast lead times are computed in this study.
The average CC values for the 2015 drought event were calculated to be 0.84 for the 1-month, 0.60 for the 2-month and 0.10 for the 3-month forecast lead times, while those of the RMSE were 0.99, 1.71 and 2.79 between the forecast value and the observed value, respectively. As shown in the figure, the monthly CC values of MSWSI(3) for the 1-month lead time were estimated to be above 0.8 in all months except March, April and November. Those for the 2-month lead time were predictably higher than 0.8 in February, September, October and December. The reason for the lack of drought predictability in May is that the predicted precipitation of GloSea5 was overestimated by more than 30% compared to the observed precipitation in May. The monthly CC values of MSWSI(3) for the 3-month lead time were below 0.4, which indicates less predictability in all months except October. In particular, the real situations in June and August 2015 increased the drought area and severe drought over time, but the forecasted values of the drought indicator provided wet conditions due to the lower accuracy of the precipitation forecasting. In addition, the monthly RMSEs of the MSWSI(3) values for the 1-month lead time were calculated to be less than 1.0 in all months except for April and July, indicating a small difference between the forecasted and observed values. The monthly RMSEs of the MSWSI(3) values for the 2-month lead time were calculated as less than 1.0 in all months except September and December. However, the monthly RMSEs of the MSWSI(3) values for the 3-month lead time were calculated as greater than 1 for all months, indicating a large difference between the forecasted and the observed values.
On the other hand, the average CC values for the 2016 drought event between the observed and forecasted MSWSI(3) values were calculated to be 0.76 for the 1-month, 0.55 for the 2-month and 0.23 for the 3-month forecast lead times, while those of RMSE were calculated to be 1.24, 1.88 and 2.29, respectively. The monthly CC values of MSWSI(3) for the 1-month lead time were estimated to be greater than 0.8 in all months except April, July, August and September. However, the CC value of July was found to be significantly less predictable than that in any other month, with a value of 0.09. This result is associated with the low predictability of precipitation and runoff for the 1-month forecast lead time. The observed precipitation in July was less than that of the normal year; therefore, the runoff was small. Moreover, the predicted precipitation from GloSea5 in July was 40% higher than the observed precipitation; thus, the predicted runoff was overestimated compared to the observed runoff. Those for the 2-month lead time had higher predictability in November and December with values that were greater than 0.8 and lower predictability in July and August. The monthly CC values of MSWSI(3) for the 3-month lead time were below 0.8 for all months. In particular, it was found that CC values were less than zero in the June–September period. Actually, the MSWSI(3) values based on observation data in the June–September period indicated dry conditions, whereas the MSWSI(3) values based on prediction data indicated wet conditions. This result is due to the low predictability of precipitation and dam inflow during the 3-month lead time because the precipitation and dam inflow were overestimated compared to the observed values. In addition, the monthly RMSEs of MSWSI(3) for the 1-month lead time were calculated to be less than 1 for all months except February, June and September, indicating a small difference between the forecasted and the observed values. Those for the 2-month lead time were more than 1 for all months except for February, November and December, and those for the 3-month lead time were calculated as more than 1.0 for all months.
It can be concluded that the predictability of hydrological drought for the 1-month lead time is fairly reasonable, with average CC values of 0.84 and 0.76, and that for 2-month lead times is acceptable, with average CC values of 0.60 and 0.55 for the drought events in 2015 and 2016, respectively.
6.2. Predictability Analysis for Basin Types
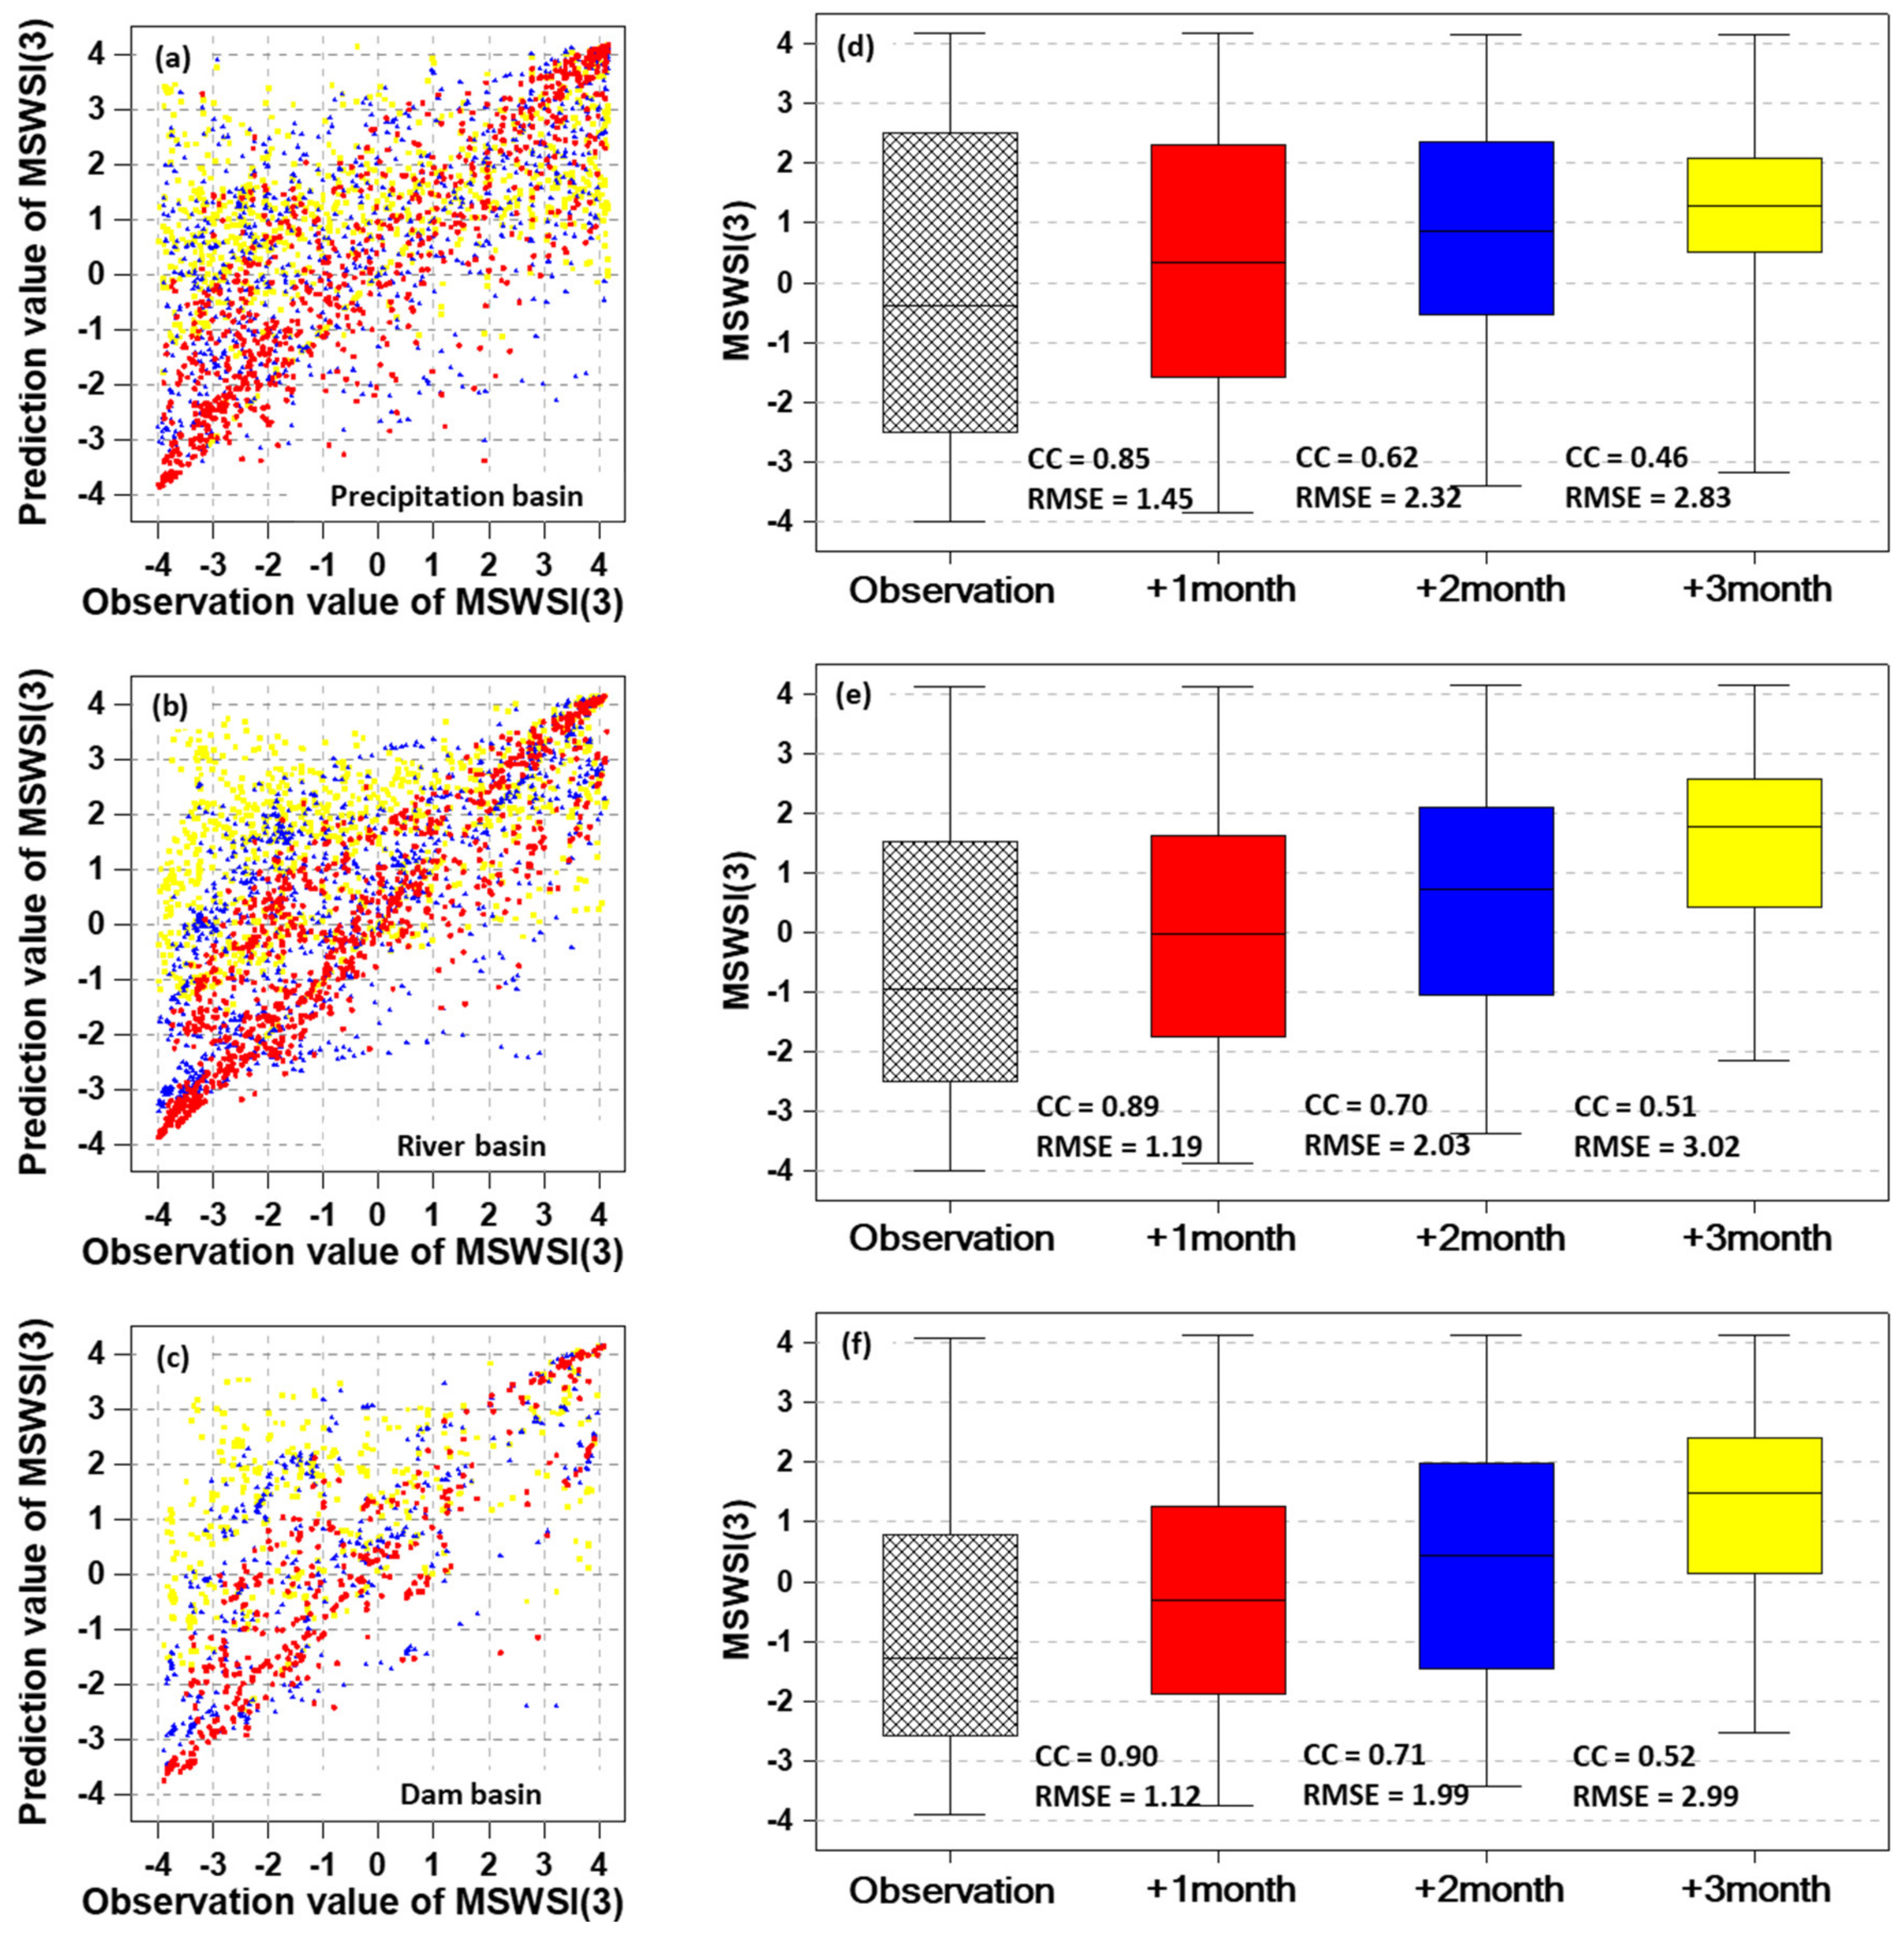
Figure 8 shows the CC and RMSE values for MSWSI(3) between the observed and forecasted data depending on three different subbasin categories for the 2015–2016 drought event. As indicated in Figure 8 (refer to the left panel), the predictabilities of MSWSI(3) that represent the difference between observed and forecasted values were higher when shorter lead times were used.
Regarding the basin categories, the CC values for the 1-month lead time were 0.85 for the precipitation subbasin, 0.89 for the river subbasin and 0.90 for the dam subbasin in the 2015 and 2016 drought events. The predictability of the dam basin was estimated to be higher due to the high predictability of the runoff and dam inflow from the forecasted meteorological information of GloSea5. The CC of MSWSI(3) for the 2-month lead time was the largest in the dam basin, with a value of 0.62 in the precipitation basin, a value of 0.70 in the river basin and a value of 0.71 in the dam basin. The CC of MSWSI(3) for the 3-month lead time was less predictable than 0.6 in all basins. The CC values of MSWSI(3) for the 1-month lead time in the 2015 and 2016 drought events were the largest in the dam basin at 0.90, whereas the RMSE was smallest in the dam basin, with a value of 1.12. The results for the 2-month and 3-month lead times were similar to the results of the 1-month lead time. It can be concluded that the utilization of MSWSI(3) in river and dam basins is higher than that in precipitation basins.
7. Discussion and Conclusions
A hydrologic drought forecasting framework that coupled the meteorological GloSea5 model and hydrological VIC model was developed in this study and we evaluated the performance in South Korea. The modified SWSI (MSWSI) was used as an indicator for the hydrologic drought condition after considering the topographical and meteorological–hydrological conditions in this study area. The study area has a relatively steep slope with a short river length, and two-thirds of the annual precipitation is concentrated during the summer season. Hydrological drought conditions considering hydraulic structures are dominant from precipitation, runoff and dam inflow but not from groundwater. Neglecting the groundwater component is also part of the difficulty of predicting future groundwater change using the GloSea5 weather forecast for the whole country.
The selection of drought index duration is an important factor in assessing the reproducibility of past drought events [9,10,25,26,27]. In this study, the reproducibility of various durations of the MSWSI was tested, and it was concluded that the 3-month duration of the MSWSI (MSWSI(3)) was best for past historical drought events. The 1-month duration of the MSWSI (MSWSI(1)) included too much repetition of the changes in dry and wet conditions. The main reason for this duration of the MSWSI is directly related to the meteorological–hydrological conditions in the study area. It is therefore recommended that the reasonable selection of the duration of the MSWSI should be tested when the linked GloSea5 and VIC model is applied in other countries. In addition, the utilization of the MSWSI was determined by the weighted factors of precipitation, runoff and dam inflow, which were used as input data for the MSWSI. The weighting factor of the input variable was calculated from the normal distribution of the variables. As a result, it was confirmed that the range of the weighting coefficients was narrow. In future studies, an appropriate distribution must be selected for the input data of the MSWSI and appropriate weighting coefficients must be used to better represent the subbasin type characteristics.
The use of LSM (e.g., VIC model) is indispensable for the hydrological drought evaluation of ungauged basins due to the limit of observed river and dam inflow data. Proper calibration and verification of the model on the gauged basin and regionalization are also required to transfer the model parameters to the ungauged basin. The VIC model used in this study simulated monthly runoffs well with statistical results of 0.96–0.98, 14.36–20.95, 0.86–0.96 and −12.15–−1.70 reported for the CC, RMSE, NSE and VE, respectively. It can be concluded that the model-driven monthly runoff data are acceptable as an input of MSWSI(3) for the future prediction of hydrological drought. However, a multi-ensemble hydrologic model (e.g., Soil and Water Assessment Tool, SWAT; Precipitation Runoff Modeling System, PRMS; Sejong University Rainfall Runoff, SURR) is recommended to improve the accuracy of hydrological drought forecasting and quantify the uncertainty of hydrological model components in the framework for future studies.
The performance of the hydrological drought forecasting framework that linked GloSea5 and the VIC model with MSWSI(3) was tested for the 2015–2016 drought event. The average CC and RMSE values were 0.88 and 1.25 for the 1-month forecast lead time, 0.68 and 2.11 for the 2-month forecast lead time and 0.50 and 2.95 for the 3-month forecast lead time, respectively. It was subjectively judged that the drought forecast information up to a 2-month forecast lead time was acceptable. The results were similar to those of previous studies [2,19,20,28]. The accuracy of hydrologic forecasts was highly dependent on the results of the meteorological GloSea5 model. As mentioned previously, the anomaly between the forecasted weather and hindcasted weather data was used for the hydrologic drought forecasts. Due to the limit of hindcast data availability obtained from the KMA, the 14-year data from 1996 and 2009 were used in this study. The effect of the hindcast data period should be evaluated in future studies. In addition, the anomaly scheme is one of the most commonly used methods for monthly and seasonal weather forecasting; however, various postprocessing methods [29] must be evaluated to improve the model accuracy. However, the drought predictability of three different subbasin types demonstrated that accuracy was better for the river and dam subbasins than for the precipitation subbasins. It should be noted that this study assumed that the stored water in the dam was not released downstream until the forecast lead time. In other words, the subbasins located just downstream of the dam had no dam outflows during the forecast lead time. The reason for this assumption is that the hydrologic drought forecasting algorithm in this study is used to determine how severe the hydrologic drought is before the forecast lead time without the use of stored dam water. This kind of information will be useful for decision-making regarding dam operation for the next three months. Therefore, for actual water control and management, the results of dam operation rules should be considered. In addition, this study conducted a physical-based hydrological drought prediction analysis. Future research should focus on performing statistical-based hydrological drought predictions and developing drought prediction methods that combine physical and statistical methods [30,31,32,33].
Author Contributions
J.-M.S. designed the project and edited the manuscript. J.-H.L. and D.-H.B. provided the concept and supervised the project. J.-M.S. wrote the draft manuscript. All authors contributed to improving the manuscript and interpreting the results. All authors have read and agreed to the published version of the manuscript.
Funding
This work was supported by Korea Environment Industry & Technology Institute(KEITI) through Water Management Research Program, funded by Korea Ministry of Environment(MOE) (130747) and funded by the Korea Meteorological Administration Research and Development Program under Grant KMIPA 2015-2070.
Conflicts of Interest
The authors declare no conflict of interest.
References
- Yuan, X.; Wood, E.F.; Luo, L.; Pan, M. A first look at Climate Forecast System version 2 (CFSv2) for hydrological seasonal prediction. J. Geophys. Res. 2011, 38, L13402. [Google Scholar] [CrossRef] [Green Version]
- Yoon, J.H.; Mo, K.; Wood, E.F. Dynamic-model-based seasonal prediction of meteorological drought over the contiguous United States. J. Hydrometeorol. 2012, 13, 463–482. [Google Scholar] [CrossRef]
- Yuan, X.; Wood, E.F.; Chaney, N.W.; Sheffield, J.; Kam, J.; Liang, M.; Guan, K. Probabilistic seasonal forecasting of African drought by dynamical models. J. Hydrometeorol. 2013, 14, 1706–1720. [Google Scholar] [CrossRef]
- Dutra, E.; Pozzi, W.; Wetterhall, F.; Di Giuseppe, F.; Magnusson, L.; Naumann, G.; Barbosa, P.; Vogt, J.; Pappenberger, F. Global meteorological drought-Part 2: Seasonal forecasts. Hydrol. Earth Syst. Sci. 2014, 18, 2669–2678. [Google Scholar] [CrossRef] [Green Version]
- Mo, K.C.; Lyon, B. Global meteorological drought prediction using the North American Multi-Model Ensemble. J. Hydrometeorol. 2015, 16, 1409–1424. [Google Scholar] [CrossRef]
- Palmer, W. Meteorological Drought; Research Paper; U.S. Weather Bureau: Washington, DC, USA, 1965; Volume 45.
- Narasimhan, B.; Srinivasan, R. Development and evaluation of soil moisture deficit index (SMDI) and evapotranspiration deficit index (ETDI) for agricultural drought monitoring. Agric. For. Meteorol. 2005, 133, 69–88. [Google Scholar] [CrossRef]
- Dutra, E.; Viterbo, P.; Miranda, P.M. ERA-40 reanalysis hydrological applications in the characterization of regional drought. Geophys. Res. Lett. 2008, 35, L19402. [Google Scholar] [CrossRef]
- Hao, Z.; AghaKouchak, A.; Nakhjiri, N.; Farahmand, A. Global integrated drought monitoring and prediction system. Sci. Data 2014, 1, 140001. [Google Scholar] [CrossRef]
- Shukla, S.; Wood, A.W. Use of a standardized runoff index for characterizing hydrologic drought. J. Geophys. Res. 2008, 35, L2045. [Google Scholar] [CrossRef] [Green Version]
- Wang, D.; Hejazi, M.; Cai, X.; Vaocchi, A.J. Climate change impact on meteorological, agricultural, and hydrological drought in central Illinois. Water Resour. Res. 2011, 47, W09527. [Google Scholar] [CrossRef] [Green Version]
- Tigkas, D.; Vangelis, H.; Tsakiris, G. Drought and climatic change impact on streamflow in small watershed. Sci. Total Environ. 2012, 440, 33–41. [Google Scholar] [CrossRef] [PubMed]
- Jung, I.W.; Chang, H.J. Climate change impacts on spatial patterns in drought risk in the Willamette River Basin, Oregon, USA. Theor. Appl. Climatol. 2012, 108, 355–371. [Google Scholar] [CrossRef]
- Shafer, B.A.; Dezman, L.E. Development of a Surface Water Supply Index (SWSI) to Assess the Severity of Drought Conditions in Snowpack Runoff Areas. In Conference Proceedings, 50th Annual Western Snow Conference; Colorado State University: Reno, NV, USA, 1982; pp. 164–175. [Google Scholar]
- Kwon, H.J.; Park, H.J.; Hong, D.O.; Kim, S.J. A study on semi-distributed hydrologic drought assessment modifying. J. Korea Water Resour. Assoc. 2006, 39, 645–658. [Google Scholar] [CrossRef] [Green Version]
- David, C.G. The surface water supply index; formulation and issues. In Remote Presentation for World Meteorological Organization Workshop on Hydrological Drought Indices Geneva. 2011, Switzerland September 2011; United States Department of Agriculture Natural Resources Conservation Service: Washington, DC, USA, 2011. [Google Scholar]
- Jung, M.S.; Park, S.; Hong, H.; Lee, J.H. Estimating Quantified Hydrological Input Value for Hydrological Drought. J. Korean Soc. Hazard Mitig. 2017, 18, 11–22. [Google Scholar] [CrossRef]
- Luo, L.; Wood, E.F. Use of Bayesian merging techniques in a multimodel seasonal hydrologic ensemble prediction system for the eastern United States. J. Hydrometeorol. 2008, 9, 866–884. [Google Scholar] [CrossRef]
- Fundel, F.; Jörg-Hess, S.; Zappa, M. Monthly hydrometeorological ensemble prediction of streamflow droughts and corresponding drought indices. Hydrol. Earth Syst. Sci. 2013, 17, 395–407. [Google Scholar] [CrossRef] [Green Version]
- Sheffield, J.; Wood, E.F.; Chaney, N.; Guan, K.; Sadri, S.; Yuan, X.; Olang, L.; Amani, A.; Ali, A.; Demuth, S.; et al. A drought monitoring and forecasting system for sub-Sahara African water resources and food security. Bull. Am. Meteorol. Soc. 2014, 95, 861–882. [Google Scholar] [CrossRef]
- Ghafouri-Azar, M.; Bae, D.H.; Kang, S.U. Trend Analysis of Long-Term Reference Evapotranspiration and Its Components over the Korean Peninsula. Water 2018, 10, 1373. [Google Scholar] [CrossRef] [Green Version]
- Bae, D.H.; Jung, I.W.; Chang, H. Long-term trend of precipitation and runoff in Korean river basins. Hydrol. Process. 2008, 22, 2644–2656. [Google Scholar] [CrossRef]
- MacLachlan, C.; Arribas, A.; Peterson, K.A.; Maidens, A.; Fereday, D.; Scaife, A.A.; Gordon, M.; Vellinga, M.; Willianms, A.; Comer, R.E.; et al. Global Seasonal forecast system version 5 (GloSea5): A high-resolution seasonal forecast system. Q. J. R. Meteorol. Soc. 2014, 141, 1072–1084. [Google Scholar] [CrossRef]
- Liang, X.; Lettenmaier, D.P.; Wood, E.F.; Burges, S.J. A simple hydrologically based model of land surface water and energy fluxes for general circulation models. J. Geophys. Res. 1994, 99, 14415–14428. [Google Scholar] [CrossRef]
- McKee, T.B.; Doesken, N.J.; Kleist, J. The relationship of drought frequency and duration to time scales. In Paper Presented at Eighth Conference on Applied Climatology; American Meteorological Society: Anaheim, CA, USA, 1993. [Google Scholar]
- Zargar, A.; Sadiq, R.; Naser, B.; Khan, F.I. A review of drought indices. Environ. Rev. 2011, 19, 333–349. [Google Scholar] [CrossRef]
- Hao, Z.; Singh, V.P. Drought characterization from a multivariate perspective: A review. J. Hydrol. 2015, 527, 668–678. [Google Scholar] [CrossRef]
- Yuan, X.; Roundy, J.K.; Wood, E.F.; Sheffield, J. Seasonal forecasting of global hydrologic extremes: System development and evaluation over GEWEX basins. Bull. Am. Meteorol. Soc. 2015, 96, 1895–1912. [Google Scholar] [CrossRef]
- Hao, Z.; Singh, V.P.; Xia, Y. Seasonal drought prediction: Advances, challenges, and future prospects. Rev. Geophys. 2018, 56, 108–141. [Google Scholar] [CrossRef] [Green Version]
- Vahid, N.; Mahsa, G.; Ali, D.M.; Elnaz, S. Investigating the effect of hydroclimatological variables on Urmia Lake water level using wavelet coherence measure. J. Water Clim. Chang. 2019, 10, 13–29. [Google Scholar]
- Shahabbodin, S.; Sajjad, H.; Hana, S.; Saeed, S.; Asadi, E.; Shadkani, S.; Kargar, K.; Mosavi, A.; Chau, K.-W.; Narjes, N. Predicting Standardized Streamflow index for hydrological drought using machine learning models. Eng. Appl. Comput. Fluid Mech. 2020, 14, 339–350. [Google Scholar]
- Wu, C.L.; Chau, K.W. Prediction of rainfall time series using modular soft computing methods. Eng. Appl. Artif. Intell. 2013, 26, 997–1007. [Google Scholar] [CrossRef] [Green Version]
- Taormina, R.; Chau, K.W. ANN-based interval forecasting of streamflow discharges using the LUBE method and MOFIPS. Eng. Appl. Artif. Intell. 2015, 45, 429–440. [Google Scholar] [CrossRef]
Figure 1.
Study area and weather station and multipurpose dam locations.

Figure 2.
Outline of the hydrological drought forecasting framework. (a) procedure for the dynamic weather and runoff forecasts by GloSea5 and VIC model; (b) procedure for the bias correction of forecasted runoff using anomaly method; (c) procedure for the forecasted hydrological drought index.
Figure 2.
Outline of the hydrological drought forecasting framework. (a) procedure for the dynamic weather and runoff forecasts by GloSea5 and VIC model; (b) procedure for the bias correction of forecasted runoff using anomaly method; (c) procedure for the forecasted hydrological drought index.

Figure 3.
MSWSI results for 1-month and 3-month data periods; (a) time-series of MSWSI(1) during 2001–2016 year; (b) time-series of MSWSI(3) during 2001–2016 year; (c) MSWSI(1) and MSWSI(3) of 2008–2009 drought events; (d) MSWSI(1) and MSWSI(3) of 2014-2015 drought events.
Figure 3.
MSWSI results for 1-month and 3-month data periods; (a) time-series of MSWSI(1) during 2001–2016 year; (b) time-series of MSWSI(3) during 2001–2016 year; (c) MSWSI(1) and MSWSI(3) of 2008–2009 drought events; (d) MSWSI(1) and MSWSI(3) of 2014-2015 drought events.

Figure 4.
Receiver operating characteristic (ROC) diagrams of MSWSI(1) and MSWSI(3) for two dam basins. Results of ROC analysis for the Soyang river dam (a) and Imha dam (b).
Figure 4.
Receiver operating characteristic (ROC) diagrams of MSWSI(1) and MSWSI(3) for two dam basins. Results of ROC analysis for the Soyang river dam (a) and Imha dam (b).

Figure 5.
Simulated inflows of land surface models (LSMs) for the Soyang river (a), Chungju (b), Daecheong (c) and Imha (d) dams. The black dot lines and blue lines indicate the observation runoff and simulation runoff.
Figure 5.
Simulated inflows of land surface models (LSMs) for the Soyang river (a), Chungju (b), Daecheong (c) and Imha (d) dams. The black dot lines and blue lines indicate the observation runoff and simulation runoff.


Figure 6.
Classification of subbasin types (upper) and box–whisker plots of MSWSI(3) for each basin type (lower). The gray bar and black bar indicates observation− and simulation− MSWSI(3).
Figure 6.
Classification of subbasin types (upper) and box–whisker plots of MSWSI(3) for each basin type (lower). The gray bar and black bar indicates observation− and simulation− MSWSI(3).

Figure 7.
CC and RMSE of MSWSI(3) for 1−, 2− and 3−month lead times in 2015 and 2016 events. The white bar, gray bar and black bar indicates MSWSI(3) for 1−, 2− and 3−months lead times, respectively.
Figure 7.
CC and RMSE of MSWSI(3) for 1−, 2− and 3−month lead times in 2015 and 2016 events. The white bar, gray bar and black bar indicates MSWSI(3) for 1−, 2− and 3−months lead times, respectively.

Figure 8.
Correlation analysis (a, b, c) of MSWSI(3) and box whisker plots of MSWSI(3) (d, e, f) for 1−, 2− and 3−month lead times during the 2015−2016 drought events. The red−, blue− and yellow colors indicates the MSWSI(3) for 1−, 2− and 3−month lead times.
Figure 8.
Correlation analysis (a, b, c) of MSWSI(3) and box whisker plots of MSWSI(3) (d, e, f) for 1−, 2− and 3−month lead times during the 2015−2016 drought events. The red−, blue− and yellow colors indicates the MSWSI(3) for 1−, 2− and 3−month lead times.


Table 1.
Characteristics and information of Global Seasonal Forecast System version 5 (GloSea5).
| - | Major Characteristics and Information | |
|---|---|---|
| Composition of Model | Atmosphere | ⦁ UM (v8.0) |
| Ocean | ⦁ NEMO (v3.2)-CICE (v4.1) | |
| Coupler | ⦁ OASIS3 | |
| Spatial Resolution | Atmosphere | ⦁ N216 (0.83°×0.56°) |
| Ocean | ⦁ ORCA tri-polar grid at 0.25° | |
| Initial Input Data | Atmosphere | ⦁ Hindcast: ERA interim ⦁ Forecast: KMA numerical analysis field |
| Ocean | ⦁ Hindcast: Seasonal ODA reanalysis ⦁ Forecast: NEMO VAR | |
| Production Period of Data and Ensemble Number | ⦁ Hindcast: - Fixed start dates of 1st, 9th, 17th, 25th of each month - Three member runs per start date ⦁ Forecast: - Two member runs each day | |
Note: KMA: Korea Meteorological Administration; NEMO: Nucleus for European Modelling of the Ocean
Table 2.
Classification range for the Modified Surface Water Supply Index (MSWSI) values.
| Values | Drought Classification |
|---|---|
| 4.0 ≤ MSWSI | Extreme wet |
| 3.0∼4.0 | Very wet |
| 2.0∼3.0 | Moderate wet |
| 1.0∼2.0 | Mild wet |
| −1.0∼1.0 | Near normal |
| −2.0∼-1.0 | Mild dry |
| −3.0∼-2.0 | Moderate dry |
| −4.0∼-3.0 | Severe dry |
| −4.0 ≥ MSWSI | Extreme dry |
Table 3.
Statistical measures used to evaluate model performance.
| - | Formula | Range | Ideal Value |
|---|---|---|---|
| Correlation Coefficient (CC) | 1 | ||
| Root Mean Square Error(RMSE) | 0 | ||
| Nash–Sutcliffe Efficiency(NSE) | 1 | ||
| Volume Error(VE) | 0 |
Note: n: Number of data points; O: Observed runoff; S: Simulated runoff; : Average of observed runoff; : Average of simulated runoff.
© 2020 by the authors. Licensee MDPI, Basel, Switzerland. This article is an open access article distributed under the terms and conditions of the Creative Commons Attribution (CC BY) license (http://creativecommons.org/licenses/by/4.0/).
Share and Cite
MDPI and ACS Style
So, J.-M.; Lee, J.-H.; Bae, D.-H. Development of a Hydrological Drought Forecasting Model Using Weather Forecasting Data from GloSea5. Water 2020, 12, 2785. https://doi.org/10.3390/w12102785
AMA Style
So J-M, Lee J-H, Bae D-H. Development of a Hydrological Drought Forecasting Model Using Weather Forecasting Data from GloSea5. Water. 2020; 12(10):2785. https://doi.org/10.3390/w12102785
Chicago/Turabian StyleSo, Jae-Min, Joo-Heon Lee, and Deg-Hyo Bae. 2020. "Development of a Hydrological Drought Forecasting Model Using Weather Forecasting Data from GloSea5" Water 12, no. 10: 2785. https://doi.org/10.3390/w12102785
Note that from the first issue of 2016, this journal uses article numbers instead of page numbers. See further details here.