Evaluation of the Stability and Suitable Scale of an Oasis Irrigation District in Northwest China

1
College of Geography and Environment Science, Northwest Normal University, Lanzhou 730070, China
2
Hubei Agricultural Planning and Design Institute, Wuhan 430070, China
3
School of Civil Engineering and Architecture, Zhengzhou University of Aeronautics, Zhengzhou 450000, China
4
Northwest Institute of Eco-Environment and Resources, Chinese Academy of Science, Lanzhou 730000, China
*
Author to whom correspondence should be addressed.
Water 2020, 12(10), 2837; https://doi.org/10.3390/w12102837
Submission received: 28 August 2020
/
Revised: 4 October 2020
/
Accepted: 5 October 2020
/
Published: 13 October 2020
(This article belongs to the Special Issue Water Security and Governance in Catchments)
Abstract
:Oases support human activities in arid and semiarid regions, and their stability is important for regional sustainable development and water resource management. Water consumption is the major factor affecting the stability of oases. On the basis of remote sensing images, evaporation and socioeconomic data, this study first evaluates the stability of the Dunhuang Oasis against the expansion of an oasis irrigation district and planting structure changes from 1987 to 2015. Next, it calculates a suitable area of the oasis irrigation district using water–energy balance theory. The results are as follows: (1) During the 1987–2015 period, with the expansion in the oasis irrigation area, the planting structure underwent a marked transformation from food crops to cash crops to orchards. Water consumption pattern likewise changed considerably. (2) The stability of the Dunhuang Oasis continued to weaken from 0.54 in 1987 until it reached a dangerously unstable level of 0.17 in 2010. With the implementation of water-saving measures and a water-transfer project, the stability of the Dunhuang Oasis irrigation district increased to a metastable level of 0.22 in 2015. (3) Setting the stability are 0.5 of a stable level and 0.75 of an extremely stable level, and the oasis irrigation district should be impractical and reduced by 168 and 241 km2 to attain a suitable oasis ecosystem scale. Hence, at present, the water-transfer project is the most practical way to increase allocated water resource to the oasis irrigation district for improving its stability.
1. Introduction
The mountain–oasis–desert unit is the main topographic feature of inland river watersheds in China [1]. For watersheds in this arid region, water from melted snow and glacier in the mountain flows through an oasis similar to a water tower, thereby providing fresh water to people and nature before disappearing into the desert. Through this morphotectonic pattern, as an important landscape, oases support human activities and economic development in arid regions [2] but are generally water deficient [3]. Its stability is directly related to the sustainable development of regional economy and ecological security [2].
In recent decades, the expansion of the irrigation district, population growth, and economic development in the middle-stream oasis of the inland river basin has considerably modified hydrological cycles and reduced surface runoffs to downstream reaches. Consequently, this situation has led to dried-up rivers, reduced outflows to terminal lakes, and the deterioration of the ecosystem in downstream areas [4,5,6,7]. These effects have manifested in dried-up inland lakes, such as the Aral Sea in Central Asia [8,9], Lake Urmia in Iran [10,11], and the Shiyang River in Northwestern China [12]. Thus, assessing whether an oasis is stable under the present development pattern is important in the pursuit of sustainable development. Moreover, evaluating a suitable oasis scale is crucial to the government development plan.
Several studies on stability evaluation and suitable oasis scales have focused on the Endorheic Basin in Northwest of China, specifically, the Keriya River Basin [13], the Manas River Basin [2], the Tarim River Basin [14], the Weigan River [15], and the Heihe River Basin [16]. Research methods in stability evaluation and suitable scales have continuously progressed owing to the rapid development of ecological hydrology. In the past, suitable oasis cropland areas were calculated by establishing a regression equation using the total amount of runoff water resources and the cropland area of the oasis [17]. Wang et al. [18] applied contrastive analysis to different oasis landscapes and their homologous water–energy balance relationship and proposed the concept of the “green degree” to assess stability evaluation and suitable oasis scales. In addition, a suitable farmland scale model had been established from the perspective of crop water footprint and water resources available in an oasis city [19]. Recently, Hao et al. [16] developed an approach for calculating oasis and cultivated land scales by combining water–energy balance and wind–sand dynamic theories with ecological health assessments in the Heihe River Basin.
Agricultural irrigation consumes the largest proportion of the water supply of an oasis, and the suitability of a cropland scale can directly affect the stability of an oasis. Previous research on stability evaluation and suitable oasis scales has generally neglected the impact of changes in planting structure and agricultural water consumption. Additionally, no relevant studies have been conducted on the Shule River Basin, which is adjacent to the Heihe River Basin. The Dunhuang Oasis, which is the study area of this research, is located west of the Shule River Basin and an important region along the Silk Road.
Similar to the case of the middle reaches of the Heihe River Basin, the Dunhuang Oasis also has a sharp contradiction of the water resource issue between the economy and the ecosystem. In the past decade, planting structures constantly changed with the expansion in oasis irrigation areas. Moreover, water exploitation and utilization rates reached nearly 100% in the oasis, in which agricultural water consumption accounted for nearly 90% of total available resources [20]. Hence, natural oasis ecosystems are unable to receive necessary water resources. Dunhuang City has proposed a water resource plan, namely, the “Comprehensive Planning of the Rational Use of Water Resource and Protection of Ecosystem Services in the Dunhuang Basin” [21] to improve the ecological environment of its natural oasis. The main purpose of this plan is to allocate large amounts of water resources to the natural oasis in the lower reaches of the Dunhuang Basin and leave only a limited amount of water for the irrigation district of the Dunhuang Oasis.
The objective of this study is to propose a novel research idea to evaluate the stability of the oasis and calculate the suitable oasis scale by combining water–energy balance with altered planting structures. First, this study evaluates stability during the long-term expansion process of the Dunhuang Oasis from 1987 to 2015. Next, it calculates a suitable oasis scale to a certain stability degree. Finally, it discusses to what extent the current water plan can improve the stability of the oasis and provides a scientific reference for the sustainable development of the oasis.
2. Materials and Methods
2.1. Study Area
The Dunhuang Oasis irrigation district is located east of Dunhuang City (92°13′–95°30′ N, 39°40′–41°40′ E) in Northwest China, with a total area less than 5% of that of the entire city (Figure 1). The Dunhuang Oasis irrigation district lies between the Mingsha Mountain (Echoing-sand Mountain) and the Sanwei Mountain in the southeast and the Mazong Mountain in the north and spreads into the Gobi Desert in the west, thereby earning the name the “Gobi Desert Oasis”. The world famous Mogao Grottoes are located southwest of the Dunhuang Oasis. The elevation of the oasis ranges from 800 to 1500 m and is high in the south and low in the north. The oasis experiences the strong sunshine with the annual solar radiation reaches to 6418.4 MJ/m2, and mean maximum and minimum temperatures are −28.6–43.6 °C. The oasis also experiences high evaporation, with the annual potential evaporation reaches 2486.0 mm, but the annual precipitation is only 39.2 mm. The Danghe River, which originates from the Qilian Mountain, provides the water resources for the oasis, and the Danghe River alluvial fan developed the oasis. The oasis consists mainly of gray brown desert, alkali saline, and irrigation desert soil (China soil science database, http://vdb3.soil.csdb.cn). According to the Dunhuang City National Economic Statistics Yearbook (1987–2015), spring wheat, melon, cotton, and grapes are the main crops planted in this area [22].
2.2. Remote Sensing Image Data Processing
The high-quality remote images with a 30 m spatial resolution from Landsat TM (Thematic Mapper) were taken in low cloud covers during high biomass season, and all mage data were acquired from http://glovis.usgs.gov/ and http://www.radi.ac.cn/. We selected 1987, 1990, 1996, 2001, 2007, 2010, and 2015 to identify the actual irrigation district of the oasis using the software of ERDAS 9.1 and ArcGIS 10.3. Based on a 1:250,000 topographic map of the Dunhuang Oasis, all images were processed under the common universal transverse mercator coordinate system. A total of 50 uniformly distributed ground control points (e.g., roads and rivers) were used for geometric correction and georeferencing, and we used the quadratic polynomial transformation and nearest-neighbor resampling methods to identify ground control points in image-to-map rectification, the root mean square error of the geometrical rectification was less than one pixel. When the images were all ready, we divided the land use types into eight classes according to visual interpretation, namely, cropland, water, high-density grassland, medium-density grassland, low-density grassland, shrub land, urban construction land, and barren land. For verifying the result of visual interpretation, the field investigation points and corresponding interpretation results were compared, and the overall interpretation accuracy of land use classification in the 1987, 1990, 1996, 2001, 2007, 2010, and 2015 images was 80.91%, 84.96%, 79.85%, 79.69%, 84.98%, 85.79%, and 89.45%, respectively, which met the minimum accuracy requirement of 70% [23]. In this study, we used only the results of the cropland in the interpretation, as the scale of the oasis was mainly affected by the changes in the cropland. On the basis of the interpreted cropland data, we calculated the actual crop areas of crop food, cash food, and orchards by multiplying the crop food, cash food, and orchard area ratios in the Dunhuang City statistical yearbook [22] to determine the water consumption of each crop and orchard.
2.3. Water Consumption Data Analyses
In this study, water consumption denoted crop, domestic, and industrial water consumption.
2.3.1. Crop Water Consumption
The Food and Agricultural Organization (FAO)–Penman–Monteith methods were used to estimate reference crop evapotranspiration (ET0), and multiplying by the crop coefficient (Kc) can get actual evapotranspiration (ET) as crop water consumption [24]:
- Rn is the net radiation at the canopy surface (MJ/m2. day);
- G is the soil heat flux density (MJ/m2. day);
- T is the mean daily air temperature at 2 m above the ground (°C);
- U2 is the wind speed at 2 m above the ground (m/s);
- es is the saturation vapor pressure (kPa);
- ea is the actual vapor pressure (kPa);
- es − ea is the saturation vapor pressure deficit (kPa);
- Δ is the slope of the vapor pressure temperature relationship (kPa/°C);
- γ is the psychometric constant (kPa /°C).
Based on the above principle, ET0 is computed using the CropWat 8.0 [25] tool after the monthly averages of minimum temperature, maximum temperature, humidity, wind speed, and sunshine hours are inputted.
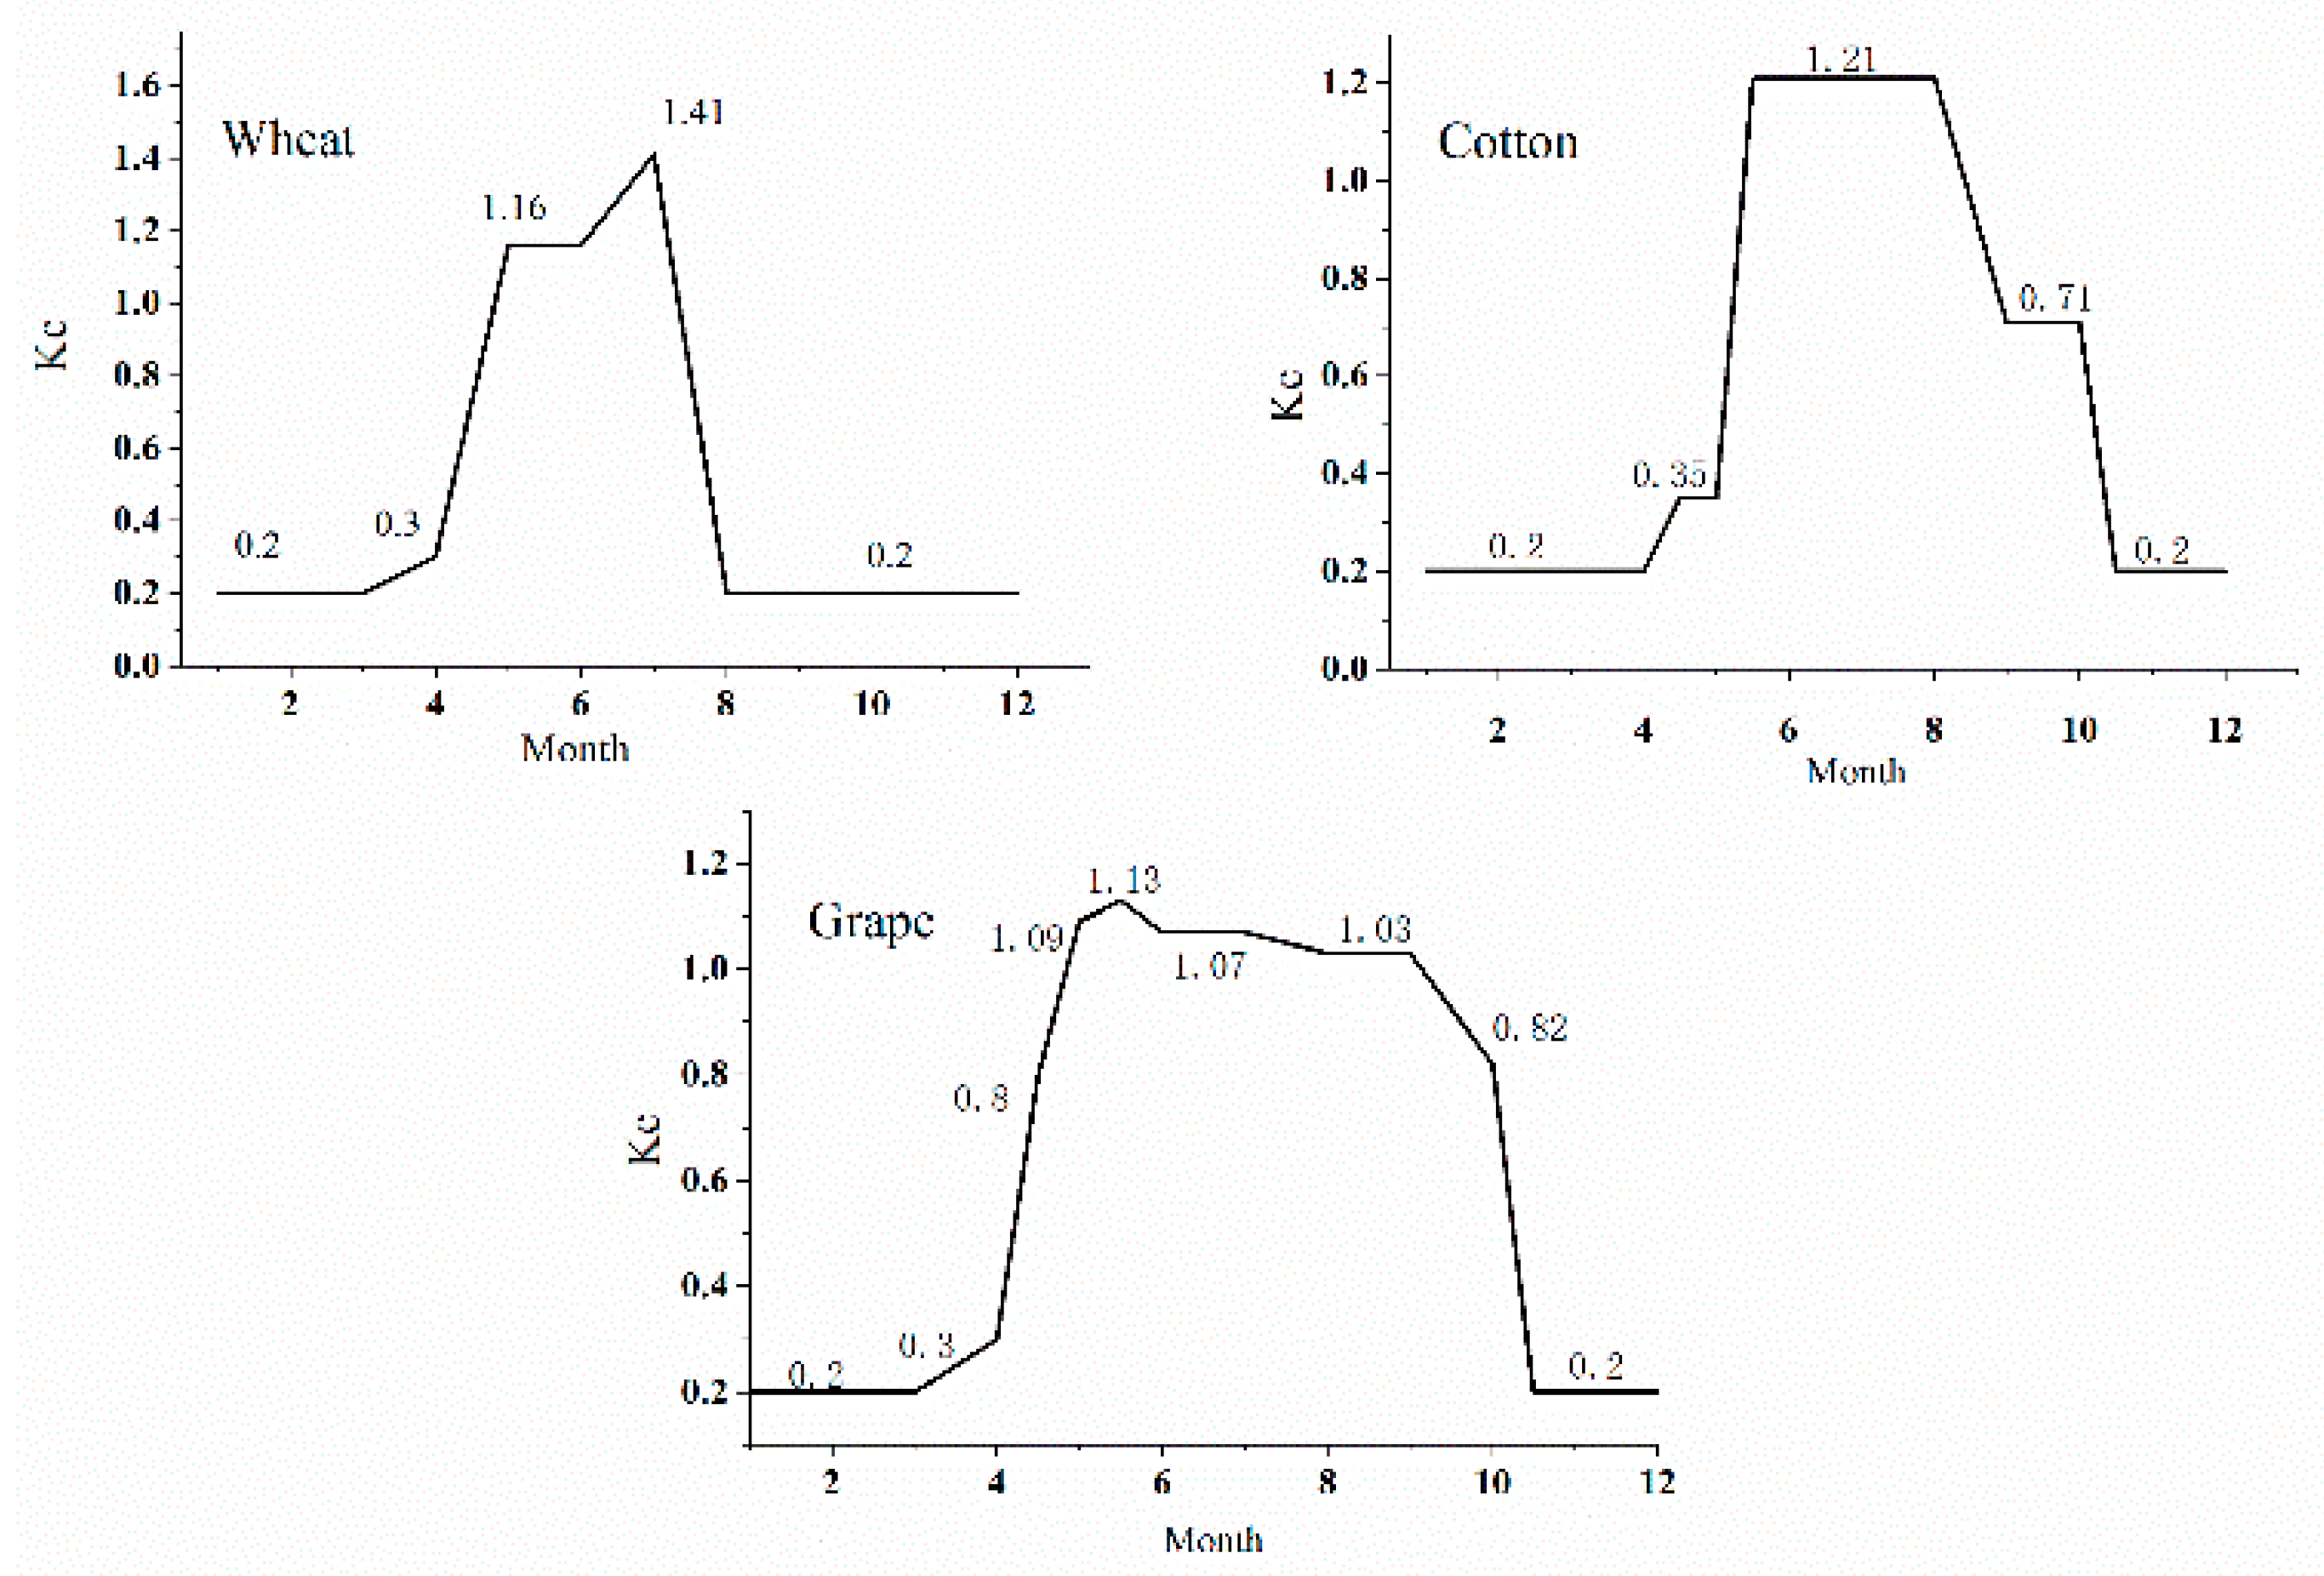
The values of Kc vary with the crop development stages, and values of monthly Kc were adopted from FAO-56 [24] for spring wheat, cotton and grape. Adjustments to Kc mid in climates where RHmin differs from 45% or wher U2 is larger or smaller than 2.0 m/s, were made by following the guidelines of Allen et al. [24]:
- Kcmid(Tab) is the tabulated Kc values in the mid-seasonof Table VI-12 of Allen et al. [24];
- Kcend(Tab) is the tabulated Kc values in the late-season of Table VI-12 of Allen et al. [24];
- U2 is wind speed at 2 m height over grass, the range is 1 m/ s ≤ U2 ≤ 6 m m/s;
- RHmin is daily minimum relative humidity, the range is 20% ≤ RHmin ≤ 80%;
- H is mean plant height, the range is 0.1 m ≤ h ≤ 10 m.
This research considered the water consumption of vines. Figure 2 shows the adjusted KC of wheat, cotton and grape. Compared with wheat and cotton, the KC of grape is more complicated, and the values of the germination, growing season with shoots, flowering, and berry growing periods as well as berry and tendril maturation were 0.80, 1.09, 1.13, 1.07, 1.03, and 0.82, respectively.
Actual ET rates of food crops and cash crops are estimated by Allen et al. [24]
2.3.2. Domestic Water Consumption
Domestic water consumption represented the water consumption of urban and rural populations, tourists, and livestock, which was positively correlated with living standards. It is defined as follows:
- D is the total domestic water consumption (108 m3);
- P1 is the amount urban population (108 m3);
- P2 is the amount rural population (108 m3);
- P3 is the amount tourists population (108 m3);
- P4 is the amount livestock number (108 m3, sheep unit);
- C1 is the average per capital water use coefficient of urban (L/day);
- C2 is the average per capital water use coefficient of rural (L/day);
- C3 is the average per capital water use coefficient of tourist (L/day);
- C4 is the average per capital water use coefficient of livestock (L/day);
2.3.3. Industrial Water Consumption
Industrial water consumption was affected by industrial output, technology, processes, and the amount of water used to create RMB 10,000 (Chinese currency) worth of industrial output. It is defined as follows:
- P is the industry water use (108 m3);
- Indo is the industrial output (RMB);
- C5 is the amount of water used to create 10,000 RMB worth of industrial output (m3/104 RMB).
The value for C5 (Table 1) was also determined separately for the four periods with different living
standards for the period of 1987–1990, 1991–2000, 2001–2007, and 2008–2015, respectively [26].
2.4. Oasis Stability and Suitable Oasis Scale Model
In this study, a stability index (H0), which is based on the theory of ecological water–energy balance, was used to estimate the stability degree of the oasis under certain water resource conditions [18]. H0 is the relative equilibrium analysis between water and energy conditions of the oasis, which can not only reflect ecological evolution and degradation from the internal perspective of the oasis but also the “green degree” or “stability degree” from the overall regional view point. The greater the H0, the less affected the water stress and the higher the oasis stability, and vice versa. The formula is as follows:
where Ai is the area of the land type (I = food crops, cash crops, and grapes; km2), W1 is the total available water volume of the river basin (108 m3), W2 is the annual average agricultural, industrial, and domestic water consumption, ET0 is the reference crop evapotranspiration, and P is the annual average precipitation. The H0 of the oasis was classified on the basis of the characteristics of the natural environment (Table 2).
Based on the previous section, the calculation model of the suitable oasis scale (A) is
where kp is the comprehensive coefficient of plants in the oasis, which includes planting crops, trees, and grass. is used to estimate the suitable oasis scale.
3. Results
3.1. Land Use/Land Cover Changes between 1987 and 2015
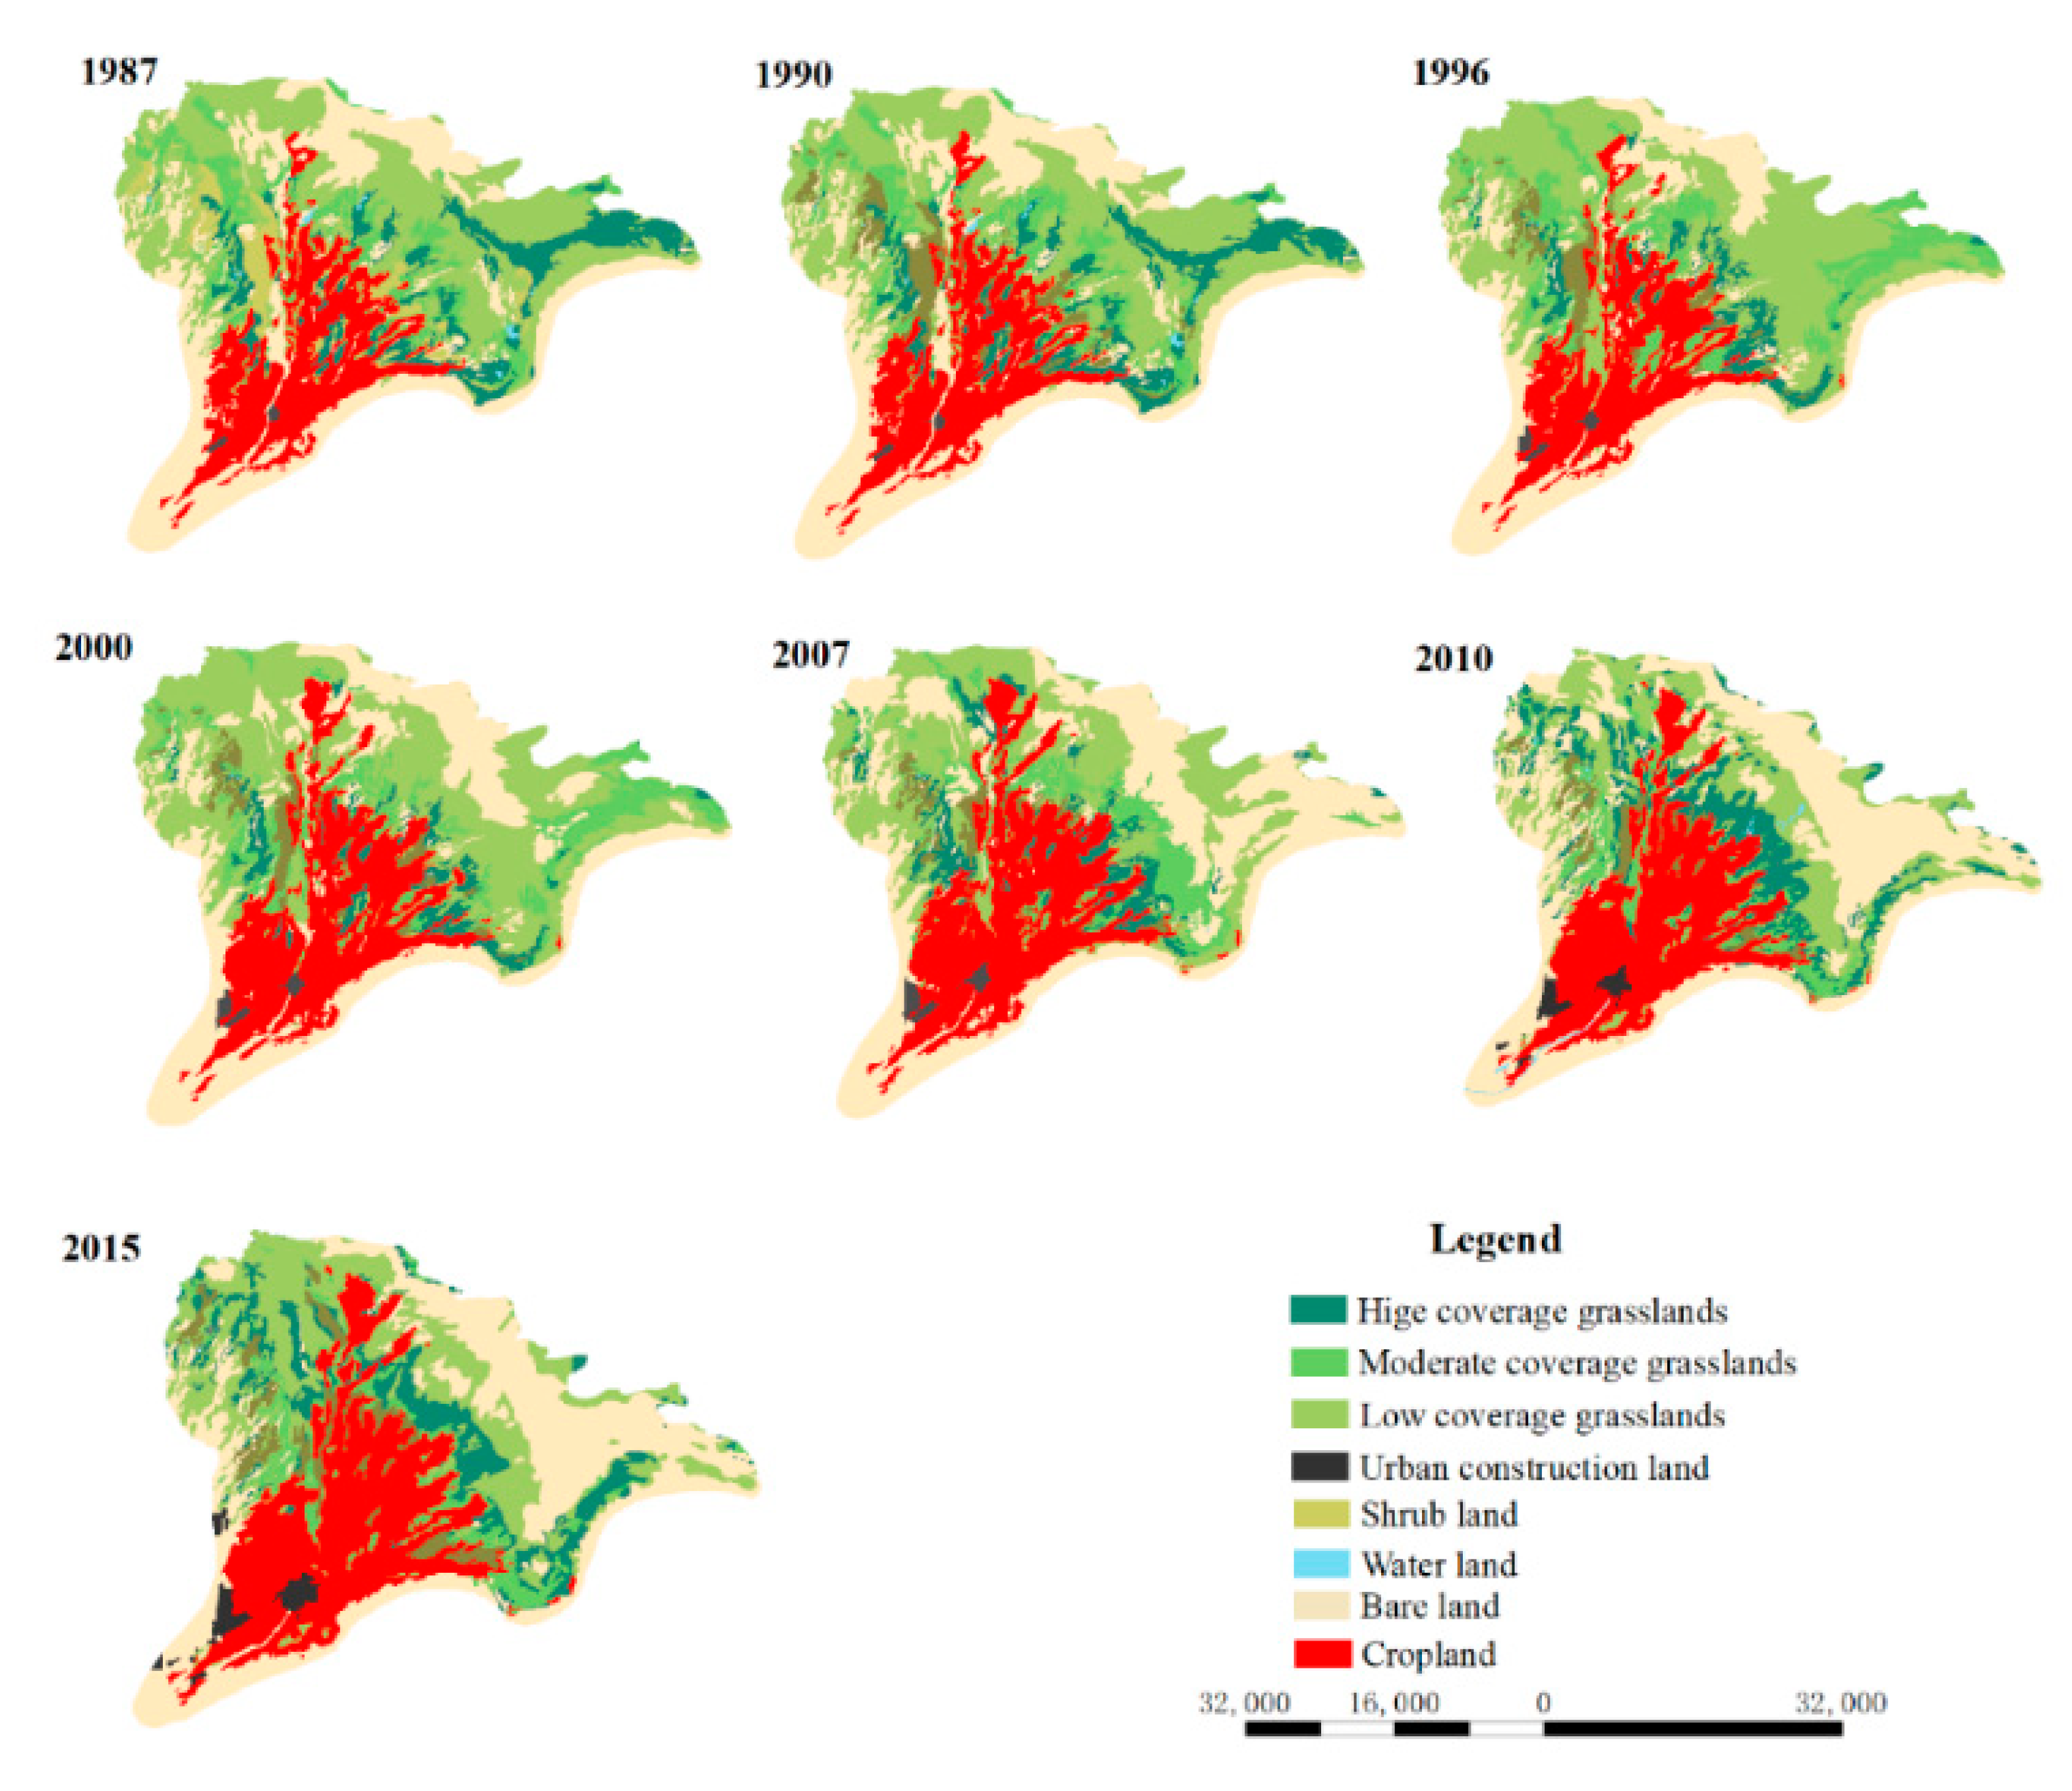
Figure 3 and Figure 4 show changes in land use/land cover between 1987 and 2015. From Figure 3, we can deduce that the cropland area exhibited an expanding pattern, and the interpretation results demonstrate the total cropland area in the oasis was 272.69, 276.41, 295.33, 327.08, 371.40, 380.47, and 389.41 km2 in 1987, 1990, 1996, 2000, 2007, 2010, and 2015, respectively. In terms of the temporal characteristics of land use/land cover changes, incremental rates from 1996 to 2007 more than doubled from 1987 to 1996 and from 2007 to 2015. With regard to spatial pattern, the cropland increased by 116.72 km2. Growth is mainly attributed to its transformation from a grassland and a barren land in the fringe of the oasis [27] and to the continuously expanding urban construction land within the oasis.
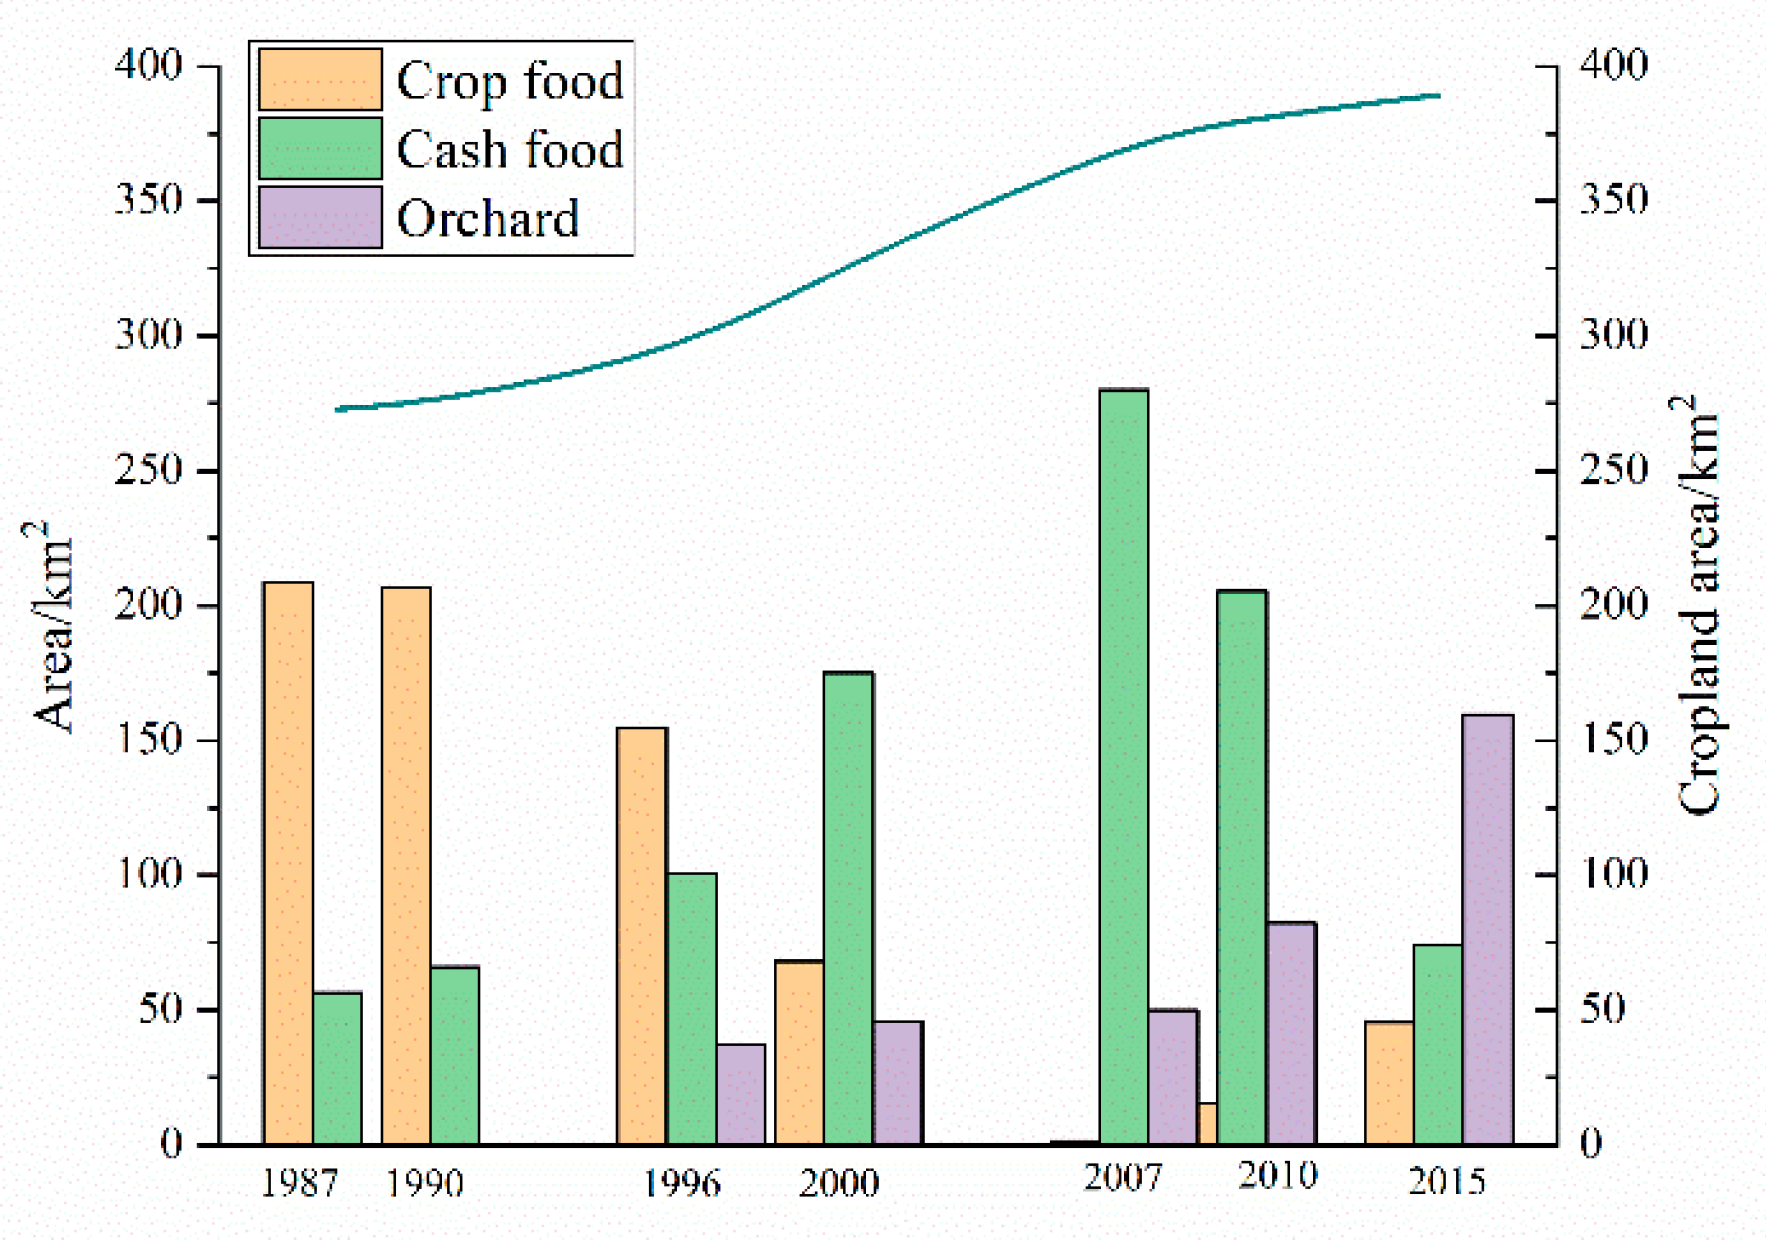
The three different-colored bar charts in Figure 4 represent the crop areas of crop food, cash food, and orchards. The planting structure exhibited marked changes and even transformed during the 1987–2015 period. Specifically, (1) the crop food area decreased continuously from 1987 to 2007, and the crop food area in 2007 was only 1.61km2, making it too small to display. Meanwhile, cotton was the main cash crop, which experienced a substantial increase owing to its high value. A distinct transformation in the food and cash crops from 1996 to 2000 can be observed, as the crop area of the cash crops gradually became larger than that of the food crops. In addition, the trial planting of grapes in the sandy soil region began in 1996. (2) In 2010, cotton areas gradually decreased, and grape orchards increasingly involved large-scale cultivation.
3.2. Water Consumption
3.2.1. Agricultural Water Consumption
Agricultural water consumption comprises the core section of the suitability evaluation of the oasis. In the Dunhuang Oasis, agricultural water consumption includes food crops, cash crops, and orchards. From 1987 to 2015, total water consumption increased initially from 2.293 × 10⁸ m3 in 1987 to 3.513 × 10⁸ m3 in 2007, then decreased to 2.902 × 10⁸ m3 in 2015 (Table 3). Listed individually in Table 3, food crop water consumption decreased sharply by 1.334 × 10⁸ m3 from 1987 to 2015. Meanwhile the water consumption of cash crops with high economic benefits progressively increased by 2.374 × 10⁸ m3 from 1987 to 2007 then began to decrease to 2.207 × 10⁸ m3 in 2010 and eventually decrease to a very low value of 0.774 × 10⁸ m3 in 2015. This trend in cash crop water consumption is closely related to that of grapes, which increased slowly before 2010 before rising rapidly.
3.2.2. Domestic and Industrial Water Consumption
Domestic and industrial water consumption should not be neglected in the suitability evaluation of the oasis. During the 1987–2015 period, the total population of the Dunhuang Oasis increased from 108,373 to 142,558, in which the rural population accounted for nearly 70% to 80%. Rural livestock increased from 349,820 sheep units in 1987 to 486,816 in 2015. In addition, the number of tourists increased from less than 100,000 in 1987 to 6,603,914 in 2015. Furthermore, industrial output increased by 84.6 × 10⁸ RMB [22]. Thus, we can calculate overall domestic and industrial water consumption under increasing populations and the booming tourism industry. Table 4 shows that overall domestic and industrial water consumption rapidly increased from 0.038 × 10⁸ to 0.219 × 10⁸ m3. The percentage of domestic and industrial water consumption in overall water consumption is very small.
3.3. Oasis Stability Evaluation
In this study, the total available water volume originates from the Danghe River; thus, we use its perennial mean runoff, that is, 4.13 × 10⁸ m3, as W1. From the above data, total available water quantity for the oasis in 1987, 1990, 1996, 2000, 2007, 2010, and 2015 was 1.79 × 10⁸, 1.66 × 10⁸, 1.37 × 10⁸, 1.78 × 10⁸, 0.43 × 10⁸, 0.67 × 10⁸, and 1.00 × 10⁸ m3, respectively. From the oasis stability evaluation, as shown in Equation (7), the H0 of the Dunhuang Oasis were 0.54, 0.51, 0.41, 0.39, 0.15, 0.19, and 0.22 from 1987 to 2015 (Table 5).
3.4. Suitable Oasis Irrigation District Scale
We take 2015 as an example and use Equation (8) to derive a suitable oasis irrigation district scale. Crops and natural vegetation are considered as having a common effect on kp, which is 0.72 [18], and the is set as two values, namely, 0.5 for the stable level and 0.75 for the extremely stable level.
Table 6 shows that the suitable oasis irrigation district scale was smaller than the actual area in 2015. According to the water–energy balance model, the current oasis irrigation district scale should be reduced by 168 and 241 km2 to attain stable to extremely stable levels, respectively.
4. Discussion
The planting structure exhibited two marked changes. The first planting structure change happens between crop food and cotton. Except for cotton’s high value and cultivation suitability, the rapidly increasing cotton lands, which were mainly attributed to farmers, had autonomy in terms of land use activities since the early 1980s under China’s economic reform policy. Against this background, farmers envisioned market economy ideas, and production activities were closely associated with market demands. In addition, the trial planting of grapes in the sandy soil region began in 1996. The second planting structure change happens between cotton and grape; this is because of successful grape trial experiments in the sandy soil region, and from then on, a large number of farmers began to install grape trellises in fields previously planted with cotton or wheat. Hence, the planting structure of the oasis changed once again.
Although the total cropland area increased by 18.01 km2 from 2007 to 2015, agricultural water consumption decreased by 0.611 × 10⁸ m3. This result may be beneficial to the transformation of crop patterns and water-saving irrigation measures. Traditional field canal irrigation was the primary irrigation pattern used in the past, but, from the beginning of 2010, advanced water-saving irrigation models, such as micro, pipe, and greenhouse micro irrigation, were implemented in the entire oasis.
Table 5 shows that stability was in a stable level in 1987 and 1990 owing to low agricultural, domestic, and industrial water consumption. During this period, though each industry was gradually developing, stability was not extremely stable, which may have been due to limited water resources. Farmers’ enthusiasm for production and cropland areas increased under reform and opening-up policies, but irrigation measures were difficult. At the same time, tourism in the Dunhuang Oasis began to flourish. When the national economy improved, the stability of the oasis fell to a metastable level from 1996 to 2000 and reached a dangerously unstable level from 2007 to 2010. Water resource exploitation and utilization rates nearly reached 100% in the oasis, in which agricultural water consumption accounted for nearly 90% of overall available resources [27]. Serious ecological problems, such as accelerated desertification and salinization, shrunken terminal lake and declining groundwater level, accompany rapid economic development [27]. Water has become the primary restricting and bottleneck factor in the socioeconomic development of the Dunhuang Oasis.
In this case, a series of water resource plans was implemented to address this issue, in which the most important program “Comprehensive Planning of the Rational Use of Water Resource and Protection of Ecosystem Services in the Dunhuang Basin” was proposed. This program aims to reduce the croplands of state farms, implement agricultural water-saving measures, and carry out a water diversion project from the Sugan Lank Basin to the Danghe River. Approximately 0.835 × 10⁸ m3 of water allocated from the water diversion project is intended for the improvement of the ecological environment, which plays a crucial role in alleviating the water crisis by increasing groundwater levels and recovering the vegetation in marginal areas of the oasis [20]. The system dynamic model simulated the agricultural water consumption under different scenarios in the Dunhuang Oasis and shows that the proportion of agricultural water consumption in overall water consumption can be reduced from 92.50% in 2010 to 86.30% in 2025 [20], but, if reduced by 168 km2, to attain a stable level, the agricultural water consumption should be decreased to at least half of what it is now. In this study, the suitable oasis area is far less than the actual area, which is a common issue in the Endorheic watershed oasis in Northwest China [2,16,28]. Reducing cropland in the oasis is the most direct and effective means, which is difficult to achieve. Specifically, individual croplands in the Dunhuang Oasis should be reduced to preserve the ecological environment. However, several reasons highlight the difficulty of this solution. (1) The reduction of croplands will harm the economic interests of farmers and subsequently decrease their quality of life. Thus, the possibility of criminal problems due to poverty should be considered. (2) The reduction of croplands is not in line with the Chinese policy of farmland protection. Hence, only on the basis of maintaining water-saving irrigation, reducing domestic water consumption, improving industrial water consumption efficiency, forbidding sprawl inside and outside the oasis, and increasing the amount of water allocated to the oasis from the water-transfer project, can the stability of the oasis be improved and the sustainable development of the regional economy and ecology be maintained.
5. Conclusions
This study analyzed the stability of the Dunhuang Oasis against the background of planting structure changes during the 1987–2015 period. Our main findings and recommendation are as follows:
- From 1987 to 2015, the oasis irrigation district area expanded internally and externally, and, at the same time, the planting structure underwent a marked transformation, from food crops to cash crops to orchards. In the Dunhuang Oasis, the structure of croplands might be quickly and flexibly changed according to economic perspective and visions and policy reforms
- In the Dunhuang Oasis, agricultural water consumption is mainly for food crops, cash crops, and orchards. From 1987 to 2015, food crop water consumption decreased sharply by 1.334 × 10⁸ m3, cash crop water consumption (cotton) first increased by 2.374 × 10⁸ m3 and then decreased substantially, and grape water consumption was closely related to that of cotton, which increased slowly in 2010 before rising rapidly.
- The Dunhuang Oasis was at a stable level in 1987 and 1990 but gradually declined until it reached a dangerously unstable level in 2010. Meanwhile, serious ecological problems emerged one after the other. Against the background of water-saving measures and the water-transfer project, the stable level of the oasis increased to a metastable level of 0.22 in 2015.
- The oasis irrigation district should be reduced by at least 168 km2 to reach a suitable scale. However, this goal does not facilitate the improvement of the living standards of farmers and is not in line with the Chinese policy of farmland protection. Hence, the most practical way at present is to increase allocated water resources from the water-transfer project to the oasis irrigation district.
Author Contributions
X.Z. and Q.W. conceived and designed the experiments. X.Z. and Y.Z. performed the experiments and analyzed the data. J.Q. provided remote sensing image of 2010 and 2015. X.Z. and Q.W. wrote the paper. All authors have read and agreed to the published version of the manuscript.
Funding
This research was funded by the National Science Foundation of China, grant number: 41701321 and No. 41661105.
Conflicts of Interest
The authors declare no conflict of interest.
References
- Li, X.; Cheng, G.; Ge, Y.; Li, H.; Han, F.; Hu, X.; Tian, W.; Tian, Y.; Pan, X.; Nian, Y.; et al. Hydrological Cycle in the Heihe River Basin and Its Implication for Water Resource Management in Endorheic Basins. J. Geophys. Res. Atmos. 2018, 123, 890–914. [Google Scholar] [CrossRef]
- Ling, H.; Xu, H.; Fu, J.; Fan, Z.; Xu, X. Suitable oasis scale in a typical continental river basin in an arid region of China: A case study of the Manas River Basin. Quat. Int. 2013, 286, 116–125. [Google Scholar] [CrossRef]
- Wang, Z.; Ficklin, D.L.; Zhang, Y.; Zhang, M. Impact of climate change on streamflow in the arid Shiyang River Basin of northwest China. Hydrol. Process. 2012, 26, 2733–2744. [Google Scholar] [CrossRef]
- Kang, S.; Su, X.; Tong, L.; Zhang, J.; Zhang, L. A warning from an ancient oasis: Intensive human activities are leading to potential ecological and social catastrophe. Int. J. Sustain. Dev. World Ecol. 2008, 15, 440–447. [Google Scholar] [CrossRef]
- De Fraiture, C.; Molden, D.; Wichelns, D. Investing in water for food, ecosystems, and livelihoods: An overview of the comprehensive assessment of water management in agriculture. Agric. Water Manag. 2010, 97, 495–501. [Google Scholar] [CrossRef]
- Cheng, G.; Li, X.; Zhao, W.; Xu, Z.; Feng, Q.; Xiao, S.; Xiao, H. Integrated study of the water–ecosystem–economy in the Heihe River Basin. Natl. Sci. Rev. 2014, 1, 413–428. [Google Scholar] [CrossRef] [Green Version]
- Custodio, E.; Andreu-Rodes, J.M.; Aragón, R.; Estrela, T.; Ferrer, J.; García-Aróstegui, J.L.; Manzano, M.; Rodríguez-Hernández, L.; Sahuquillo, A.; del Villar, A. Groundwater intensive use and mining in south-eastern peninsular Spain: Hydrogeological, economic and social aspects. Sci. Total Environ. 2016, 559, 302–316. [Google Scholar] [CrossRef] [Green Version]
- Micklin, P.P. Desiccation of the Aral Sea: A water management disaster in the Soviet Union. Science 1988, 241, 1170–1176. [Google Scholar] [CrossRef] [Green Version]
- Klein, I.; Dietz, A.J.; Gessner, U.; Galayeva, A.; Myrzakhmetov, A.; Kuenzer, C. Evaluation of seasonal water body extents in Central Asia over the past 27 years derived from medium-resolution remote sensing data. Int. J. Appl. Earth Obs. Geoinf. 2014, 26, 335–349. [Google Scholar] [CrossRef]
- Stone, R. Saving Iran’s Great Salt Lake; American Association for the Advancement of Science: Washington, DC, USA, 2015; Volume 349, pp. 1044–1047. [Google Scholar]
- Tourian, M.; Elmi, O.; Chen, Q.; Devaraju, B.; Roohi, S.; Sneeuw, N. A spaceborne multisensor approach to monitor the desiccation of Lake Urmia in Iran. Remote Sens. Environ. 2015, 156, 349–360. [Google Scholar] [CrossRef]
- Su, X.; Li, J.; Singh, V.P. Optimal allocation of agricultural water resources based on virtual water subdivision in Shiyang River Basin. Water Resour. Manag. 2014, 28, 2243–2257. [Google Scholar] [CrossRef]
- Ling, H.; Xu, H.; Liu, X. Suitable scale of oasis in Keriya River Basin, Xinjiang. Adv. Water Sci. 2012, 23, 563–568. [Google Scholar]
- Chen, Y.; Chen, Z. Analysis of oasis evolution and suitable development scale for arid regions: A case study of the Tarim River Basin. Chin. J. Eco Agric. 2013, 21, 134–140. [Google Scholar]
- Hu, S.; Song, Y.; Tian, C.; Li, Y.; Li, X.; Chen, X. Suitale scale of Weigan River plain oasis. Sci. China Ser. D Earth Sci. 2006, 36, 51–57. [Google Scholar]
- Hao, L.; Su, X.; Singh, V.P.; Zhang, L.; Zhang, G. Suitable oasis and cultivated land scales in arid regions based on ecological health. Ecol. Ind. 2019, 102, 33–42. [Google Scholar] [CrossRef]
- Tang, Q. Water resources and oasis construction in Tarim Basin. Nat. Resour. 1989, 6, 28–34. [Google Scholar] [CrossRef]
- Wang, Z.; Wang, H.; Lei, Z. Stability analysis of oasis in arid region. J. Hydraul. Eng. 2002, 5, 26–30. [Google Scholar]
- Li, X.; Yang, D.; Xia, F. Analysis of the water footprint of suburban planting in arid lands and determination of suitable farmland scale: A case study of urumqi. Acta Ecol. Sin. 2015, 35, 2860–2869. [Google Scholar]
- Zhang, X.; Jin, X.; Bai, X.; Jiang, Y.; He, C. Impacts of water resource planning on regional water consumption pattern: A case study in Dunhuang Oasis, China. J. Arid Land 2019, 11, 713–728. [Google Scholar] [CrossRef] [Green Version]
- Water Resource Department of Gansu Province. Comprehensive Planning of Rational Use of Water Resource and Protection of Ecosystem Services in the Dunhuang Region; Gansu People’s Publishing House Press: Lanzhou, China, 2011.
- Dunhuang National Economic Statistics Yearbook (1985–2015); Bureau of Statistics of The City of Dunhuang: Dunhuang, China, 2015.
- Janssen, L.L.; Van der Wel, F.J. Accuracy assessment of satellite derived land-cover data: A review. Photogram. Eng. Remote Sens. 1994, 60, 419–426. [Google Scholar]
- Allen, R.G.; Pereira, L.S.; Raes, D.; Smith, M. Crop Evapotranspiration—Guidelines for Computing Crop Water Requirements; FAO Irrigation and Drainage Paper 56; FAO: Rome, Italy, 1998. [Google Scholar]
- Land and Water Development Division of Food and Agricultural Organization (FAO). 2019. Available online: http://www.fao.org/fileadmin/user_upload/faowater/Applications/CRW8.ZIP (accessed on 7 November 2019).
- Industry Water Use Quota of Gansu Province; Water Resources Department of Gansu Province: Lanzhou, China, 2005.
- Zhang, X.; Zhang, L.; He, C.; Li, J.; Jiang, Y.; Ma, L. Quantifying the impacts of land use/land cover change on groundwater depletion in Northwestern China–A case study of the Dunhuang oasis. Agric. Water Manag. 2014, 146, 270–279. [Google Scholar] [CrossRef]
- Guo, H.; Ling, H.; Xu, H.; Guo, B. Study of suitable oasis scales based on water resource availability in an arid region of China: A case study of Hotan River Basin. Environ. Earth Sci. 2016, 75, 984. [Google Scholar] [CrossRef]
Figure 1.
Study area derived by Landsat TM imagery (Bands 5-4-3).

Figure 2.
Crop evapotranspiration coefficients.

Figure 3.
Land use/land cover spatial pattern from 1987 to 2015 in the Dunhuang Oasis.

Figure 4.
Planting structure changes in the Dunhuang Oasis.


Table 1.
Water use coefficient.
| Item | Coefficient | Unit | |||
|---|---|---|---|---|---|
| 1987–1990 | 1991–2000 | 2001–2007 | 2008–2015 | ||
| Urban resident water-use coefficient (C1) | 80 | 95 | 110 | 120 | L/day |
| Rural resident water-use coefficient (C2) | 25 | 45 | 60 | 80 | L/day |
| Tourist water-use coefficient (C3) | 100 | 250 | 400 | 400 | L/day |
| Livestock water-use coefficient (C4) | 15 | 15 | 20 | 20 | L/day |
| Industrial water-use coefficient (C5) | 215 | 205 | 185 | 180 | m3/104 RMB |
Table 2.
Classification of oasis stability.
| H0 | Type | Evaluation of Exploration and Utilization |
|---|---|---|
| >0.75 | Extremely stable | Has potential |
| 0.50–0.75 | Stable | Safeguarded; the oasis has limited developmental potential |
| 0.20–0.50 | Metastable | Does not have developmental potential |
| <0.20 | Unstable | Reduced oasis scale |
Table 3.
Agricultural water consumption in 1987–2015 (108 m3).
| Year | Food Crop | Cash Crop | Grape/Orchard | Sum |
|---|---|---|---|---|
| 1987 | 1.727 | 0.566 | 0 | 2.293 |
| 1990 | 1.754 | 0.668 | 0 | 2.422 |
| 1996 | 1.300 | 0.984 | 0.389 | 2.673 |
| 2000 | 0.585 | 1.780 | 0.489 | 2.854 |
| 2007 | 0.015 | 2.940 | 0.558 | 3.513 |
| 2010 | 0.139 | 2.207 | 0.915 | 3.261 |
| 2015 | 0.393 | 0.774 | 1.735 | 2.902 |
Table 4.
Domestic and industrial water consumption in 1987–2015 (108 m3).
| Year | Domestic | Industrial | Sum |
|---|---|---|---|
| 1987 | 0.034 | 0.004 | 0.038 |
| 1990 | 0.036 | 0.007 | 0.043 |
| 1996 | 0.050 | 0.026 | 0.076 |
| 2000 | 0.045 | 0.045 | 0.09 |
| 2007 | 0.064 | 0.117 | 0.181 |
| 2010 | 0.075 | 0.116 | 0.192 |
| 2015 | 0.102 | 0.117 | 0.219 |
Table 5.
Stability of Dunhuang Oasis.
| Year | P/(mm) | ET0/(mm) | W1-W2 (108 m3) | H0 |
|---|---|---|---|---|
| 1987 | 43.80 | 1300 | 1.79 | 0.54 |
| 1990 | 45.60 | 1279 | 1.66 | 0.51 |
| 1996 | 40.20 | 1288 | 1.37 | 0.41 |
| 2000 | 36.70 | 1357 | 1.78 | 0.39 |
| 2007 | 87.40 | 1355 | 0.43 | 0.15 |
| 2010 | 50.90 | 1322 | 0.67 | 0.17 |
| 2015 | 31.40 | 1299 | 1.00 | 0.22 |
Table 6.
Suitable oasis irrigation district scales/km2.
| Year | Status Quo 2015 | Suitable Scale(A)/Km2 | |
|---|---|---|---|
| 2015 | 0.5 | 389 | 221 |
| 0.75 | 148 |
© 2020 by the authors. Licensee MDPI, Basel, Switzerland. This article is an open access article distributed under the terms and conditions of the Creative Commons Attribution (CC BY) license (http://creativecommons.org/licenses/by/4.0/).
Share and Cite
MDPI and ACS Style
Zhang, X.; Zhang, Y.; Qi, J.; Wang, Q. Evaluation of the Stability and Suitable Scale of an Oasis Irrigation District in Northwest China. Water 2020, 12, 2837. https://doi.org/10.3390/w12102837
AMA Style
Zhang X, Zhang Y, Qi J, Wang Q. Evaluation of the Stability and Suitable Scale of an Oasis Irrigation District in Northwest China. Water. 2020; 12(10):2837. https://doi.org/10.3390/w12102837
Chicago/Turabian StyleZhang, Xifeng, Yifan Zhang, Jinghui Qi, and Qiang Wang. 2020. "Evaluation of the Stability and Suitable Scale of an Oasis Irrigation District in Northwest China" Water 12, no. 10: 2837. https://doi.org/10.3390/w12102837
Note that from the first issue of 2016, this journal uses article numbers instead of page numbers. See further details here.