1. Introduction
The Middle East and North Africa regions (hereafter MENA) correspond to a large arid zone with particularly vulnerable water resources [
1]. Nowadays, this situation is exacerbated by global warming issues [
2] affecting the whole MENA area. During the last few decades, this region has undergone one of the highest rates of mean surface temperature rise in the world [
3], with the temperature increase reaching between 0.5 and 1.0 °C per decade [
4]. Climatic evolution has affected the availability and quality of water resources in MENA, with a strong impact on populations [
5] and human activities [
6,
7,
8].
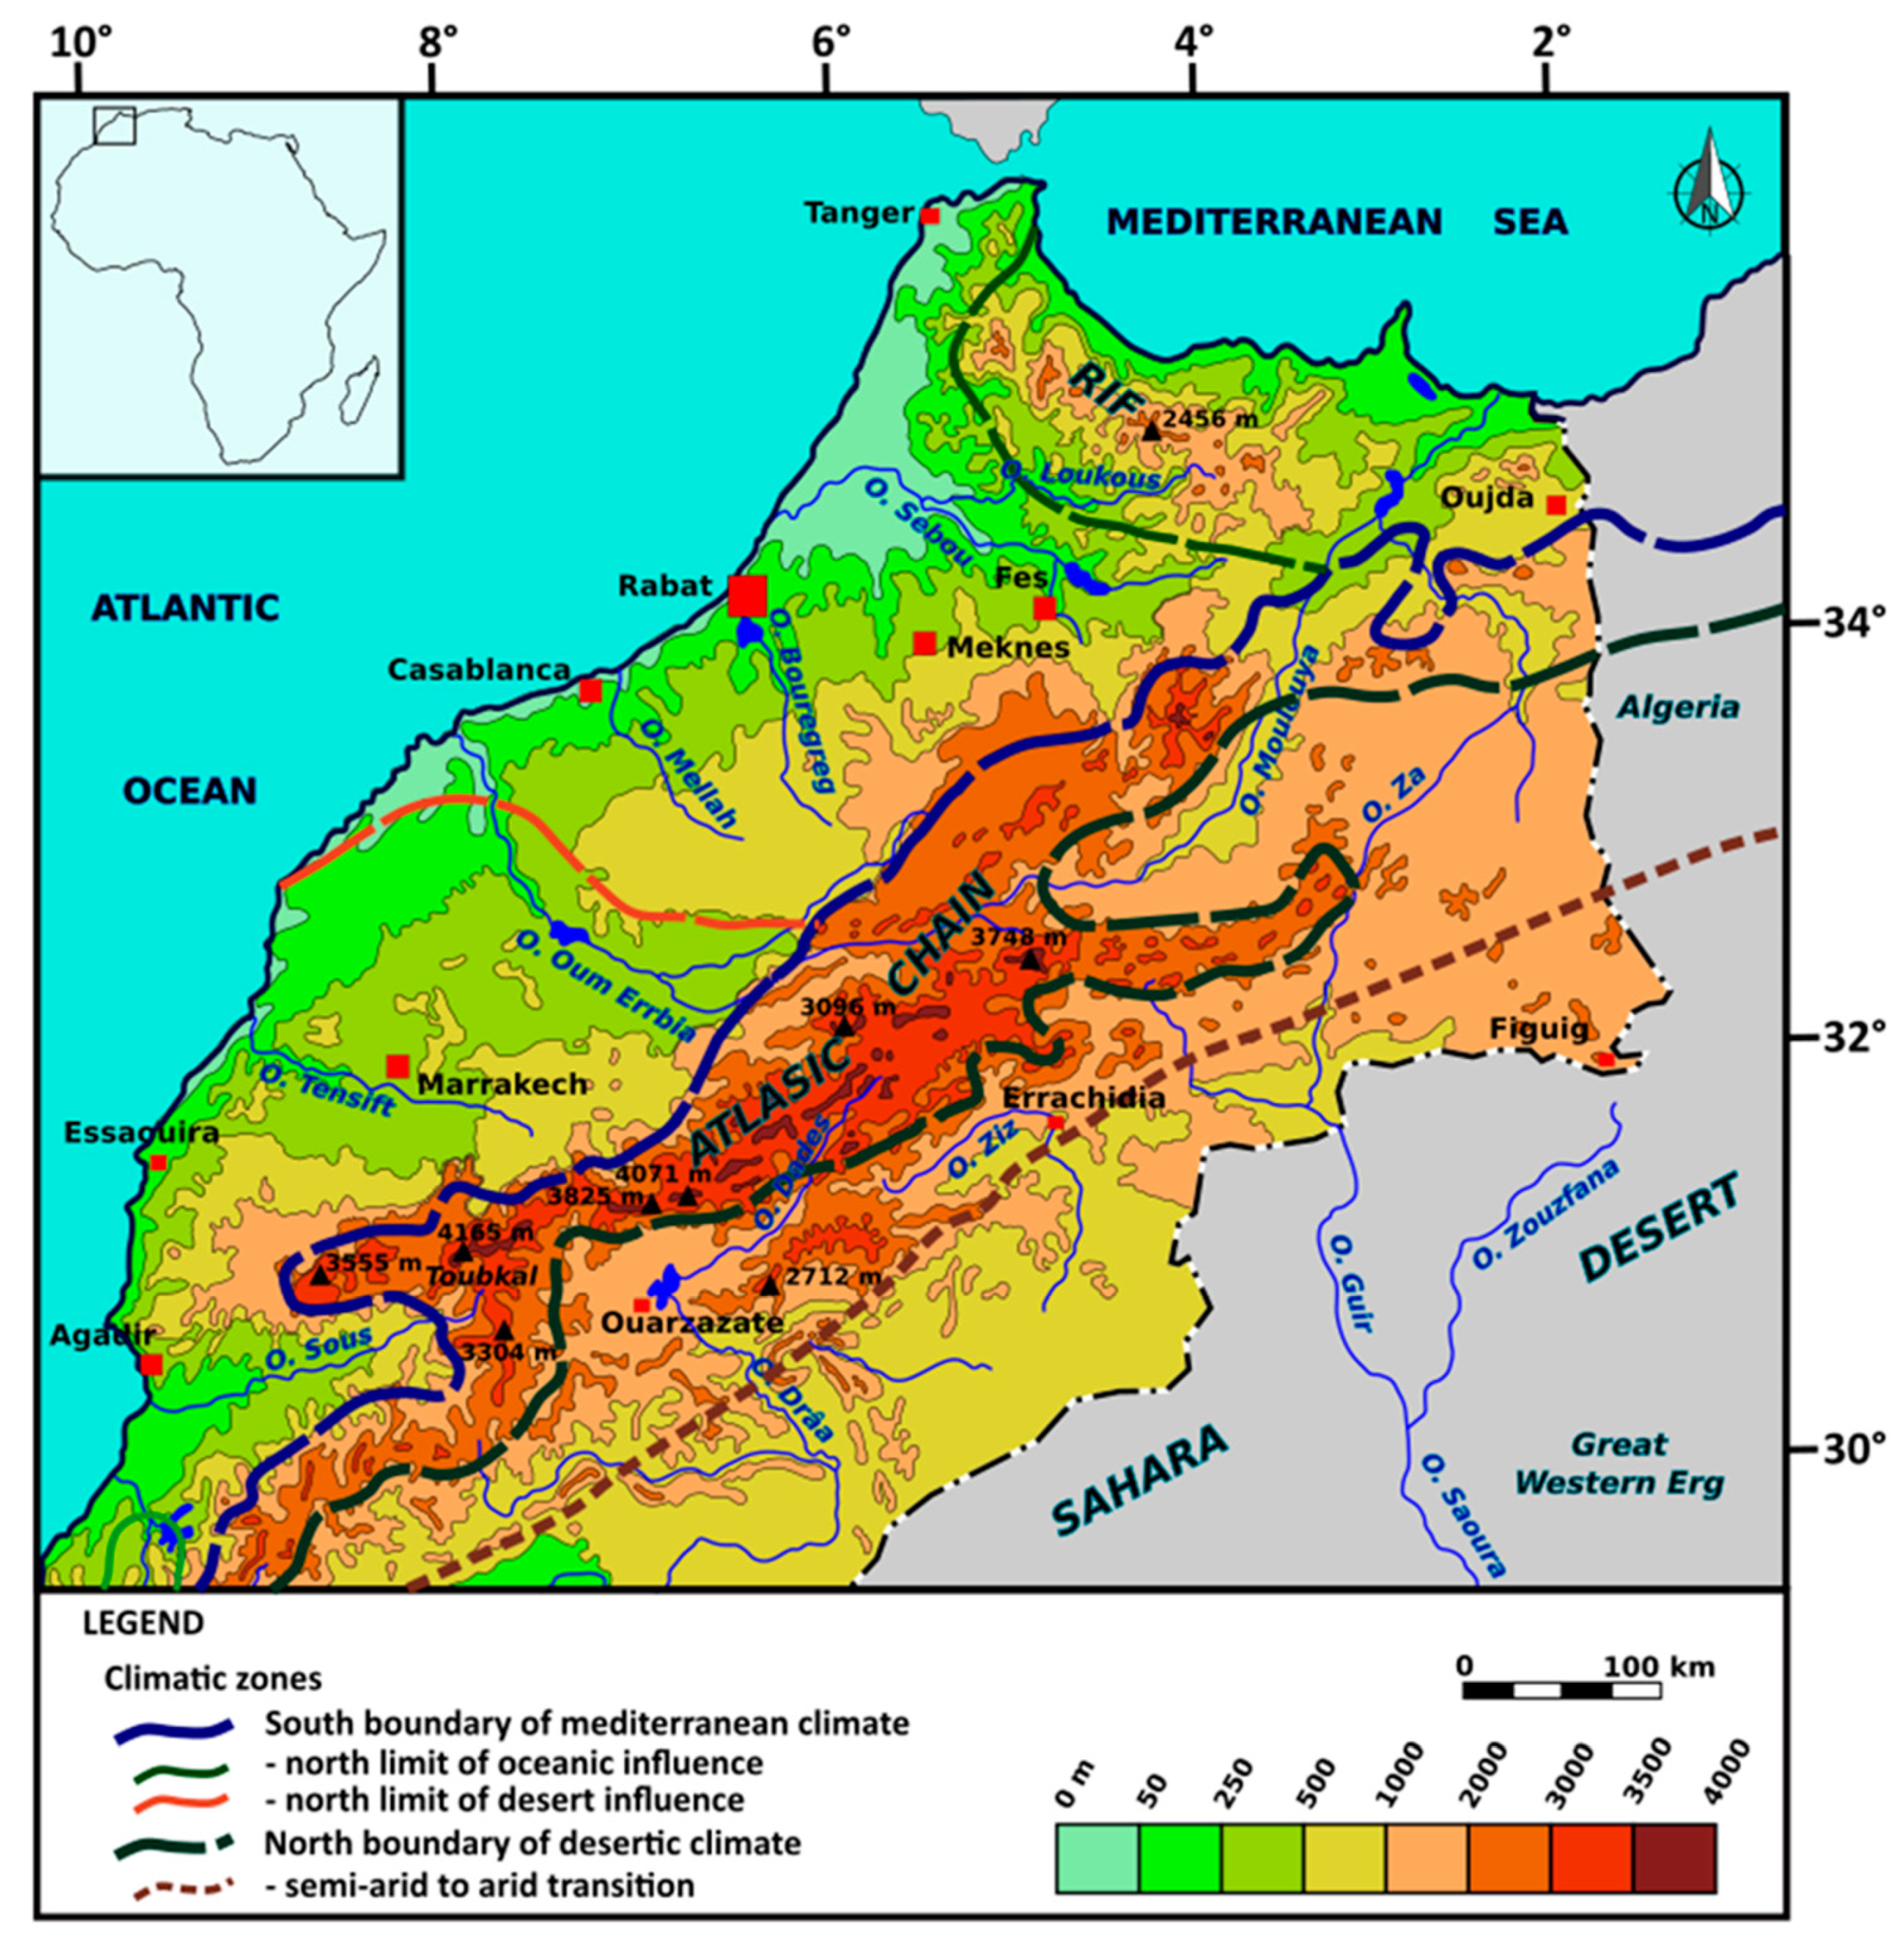
Morocco (
Figure 1) is a domain of highlands and intra-mountainous basins between the West Sahara Desert and coastal plains bordering the North Atlantic Ocean and Mediterranean Sea. The most important part of the country is located between arid and semi-arid southern zones under Saharan influence and moderate zones close to the Mediterranean and Atlantic coasts, with wet winters and hot and dry summers [
9,
10]. At the boundary of these climatic zones, high mountains of Atlas and Rif are cooler and receive more precipitation, while the northeastern border of the Atlas chain is an arid steppe area with cold winters [
11]. In addition, these high reliefs are the water towers of all Moroccan wadis.
Located in Northeast Morocco, along the Algerian border, the hydrographic basin of the Upper Guir includes, respectively, the occidental and oriental parts of the administrative regions of Errachidia and Figuig (
Figure 1). This area stretches from the southeastern foothills of the Atlas ranges to the western end of the Sahara Desert. The highlands of the High Atlas receive the most important part of the rainfall and represent the regional recharge zone. From an economic standpoint, the mountainous zone is the domain of livelihood activities related to itinerant sheep rearing and, in some places, small family palm groves. More recently, artisanal and industrial mining activities have developed to extract Ba and Pb. On the other hand, the activity of the piedmont area is linked to the cultivation of the date palm (around 770,000 trees), with plantations in the large wadi-beds irrigated by the khettaras system. At present, date palm tree production represents only 5% of the total Moroccan production but considerable development projects for this production are being implemented in the Upper Guir.
This is why the piedmont of the High Atlas is an important target of the “Green Morocco Project”, which focuses on the economic development of this rural area. This large-scale project aims at the development of palm plantations outside of traditional areas. Started in 2008, the objective of the plan is far-reaching: develop competitive agriculture able to respond to national and international markets, accelerate regional growth and reduce poverty in rural areas [
16]. The water requirement of this project is considerable. The objective is to plant 2.765 million palm trees on 28,400 ha. In Errachidia’s climate, each mature date palm will need 30 to 76 m
3/year to have efficient production depending on its water regime, with an optimal value of 51 m
3/year/feet [
17]. Consequently, within this single activity, the additional water requirement will be 1.41 × 10
8 m
3/year on average.
Along with economic expansion, recent nationwide forecasts predict a population growth rate of 20 to 30% in urban centers for 2050, with a concomitant increase in water demand. At the same time, due to global change, rainfall is expected to decrease (−15% by 2050) [
16]. In this context, water resources will be under very high pressure. To address this issue, the authorities have launched a comprehensive program to build dams and small reservoirs for the storage of runoff waters. However, this technical option turned out to be relatively limited due to several issues (silting of the dams, important evaporation losses, etc.). The other alternative is to turn to groundwater exploitation. In the Figuig region, where the next stage of the “Green Morocco Project” will take place. Knowledge about the availability of groundwater resources is very poor, at least insufficient to undertake sustainable exploitation in order to preserve the resources. Groundwater abstractions will inevitably increase with the risk of overexploitation and degradation.
The study of such a hydrogeological system in a mountainous context in an arid to semi-arid climate is always difficult [
18,
19,
20] and requires understanding the groundwater flow system, the physical and the chemical processes controlling groundwater quality and the recharge process of the system. A pluridisciplinary approach based on geology, piezometry, hydrochemistry, isotopes, etc., has been implemented. The main objective of this study is to evaluate the availability of groundwater resources in the Upper Guir Basin—in particular, the groundwater flow path, the processes of groundwater mineralization, the localization of recharge zones, the groundwater quality for drinking and irrigation purposes and the estimation of groundwater mean residence time [
20]. Overall, the aim is to provide decision-makers with sufficient information to take the right initiative for the sustainable exploitation of groundwater.
2. Geological Settings
The study area is situated in the Southeast of Morocco, near the Algerian border, and belongs to the middle part of the Moroccan High Atlas (
Figure 2). It lies between 31°93′ and 33°00′ N latitudes and 04°00′ and 02°75′ E longitudes and covers a total surface of 6663 km
2. The geomorphology can be briefly described as a succession of sub-parallel alignments of rocky ridges trending west–east, whose topographic elevation decreases from 2430 to 780 m from north to south. At the end of the southern rocky ridge extends a vast piedmont plain constituting the Hammada of Guir.
This area stretches from the southeastern foothills of the Atlas ranges to the western end of the Sahara Desert and corresponds to the hydrologic basin of the Eastern Upper Guir wadi. The main tributaries of the Guir wadi are the wadis El Hallouf, Ghezouane, Aït Aissa and Bouanane (
Figure 3). On a larger scale, the Guir wadi, one of the main wadis in Eastern Morocco, constitutes the western tributary of the Saoura wadi, an important wadi in the Western Sahara, whose vast endorheic watershed extends from Morocco to Algeria, at the western limit of the Great Western Erg. The study area, the Talsint-Bouanane region, constitutes the eastern part of the Guir wadi watershed (see
Figure 1) and belongs to the eastern part of the Moroccan High Atlas.
The outcropping terrains in the study area range from the Triassic to the Quaternary (
Figure 3). Precambrian and Lower Paleozoic formations (schists, quartzites and intrusive rocks) outcrop locally in areas limited to the core of the faulted anticlines or in a few tectonic windows (Upper Guir). The Triassic is represented by marls, clays, evaporites and volcanic formations. The volcanic layers (basalts and dolerites) are generally interstratified in marl-clay formations. Jurassic constitutes almost the whole of the Atlas chain. The lower Lias, calcareo-dolomitic, constitutes the layer with the greatest continuity. It gives the Atlas chain the originality of its structural shapes in straightened ridges of massive limestone and dolomitic limestone.
The Toarcian-Aalenian marl limestone series is covered by the Dogger (limestones, marl limestones and marls). The Jurassic ends with a mainly sandstone continental series (Upper Jurassic). The Cretaceous is composed of an alternation of marls, marl limestones, sandstones and evaporites. The Tertiary is made up of sandstone limestones, red sandstones (Eocene) and, in the southern piedmont of the High Atlas, by conglomerates, lacustrine limestones, fine sandstones and marls. The Quaternary consists of continental filling formations.
The current structures of the basin are quite complex and are linked to the opening and closing of the Tethyan ocean domain to the east and to the continuous opening of the North Atlantic Ocean to the west [
21,
22,
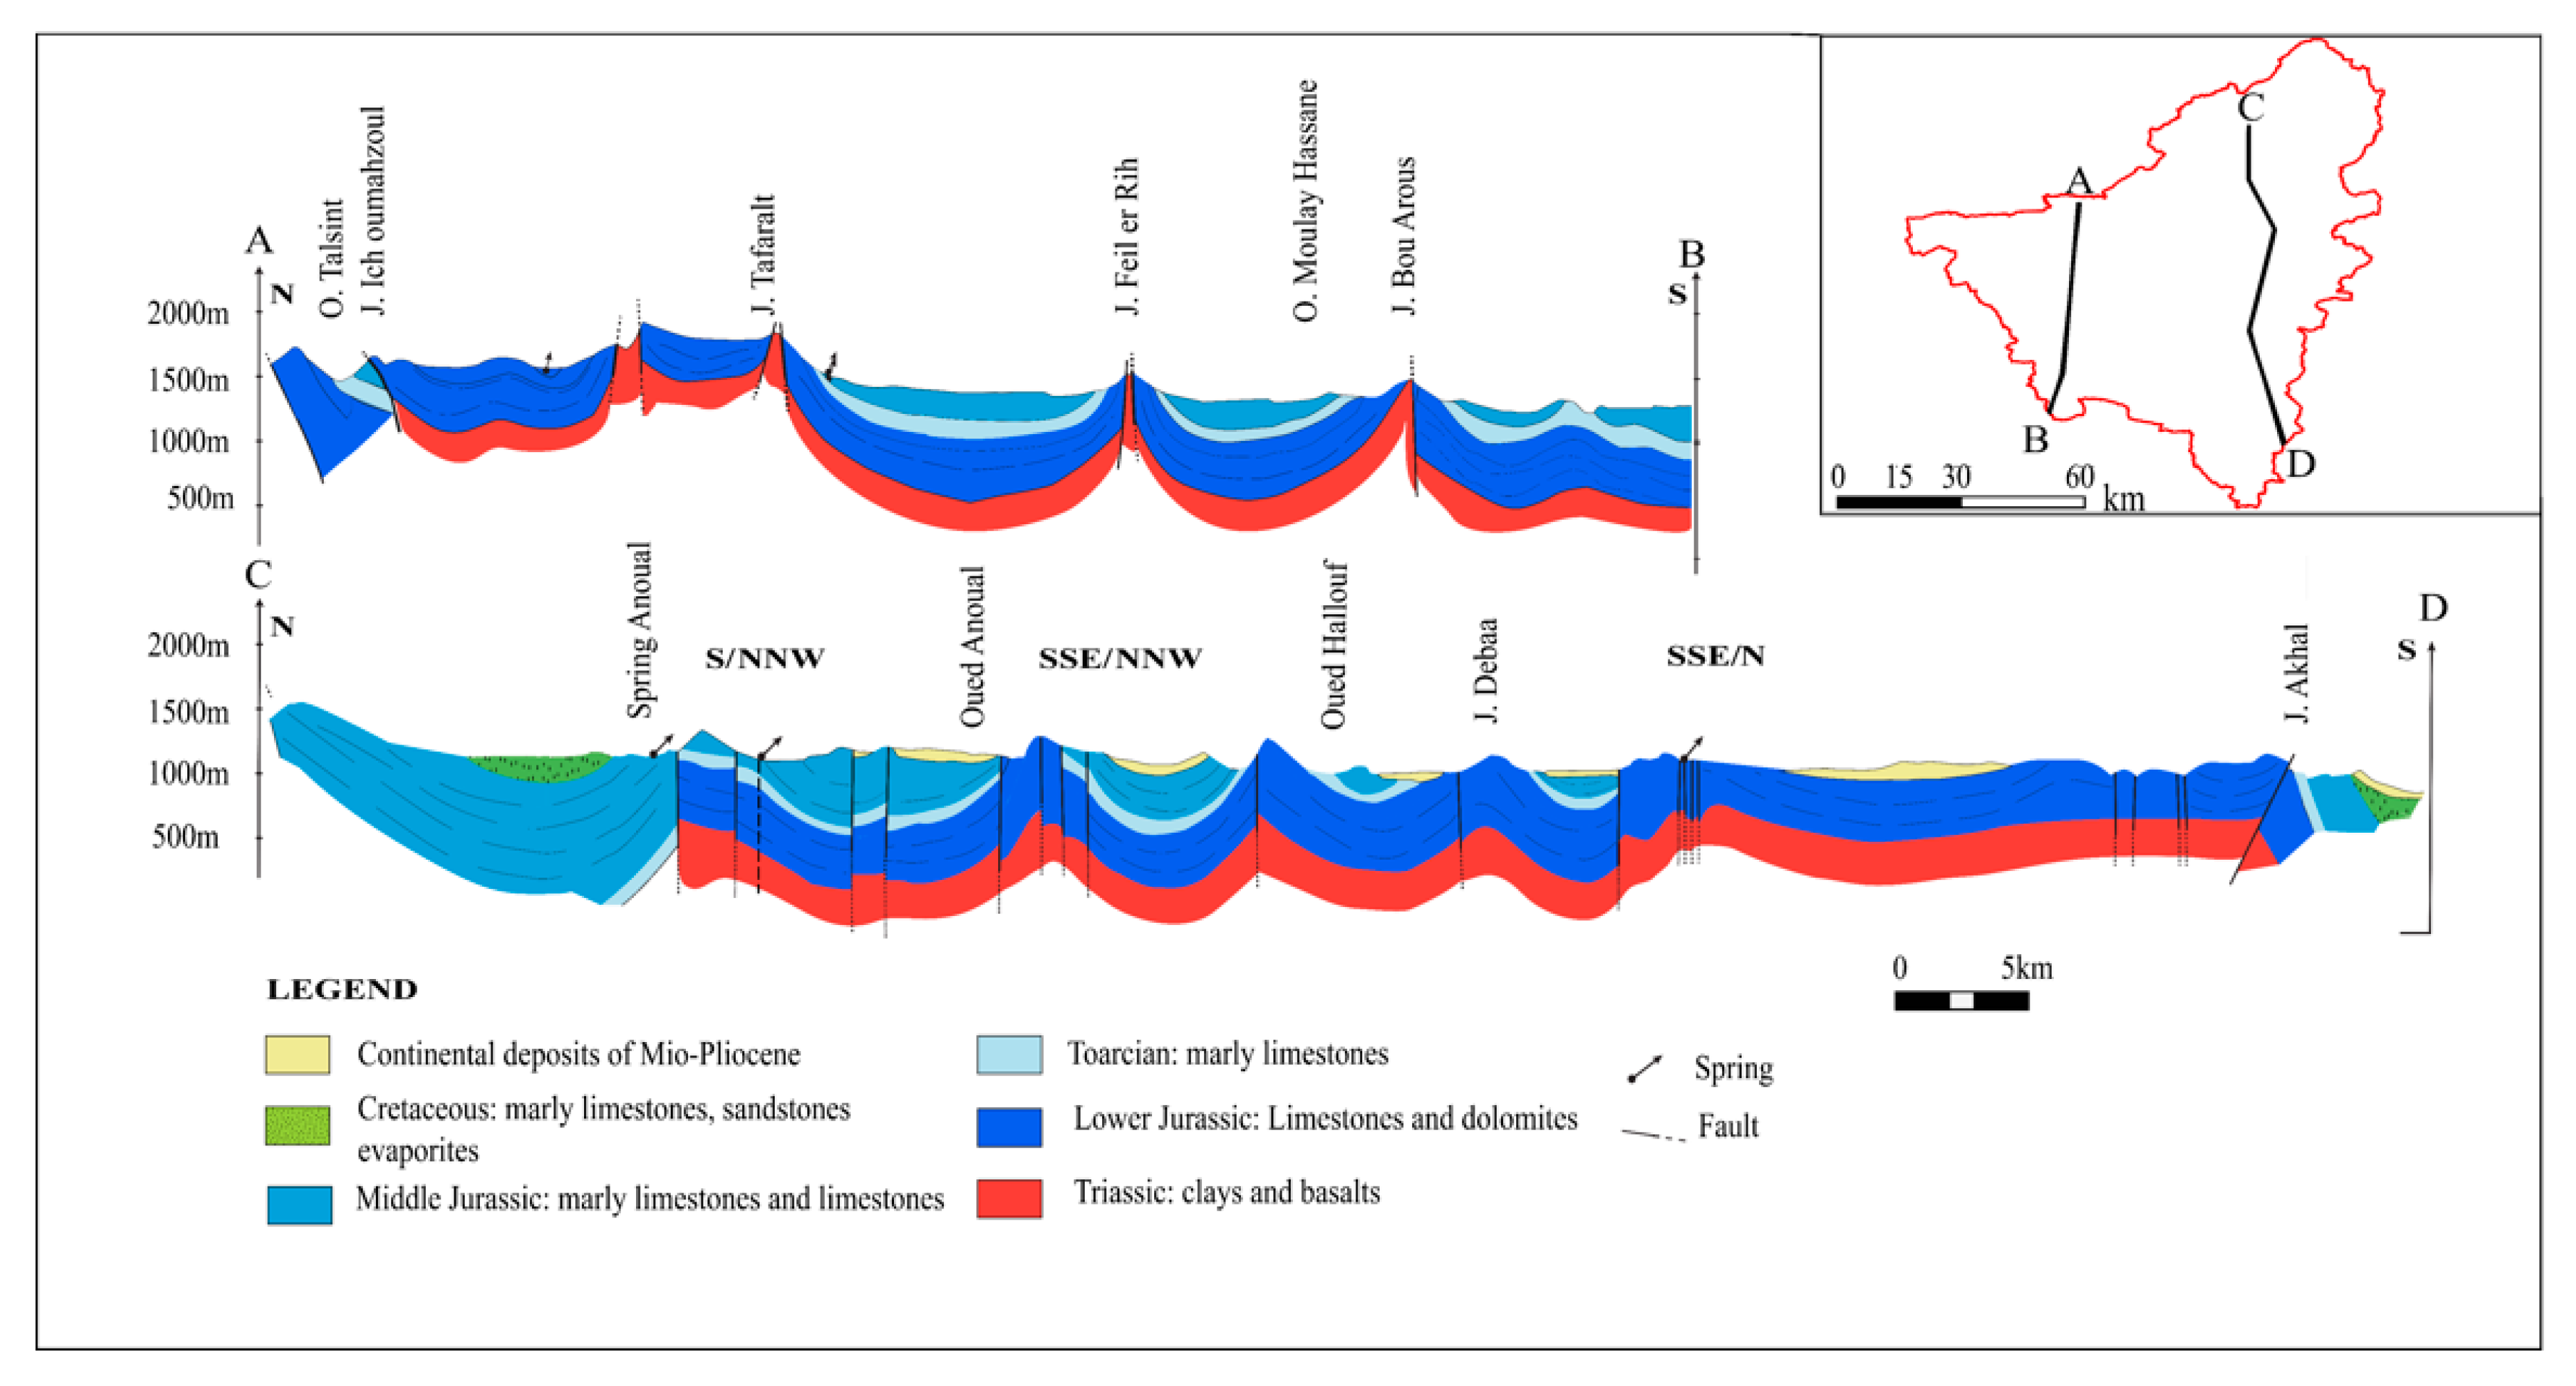
23], from the Triassic–Jurassic limit (200 Million years). The current structures are the heritage of a very complex multiphasic tectonics composed of a succession of extensive and compressive movements in association with shear forms. The terrains are thus affected by a sub-parallel network of major E-W faults, delimiting very distinct structural groups. Many smaller ESE-WNW and ENE-WSW accidents cut across these major structural units. The N-S compressive tectonics is responsible for an intense folding of the sedimentary terrains, causing the formation of successive synclines and anticlines (
Figure 4). The anticlines are marked by large sub-parallel alignments of limestone rock ridges oriented E-W. Their cores were affected by reverse thrust faults which induced the rise of the oldest terrains and favored the diapirism of the Triassic terrains due to the presence of evaporite formations (
Figure 4).
3. Hydrographic Network of the Wadi Guir
This geodynamic and lithostratigraphic heritage greatly constrains the drainage system in the study area. Schematically, it is a broadly inclined plane with a general dip of 1 to 2° ESE compartmentalized by rocky alignments which constitute topographical barriers locally interrupted by narrow and deep gorges. The whole watershed of the Guir wadi covers an area of 18,000 km
2. All the wadis included in this basin are intermittent—they only flow during the rainy periods. Located in the High Atlas (
Figure 5), the upper course of the Guir wadi can be divided in two parts. The Western Guir begins in the north of the locality of Gourama, in the Jebel Mesrouh (2736 m). To the east, the Upper Guir corresponds to the Bouanane wadi, which drains all the tributaries of the eastern end of the High Atlas. These two parts of the Upper Guir meet in the piedmont zone. The study area (6663 km
2) specifically targets the area of the Eastern Upper Guir (EUG). Within this watershed, the wadi network includes the main tributary, wadi Bouanane and its sub-tributaries (Ramlia, El Hallouf, Ghezouane, Aït Aissa and Sidi Youb wadis).
The wadis are intermittent and flow during rainy periods from a few hours to a few days depending on the rainfall intensity. Discharges of the wadis have not been measured to date. Their network is strongly constrained by the geomorphology (
Figure 5) inherited from the regional tectonical history (see
Figure 2). The major W-E reverse thrust faults affecting the anticline structures of the High Atlas (
Figure 5) correspond to steep reliefs dividing the landscape into sub-basins (
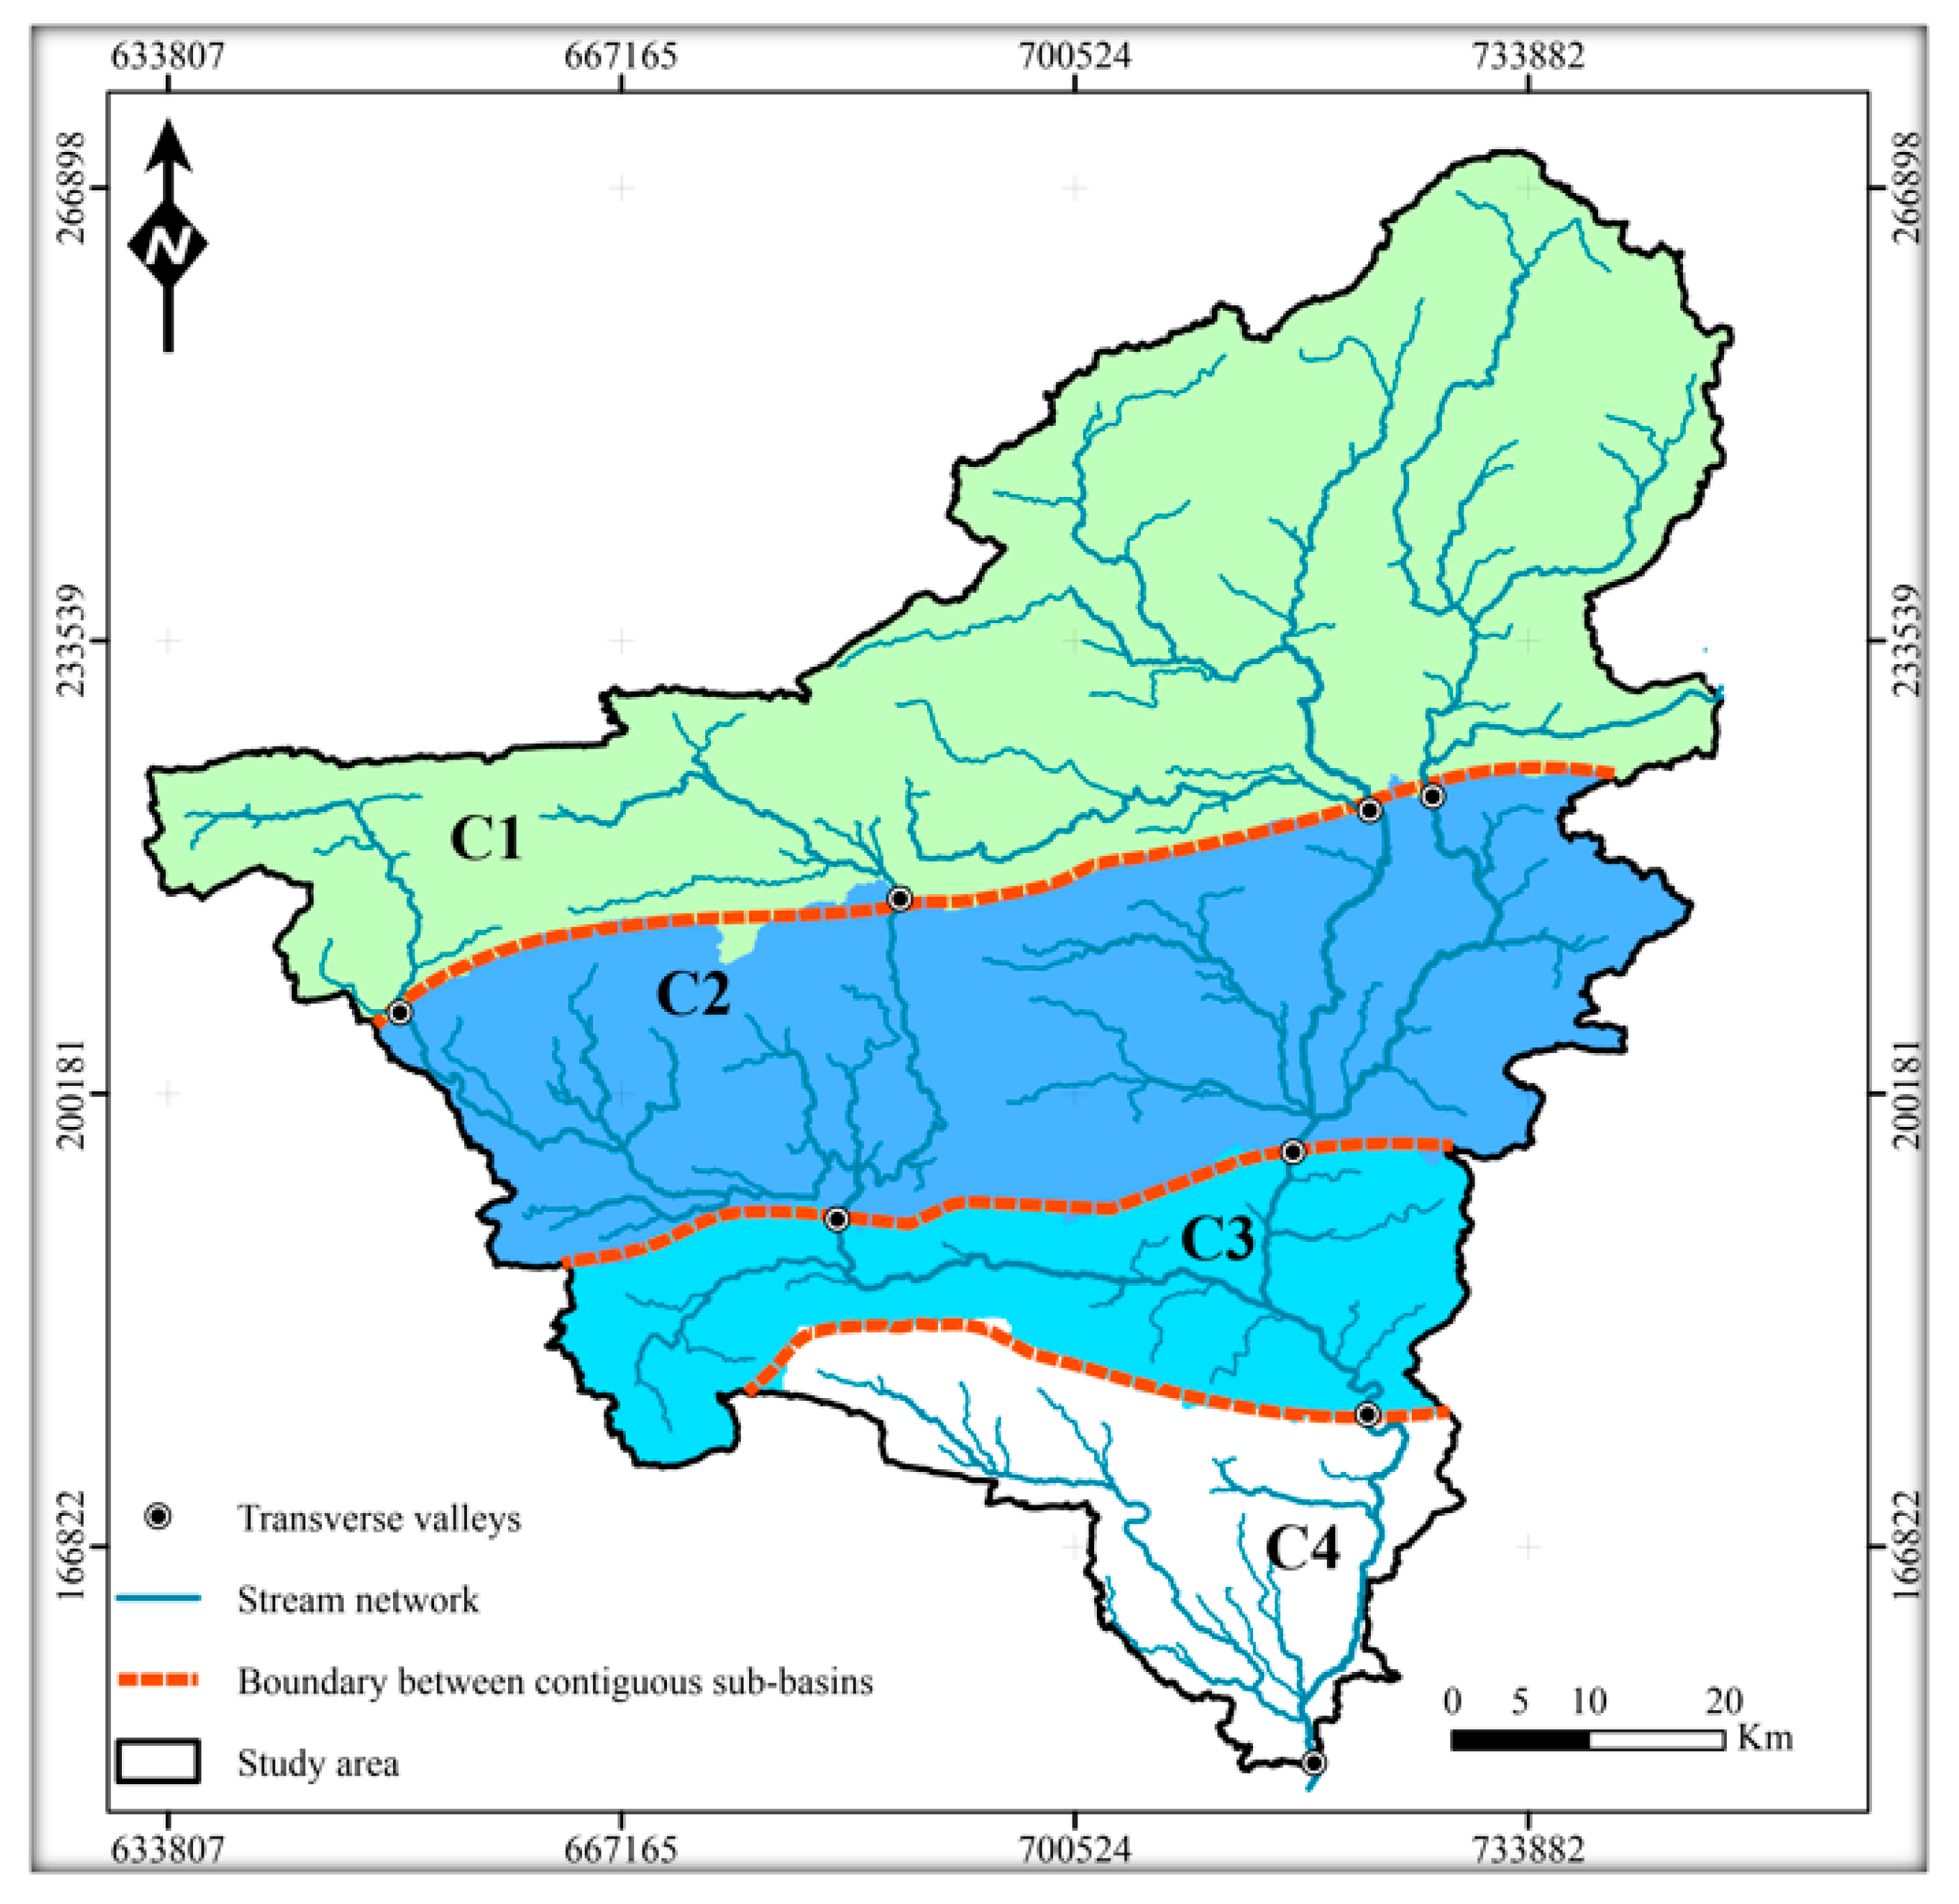
Figure 6). Four main sub-basins (C1 to C4) are delimited by these topographical barriers. In places, these W-E topographical barriers are cross-cut by N-S transverse valleys (narrow gorges) which allow the wadis to flow from the upstream sub-basins to the downstream sub-basins. In sub-basin C4, the existence of a W-E tectonic window (see
Figure 5) of basement rocks locally affects the wadi’s course. However, this window is of limited area and it does not act exactly like the aforementioned barriers.
4. Regional vs. Local Climate
The climate is semi-arid, characterized by low rainfall. The statistics of the rainfall data measured at three stations available in the study area in Morocco (Aït Haddou, Tit N’Aissa, Bouanane, Morocco) are presented in
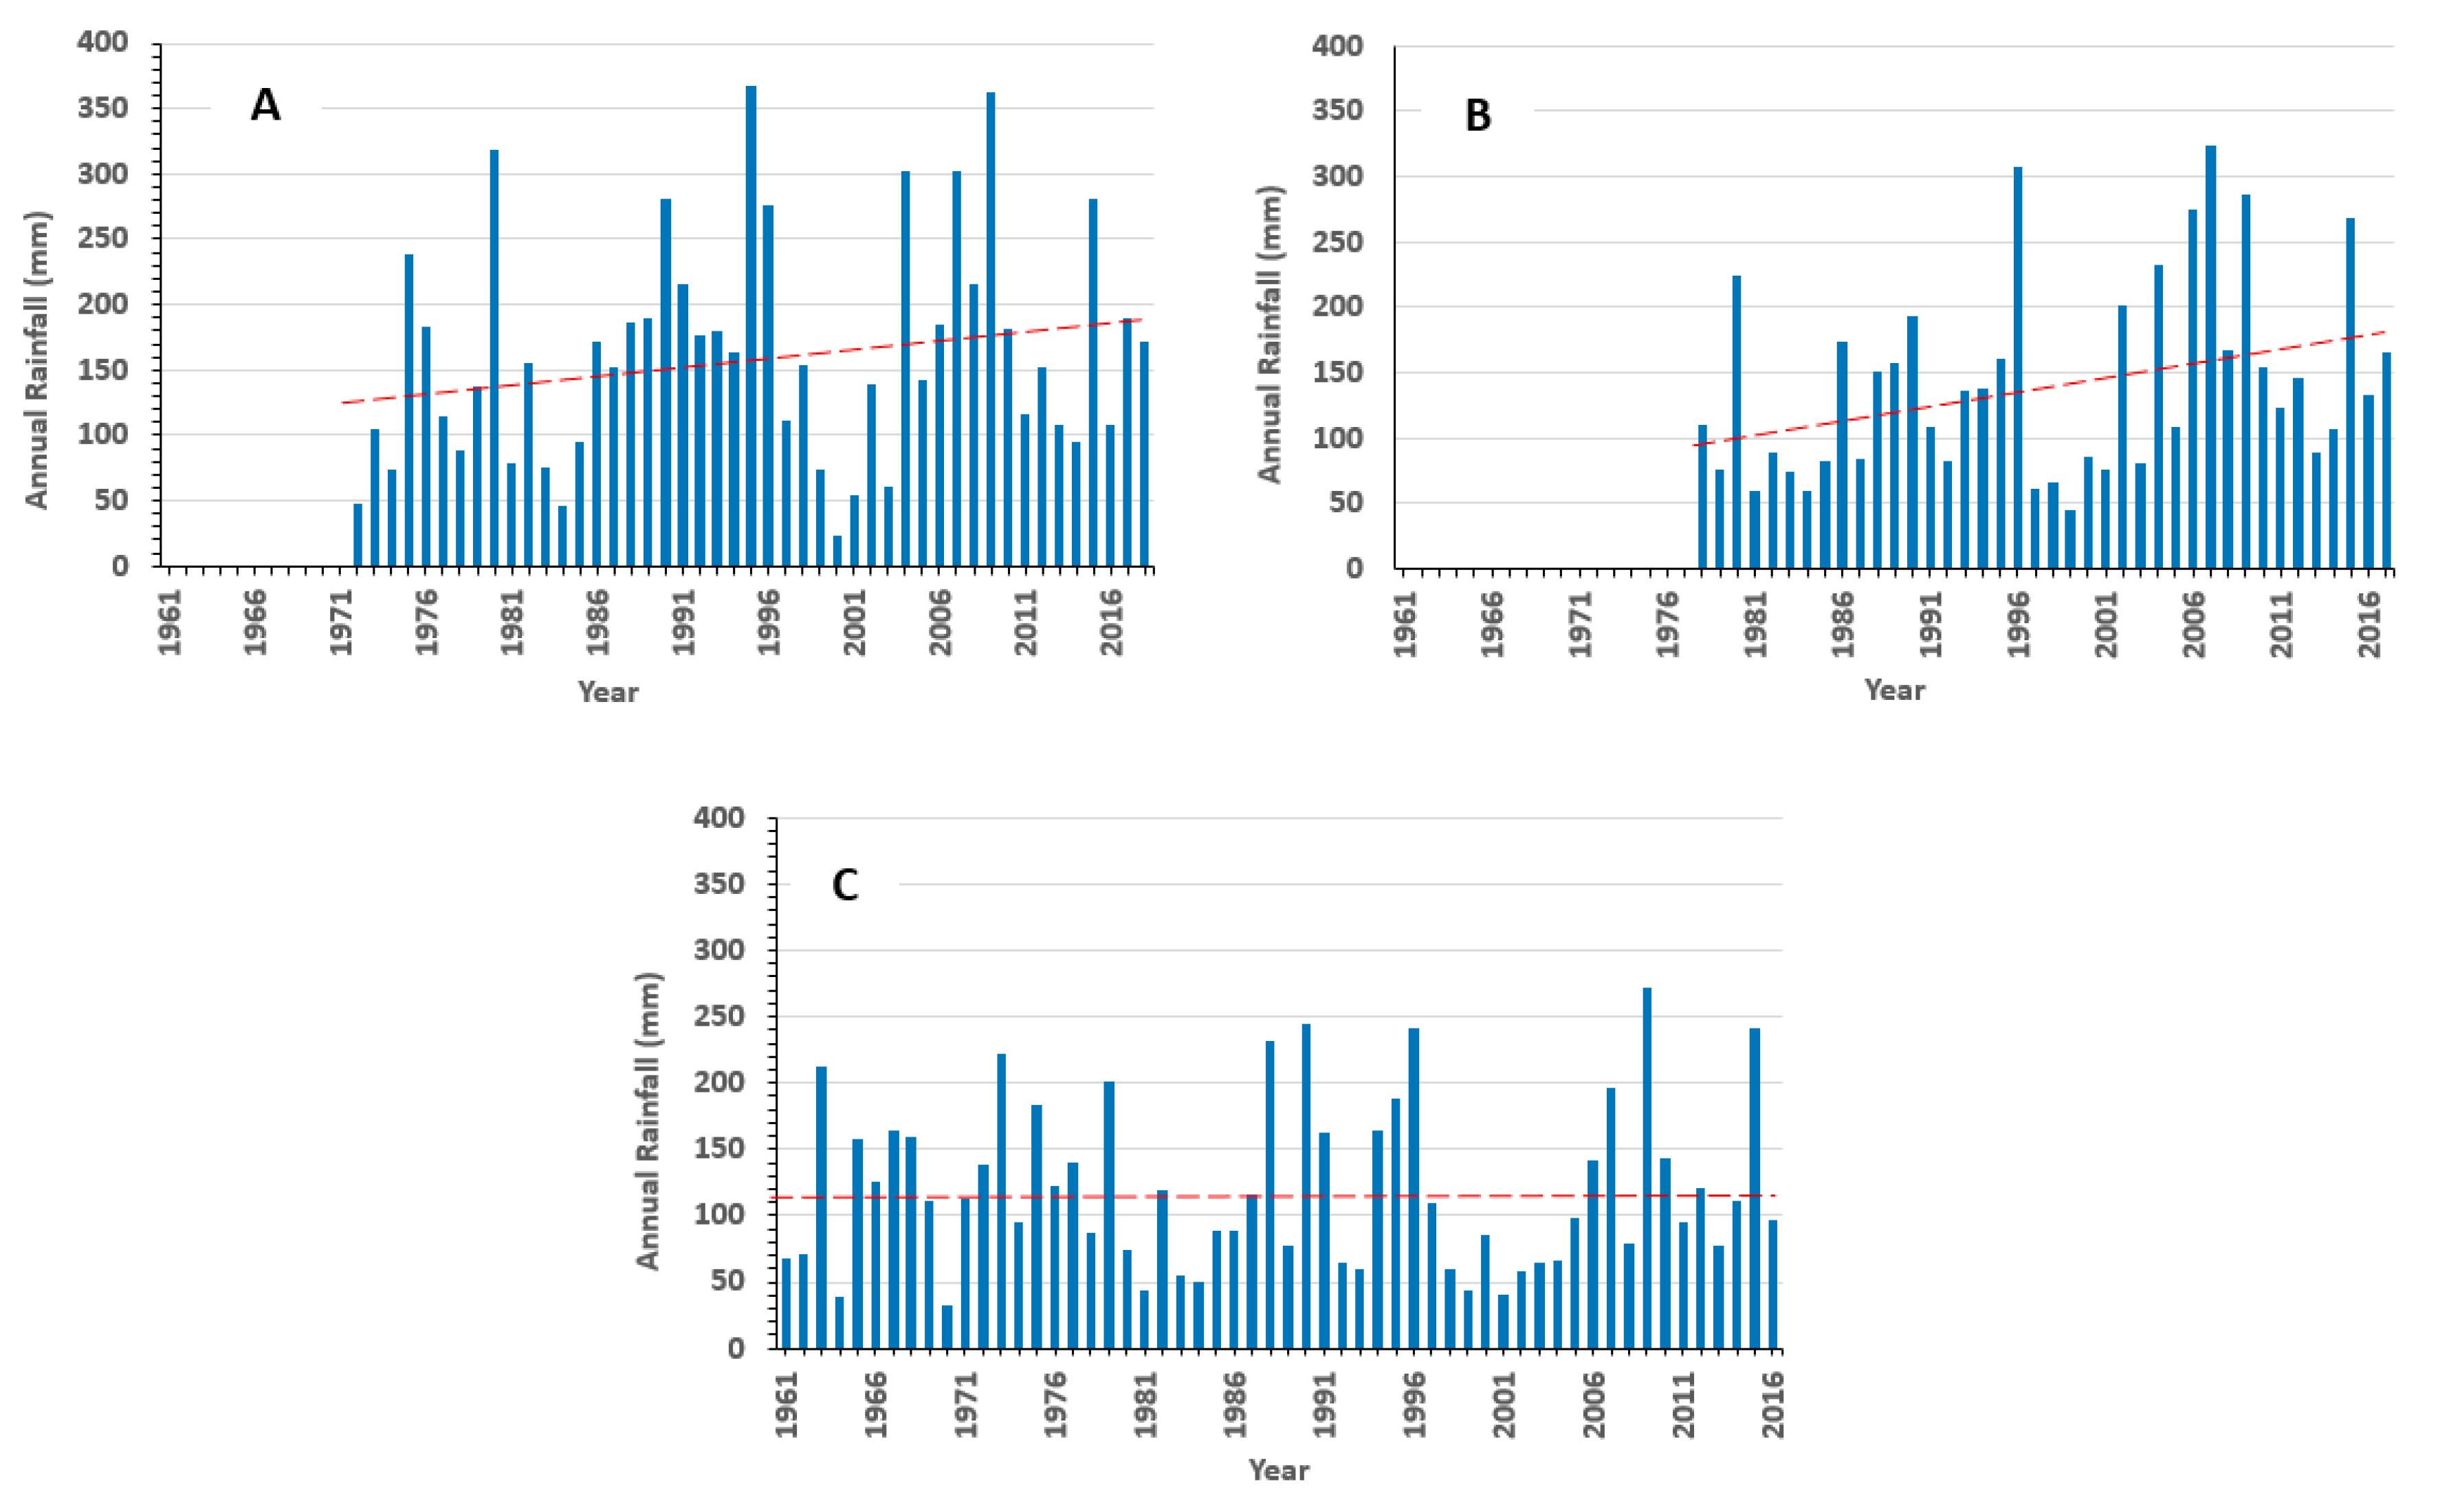
Table 1. The average annual rainfall remains very low (<200 mm/year). The minimum values (23 mm < Pmin < 44 mm) indicate that the region is subject to periods of drought. The maximum rainfall is not high since it does not exceed 400 mm (272 mm < Pmax < 367 mm). The average rainfall is higher at Aït Haddou station located in the High Atlas.
Figure 7 shows the distribution of rainfall across Morocco and highlights the low rainfall occurrence in the study area.
The rainfall series recorded at the three stations are shown in
Figure 8. The linear trend over several decades at each station is also shown in this figure. A paradoxical slight increasing trend is depicted at the Aït Haddou and Tit N’Aissa stations. Such trends have been observed in other African arid regions (Algeria, East Africa) and are caused by a few extreme high rainfalls [
27]. These extreme events may reverse the general downward trend in precipitation series and their role in groundwater recharge may be fundamental in an arid context [
28,
29,
30,
31]. At the Bouanane station, the rainfall trend is stationary.
5. Materials and Methods
5.1. Field Measurements and Sampling
The water points investigated in the current study are of three types: hand dug wells, springs and boreholes. For each point, the piezometric level was controlled and conductivity, temperature and pH were measured in situ with a multi-parameter probe.
As part of this study, 40 piezometric values were collected during 2 field campaigns in 2018–2019. These data were supplemented by archive data from the water agency (ABHGZR: Agence du Bassin Hydraulique de Guir-Ziz-Rheris). The ABHGZR archives contain a set of 250 water points where piezometric measurements are available. Out of a total of 250 water points, hydrochemical data are available on 144 water points. The agency’s data are from the 1970s. Current and old hydraulic head data were assembled in a single dataset to plot an overview of the flow map of the unconfined aquifer of the Jurassic aquifer of the Upper Guir. As commented above, the available rainfall data (
Figure 8) display a slight upward trend during the last few decades due to isolated extreme events. Accordingly, we assume that the average piezometric level of the aquifer has not undergone any significant change due to the rainfall regime.
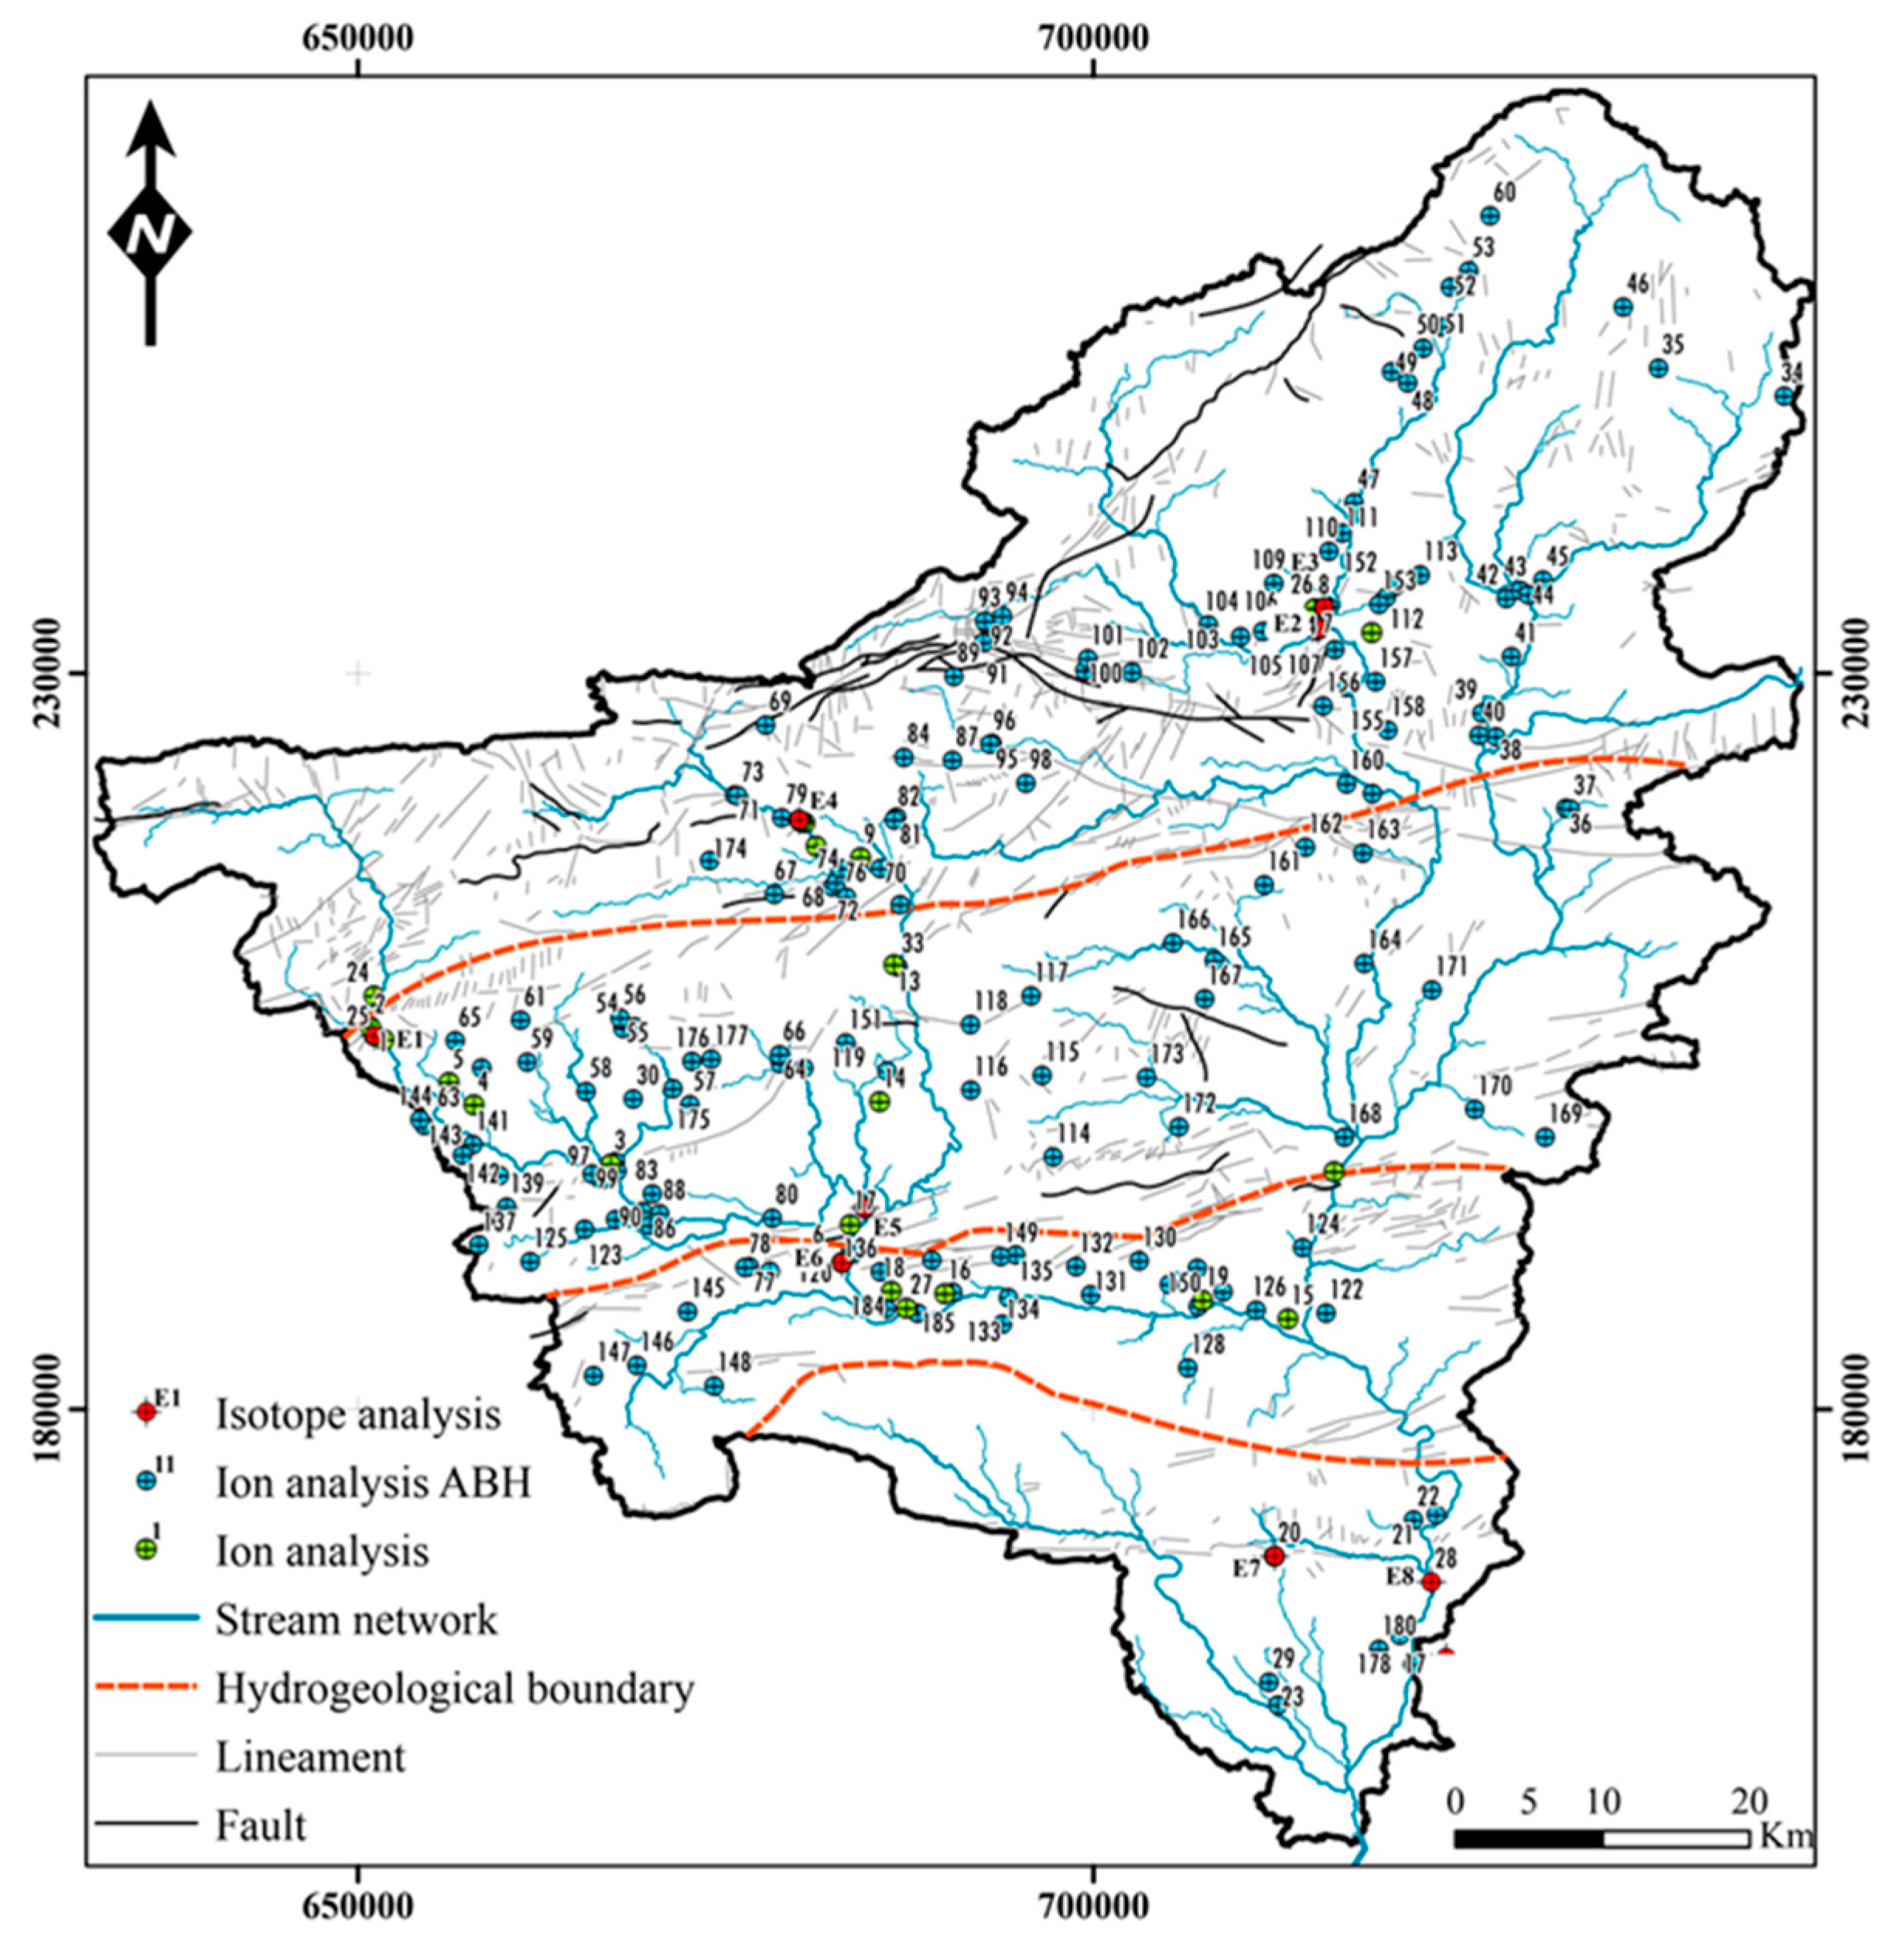
During the last two campaigns (2018–2019), all water samples were collected in plastic bottles of 500 mL, labeled and kept refrigerated until laboratory analyses. At 8 locations, groundwater was sampled for isotope analyses (oxygen 18, deuterium and tritium). The whole hydrochemical dataset consists of 184 water points, including current data (40) and those from the ABHGZR archives (144). The locations of all the water samples are shown in
Figure 9.
5.2. Analytical Procedures
For the water samples collected for this study, major ion analyses were conducted at the HydrASA laboratory at the University of Poitiers (France). The assay procedures were derived from standard analytical methods. To control the good conservation of samples, conductimetry and pHmetry were re-analyzed using CONSORT K810 conductimeter and RADIOMETER PHM220 pHmeter, respectively. After 0.1 µm filtration, the solutions were analyzed by flame atomic absorption spectrometry (VARIAN 240FS) for the major cations (Ca, Mg, Na, K), by ion chromatography (DIONEX ICS1000 equipped with an AS9-HC column, and a double detection system in conductimetry and UVV spectrometry at 220 nm) for major anions (Cl−, NO3−, SO42−) and titrimetry for bicarbonates (HCO3−).
The analyses extracted from the ABHGZR archives were carried out according to analytical procedures described in [
32]. These methods were commonly used in water analysis laboratories in the 1970s. The stable isotopes of oxygen (
18O) and hydrogen (deuterium
2H and tritium
3H) were analyzed at the Hydrogeology Department of University of Avignon, France. All the hydrochemical analyses were validated according to their charge balance error (CBE):
Out of 184 analyses, 175 had a CBE < 5%. The remaining analyses’ CBEs were between 6% and 9%.
5.3. Processing Methods
Descriptive statistics of the hydrochemical data were calculated at two scales (entire EUG basin and each sub-basin) in order to obtain information on the ranges of variables in samples in the entire basin and in each sub-basin. In addition, the spatial distribution of electrical conductivity and concentrations of calcium, magnesium, chloride, sodium and bicarbonate were mapped to investigate relations between groundwater mineralization and aquifer lithology.
In this study, a multivariate statistical analysis method (principal components analysis, PCA) was also applied to classify the water samples, based on their geochemical characteristics. Multivariate statistical methods (or factor analysis) are generally intended for the analysis of large data tables. The specific objective of factor analysis is to provide a descriptive summary of such large data tables. With principal components analysis, the principle is to reduce the number of original variables by detecting the underlying relationships. The initial data can be rearranged into a few independent new variables, i.e., factors. These factors should explain most of the variance in the original variables and their interrelations [
33,
34,
35,
36].
The importance of processes controlling the groundwater hydrochemistry can be highlighted using graphical methods (Piper and Gibbs diagrams [
37,
38]) and other geochemical methods such as the Chloro-Alkaline Indices CA1 and CA2 [
39]. The Piper diagram allows a large number of water samples to be plotted simultaneously. This diagram helps to analyze the evolution of water types where mineralization increases, or to compare groups of samples with each other, and highlights the dominant chemical water types. The Gibbs diagram provides information on the mechanism controlling the groundwater mineralization. This diagram helps us to better understand the role of hydrochemical processes such as precipitation, rock water interaction and evaporation on groundwater chemistry. The two Chloro-Alkaline Indices, CA1 and CA2 [
39], are written as follows:
The concentrations of elements are expressed in meq L
−1. These indices are helpful to assess the ionic exchanges between groundwater and aquifer rocks. Positive values indicate an exchange of alkalis (Na
+ and K
+) from the groundwater with alkaline earths (Mg
2+ and Ca
2+) of rocks (base-exchange reaction). Negative values indicate reverse exchanges. A number of bi-elements diagrams were also drawn to analyze the relations between the dissolved groundwater chemical elements and to investigate the possible hydrochemical processes through which groundwater chemistry has originated and evolved. Stable (
18O,
2H) and radiogenic (
3H) water isotopes were used to estimate the aquifer recharge area, the groundwater residence time. Water isotope data were processed using standard methods widely used in hydrogeology and described in basic textbooks [
40,
41,
42,
43]. One of the specific objectives of this study being to provide some basic information to the stakeholders for the exploitation and management of the water resources within the frame of important development projects planned in the region, the suitability of the EUG groundwater was assessed using the WHO standards for drinking purposes [
44] and the SAR (sodium adsorption ratio) for irrigation [
45,
46].
6. Results and Discussion
6.1. Hydrogeology
The Triassic volcanic and clayey-marly formations constitute the general and continuous impermeable bedrock throughout the Atlas chain. Overlying this impermeable substratum, we find Jurassic formations including, from bottom to top, the following: the Lower Jurassic (Lower Lias) composed by alternation of marls and limestones, the Toarcian consisting of marly limestones and the Middle Jurassic represented by limestones and marly limestones. In this context, the main water-bearing formations are the Lower Jurassic and the Middle Jurassic. The data that are currently available allow us to assume that the Lower and Middle Jurassic systems communicate with each other because the Toarcian is not totally impermeable due to its lithology (marly limestones) and the presence of faults. Cretaceous sandstones, marly limestones and evaporites, when present, are also water-bearing formations.
The structural elements controlling the surface water network also constrain groundwater flow in the Upper Guir aquifer system. The folded structures of the reservoir rocks delineate synclines as surface basins (see
Figure 3 and
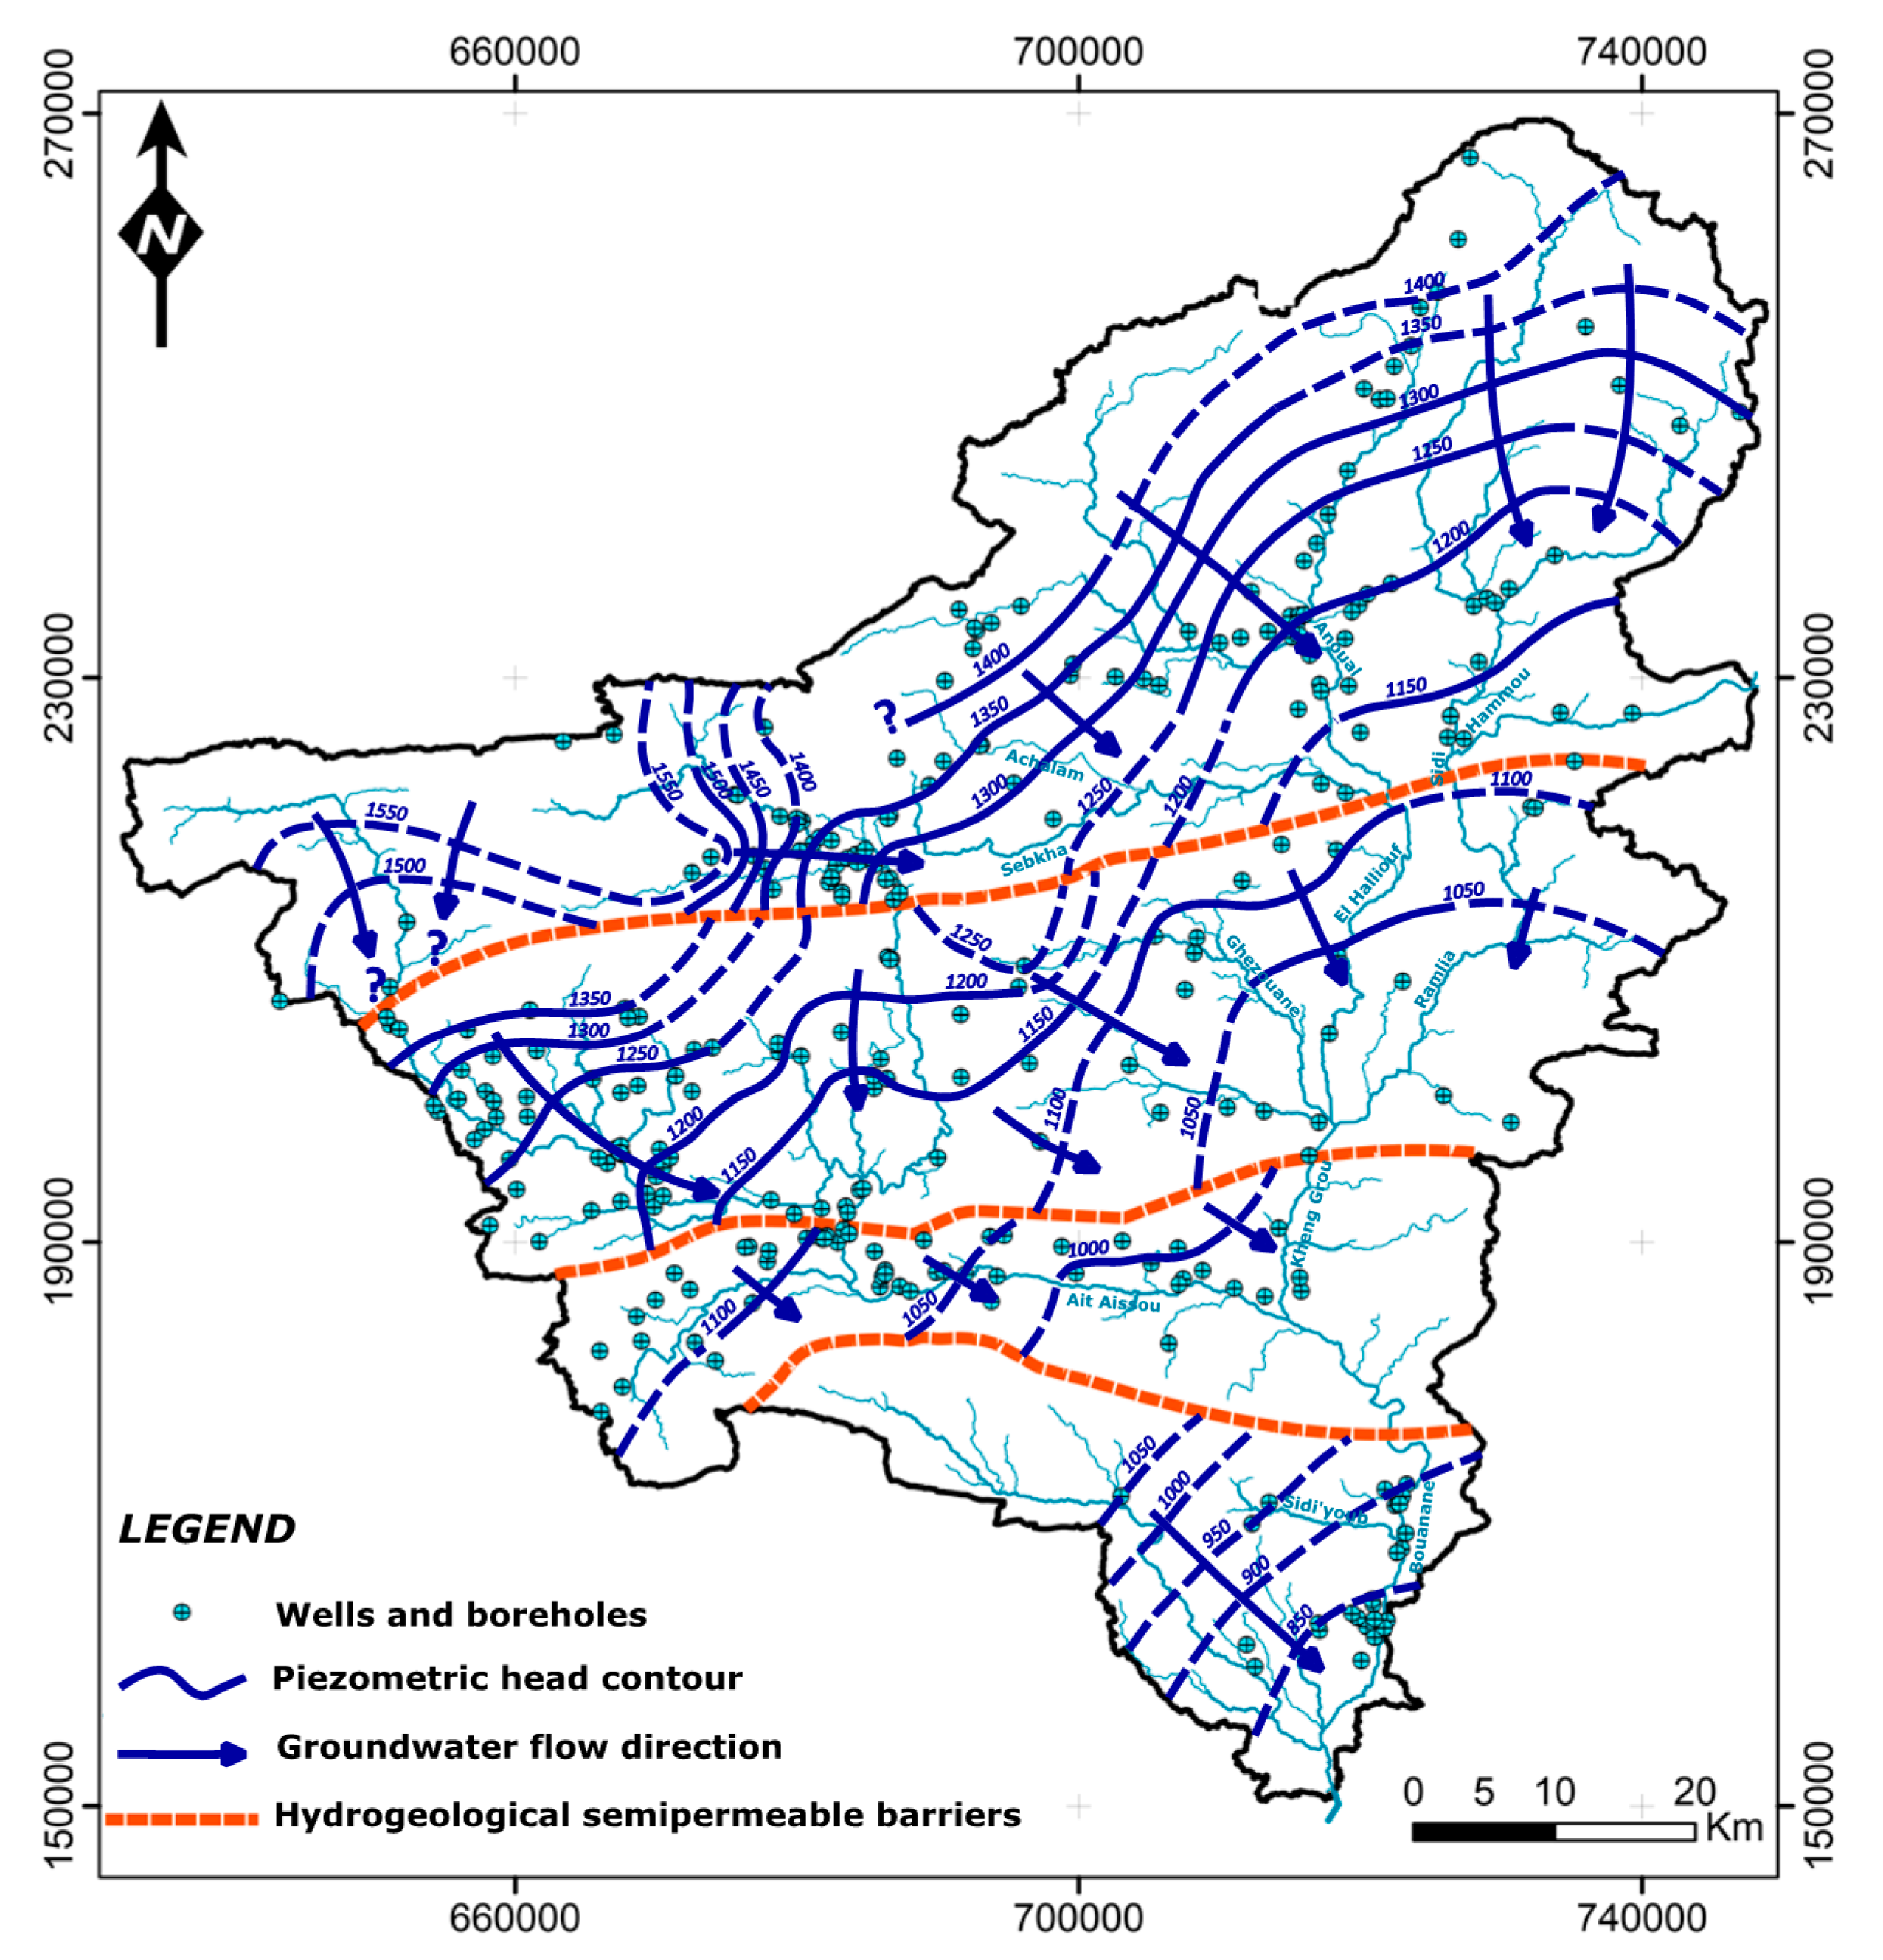
Figure 4) which also act as hydrogeological sub-systems, more or less independent of each other and interconnected by gorges of variable width and also through the NW-SE faults. Hydraulic heads data range between 960 and 1830 m. Regional E-W faults are considered as semi- or impermeable barriers to flow patterns. The piezometric map of the Jurassic aquifer (
Figure 10) shows that the groundwater is drained towards the wadis’ courses, which constitute zones of higher permeability and therefore zones of preferential flow of groundwater. The piezometric surface is located several meters below the bottom of the wadis’ beds. Thus, it is worth noting that, in this context, the wadis do not represent outflows from the aquifer system. Given the available data, the occurrence of any underflow associated with the wadis cannot be assessed at this time. The role of the hydraulic barriers constituted by regional faults is well depicted. These semi-permeable barriers strongly disturb the general flow pattern of the groundwater from north to south. These barriers cause significant head losses, which can sometimes reach more than a hundred meters.
6.2. Statistical Analysis of Hydrogeochemical Data
The descriptive statistics of the hydrochemical data, for the whole Eastern Upper Guir (EUG) and for each sub-basin, are summarized in
Table 2. Note that the nitrate concentrations are very low in the area (<15 mg/L) because of the absence of intensive agriculture and large settlements. The temperatures measured in situ for groundwater in the Jurassic–Cretaceous aquifer range from 14.0 to 33.0 °C, with an average of 20.5 °C. In general, the lowest temperatures are observed in the Talsint and Bouanane areas and the highest in the Beni Tajit area. The pH values are homogeneous and vary in a short range between 6.5 and 8.4, with an average of 7.6. The acidity of the waters of the basin is therefore neutral to slightly basic. The lowest values are observed in the Beni Tajit area and the highest values in the Bouanane areas. In the studied area, the electrical conductivity (EC) shows a strong gradient from west to east (
Figure 11), with extreme values ranging between 405 and 7394 μS.cm
−1, which correspond to an equivalent salinity between fresh and brackish water. Considering the western part of sub-basin C1, where Jurassic limestones are dominant, the low EC values (<1000 µS cm
−1) are of the same order as those commonly measured for groundwaters in unconfined carbonate aquifers.
On the other hand, the high EC values (>3000 µS cm−1) are located in the eastern part of the sub−basin, where Cretaceous gypsiferous marls are present. We find the same distribution for sub-basin C4. The maximum EC values remain less than 2000 μS.cm−1 in C2 and C3 sub-basins, where Cretaceous deposits are absent. The average relative abundance (meq L−1) of major ions is in the whole EUG is Na+ < Ca2+ < Mg2+ and SO42− < HCO3− < Cl− and in each sub-basin is as follows: C1: Mg2+ < Na+ < Ca2+ and SO42− < Cl−< HCO3−; C2: Ca2+ < Mg2+ < Na+ and HCO3− < SO42− < Cl−; C3: Ca2+ < Mg2+ < Na+ and SO42− < HCO3− < Cl−; C4: Na+ < Ca2+ < Mg2+ and Cl− < SO42− < HCO3−. From one sub-basin to another, the water’s mineralization is variable. Potassium contents are negligible. This is explained by the weak representation of the detrital formations (restricted to the sandstone and clay deposits of Cretaceous) usually supplying potassium by alteration of potassium feldspars and mica.
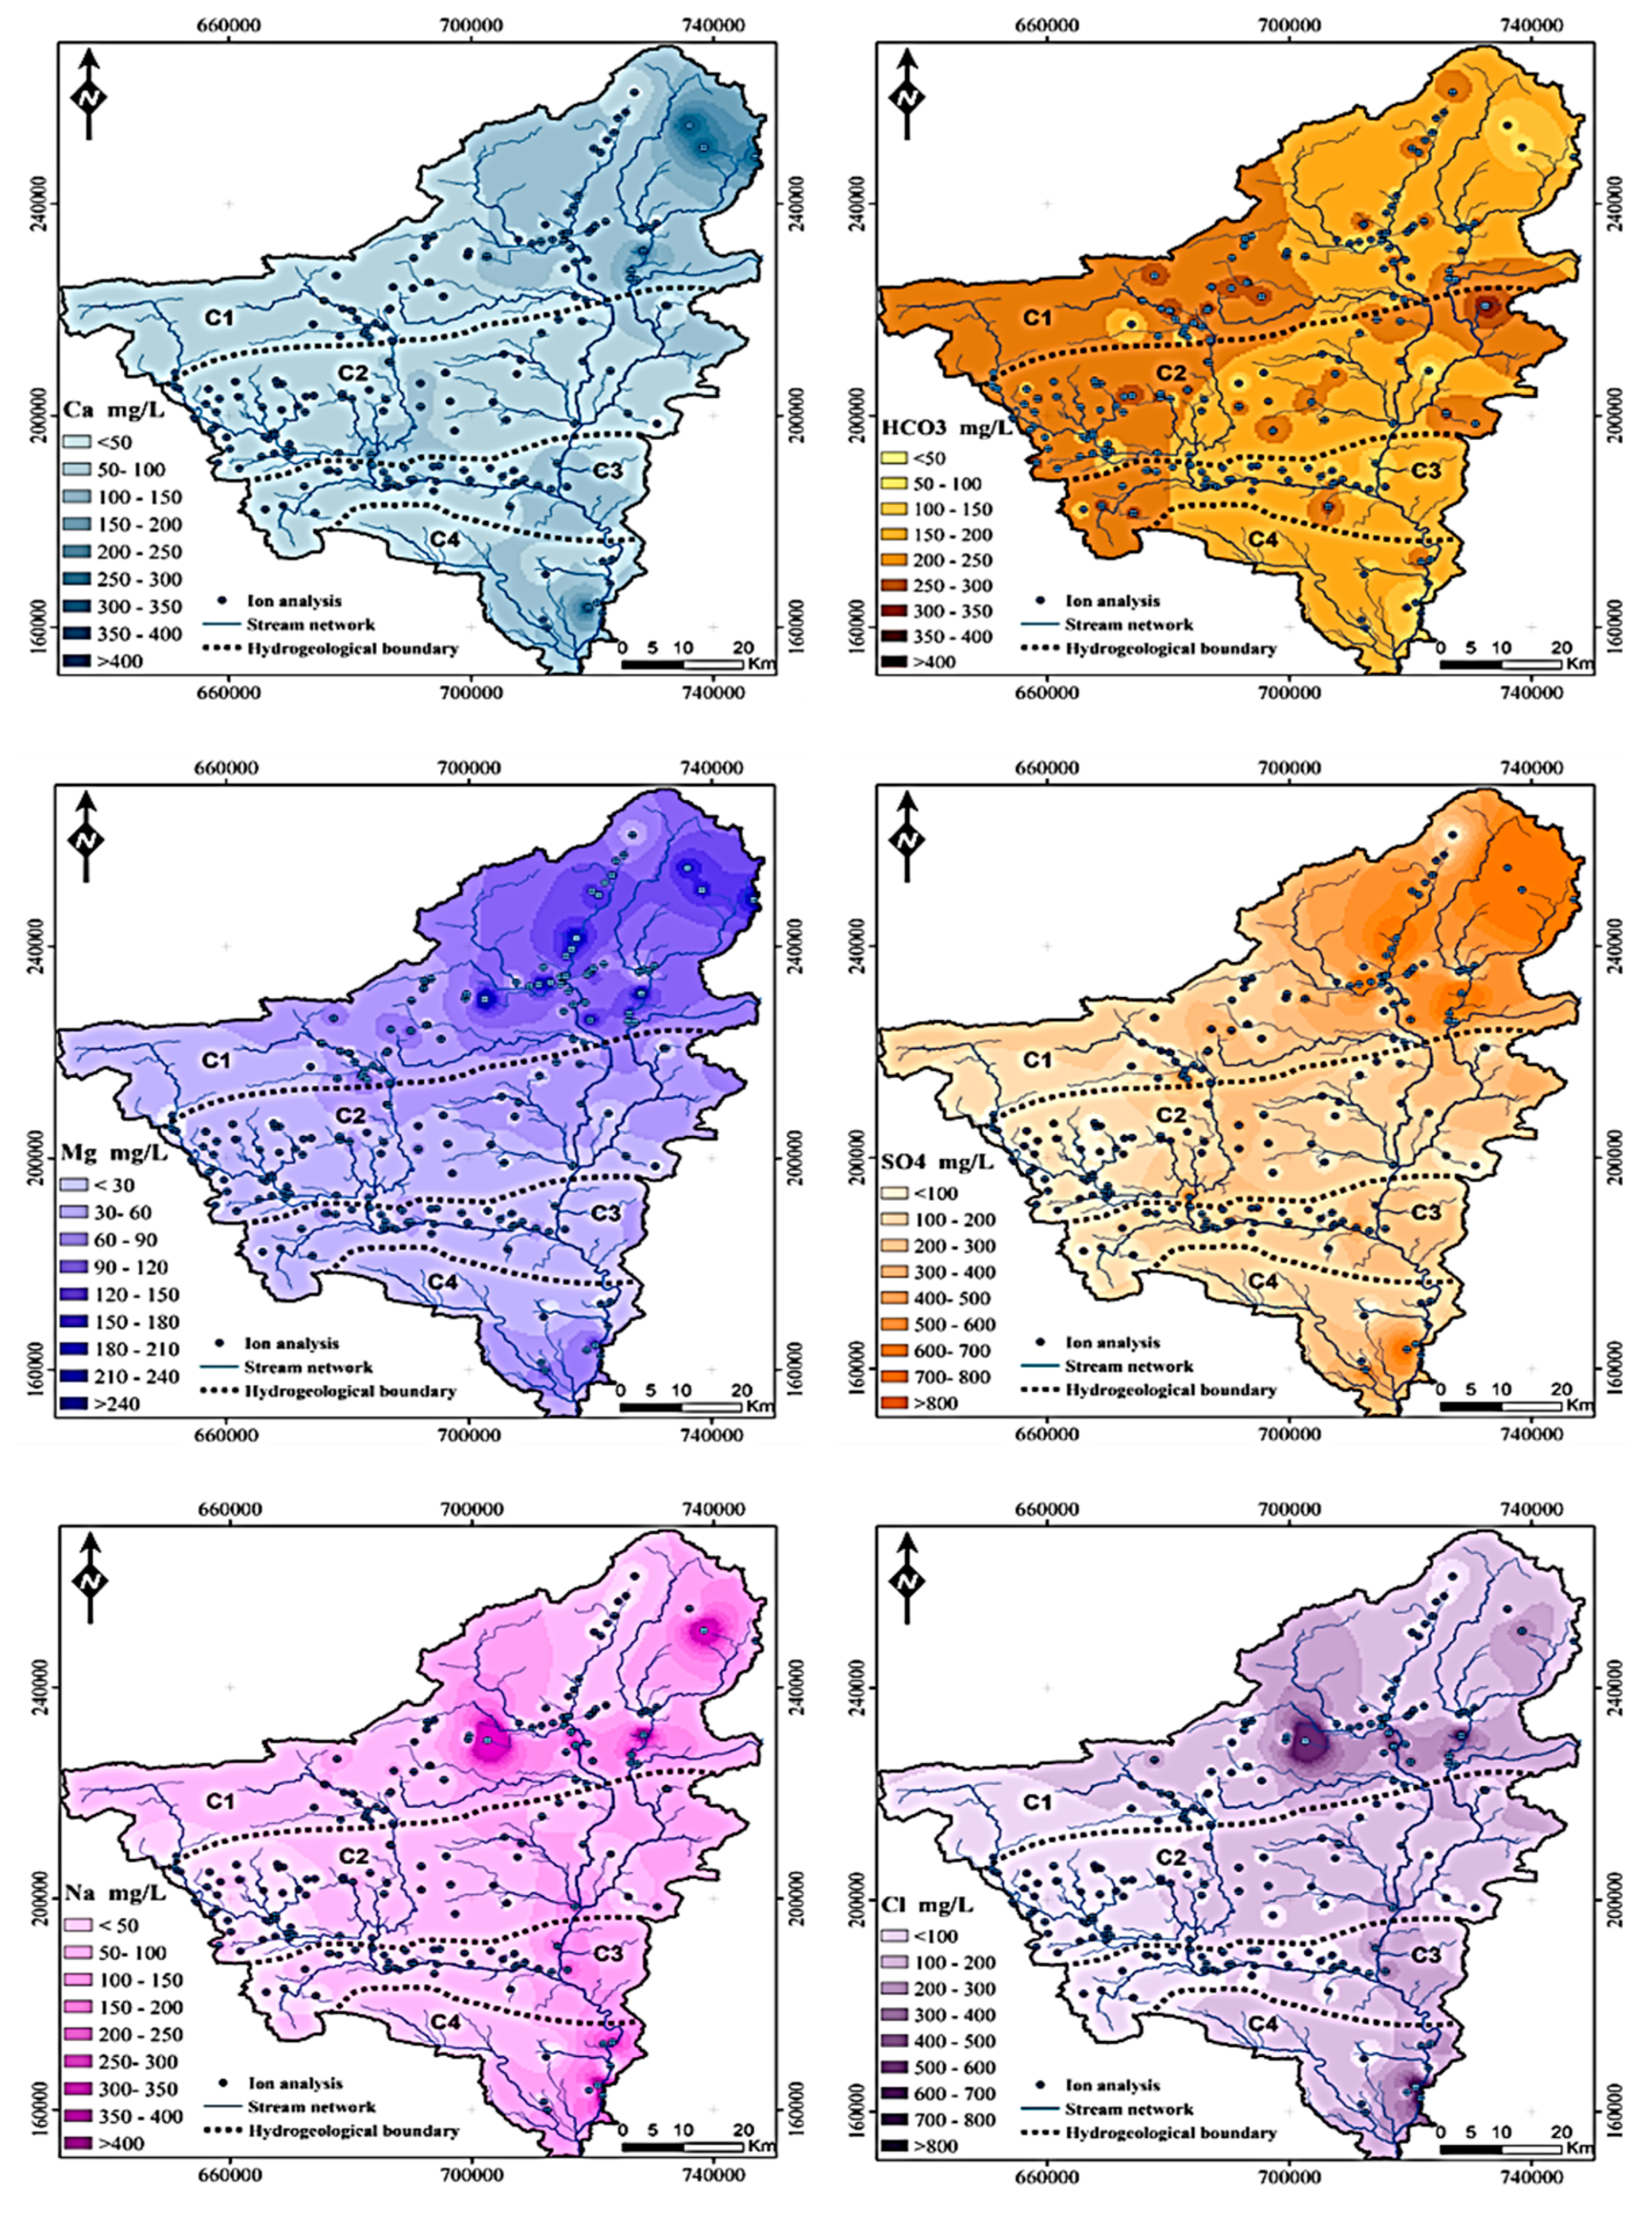
The spatial distributions of the main elements are displayed in
Figure 12. The concentration of each element globally shows a W-E oriented gradient, except for the bicarbonates. Such trends are well observed in sub-basins C1 and C4, with very high concentrations of Ca
2+ (>400 mg L
−1), Mg
2+ (>240 mg L
−1), Na
+ (>400 mg L
−1), SO
42− (>800 mg L
−1) and Cl
− (>800 mg L
−1). In sub-basins C2 and C3, the maximum concentrations reached by these same elements are halved.
The HCO3− concentration gradient has the opposite orientation, with the highest values (300–350 mg/L) in the west and the lowest values (<50 mg L−1) in the east. Nevertheless, in some places, close to the eastern border of the basin, high HCO3− is observed in relation to the reliefs of carbonate rocks which are associated with the tectonic activity of the main Atlas structural faults. This is most evident at the limit of the C1 and C2 sub-basins.
As far as EC is concerned, the evolution of groundwater chemistry is largely controlled by the lithology of rocks dominated by Jurassic carbonate deposits to the west and by Cretaceous marls and marly limestones to the northeast and the southeast. Furthermore, the elements’ spatial distribution often shows no progressive evolution on either side of the major structural faults. This is remarkably evident between the C1 and C2 sub-basins for Ca2+, Mg2+, Na+, SO42− and Cl− in the eastern part of the basin and for HCO3− in the central area. This behavior suggests that some places of this major fault play the role of semi-permeable barrier. This feature is less evident for the other major faults because of the low chemical contrast between the two sides of the limit.
6.3. Factor Analysis of Groundwater Hydrogeochemical Data
Factor analysis (F.A.) is well suited to processing hydrochemical data and has been successfully applied for this purpose. In the case of the Eastern Upper Guir, the dataset represents a matrix of 10 variables (temperature, conductivity, pH, Ca
2+, Mg
2+, Na
+, K
+, HCO
3−, SO
42−, Cl
−) measured on 184 water samples. The results of the factor analysis (factor loadings, eigenvalues, explained variance) are reported in
Table 3.
The factor loadings express the weights of the initial variables in constructing the factors. The cumulative variance (
Table 3) shows that the first two factors, which alone explain 59% of the total variance, can be considered as the most significant. Factor 1 has six high loadings (|L| > 0.7) related to EC, Ca, Mg, Na, SO
4 and Cl. Factor 2 has intermediate loading (|L| > 0.5) in temperature, Na and Cl. Loading in HCO
3 for both factors is quite weak as this element equally characterizes all samples. The plane associated with factors 1 and 2 is shown in
Figure 13A, together with the projection of all the initial variables. The clustering of elements can be operated on this plane (Na-Cl, Ca-Mg-SO
4), arising from a common origin of these elements. This reinforces the assumptions previously made on the strong lithological control of water chemistry. Factor 1 is defined by the elements that are decisive in the mineralization of groundwater. It thus allows the classification of waters according to their mineralization.
The projection of all samples on the plane associated with factors 1 and 2 is shown in
Figure 13B. The most mineralized waters, associated with the elements Na, Cl, Ca, Mg, SO
4, are distributed in the C1 and C4 sub-basins. Waters from sub-basin C1 are mainly associated with Ca, Mg, SO
4 and those from sub-basin C4 with Na, Cl. The waters from sub-basins C2 and C3 are mostly towards the HCO
3 pole and are less mineralized than the waters in C1 and C4.
6.4. Processes Controlling Groundwater Chemistry
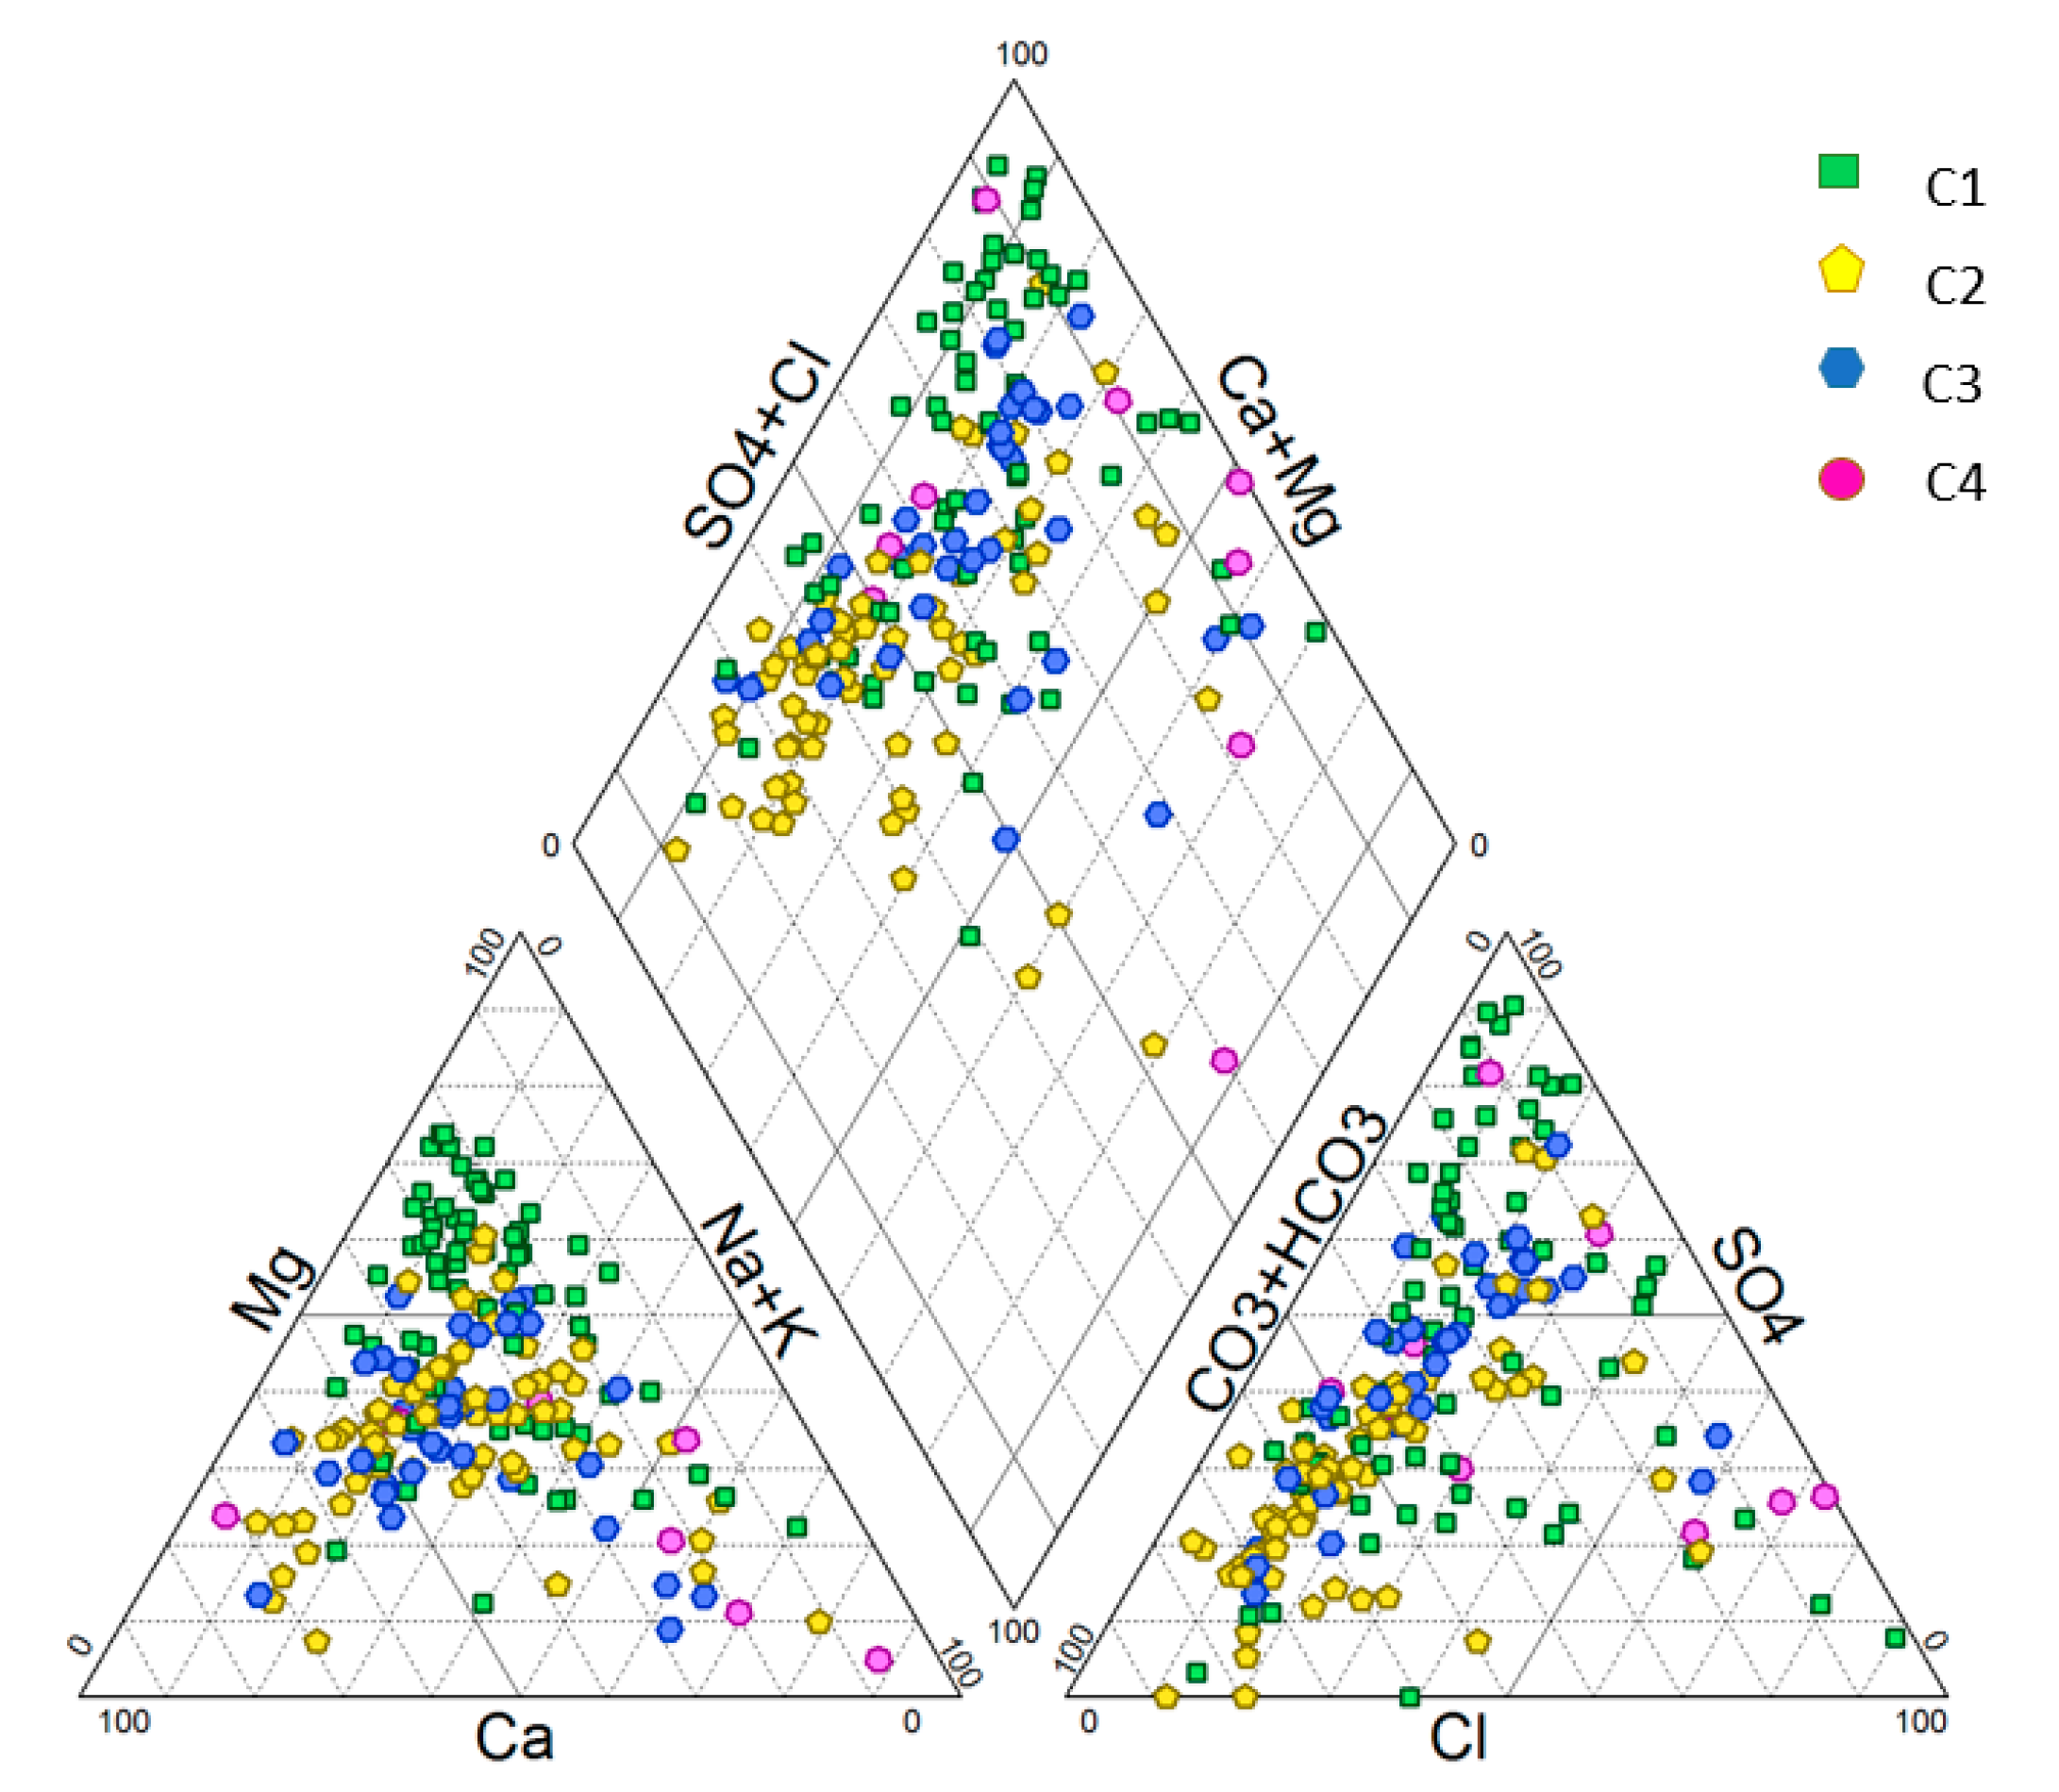
The plot of the samples on a Piper diagram displays (
Figure 14) the significant variability of the waters’ mineralization.
The principal chemical profile in each sub-basin is C1: magnesium-sulphate; C2: calcium-bicarbonate; C3: calcium-bicarbonate; C4: sodium-chloride-sulphate. In the C2 and C3 sub-basins, the calcium-bicarbonate facies of the waters is consistent with the lithology of the carbonate formations of the Jurassic aquifer. In the C1 and C4 sub-basins, the presence of salts (halite, gypsum) in the Cretaceous evaporitic formations significantly impacts the mineralization of the waters. The Piper diagram confirms the diversity of chemical facies highlighted by factor analysis. It emphasizes that the water–rock interaction is an important process in the EUG that controls the groundwater chemistry.
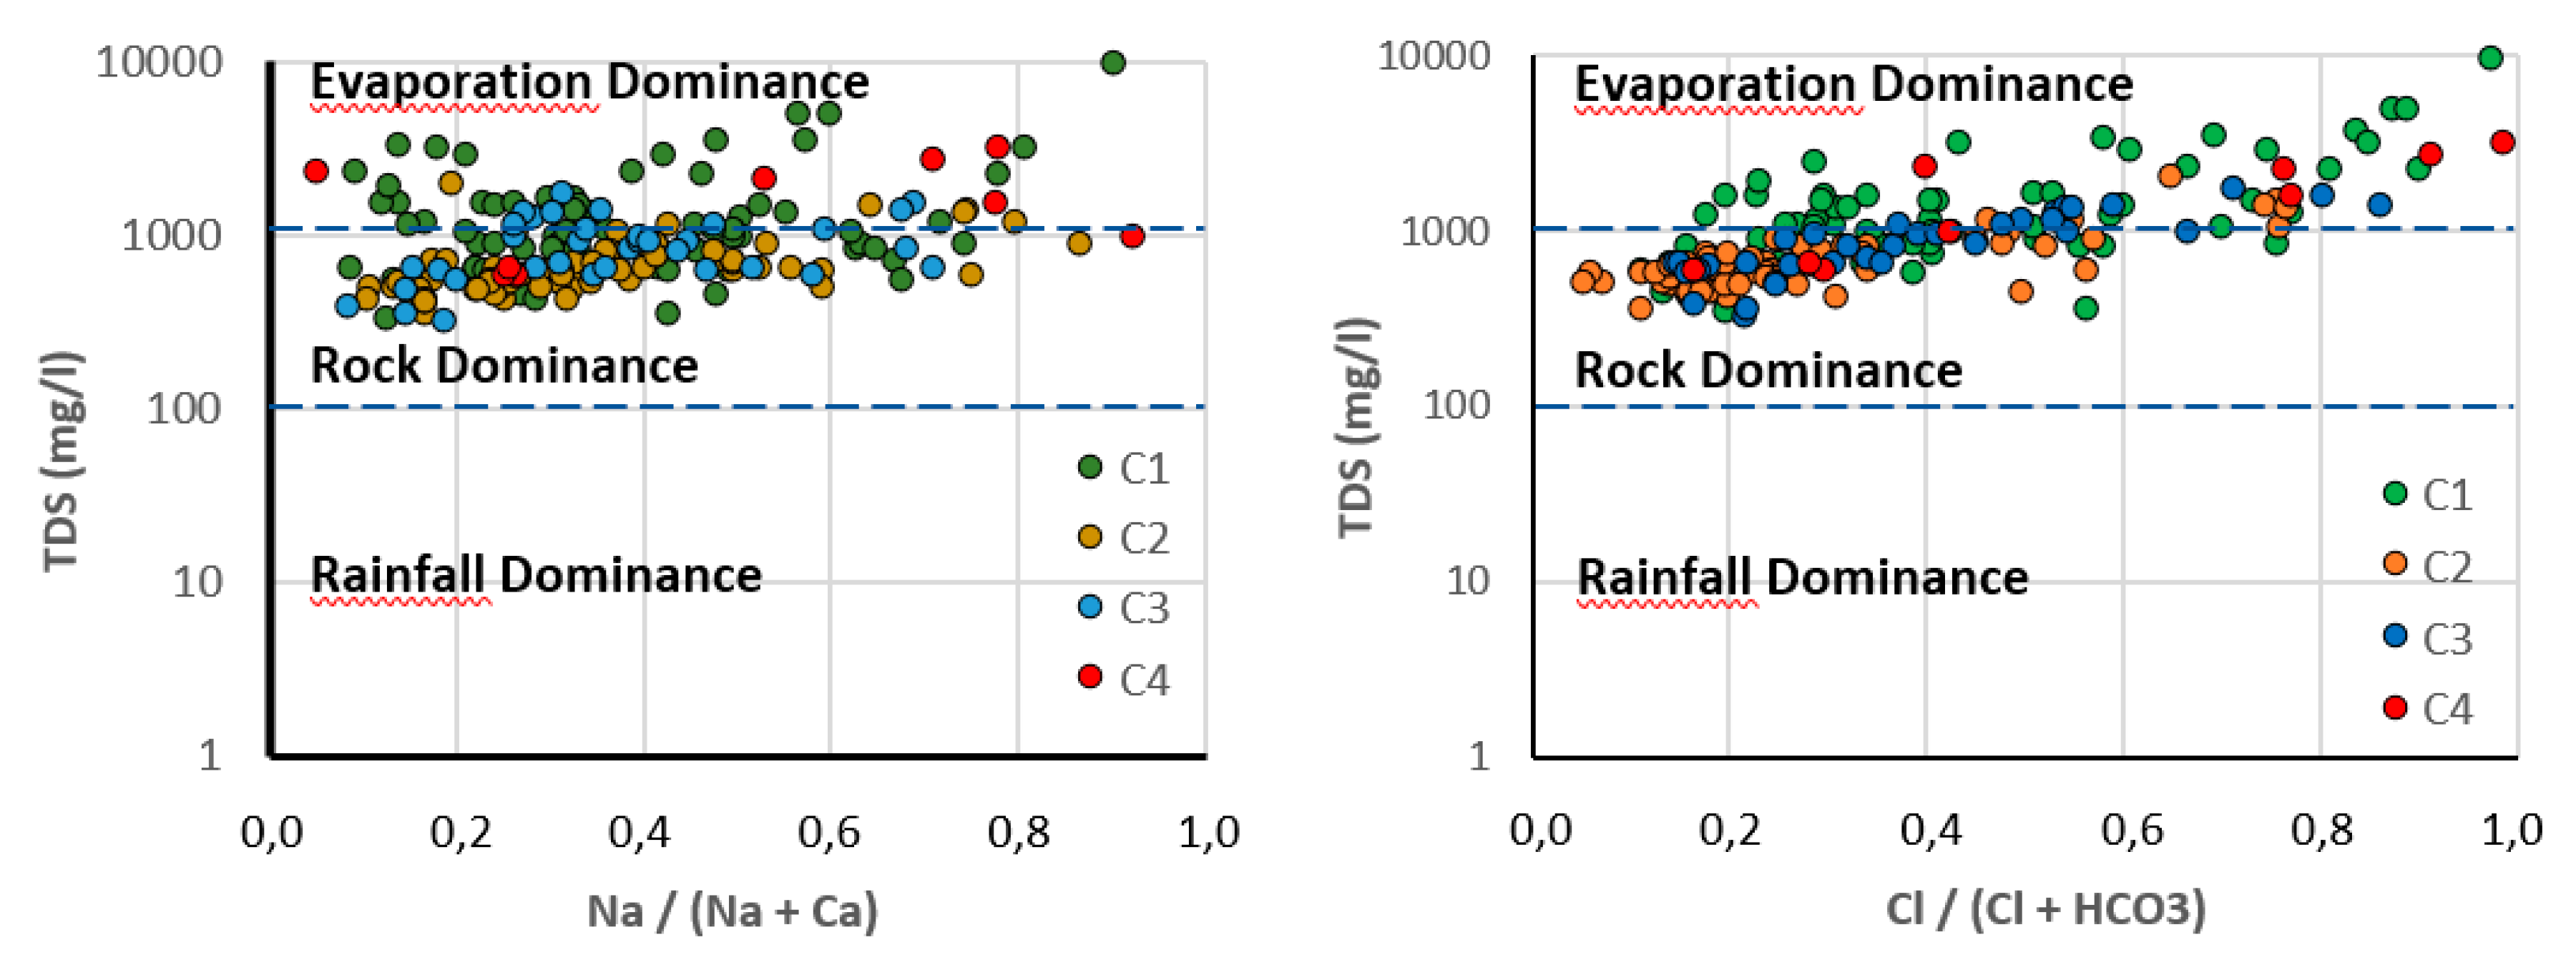
The data were also plotted on Gibbs diagrams (
Figure 15), showing the variations in TDS (Total Dissolved Solids) as a function of Na/(Na + Cl) and Cl/(Cl + HCO
3). It divides the space into three domains and allows us to classify the waters following the main mineralization processes (precipitation dominance, rock dominance and evaporation dominance). This diagram was originally designed by the author for surface water geochemistry. It was then quite often applied to unconfined groundwater hydrochemistry [
47,
48]. Most of the samples from the four sub-basins are plotted in the rock dominance part and some in the evaporation dominance part of the diagram (
Figure 15). As above, this plot indicates too that the water–rock interaction is a major process in water mineralization. Most of the points in the dominance evaporation space belong to sub-basin C1, indicating that evaporation in this part of the basin also plays a significant role.
To check whether ion-exchange processes have an impact on groundwater chemistry, the two chloro-alkaline indices, CA1 and CA2 [
39], were estimated. The statistics of these indices’ values are summarized in
Table 4. The average value of both indices is close to zero, showing that the basic exchange processes are negligible in the EUG. We note a few high negative values of the CA1 index, denoting an exchange between the alkaline earth of the groundwater and alkali of the rock matrix. These exchanges are, however, very few (21 values of CA1 and CA2 < –1 out of 2 × 184).
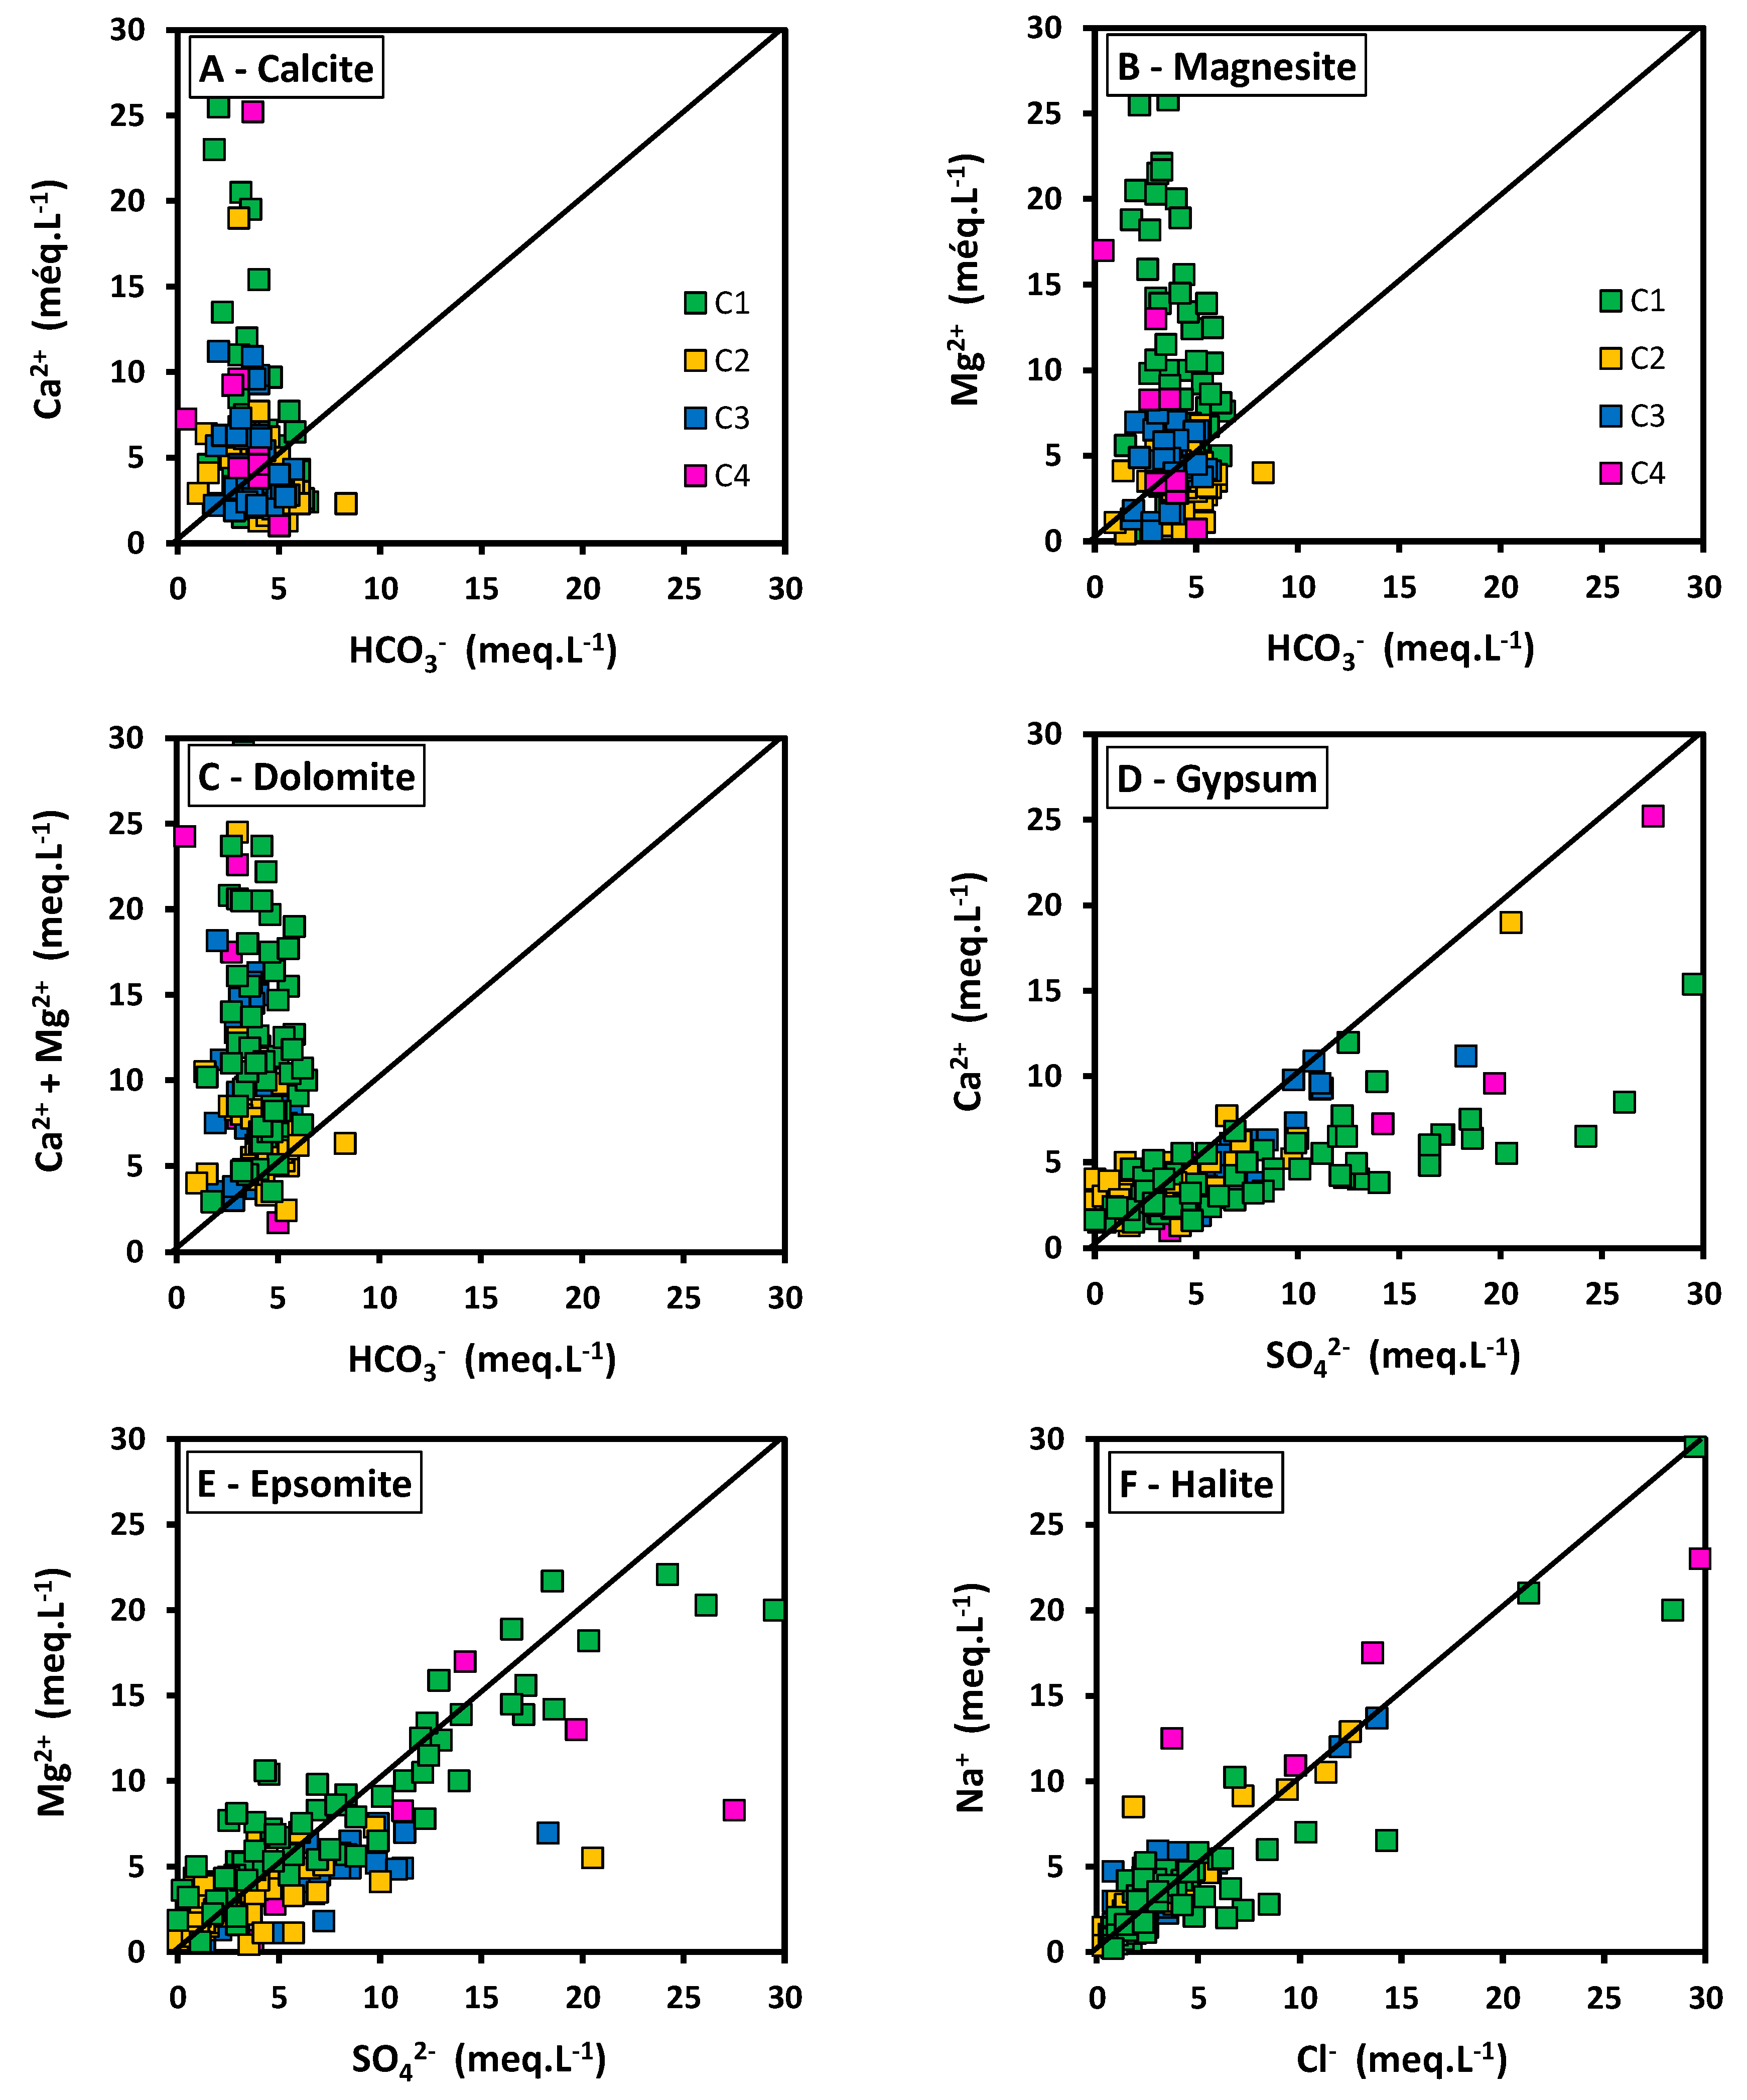
Bivariate plots between dissolved chemical elements have been drawn to further investigate the mineralization processes. They are reported in
Figure 16. The plots of Ca
2+, Mg
2+ and (Ca
2+ + Mg
2+) vs. HCO
3- (
Figure 16A–C) display an excess of Ca
2+ with respect to calcite and dolomite balances and an excess of Mg
2+ with respect to dolomite balance. These waters also show sulphate excess compared with gypsum balance (
Figure 16D). The diagram of Mg
2+ vs. SO
42− (
Figure 16E) indicates that Mg
2+ concentrations plot in a domain close to the equilibrium line of sulphate minerals such as epsomite (MgSO
4•7H
2O) or kieserite (MgSO
4•H
2O). Accordingly, in this basin, high concentrations of Ca
2+ are mainly controlled by gypsum dissolution and not by calcite. High concentrations of Mg
2+ mainly originate from sulphate minerals dissolution and not by dolomite. The plot of Na
+ vs. Cl
- (
Figure 16F) shows that these two elements are in equilibrium, indicating that their origin is mainly due to the dissolution of halite.
As noted above, HCO3− concentrations do not vary much throughout the basin. At the basin scale, the average is 4.1 meq L−1; at the sub-basin scale, the average remains almost equivalent (C1: 4.1 meq L−1, C2: 4.3 meq L−1, C3: 3.8 meq L−1 and C4: 3.3 meq L−1). An order of magnitude of 5 meq L−1 of HCO3 is a common range of bicarbonate concentrations for groundwater in unconfined carbonate aquifers. Thus, within the EUG basin, the HCO3− content is acquired rapidly by dissolution of carbonate minerals, typically calcite, present in the soils and the rock matrix. However, the water type Ca-HCO3 is unusual in this basin. As a result, the water mineralization rapidly evolves from an initial Ca-HCO3 water type to the water types discussed above depending on the minerals encountered during the groundwater flow path.
6.5. Stable Isotopes Analyses
6.5.1. Isotope Content of Precipitations
The estimation of aquifers’ recharge altitudes is of particular interest for the Atlas Mountains, where recharge areas are poorly known. Generally, the isotopes of the water molecule (Oxygene-18, Deuterium) are among the most used in aquifer investigations [
49,
50]. They are expressed using the Delta notation (δ), defined by Craig (1961) [
51] as:
where R is the ratio of isotopic abundance, expressed as
18O/
16O or
2H/
1H. Positive values of δ indicate that the sample is enriched relative to the reference standard and negative values indicate that the sample is depleted. For Oxygen-18 and Deuterium, the standard corresponds to the average isotopic composition of SMOW (standard mean ocean water), oceanic waters having by definition a value equal to 0‰. On a global scale, the Oxygene-18 and Deuterium contents of precipitations which did not undergo evaporation are characterized by a linear relationship [
51]. The equation of this line, called the global meteoric water line (GMWL), is written as follows:
The intercept gives the excess in Deuterium (d). It is equal to 10‰ for vapors of oceanic origin. The constant slope (8) is specific to the phenomenon of condensation, which always occurs at saturation and therefore at equilibrium. In this work, no rainwater was sampled. The Oxygen-18 and Deuterium contents measured in neighboring regions were taken into consideration. In the Middle Atlas, in the Fes-Meknes plain (>600 m), the Oxygene-18 contents of the precipitations are of the order of −5‰ vs. SMOW [
52]. For the recharge zone of the Liassic aquifer of the Middle Atlas limestone plateau, values of the order of −7.3‰ vs. SMOW are proposed for Oxygen-18 [
52]. In the Oulmes region, located 100 km SE of Rabat at an altitude of 1260 m, the Oxygen-18 contents of non−evaporated water range between 6 and 7‰ vs. SMOW [
52]. In the Souss valley, at an altitude of 1000 m, the Oxygen-18 content in precipitation was estimated at −5.6‰ vs. SMOW [
50].
Analysis of some rainfall samples collected in the Western High Atlas of Agadir [
52] provided values ranging from −7‰ to −3.5‰ in Oxygen-18. The most depleted waters in heavy isotopes (−7 to −8‰ vs. SMOW) are found in the mountain range (High and Middle Atlas). This depletion of precipitation at high altitudes is consistent with the elevation effect on heavy isotope contents described by many authors [
40,
53]. In the Atlas area, very closed altitudinal gradients of Oxygene-18 were evaluated: −0.3‰ per 100 m rise [
54] and −0.26‰ per 100 m rise in the Beni Mellal Atlas [
52]. Available rainfall isotope data in Morocco [
50,
52] plot all along the global meteoric water line. This line can thus be used as a reference for isotope hydrology in Morocco. The precipitations, which constitute the input signal on the Atlas Mountains, have a main oceanic origin and a content of −7‰ to −8‰ of Oxygene−18 at altitudes above 1000 m.
6.5.2. Stable Isotope Data for Groundwater in the Study Area
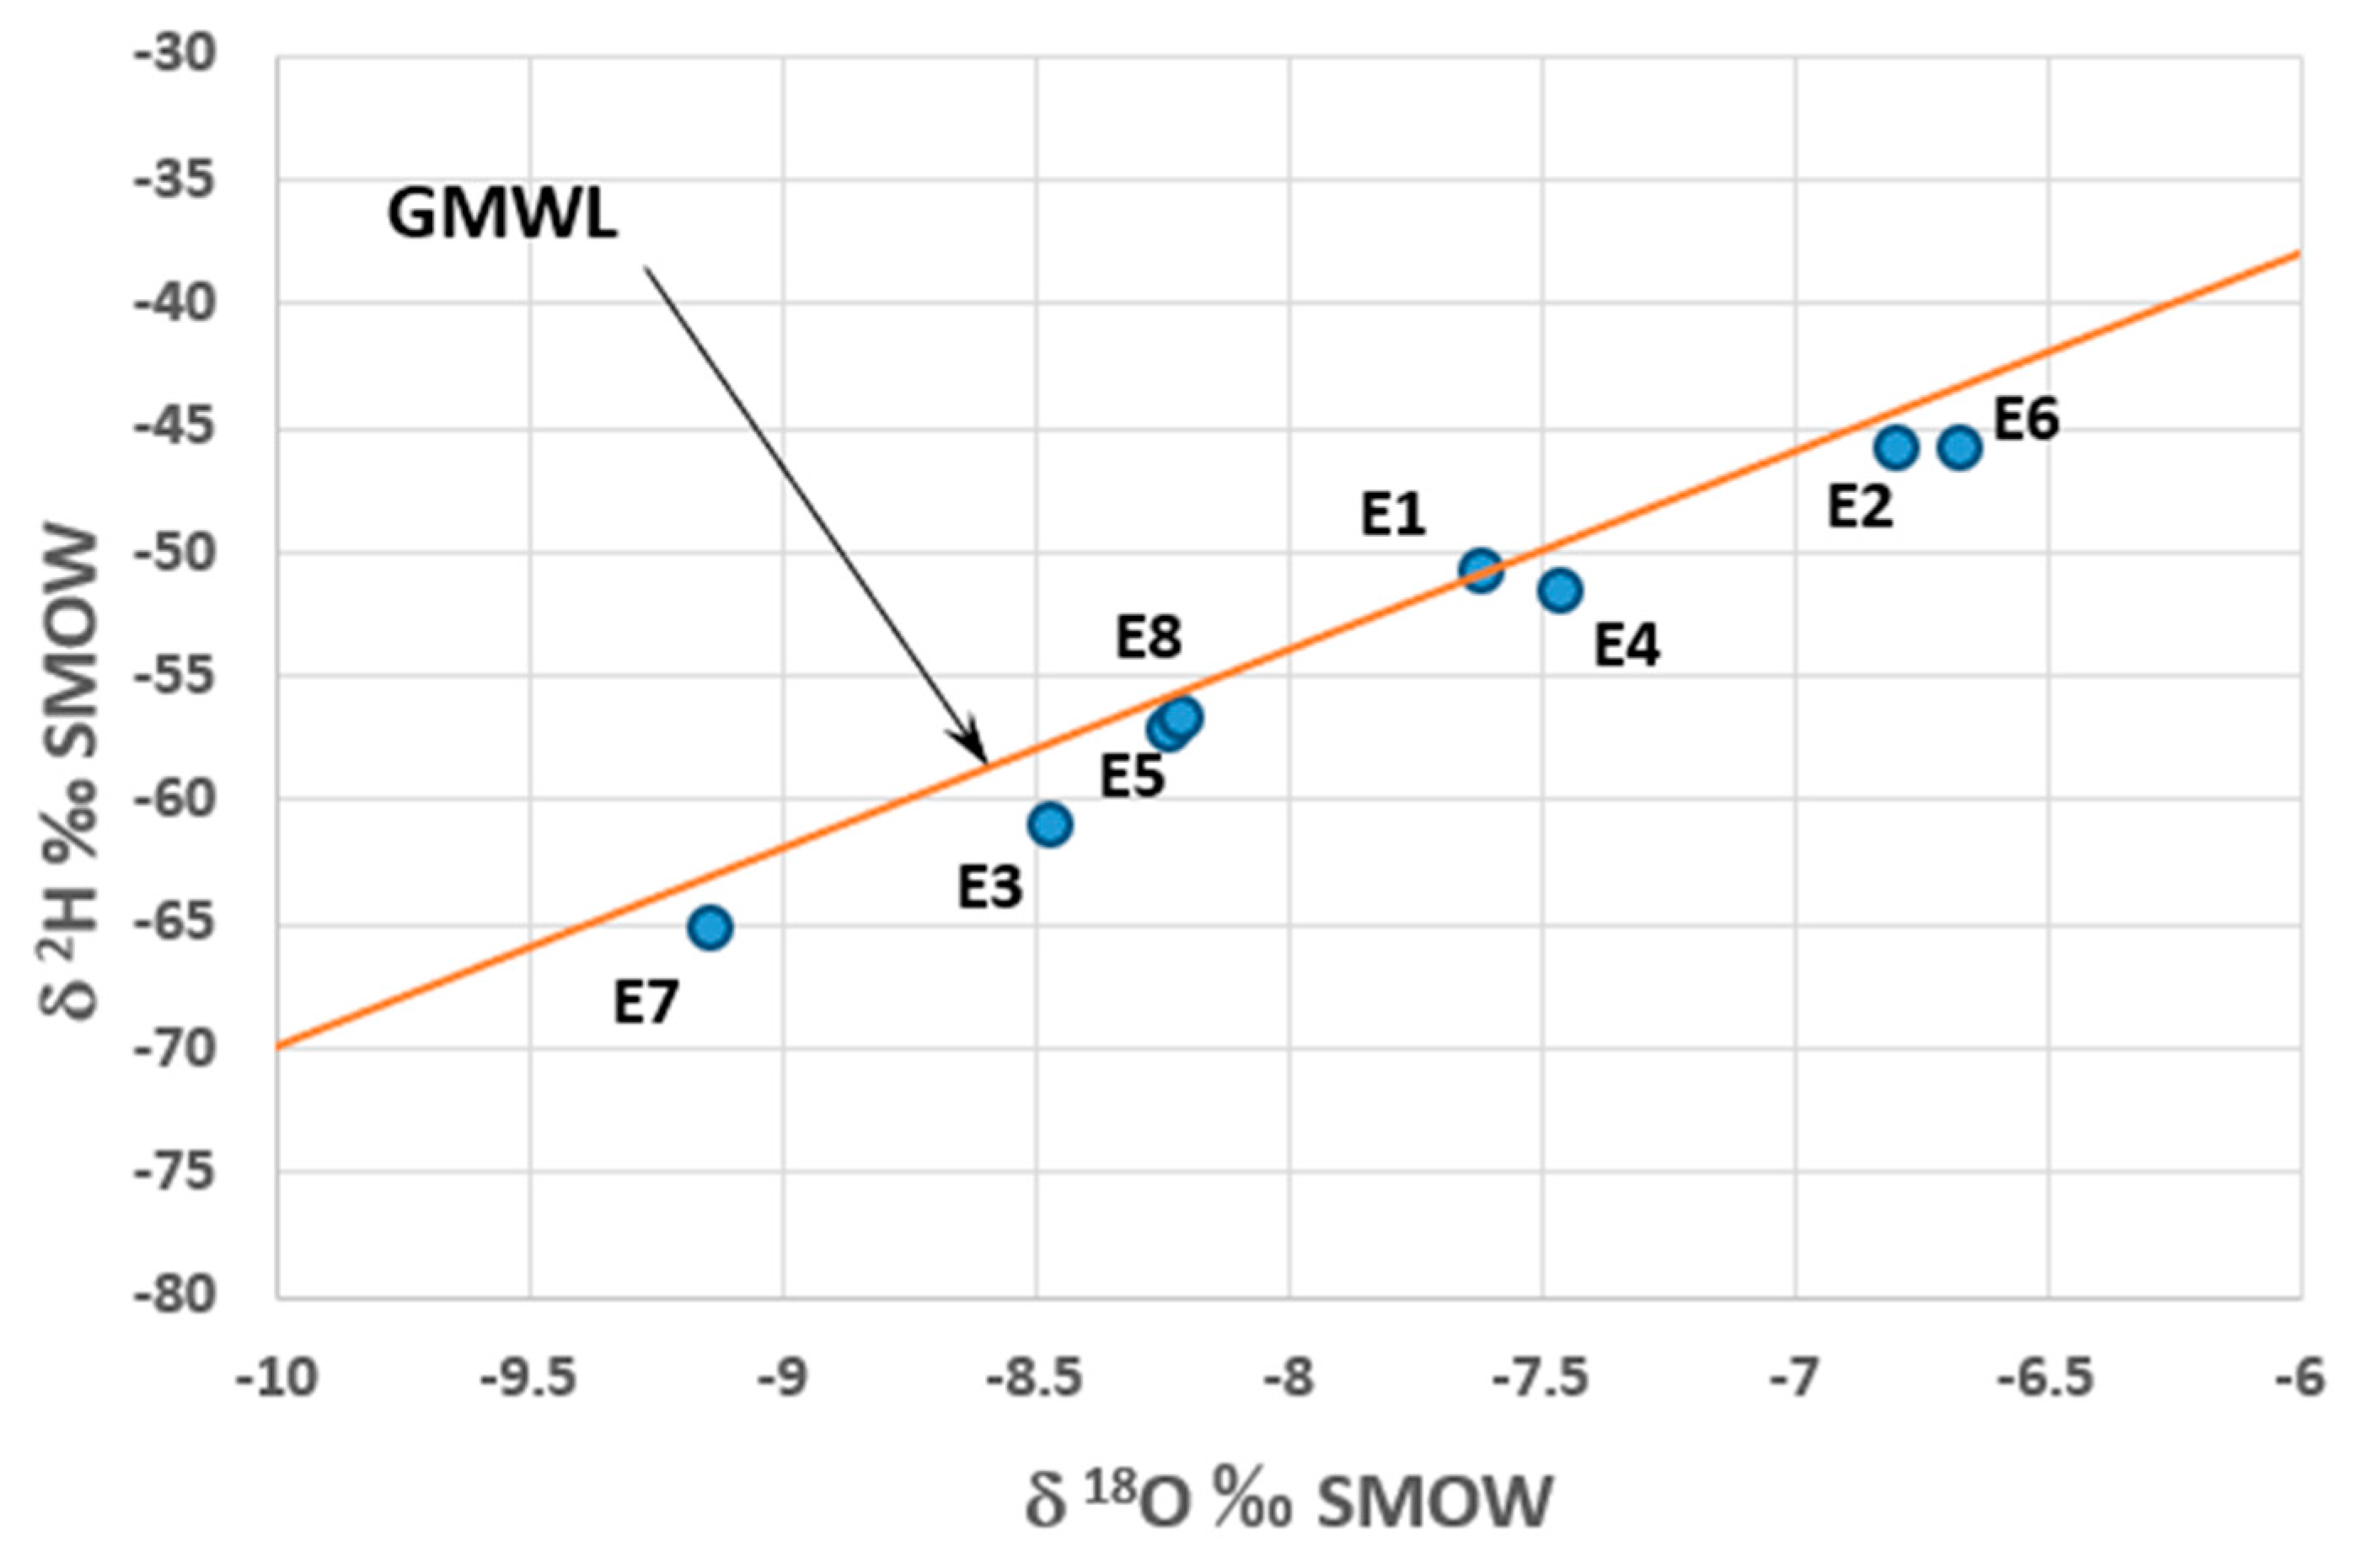
Eight groundwater samples were collected in 2019 in the study area. The sampled points were distributed over the entire area (
Figure 10). Stable isotopes and tritium values are reported in
Table 5. Sampling points consist of three springs, three wells and two hand-dug wells. The altitude of the water points ranges between 1398 (spring E4) and 878 m (spring E8). Oxygene-18 values range from −9.14 ‰ (well E7 at 944 m altitude) to −6.67 ‰ (well E6 at 1091 m), those of Deuterium between −65.21 ‰ (well E7 at 944 m altitude) and −45.82 ‰ (well E2 at 1187 m). The relationship between Deuterium and Oxygene-18 is shown in
Figure 17, with the global meteoric water line [
51]. All water samples (springs, boreholes, wells) plot along the GMWL or are very close to this line. No sample deviates significantly. This alignment of the samples on the GMWL shows that the rainfall infiltration is quite fast, whatever the altitude. No effect of evaporation (at the sampling sites) on rainfall before or during infiltration is highlighted. It is probable that the presence of epikarsts and the fracturing of carbonate rocks, which are quite well developed because of the geodynamic context of the region, play a major role in this rapid process of infiltration. However, the absence of evaporation cannot be generalized at the whole basin scale. As the Gibbs diagram shows (see
Figure 15), evaporation can be a significant process in some places in the basin.
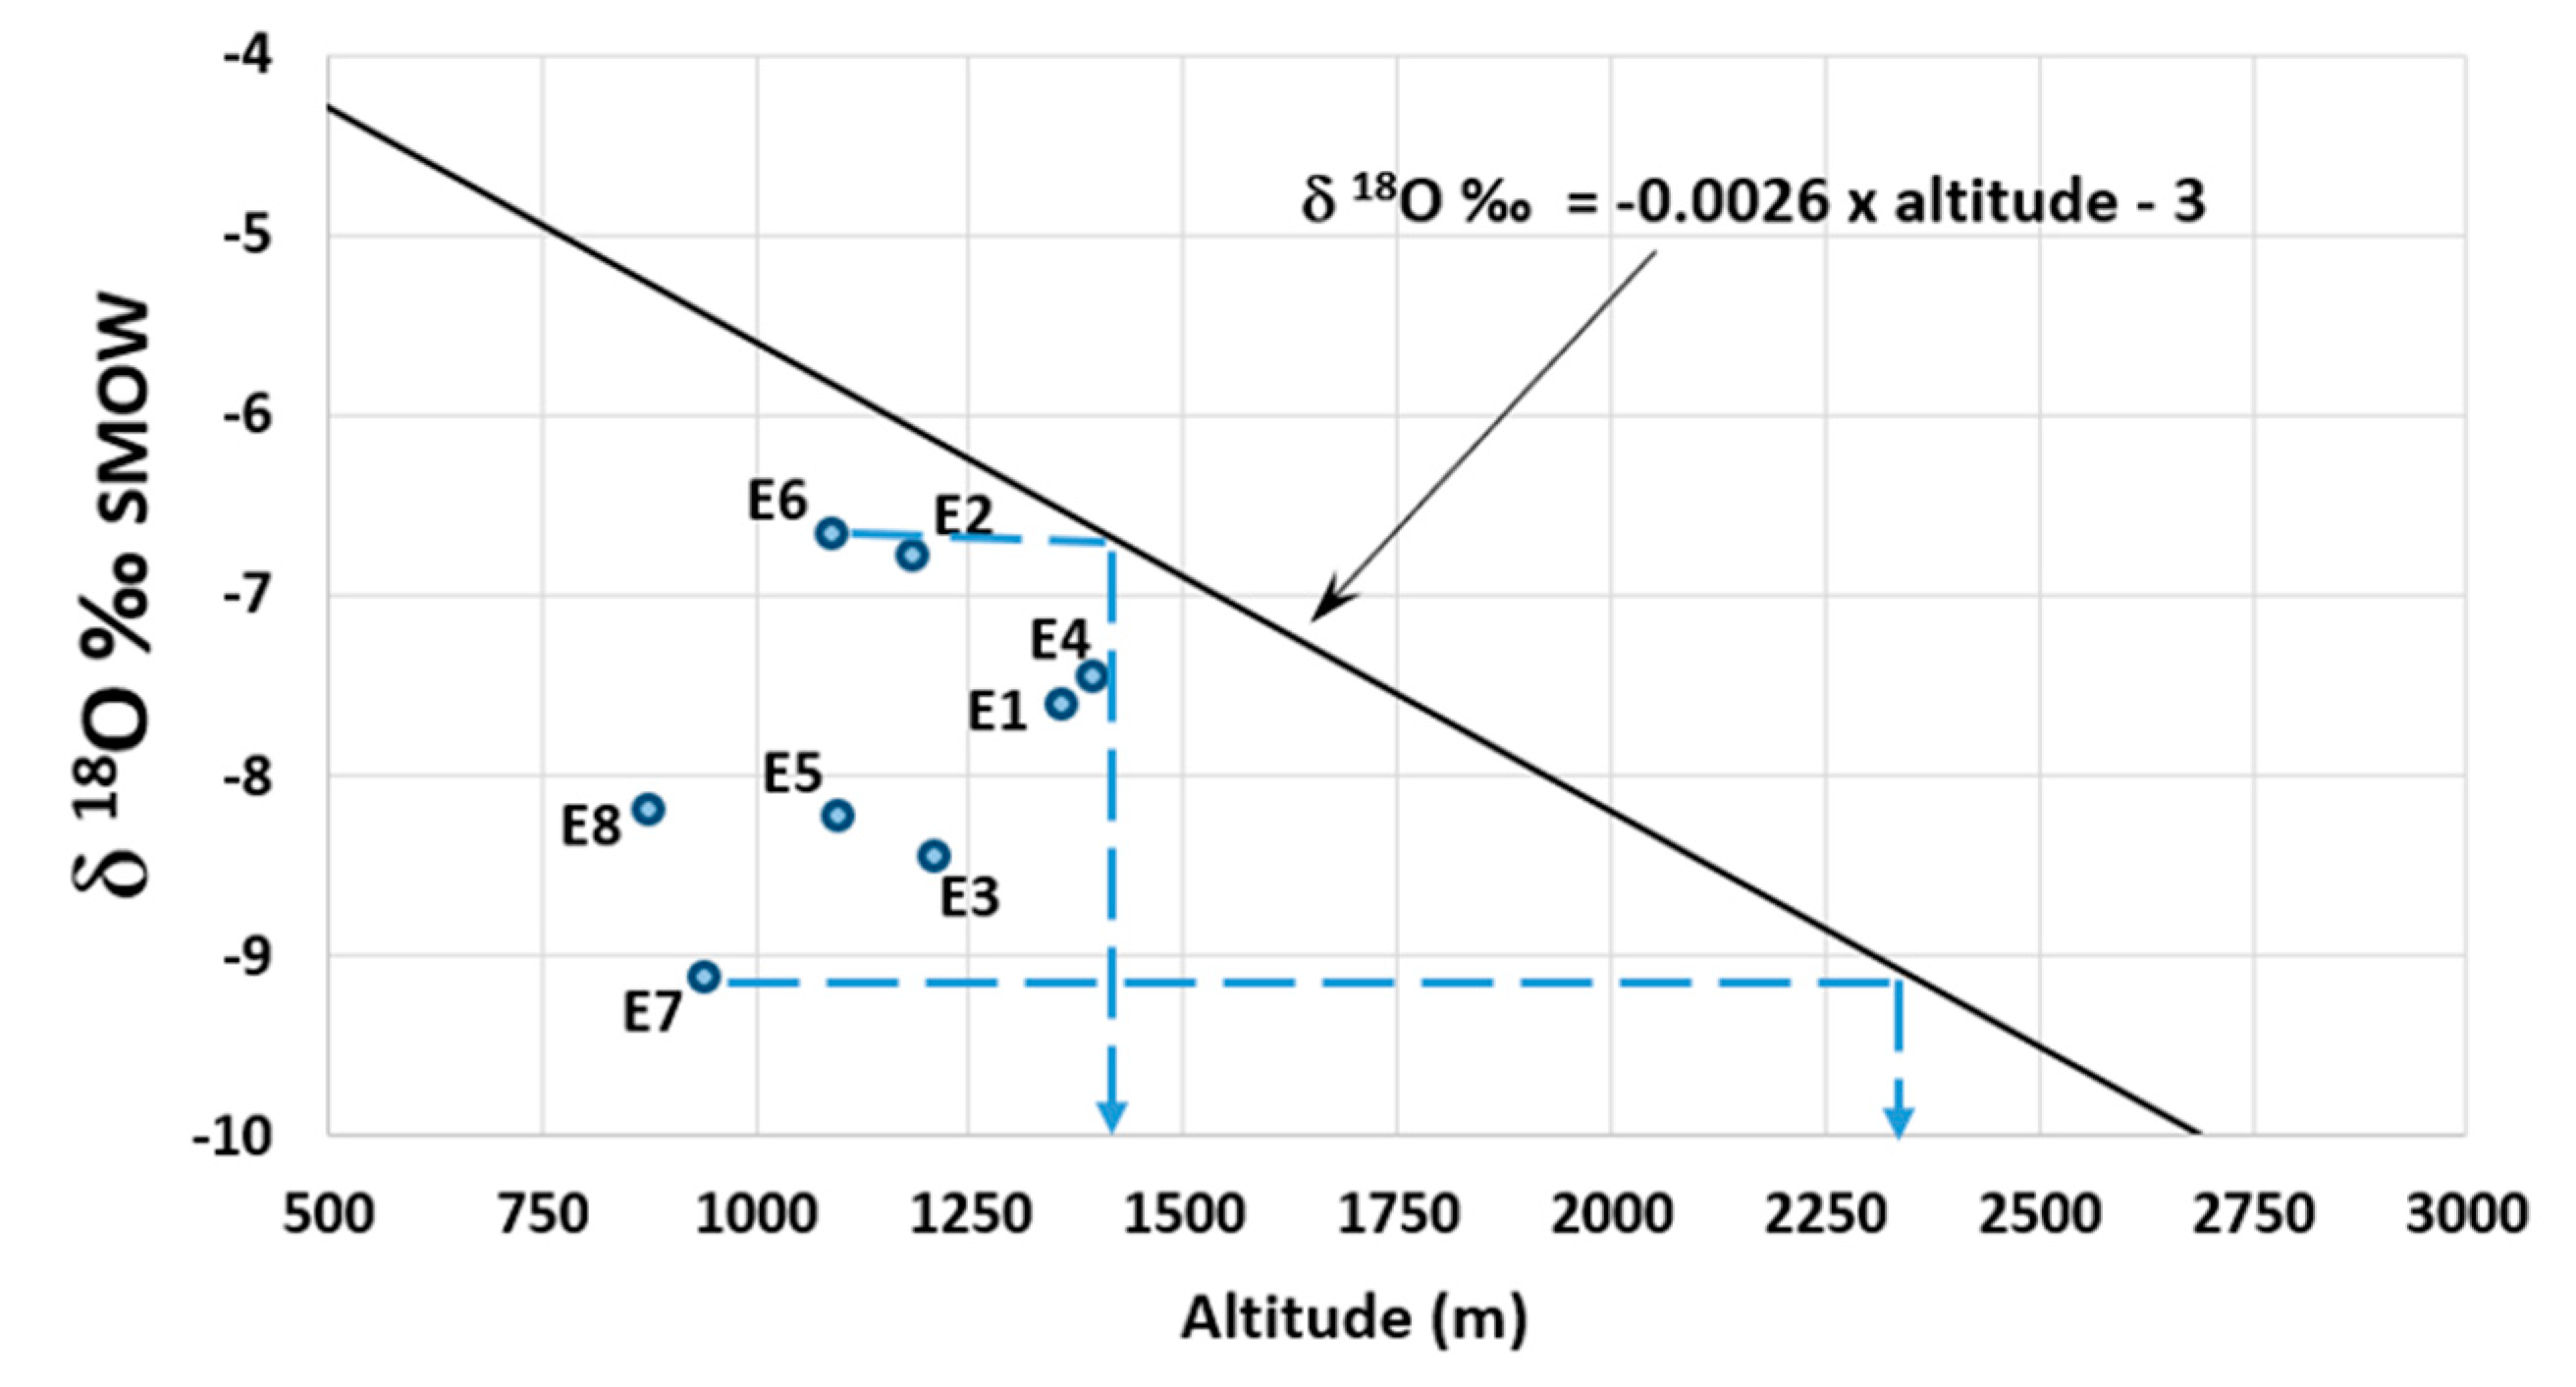
Since the stable isotope contents of the groundwater remain unchanged during their journey (no interaction with the rocks matrix), an estimate of the recharge zones can be made based on the altitudinal gradient in Oxygene-18 estimated in the Beni-Mellal Atlas [
52]. These estimates are shown in
Figure 18. The recharge altitudes would range between 2300 (E7) and 1400 m (E6). These high-altitude areas receive an average annual rainfall of around 400 mm (
Figure 8). This indicates that the precipitations which fall on the high altitudes of the Atlas Mountains constitute the main recharge of aquifer systems in the study area. Referring to
Figure 5, it can be seen that these high-altitude areas, where the system recharge mainly occurs, are included in sub-basin C1.
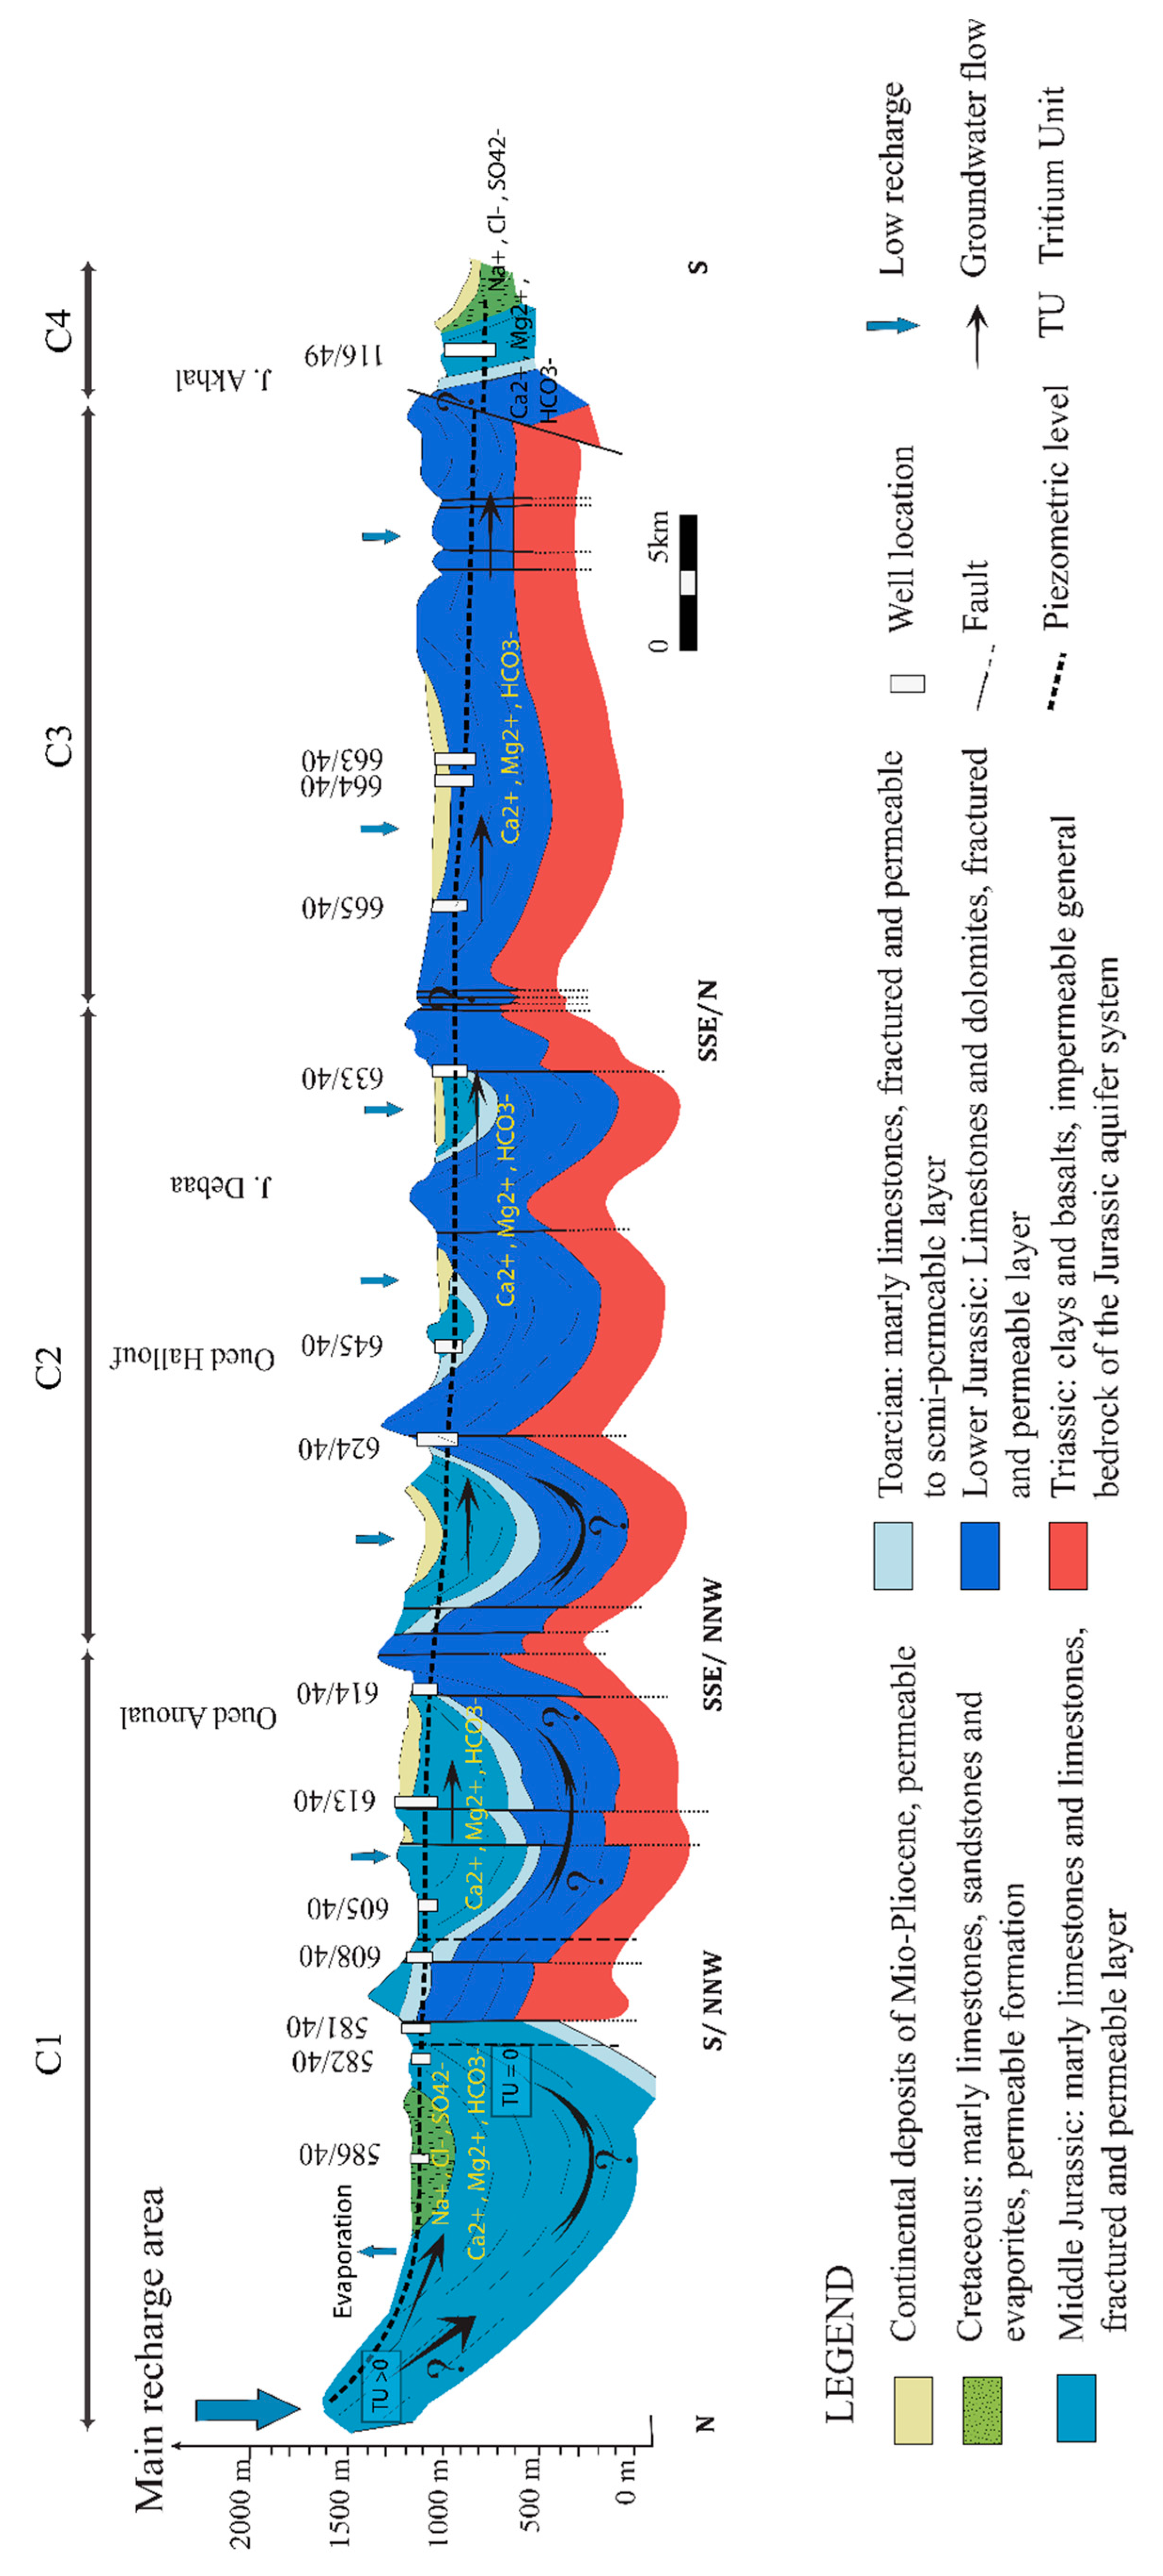
These results are preliminary and need to be confirmed by sampling more water points. Nevertheless, coupled with other findings (structures, piezometry, hydrochemistry), they provide a general vision of the functioning of this complex system, which is highlighted on the conceptual model below (see
Figure 19).
6.6. Tritium Data
Tritium (3H) is a radioactive isotope of hydrogen whose half-life is estimated at 12.32 years. Its content in water is expressed in tritium units (TU). Tritium is naturally generated in the upper atmosphere and rainwater concentration is naturally of the order of some TU. Tritium concentrations give an indication of the residence time of groundwater, referring to thermonuclear weapons testing in the 1950s–1960s. These tests resulted in a considerable increase in the level of tritium in the rain and thus serve as a reference period for the dating of groundwater [
54,
55]. When tritium cannot be detected in groundwaters, this may indicate that recharge occurred prior to the thermonuclear tests. The residence time in this case is greater than 50 years and groundwaters are classified as sub-modern. Groundwaters with some TU of tritium are classified as modern, i.e., their residence time is less than 50 years [
56].
Tritium concentrations in the EUG vary widely. Concentrations at certain water points are not detectable or very weak (E2, E3, E5, E7, E8 (see
Figure 18)). At the other three points, tritium varies from 2 to 4 TU. We can deduce that some waters are sub-modern (residence time >50 years) and others modern (residence time <50 years). The number of analyses being low, one cannot draw any conclusion between the location of the points and their tritium content. Waters with a positive tritium content (E1, E4, E6) are located, respectively, in the sub-basins C1, C2, C3. This indicates that though sub-basin C1 constitutes the preferential recharge zone, local recharge can occur. Points E2 and E3, devoid of tritium, are located in sub-basin C1, with a long residence time (>50 years), which may indicate complex and slow flowpaths. Points E7 and E8, located in the downstream part of the basin (sub-basin C4), are also devoid of tritium, indicating a long residence time. These few assessments of the residence times of groundwater in the EUG basin clearly emphasize the complex functioning of this basin.
6.7. Suitability of the EUG Groundwater for Drinking and Irrigation Purposes
The chemical composition of the EUG groundwater in each sub-basin was compared to the WHO (World Health Organization) standards [
44] for drinking and public health purposes (
Table 6). Total hardness (TH) of groundwater is due to divalent cations, mainly calcium and magnesium, and is expressed as equivalent CaCO
3 in mg L
−1. TH of groundwater is evaluated using the formula (Equation (5)) given below [
57]:
The percentages of samples in each sub-basin, and in the whole EUG, which are below the maximum allowable limits for drinking water related to pH, TH and concentrations of Na, Ca, Mg, Cl, SO
4 and NO
3 are shown in
Table 6.
Table 6 shows that groundwater in the C1 and C4 sub-basins is the least suitable for drinking. In sub-basin C1, only 34% of the samples are below the maximum threshold for TH, 60% for Mg and 60% for SO
4. In sub-basin C4, the groundwater quality is more degraded since only 56% of the samples are below the maximum threshold for TH, 56% for Na, 78% for Mg and 56% for SO
4. In sub-basins C2 and C3, the percentage of samples meeting WHO standards is high (>80%). Only TH poses a problem in C3, with only 71% of samples below the maximum threshold. The comparison of the EUG hydrochemical data shows that, at the basin scale, groundwater is not everywhere suitable for drinking purposes. The C2 and C3 sub-basins, which best meet WHO standards, should be favored for the exploitation of groundwater.
There are many indices which allow for assessing the suitability of water for irrigation [
58]. In this study, we used the SAR (sodium adsorption ratio), which is an index quite often used for this purpose [
58,
59,
60]. This index constitutes a measure of alkali/sodium hazard to crops. When irrigation waters are rich in Na
+, the soil permeability can be reduced, thus limiting water transfer. This is caused by the exchange processes that take place between water and soil. Sodium (Na
+) is adsorbed by clay particles replacing Mg
2+ and Ca
2+ ions. The excess sodium is evaluated by the sodium adsorption ratio SAR (Equation (6)), which is written as follows:
where concentrations are expressed in meq L
−1. The values of SAR have been divided into classes which account for water’s suitability for irrigation. This is illustrated in
Table 7.
The SAR index was evaluated for all water samples collected within this study.
Table 8 illustrates the classification of groundwater from the study area with respect to the SAR index.
The results in
Table 8 show that the hazard represented by sodium should not be overlooked in this basin. Not all of the groundwater is suitable for irrigation. At the basin scale, 5% of the water is totally unsuitable (SAR > 26), 5% is not recommended for this use (19 < SAR < 26) and 5% can be used with certain restrictions. Only 80% of the basin’s groundwater can be used to irrigate any type of crop in any type of soil. At the scale of the sub-basins, all unsuitable waters are located in sub-basins C1 and C4. The C2 and C3 sub-basins have the highest percentages relating to the water usable for any crop and any type of soil. Accordingly, the quality of the waters in this basin is quite variable. The comparison with WHO standards and the classification according to the SAR index clearly show better overall water quality in the C2 and C3 sub-basins, both for drinking and for irrigation.
7. Conclusions
In the Eastern Upper Guir (EUG) Basin, the hydrogeological system consists of Lower and Middle Jurassic limestones and marly limestones, separated by Toarcian marly limestones. The whole Jurassic lies on Triassic clayey and volcanic formations which form the continuous impermeable bedrock throughout the Atlas range. The Middle Jurassic limestones are overlaid in the northeast and southeast parts of the study area by Cretaceous formations, made up of marly limestones, sandstones and evaporites.
Closely related to the structure of the High Atlas, the morphology of the whole system is in the form of large synclines separated by faulted anticlines, whose overlapping faults act as semi-permeable barriers and delimit sub-basins. The whole basin thus can be divided into four sub-basins. The relations between the sub-basins take place through the water gorges developed as a result of late fractures intersecting and perpendicular to the axis of the anticlines. This compartmentalization of the global aquifer system causes the very complex functioning of the whole.
The basin lies in a semi-arid climatic context, where rivers are ephemeral. Groundwater is the main available resource. Forecasted development projects and concomitant population increase will require in the coming years more and more water. The EUG basin’s groundwater resources will therefore rapidly undergo high pressure to satisfy all the demands.
The present study, based on structural, meteorological, hydrogeological, hydrochemical and isotopic data, allowed us to advance significantly in the understanding of this system. The hydrogeological sub-basins remain interdependent on one another. The recharge processes for this system have been clarified. The recharge of the system corresponds essentially to the infiltrations associated with the rains and snowfalls at high altitudes. This is consistent with the stable isotope results.
The main mineralization processes have been defined as water–rock interactions and evaporation. Groundwater is basically of the Ca-Mg-HCO3 type, as the main reservoir is constituted by the carbonate formations of Jurassic. This chemical profile is, however, highly impacted at places where Cretaceous evaporitic formations (gypsiferous marls) are found. This occurs specifically in the northeast and southeast parts of the basin. The consequences of mineralization for groundwater’s suitability for drinking and irrigation are fairly serious. Not all the groundwater is suitable for these purposes.
Acceptable quality is found mainly in the center of the basin. The few available tritium data showed that groundwater residence time is very different (sub-modern to modern) in a given sub-basin and from one sub-basin to the other, highlighting quite complex groundwater flowpaths. A general conceptual model of the basin is provided in
Figure 19, highlighting the present knowledge about the basin’s functioning.
The findings from the present study constitute a first aid for decision-makers in order to set up a sustainable exploitation of this system. However, given the importance of planned development projects in this region and the increase in water demand, complementary studies and works should be considered in the near future to further the results presented here.
Current knowledge should be supplemented as a priority by an estimate of the water budget of the system, based on the following investigations: study of surface flows—in particular, by measuring the discharge rates of the wadis; assessment of possible underflows associated with the wadis; measurement of piezometric fluctuations. The deep end of the system is currently very little known and also requires extensive investigations using geophysical prospecting and/or deep drilling. Other recommendations pertain to the following topics: setting up a piezometric monitoring network of the Jurassic aquifer; performing pumping tests in each Jurassic permeable layer to estimate their hydraulic parameters; deepening isotopic studies to strengthen and clarify current knowledge on the functioning of the system (stable and radiogenic water isotopes, carbon isotopes, etc.). The outcomes of all these works and studies will lead to a multi-scale understanding of the functioning of the system and specifically make it possible to consider the development of conceptual models at finer scales, particularly in the vicinity of semi-permeable hydrogeological barriers and between areas with strong contrasts in mineralization. Such knowledge is required in order to move towards a quantitative assessment and management of the water resources.
Author Contributions
Conceptualization: F.A., M.H., L.B., C.F., M.R., A.M., A.E.A.; Methodology, F.A., C.F., M.R., A.E.A.; Validation, F.A., C.F., M.R., A.E.A.; Formal Analysis, F.A., C.F., M.R., A.E.A.; Investigation, F.A., M.H., L.B., C.F., M.R., A.M., A.E.A., L.E., J.L.; Resources, F.A., A.E.A., C.F., M.R.; Data Curation, F.A., C.F.; Writing—Original Draft Preparation, F.A., C.F., M.R.; Writing—Review and Editing, F.A., C.F., M.R.; Supervision, M.H., L.B., C.F., M.R., A.E.A.; Funding Acquisition: M.R., A.E.A., All authors have read and agreed to the published version of the manuscript.
Funding
C.F. and M.R. gratefully acknowledge financial support from the ANR (Agence Nationale de la Recherche) for their field trips in the Upper Guir.
Acknowledgments
The authors would like to express their thanks to the ABHGZR (Agence du Bassin Hydraulique du Guir Ziz Rhéris) for providing some wells data.
Conflicts of Interest
The authors declare no conflict of interest.
References
- Sowers, J.; Vengosh, A.; Weinthal, E. Climate change, water resources, and politics of adaptation in the Middle east and North Africa. Clim. Chang. 2011, 104, 599–627. [Google Scholar] [CrossRef]
- Intergovernmental Panel on Climate Change (IPCC). Global Warming of 1.5 °C. In Contribution of Working Group I to the Fourth Assessment Report of the Intergovernmental Panel on Climate Change; Masson-Delmotte, V., Zhai, P., Yassaa, N., Vera, C., Tariq, M., Fuglestvedt, J., Flato, G., Driouech, F., Aldrian, E., Eds.; Cambridge University Press: Cambridge, UK, 2018; 538p. [Google Scholar]
- AlSarmi, S.H.; Washington, R. Changes in climate extremes in the Arabian Peninsula: Analysis of daily data. Int. J. Climatol. 2013, 34, 1329–1345. [Google Scholar] [CrossRef]
- Dogar, M.M.; Sato, T. Analysis of Climate Trends and Leading Modes of Climate Variability for MENA Region. J. Geophys. Res.-Atmos. 2018. [Google Scholar] [CrossRef]
- Intergovernmental Panel on Climate Change (IPCC). Desertification. In Climate Change and Land. Special Report on Climate Change, Desertification, Land Degradation, Sustainable Land Management, Food Security, and Greenhouse Gas Fluxes in Terrestrial Ecosystems; Aneth, A., Ed.; Cambridge University Press: Cambridge, UK, 2019; p. 41. [Google Scholar]
- Gao, X.; Giorgi, F. Increased aridity in the Mediterranean region under greenhouse gas forcing estimated from high resolution simulations with a regional climate model. Glob. Planet. Chang. 2008, 62, 195–209. [Google Scholar] [CrossRef]
- Suppan, P.; Kunstmann, H.; Heckel, A.; Rimmer, A. Impact of climate change on water availability in the Near East. In Climatic Changes and Water Resources in the Middle East and North Africa; Zereini, F., Hotzl, H., Eds.; Springer: Berlin, Germany, 2008; 552p. [Google Scholar]
- Milly, P.C.D.; Dunne, K.A.; Vecchia, A.V. Global pattern of trends in stream flow and water availability in a changing climate. Nature 2005, 438, 347–350. [Google Scholar] [CrossRef]
- Born, K.; Fink, A.; Paeth, H. Dry and wet periods in the northwestern Maghreb for present day and future climate conditions. Meteorol. Z. 2008, 17, 533–551. [Google Scholar] [CrossRef]
- Griffiths, F.; Soliman, K.H. The Mediterranean Zone. In Climates of Africa. World Survey of Climatology; Landberg, H.E., Ed.; Elsevier Publisher Co.: Amsterdam, The Netherlands, 1972; Volume 10, pp. 75–132. [Google Scholar]
- Faour, G.; Mhawej, M.; Fayad, A. Detecting Changes in Vegetation Trends in the Middle east and North Africa (MENA) Region Using Spot Vegetation. Eur. J. Geogr. 2016, 779, 2–20. [Google Scholar] [CrossRef]
- Michalet, R.; Guichard, J.-P. Nouvelle synthèse bioclimatique des milieux méditerranéens. Application au Maroc septentrional. Revue D'écologie Alpine 1991, 1, 59–80. [Google Scholar]
- Linstädter, A.; Zielhofer, C. Regional fire history shows abrupt responses of Mediterranean ecosystems to centennial-scale climate change (Olea–Pistacia Woodlands, NE Morocco). J. Arid Environ. 2010, 74, 101–110. [Google Scholar] [CrossRef]
- Mokhtari, N.; Mrabet, R.; Lebailly, P.; Block, L. Spatialisation des bioclimats, de l’aridité et des étages de végétation du Maroc. Rev. Mar. Sci. Agron. Vét. 2014, 2, 50–66. [Google Scholar]
- Talbi, F.Z.; Faraj, C.; Ell-Akhal, F.; El Khayyat, F.; Chenfour, D.; Janati Idrissi, A.; El Ouali Lalami, A. Diversity and Dynamics of Sand Flies (Diptera: Psychodidae) of Two Cutaneous Leishmaniasis Foci in the Fes-Boulemane Region of Northern Morocco. Int. J. Zool. 2015, 4–5, 1–6. [Google Scholar] [CrossRef] [Green Version]
- Word Bank Group. Gestion de la Rareté de l’Eau en Milieu Urbain au Maroc. Annexes aux Sections 2 à 4. 2017, 73p. Available online: http://documents.worldbank.org/curated/pt/299131516806648462/pdf/122698-FRENCH-v2Annexes-Sections-2-4-FR.pdf (accessed on 4 October 2020).
- Sabri, A.; Bouaziz, A.; Hammani, A.; Kuper, M.; Douaik, A.; Badraoui, M. Valorisation de l’eau par la variété Phoenicicole Majhoul Conduite Sous Les Conditions Arides du Tafilalet au Maroc. ICID2015, 26th ERC & 66th IEC, 2015, Poster. Available online: https://icid2015.sciencesconf.org/65402 (accessed on 4 October 2020).
- Chaponnière, A.; Boulet, G.; Chelbouni, A.; Aresmouk, M. Understanding hydrological processes with scarce data in a mountain environment. Hydrol. Process. 2008, 22, 1908–1921. [Google Scholar] [CrossRef] [Green Version]
- Klemes, V.F. Hydrology of Mountainous Areas, Proceedings of the International Workshop Held at Strbské Pleso, Vysoké Tatry, Czechoslovakia, 7–10 June 1988; Molnar, L., Ed.; IAHS Publication, 190; IAHS Press: Wallingford, CT, USA, 1990; p. vii. [Google Scholar]
- Vigna, V.; Banzaato, C. The hydrogeology of high-mountain carbonate areas: An example of some Alpine systems in southern Piedmont (Italy). Environ. Earth Sci. 2015, 74, 267–280. [Google Scholar] [CrossRef]
- Choubert, G.; Suter, G.; Marçais, J. Carte géologique du Maroc au 1/500000, feuille n°5 Oujda. Ministère de l’Energie et des Mines Direction de la Géologie. Editions du Service géologique du Maroc. Notes Mém. Serv. Géol. Maroc. 1954, 70, 49. [Google Scholar]
- Brede, R.; Hauptmann, M.; Herbig, H.-G. Plate tectonics and intracratonic mountain ranges in Morocco; The Mesozoic-Cenozoic development of the Central High Atlas and the Middle Atlas. Geol. Rundsch. 1992, 81, 127–141. [Google Scholar] [CrossRef]
- Schettino, A.; Eugenio, T. Breakup of Pangaea and plate kinematics of the central Atlantic and Atlas regions. Geophys. J. Int. 2009, 178, 1078–1097. [Google Scholar] [CrossRef] [Green Version]
- Du Dresnay, R.; Agard, J.; Schmitt, M.; Lebedeff, V.; Dubar, G. Carte et coupes géologiques du Haut-Atlas d'Anoual-Bou Anane (Haut Atlas Oriental) au 1/200.000. Notes Mém. Serv. Géol. Maroc 1977, 46, 55. [Google Scholar]
- Sebbar, A.; Yousfi, N.; Hsaine, M.; Fougrach, H.; Saloui, A.; Badri, W. Contribution à la mise à jour de la carte pluviométrique du Maroc. Gestion Environnemental des Produits Chimiques. Proc. GEPROC4 2010, 2, 56–68. [Google Scholar]
- Sebbar, A.; Badri, W.; Fougrach, H.; Hsaine, M.; Saloui, A. Etude de la variabilité du régime pluviométrique au Maroc septentrional (1935–2004). Sécheresse 2011, 22, 139–148. [Google Scholar]
- Gee, G.W.; Hillel, D. Groundwater recharge in arid regions: Review and critique of estimation its methods. Hydrol. Process 1988, 2, 255–266. [Google Scholar] [CrossRef]
- Razack, M.; Jalludin, M.; Houmed-Gaba, A. Simulation of Climate Change Impact on a Coastal Aquifer under Arid Climate. The Tadjourah Aquifer (Republic of Djibouti, Horn of Africa). Water 2019, 11, 2347. [Google Scholar] [CrossRef] [Green Version]
- Nimmo, J.R.; Horowitz, C.; Mitchell, L. Discrete-Storm Water-Table Fluctuation Method to Estimate Episodic Recharge. Groundwater 2015, 53, 282–292. [Google Scholar] [CrossRef] [PubMed]
- Zhang, J.; Felzer, B.S.; Troy, T.J. Extreme precipitation drives groundwater recharge: The Northern High Plains Aquifer, central United States, 1950–2000. Hydrol. Process. 2016, 30, 2533–2545. [Google Scholar] [CrossRef]
- Thomas, B.F.; Ali Behrangi, A.; Famiglietti, J.S. Precipitation Intensity Effects on Groundwater Recharge in the Southwestern United States. Water 2016, 8, 90. [Google Scholar] [CrossRef] [Green Version]
- Rodier, J. L’analyse de l’eau, 5th ed.; Dunot Technique: Paris, France, 1975; 630p. [Google Scholar]
- Jollife, I.T. Principal Component Analysis; Springer: New York, NY, USA, 1986; 271p. [Google Scholar]
- Meng, S.X.; Maynard, J.B. Use of statistical analysis to formulate conceptual models of geochemical behavior: Water chemical data from Butucatu aquifer in Sao Paulo State, Brazil. J. Hydrol. 2001, 250, 78–97. [Google Scholar] [CrossRef]
- Razack, M.; Dazy, J. Hydrochemical characterization of groundwater mixing in sedimentary and metamorphic reservoirs with a combined use of Piper’s principle and factor analysis. J. Hydrol. 1990, 114, 371–393. [Google Scholar] [CrossRef]
- Usunoff, E.J.; Guzman, A. Multivariate analysis in hydrochemistry: An example of the use of factor and correspondence analyses. Ground Water 1989, 27, 27–34. [Google Scholar] [CrossRef]
- Freeze, A.; Cherry, J. Groundwater; Prentice-Hall: Englewood Cliffs, NJ, USA, 1979; 604p. [Google Scholar]
- Gibbs, R.J. Mechanism controlling world water chemistry. Science 1970, 17, 1088–1090. [Google Scholar] [CrossRef]
- Schoeller, H. Qualitative evaluation of groundwater resources. In Methods and Techniques of Groundwater Investigation and Development; Water Resources Series; UNESCO: Paris, France, 1967; pp. 44–52. [Google Scholar]
- Clark, I. Groundwater Geochemistry and Isotopes; CRC Press: New York, NY, USA, 2015; 438p. [Google Scholar]
- Fontes, J.C. Deuterium and Oxygen-18 in the Water Cycle, Stable Isotope Hydrology 1982; Technical reports series; IAEA: Vienna, Austria, 1982; pp. 273–298. [Google Scholar]
- Issar, A.; Gat, J. Environmental isotopes as a tool in hydrogeological research in arid basin. Groundwater 1981, 19, 490–494. [Google Scholar]
- Fritz, P.; Fontes, J.C. Environmental isotopes in groundwater hydrology. In Handbook of Environmental Isotope Geochemistry; Fritz, P., Fontes, J.C., Eds.; Elsevier: Amsterdam, The Netherlands, 1980; Volume 1, pp. 75–140. [Google Scholar]
- WHO. Guideline for Drinking-Water Quality, 3rd ed.; World Health Organization: Geneva, Switzerland, 2004. [Google Scholar]
- Haritash, A.K.; Mathur, K.; Singh, P.; Singh, S.K. Hydrochemical characterization and suitability assessment of groundwater in Baga–Calangute stretch of Goa. India. Environ. Earth Sci. 2017, 76, 341. [Google Scholar] [CrossRef]
- Barzegar, R.; Moghaddam, A.A.; Tziritis, E.; Fakhri, M.S.; Soltani, S. Identification of hydrogeochemical processes and pollution sources of groundwater resources in the Marand plain, northwest of Iran. Environ. Earth Sci. 2017, 76, 297. [Google Scholar] [CrossRef]
- Banks, D.; Frengstad, B. Evolution of groundwater chemical composition by plagioclase hydrolysis in Norwegian anorthosites. Geochem. Cosmochim. Acta 2006, 70, 1337–1355. [Google Scholar] [CrossRef]
- Gascoyne, M. Hydrogeochemistry, groundwater ages and sources of salts in a granitic batholith on the Canadian Shield, southeastern Manitoba. Appl. Geochem. 2004, 19, 519–560. [Google Scholar] [CrossRef]
- Blavoux, B.; Burger, A.; Chauve, P.; Mudry, J. Utilisation des isotopes du milieu à la prospection hydrogéologique de la chaîne du Jura. Rev. Geol. Dyn. Geogr. Phys. 1979, 21, 295–306. [Google Scholar]
- Bouchaou, L.H.; Michelot, J.L. Contribution des isotopes à l'étude de la recharge des aquifères de la région de Béni Mellal (Tadla, Maroc). Iahs Publ. 1997, 244, 37–44. [Google Scholar]
- Craig, H. Standards for reporting concentrations of deuterium and oxygen-18 in natural waters. Science 1961, 133, 1833–1834. [Google Scholar] [CrossRef]
- Bouchaou, L. Fonctionnement des Aquifères Atlasiques et leur Relations avec les Aquifères de la Plaine: Cas de l'Atlas de-Beni Mellal et de la Plaine du Tadla (Maroc). Ph.D. Thesis, Faculty of Sciences, University Cadi Ayyad, Marrakech-Semlalia, Morocco, 1995. [Google Scholar]
- Bortolami, G.C.; Ricci, B.; Susella, G.F.; Zuppi, G.M. Isotope hydrology of the Val Corsaglia, Maritime Alps, Piedmont, Italy. In Isotope Hydrology; IAEA: Neuheberg, Germany, 1978; Volume 1, pp. 327–350. [Google Scholar]
- Marcé, A. Contribution des Méthodes Isotopiques à L'étude des Modalités D'alimentation et du Renouvellement des Réserves Souterraines du Maroc; Rapport 75 SGN 447 LAB; BRGM: Orléans, France, 1975; 131p.
- Blasch, K.W.; Bryson, J.R. Distinguishing Sources of Ground Water Recharge by Using 2H and 18O. Ground Water 2007, 45, 294–308. [Google Scholar] [CrossRef]
- Faure, H.; Fontes, J.C.; Gischler, C.E.; Mook, W.G.; Vogel, J.C. Un exemple d’étude d’hydrogéologie isotopique en pays semi-aride, le bassin du Lac Tchad. J. Hydrol. 1970, 10, 141–150. [Google Scholar] [CrossRef]
- Hem, J.D. Study and Interpretation of Chemical Characteristics of Natural Water, 3rd ed.; Geological Survey Water-Supply 1985, Paper 2254; United States Government Printing Office: Washington, DC, USA, 1985.
- Kumar, M.; Kumari, K.; Ramanathan, A.L.; Saxena, R.A. Comparative Evaluation of Groundwater Suitability for Irrigation and Drinking Purposes in Two Intensively Cultivated, Districts of Punjab, India. Environ. Geol. 2007, 53, 553–574. [Google Scholar] [CrossRef]
- Ndoye, S.; Fontaine, C.; Gaye, C.; Razack, M. Groundwater quality and suitability for different uses in the Saloum area of Senegal. Water 2018, 10, 1837. [Google Scholar] [CrossRef] [Green Version]
- Subramani, T.; Elango, L.; Damodarasamy, S.R. Groundwater quality and its suitability for drinking and agricultural use in Chithar River Basin, Tamil Nadu, India. Environ. Geol. 2005, 47, 1099–1110. [Google Scholar] [CrossRef]
Figure 1.
Climatic zone boundaries of Northern Morocco on both sides of Atlas ranges under mountainous climate influence (modified from [
12,
13,
14,
15]).
Figure 1.
Climatic zone boundaries of Northern Morocco on both sides of Atlas ranges under mountainous climate influence (modified from [
12,
13,
14,
15]).
Figure 2.
Location of study area close to the eastern border of Moroccan High Atlas.
Figure 2.
Location of study area close to the eastern border of Moroccan High Atlas.
Figure 3.
Geology of High Atlas in the study area (modified from [
21]). Note that there is an unmapped strip in the south because the available geological maps do not cover the entire study area.
Figure 3.
Geology of High Atlas in the study area (modified from [
21]). Note that there is an unmapped strip in the south because the available geological maps do not cover the entire study area.
Figure 4.
Geological cross-sections showing the structure of High Atlas compartmented by parallel folds, faulted anticlines and thrust faults (modified from [
24]).
Figure 4.
Geological cross-sections showing the structure of High Atlas compartmented by parallel folds, faulted anticlines and thrust faults (modified from [
24]).
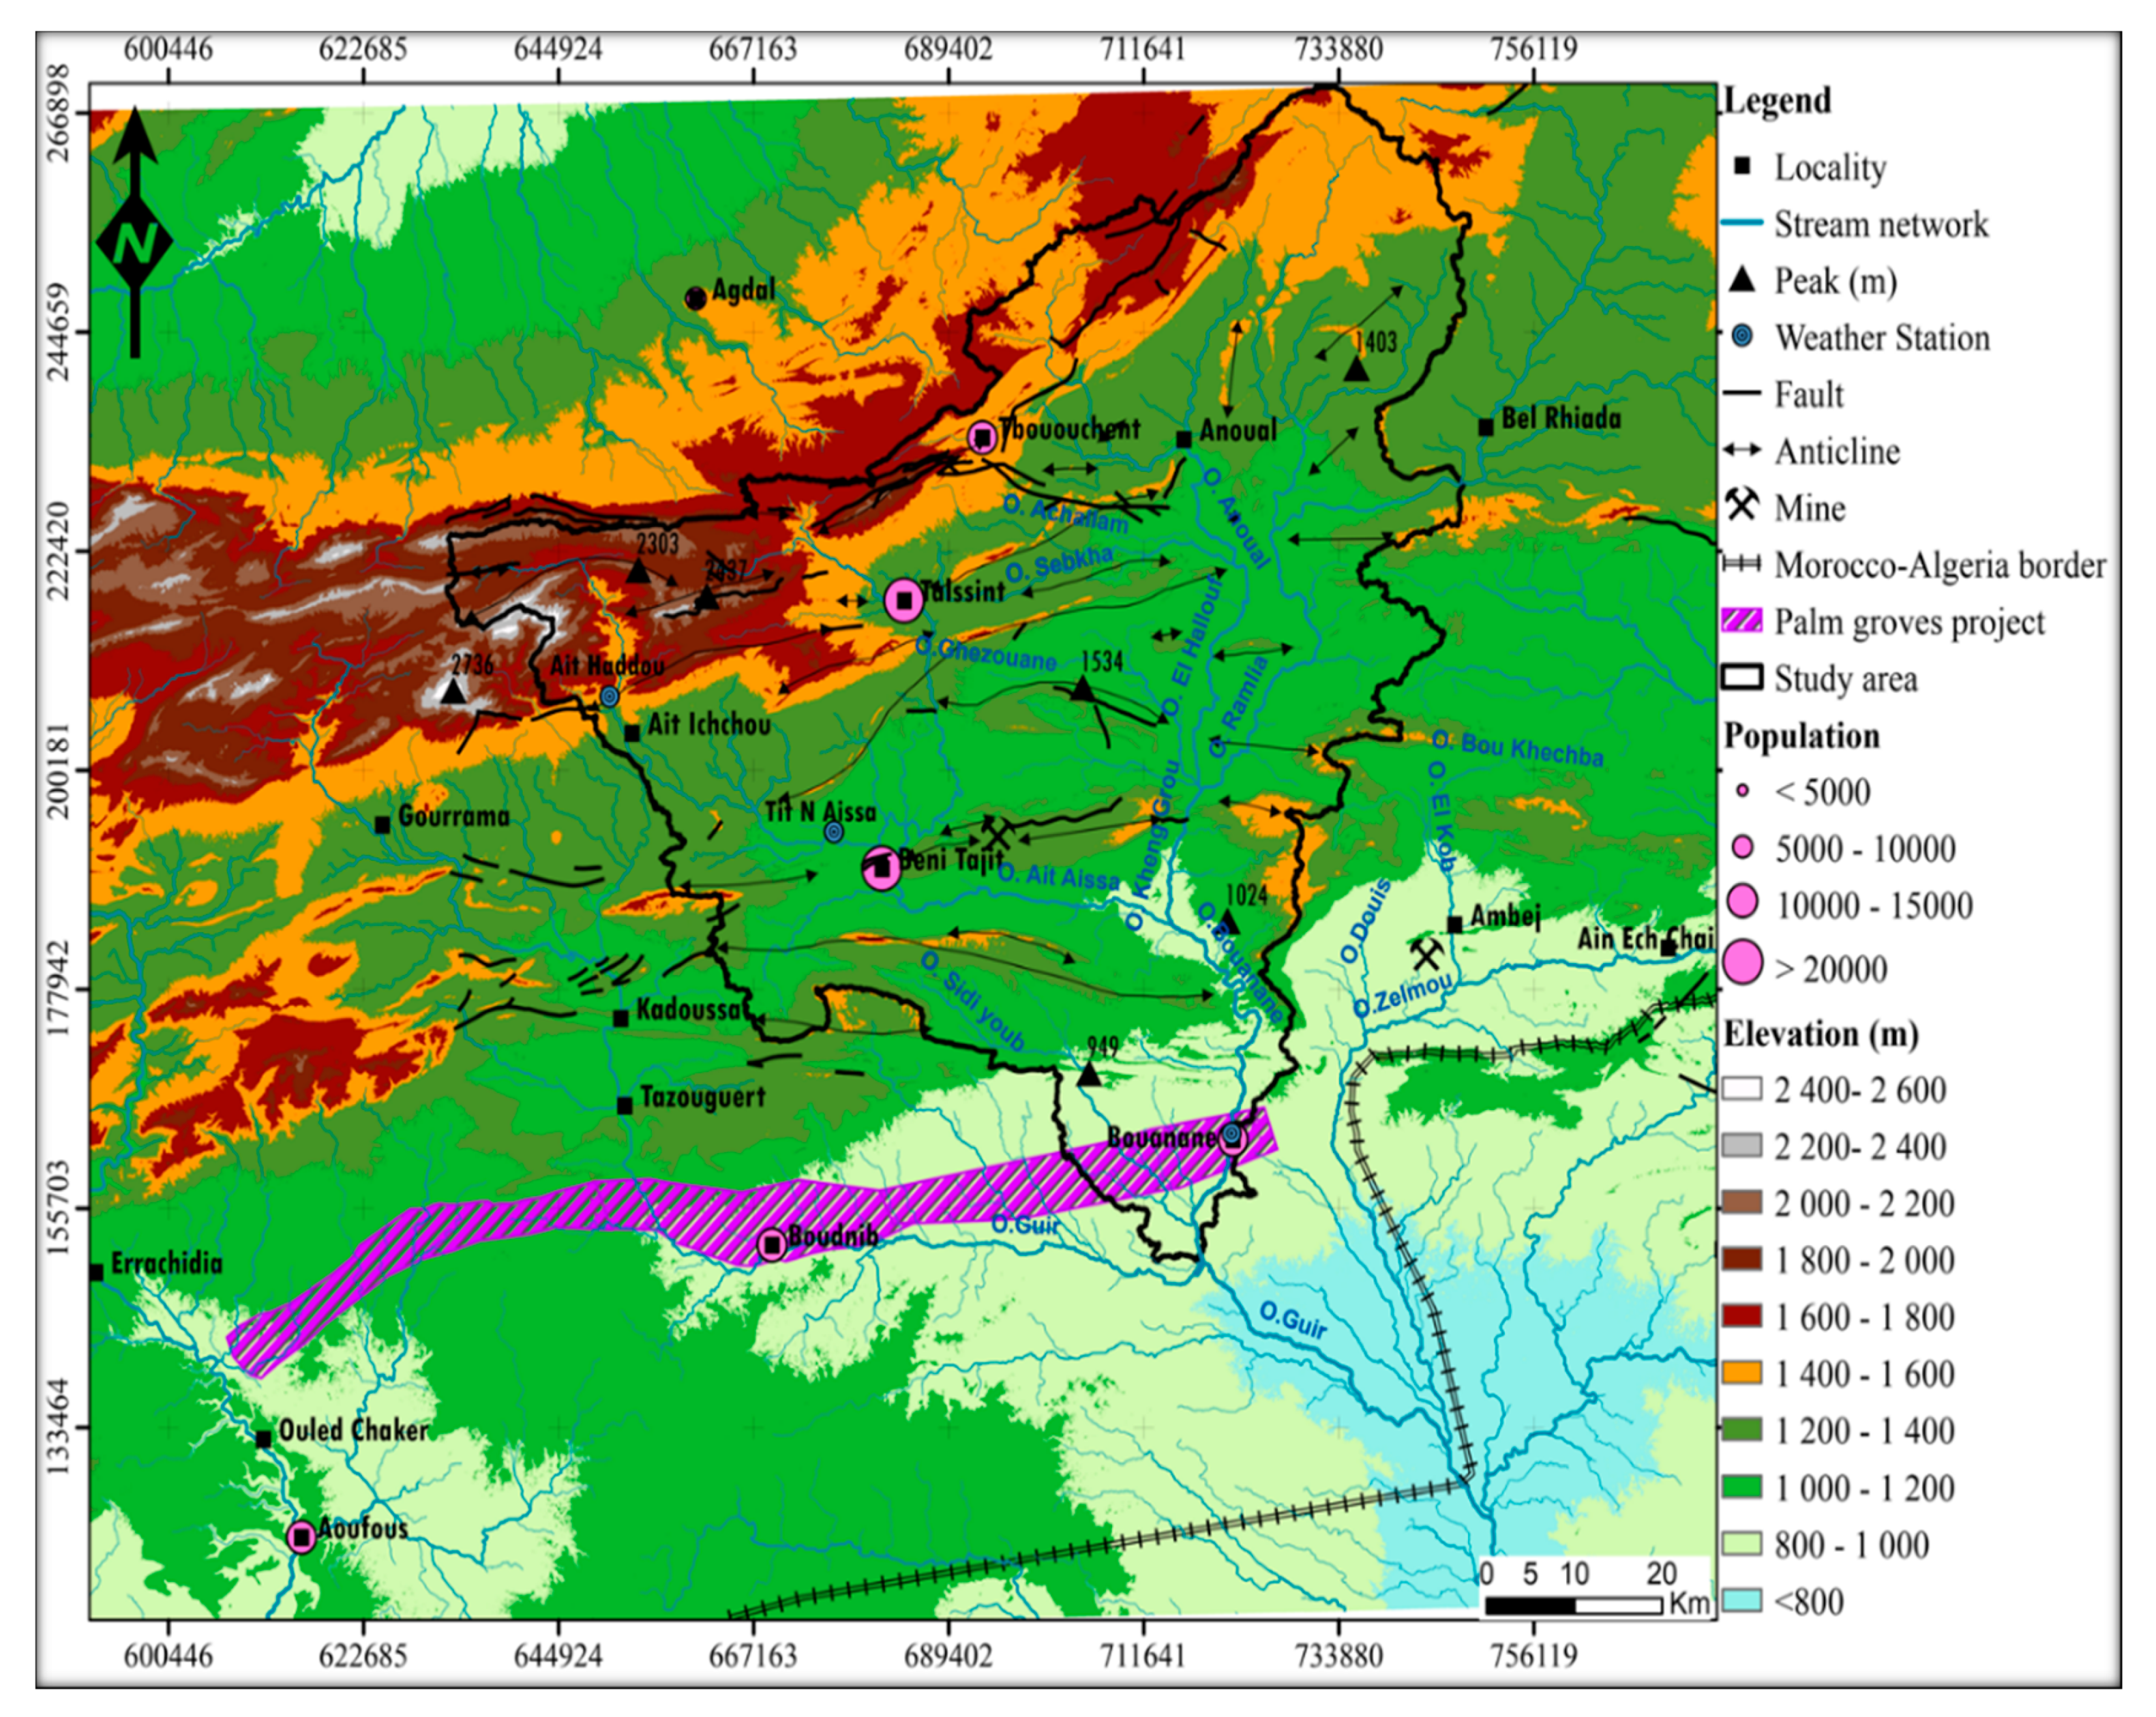
Figure 5.
Morphological map and hydrological network of Eastern Upper Guir, compared with locations of human activities (urban centers, mines and palm plantation project).
Figure 5.
Morphological map and hydrological network of Eastern Upper Guir, compared with locations of human activities (urban centers, mines and palm plantation project).
Figure 6.
Hydrographic network of Eastern Upper Guir basin divided into sub-basins (C) based on E-W major Atlas structures, surface flow directions and water gaps.
Figure 6.
Hydrographic network of Eastern Upper Guir basin divided into sub-basins (C) based on E-W major Atlas structures, surface flow directions and water gaps.
Figure 7.
Synthetic map of the average annual rainfall in relation to general topography and especially with great structural units of Atlas and Rif (modified from [
25,
26]).
Figure 7.
Synthetic map of the average annual rainfall in relation to general topography and especially with great structural units of Atlas and Rif (modified from [
25,
26]).
Figure 8.
Annual rainfall and linear trend (red dotted line) at Ait Haddou (A), Tit N’Aissa (B) and Bouanane (C) stations, for measurements over 1972–2018, 1977–2018 and 1959–2018 periods, respectively. Trend lines are linear models.
Figure 8.
Annual rainfall and linear trend (red dotted line) at Ait Haddou (A), Tit N’Aissa (B) and Bouanane (C) stations, for measurements over 1972–2018, 1977–2018 and 1959–2018 periods, respectively. Trend lines are linear models.
Figure 9.
Location map of all water points (184) where hydrochemical data are available (current study and water agency archives).
Figure 9.
Location map of all water points (184) where hydrochemical data are available (current study and water agency archives).
Figure 10.
Piezometric map of the Upper Guir groundwater drawn using data from the current study (40 data) and from the archives of the water agency, ABHGZR (250 data).
Figure 10.
Piezometric map of the Upper Guir groundwater drawn using data from the current study (40 data) and from the archives of the water agency, ABHGZR (250 data).
Figure 11.
Map of electrical conductivity in the Jurassic–Cretaceous aquifer of Eastern Upper Guir.
Figure 11.
Map of electrical conductivity in the Jurassic–Cretaceous aquifer of Eastern Upper Guir.
Figure 12.
Distribution of major ion concentrations in the Eastern Upper Guir aquifer.
Figure 12.
Distribution of major ion concentrations in the Eastern Upper Guir aquifer.
Figure 13.
(A) Projection of initial variables on factors F1-F2 plane. (B) Plot of water samples on the plane associated with factors 1 and 2.
Figure 13.
(A) Projection of initial variables on factors F1-F2 plane. (B) Plot of water samples on the plane associated with factors 1 and 2.
Figure 14.
Plot of the samples on a Piper diagram.
Figure 14.
Plot of the samples on a Piper diagram.
Figure 15.
Plots of the water samples on Gibbs diagrams.
Figure 15.
Plots of the water samples on Gibbs diagrams.
Figure 16.
Bivariate plots between dissolved elements in the EUG groundwater (A) Calcite; (B) Magnesite; (C) Dolomite; (D) Gypsum; (E) Epsomite; (F) Halite.
Figure 16.
Bivariate plots between dissolved elements in the EUG groundwater (A) Calcite; (B) Magnesite; (C) Dolomite; (D) Gypsum; (E) Epsomite; (F) Halite.
Figure 17.
Relation between Deuterium and Oxygene-18 contents in groundwater samples in the study area. GMWL: global meteoric water line.
Figure 17.
Relation between Deuterium and Oxygene-18 contents in groundwater samples in the study area. GMWL: global meteoric water line.
Figure 18.
Estimation of the recharge altitudes according to the altitudinal gradient of Oxygene-18 content. Equation of the altitudinal gradient derived from [
55].
Figure 18.
Estimation of the recharge altitudes according to the altitudinal gradient of Oxygene-18 content. Equation of the altitudinal gradient derived from [
55].
Figure 19.
Conceptual model of the East Upper Guir hydrogeological system, based on current available knowledge.
Figure 19.
Conceptual model of the East Upper Guir hydrogeological system, based on current available knowledge.
Table 1.
Statistics of annual rainfall at the three meteorological stations in the Eastern Upper Guir area. Location of the stations is given in
Figure 5.
Table 1.
Statistics of annual rainfall at the three meteorological stations in the Eastern Upper Guir area. Location of the stations is given in
Figure 5.
| Station | Aït Haddou | Tit N’Aissa | Bouanane |
|---|
| Altitude (m) | 1502 | 1140 | 860 |
| Number of years | 47 | 40 | 58 |
| Minimum (mm) | 23 | 44 | 33 |
| Average (mm). | 163 | 141 | 120 |
| Sdt deviation (mm) | 85 | 74 | 62 |
| Maximum (mm) | 367 | 324 | 272 |
Table 2.
Descriptive statistics of the hydrochemical data. EUG: Eastern Upper Guir; C1–C4: sub-basins; EC: electrical conductivity; SD: standard deviation; CV: coefficient of variation.
Table 2.
Descriptive statistics of the hydrochemical data. EUG: Eastern Upper Guir; C1–C4: sub-basins; EC: electrical conductivity; SD: standard deviation; CV: coefficient of variation.
| | | T °C | pH | EC | Ca2+ | Mg2+ | Na+ | K+ | HCO3− | Cl− | SO42− | NO3− |
|---|
| | | | | µS cm−1 | mg L−1 | mg L−1 | mg L−1 | mg L−1 | mg L−1 | mg L−1 | mg L−1 | mg L−1 |
|---|
| Maximum | EUG | 33.0 | 8.4 | 7394 | 511 | 437 | 2599 | 85 | 506 | 5140 | 2784 | 43 |
| C1 | 26.8 | 8.1 | 7394 | 511 | 437 | 2599 | 53 | 390 | 5140 | 2784 | 19 |
| C2 | 28.0 | 8.2 | 2490 | 381 | 89 | 296 | 85 | 506 | 443 | 984 | 43 |
| C3 | 33.0 | 8.0 | 2340 | 224 | 91 | 315 | 33 | 348 | 489 | 878 | 19 |
| C4 | 26.0 | 8.4 | 5478 | 505 | 207 | 598 | 8 | 305 | 1391 | 1320 | 12 |
| Minimum | EUG | 14.0 | 6.5 | 405 | 20 | 5 | 5 | 0 | 24 | 11 | 0 | 6 |
| C1 | 14.0 | 6.5 | 481 | 30 | 7 | 5 | 0 | 92 | 21 | 0 | 12 |
| C2 | 16.2 | 6.7 | 405 | 26 | 5 | 9 | 0 | 61 | 11 | 0 | 6 |
| C3 | 15.0 | 7.3 | 409 | 38 | 7 | 6 | 0 | 110 | 18 | 34 | 6 |
| C4 | 17.7 | 7.1 | 846 | 20 | 9 | 32 | 0 | 24 | 28 | 154 | 6 |
| Average | EUG | 20.5 | 7.6 | 1401 | 98 | 79 | 100 | 8 | 248 | 159 | 357 | 15 |
| C1 | 18.8 | 7.5 | 1861 | 115 | 130 | 135 | 8 | 249 | 232 | 569 | 17 |
| C2 | 21.1 | 7.7 | 898 | 72 | 39 | 55 | 10 | 262 | 74 | 150 | 18 |
| C3 | 22.6 | 7.7 | 1166 | 97 | 51 | 76 | 8 | 231 | 107 | 286 | 12 |
| C4 | 22.4 | 7.9 | 2398 | 156 | 81 | 245 | 5 | 202 | 403 | 487 | 9 |
| S.D. | EUG | 2.9 | 0.3 | 1063 | 80 | 76 | 219 | 10 | 69 | 420 | 442 | 9 |
| C1 | 2.1 | 0.4 | 1296 | 98 | 95 | 326 | 8 | 71 | 625 | 596 | 4 |
| C2 | 2.0 | 0.2 | 427 | 45 | 17 | 57 | 13 | 66 | 83 | 143 | 13 |
| C3 | 3.6 | 0.2 | 508 | 53 | 22 | 66 | 9 | 60 | 102 | 180 | 6 |
| C4 | 2.7 | 0.4 | 1667 | 142 | 66 | 226 | 2 | 79 | 496 | 421 | 4 |
| C.V. (%) | EUG | 14.1 | 3.9 | 76 | 82 | 96 | 219 | 125 | 28 | 264 | 124 | 64 |
| C1 | 11.2 | 5.3 | 70 | 85 | 73 | 241 | 100 | 29 | 269 | 105 | 22 |
| C2 | 9.5 | 2.6 | 48 | 63 | 44 | 104 | 130 | 25 | 112 | 95 | 74 |
| C3 | 15.9 | 2.6 | 44 | 55 | 43 | 87 | 113 | 26 | 95 | 63 | 50 |
| C4 | 12.1 | 5.1 | 70 | 91 | 81 | 92 | 46 | 39 | 123 | 86 | 38 |
Table 3.
Factor analysis results. Factor loadings and explained variance. High loadings (|Loading| > 0.7) are in bold.
Table 3.
Factor analysis results. Factor loadings and explained variance. High loadings (|Loading| > 0.7) are in bold.
| | Factor 1 | Factor 2 | Factor 3 |
|---|
| Temperature | 0.099 | 0.565 | 0.647 |
| pH | 0.420 | 0.332 | 0.136 |
| EC | −0.979 | 0.114 | −0.079 |
| Ca2+ | −0.801 | −0.132 | 0.297 |
| Mg2+ | −0.802 | −0.384 | −0.103 |
| Na+ | −0.761 | 0.557 | −0.200 |
| K+ | −0.113 | −0.133 | 0.505 |
| HCO3− | 0.416 | 0.066 | −0.435 |
| Cl− | −0.731 | 0.552 | −0.257 |
| SO42− | −0.887 | −0.325 | 0.163 |
| Eigenvalue | 4.517 | 1.351 | 1.120 |
| Explained Variance (%) | 45 | 14 | 11 |
| Cumulative Variance % | 45 | 59 | 70 |
Table 4.
Statistics of the chloro-alcaline indices.
Table 4.
Statistics of the chloro-alcaline indices.
| | | CA1 | | | CA2 | |
|---|
| | Minimum | Maximum | Average | Minimum | Maximum | Average |
|---|
| C1 | −2.38 | 0.67 | −0.13 | −0.34 | 1.99 | 0.06 |
| C2 | −4.28 | 0.49 | −0.48 | −0.76 | 0.16 | −0.07 |
| C3 | −5.74 | 0.56 | −0.40 | −0.57 | 0.10 | −0.05 |
| C4 | −2.41 | 0.34 | −0.34 | −1.02 | 0.90 | −0.03 |
Table 5.
Groundwater stable isotope data.
Table 5.
Groundwater stable isotope data.
| Water point | Code | X | Y | Z | δ18O (‰) | δ2H (‰) | 3H (TU) |
|---|
| Well | E1 | 651,118 | 205,398 | 1361 | −7.62 | −50.82 | 4.2 ± 0.5 |
| HDG | E2 | 715,293 | 233,023 | 1187 | −6.80 | −45.82 | - |
| Spring | E3 | 715,681 | 234,470 | 1213 | −8.47 | −60.98 | ≤0.3 |
| Spring | E4 | 679,984 | 220,048 | 1398 | −7.46 | −51.55 | 3.8 ± 0.4 |
| Well | E5 | 684,445 | 193,716 | 1101 | −8.24 | −57.07 | ≤0.6 |
| HDG | E6 | 682,899 | 189,988 | 1091 | −6.67 | −45.83 | 2.4 ± 0.4 |
| Well | E7 | 712,304 | 170,034 | 944 | −9.14 | −65.21 | ≤0.6 |
| Spring | E8 | 722,949 | 168,283 | 878 | −8.21 | −56.61 | ≤0.6 |
Table 6.
Groundwater samples of the EUG basin below the permissible limits prescribed by WHO. For drinking purposes.
Table 6.
Groundwater samples of the EUG basin below the permissible limits prescribed by WHO. For drinking purposes.
| Parameters | WHO Standards | C1 | C2 | C3 | C4 | EUG |
|---|
| pH | ≤9.2 | 100% | 100% | 100% | 100% | 100% |
| TH (mg L−1) | ≤500 | 34% | 91% | 71% | 56% | 63% |
| Na (mg L−1) | ≤200 | 90% | 94% | 94% | 56% | 91% |
| Ca (mg L−1) | ≤200 | 89% | 98% | 94% | 89% | 94% |
| Mg (mg L−1) | ≤150 | 60% | 100% | 100% | 78% | 83% |
| Cl (mg L−1) | ≤600 | 93% | 100% | 100% | 93% | 96% |
| SO4 (mg L−1) | ≤500 | 60% | 99% | 89% | 56% | 79% |
| NO3 (mg L−1) | ≤50 | 100% | 100% | 100% | 100% | 100% |
Table 7.
Classification of the SAR (Sodium Adsorption Ratio) index and water suitability for irrigation.
Table 7.
Classification of the SAR (Sodium Adsorption Ratio) index and water suitability for irrigation.
| SAR | Suitability for Irrigation |
|---|
| 1–10 | Suitable for all types of crops and soil except for crops sensitive to sodium |
| 11–18 | Suitable for coarsed textured or organic soil with permeability |
| 19–26 | Harmful for almost all soil |
| >26 | Unsuitable for irrigation |
Table 8.
Distribution of the SAR (Sodium Adsorption Ratio) within the 4 sub-basins. N: number of samples.
Table 8.
Distribution of the SAR (Sodium Adsorption Ratio) within the 4 sub-basins. N: number of samples.
| SAR | C1 | C2 | C3 | C4 | EUG |
|---|
| N | % | N | % | N | % | N | % | N | % |
|---|
| 1–10 | 52 | 72 | 62 | 92 | 27 | 77 | 5 | 56 | 146 | 80 |
| 11–18 | 9 | 13 | 3 | 4 | 6 | 17 | 0 | 0 | 18 | 10 |
| 19–26 | 5 | 7 | 3 | 4 | 2 | 6 | 0 | 0 | 10 | 5 |
| >26 | 6 | 8 | 0 | 0 | 0 | 0 | 4 | 44 | 10 | 5 |
© 2020 by the authors. Licensee MDPI, Basel, Switzerland. This article is an open access article distributed under the terms and conditions of the Creative Commons Attribution (CC BY) license (http://creativecommons.org/licenses/by/4.0/).


 ,
, 


