Influence of Climate and Land Use Change on the Groundwater System of the Veluwe, The Netherlands: A Historical and Future Perspective

 , ,
, ,
Abstract
:1. Introduction
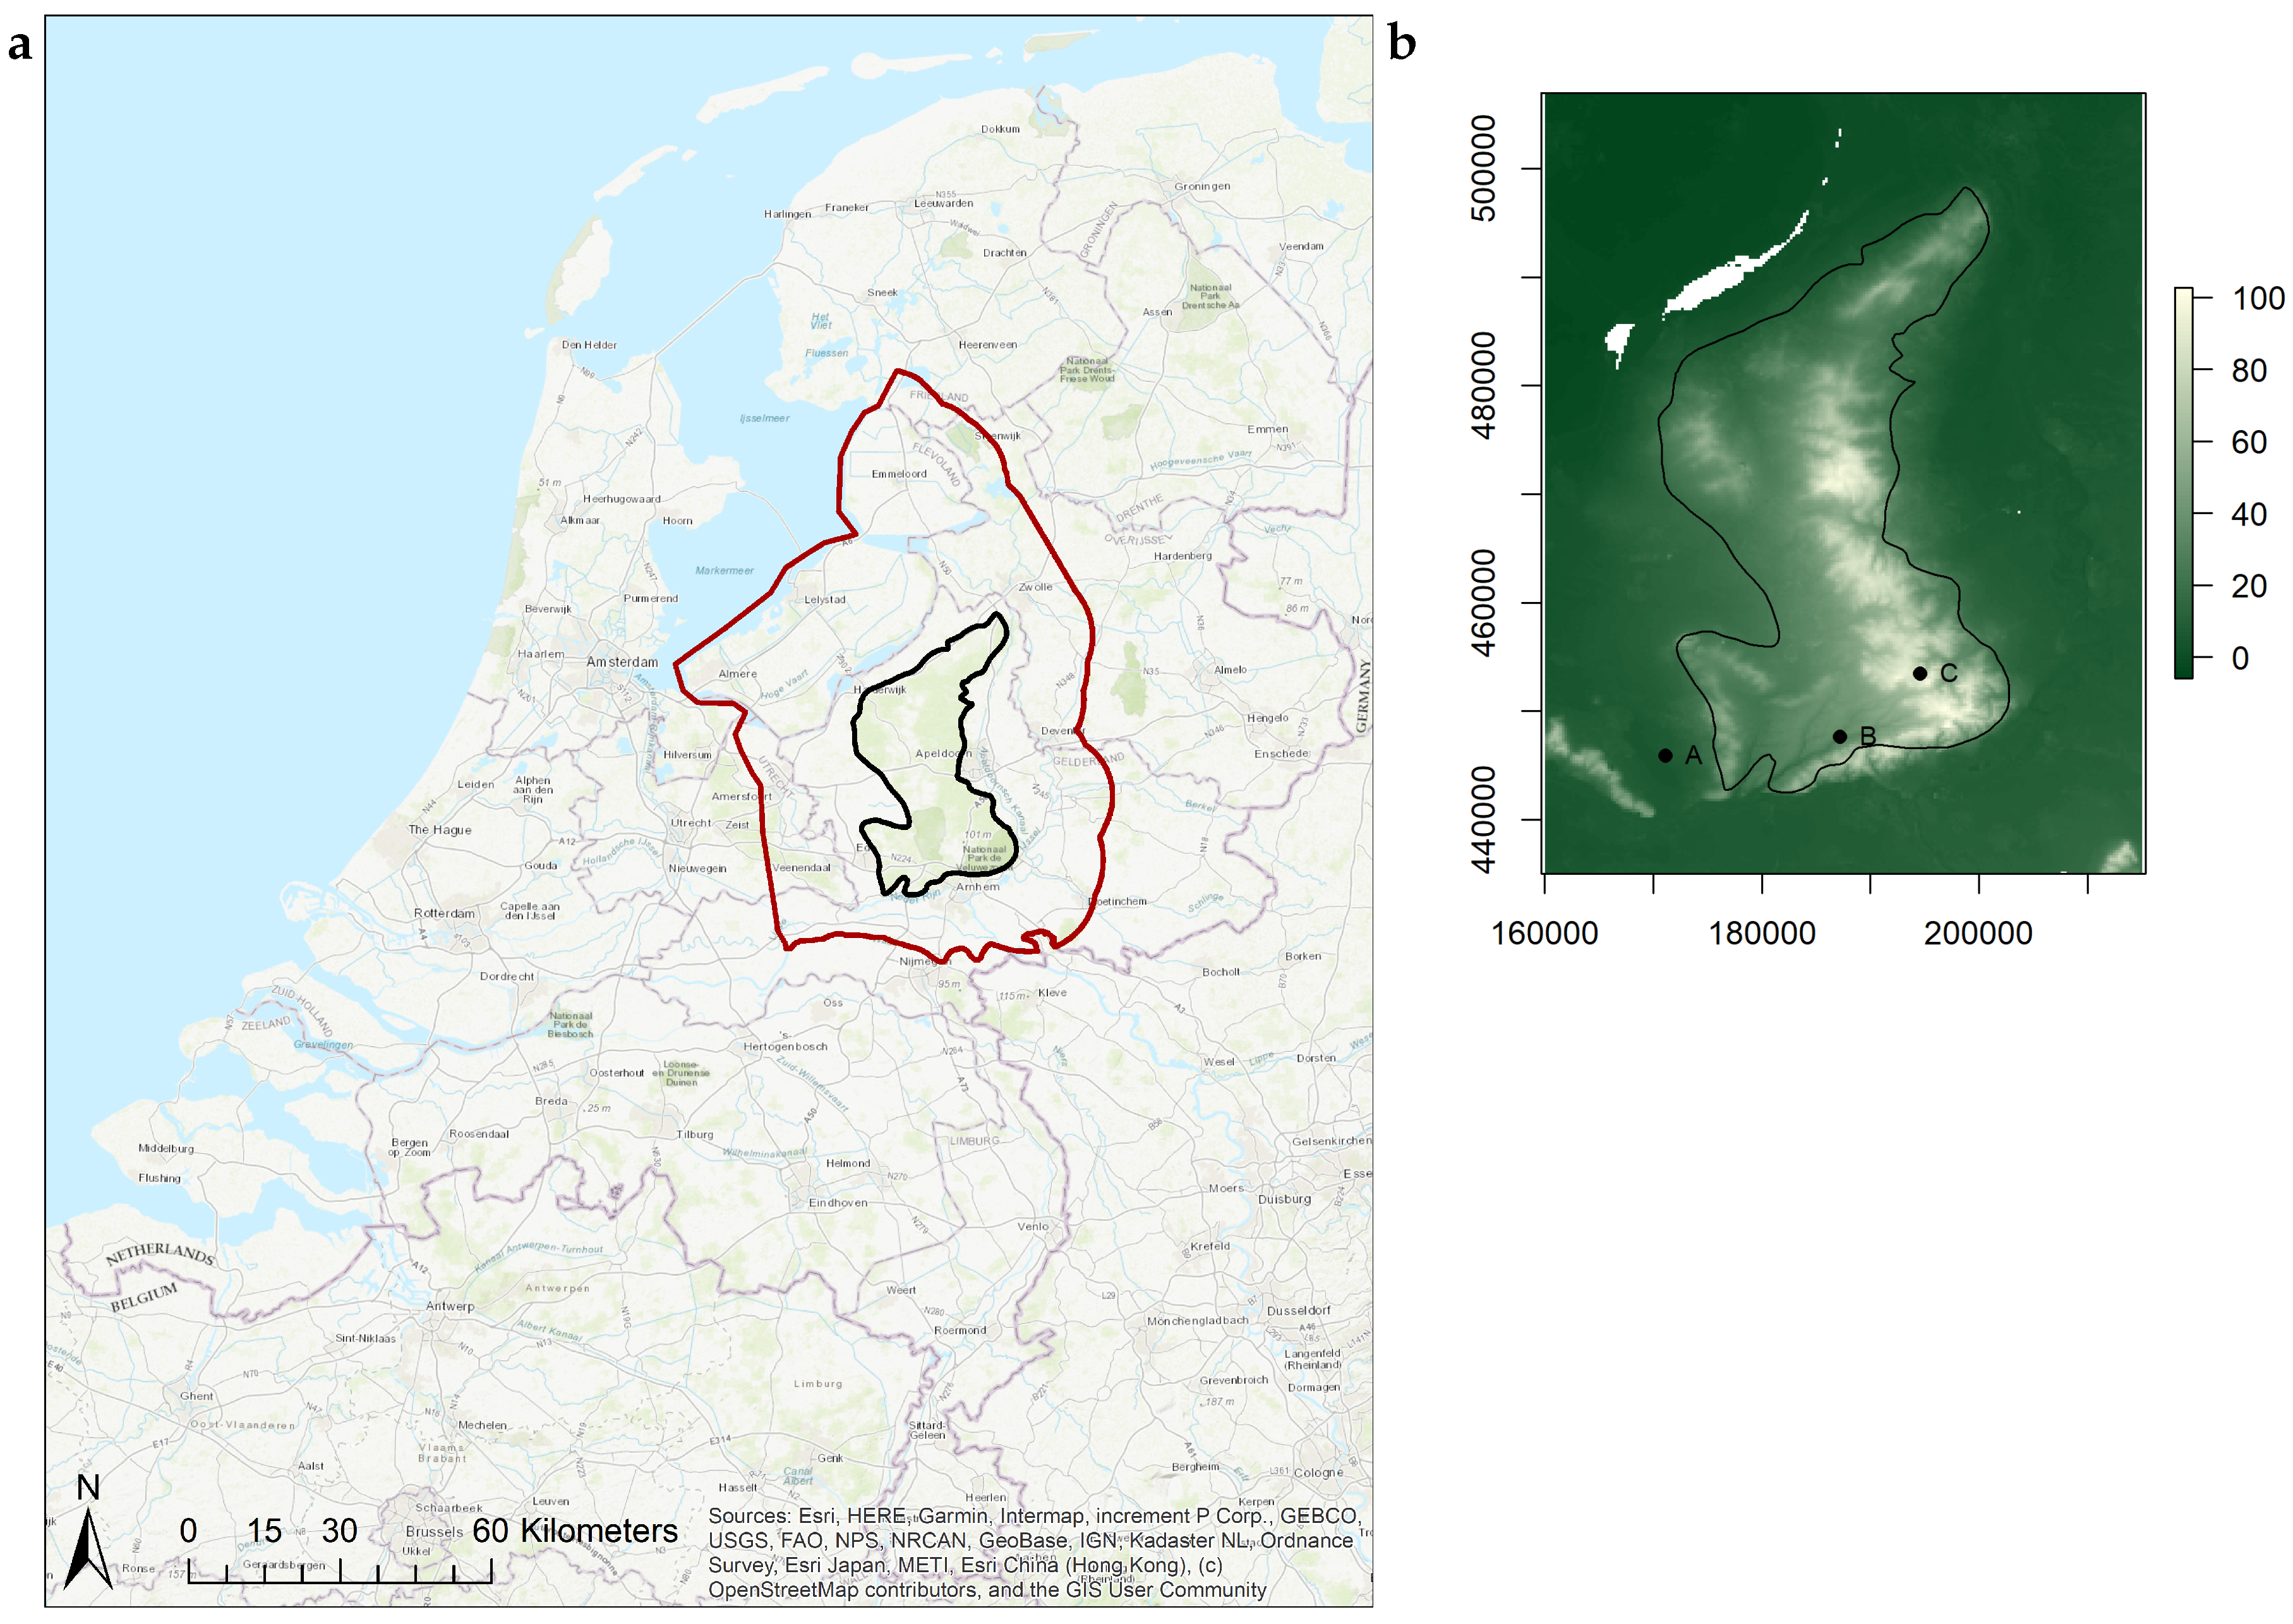
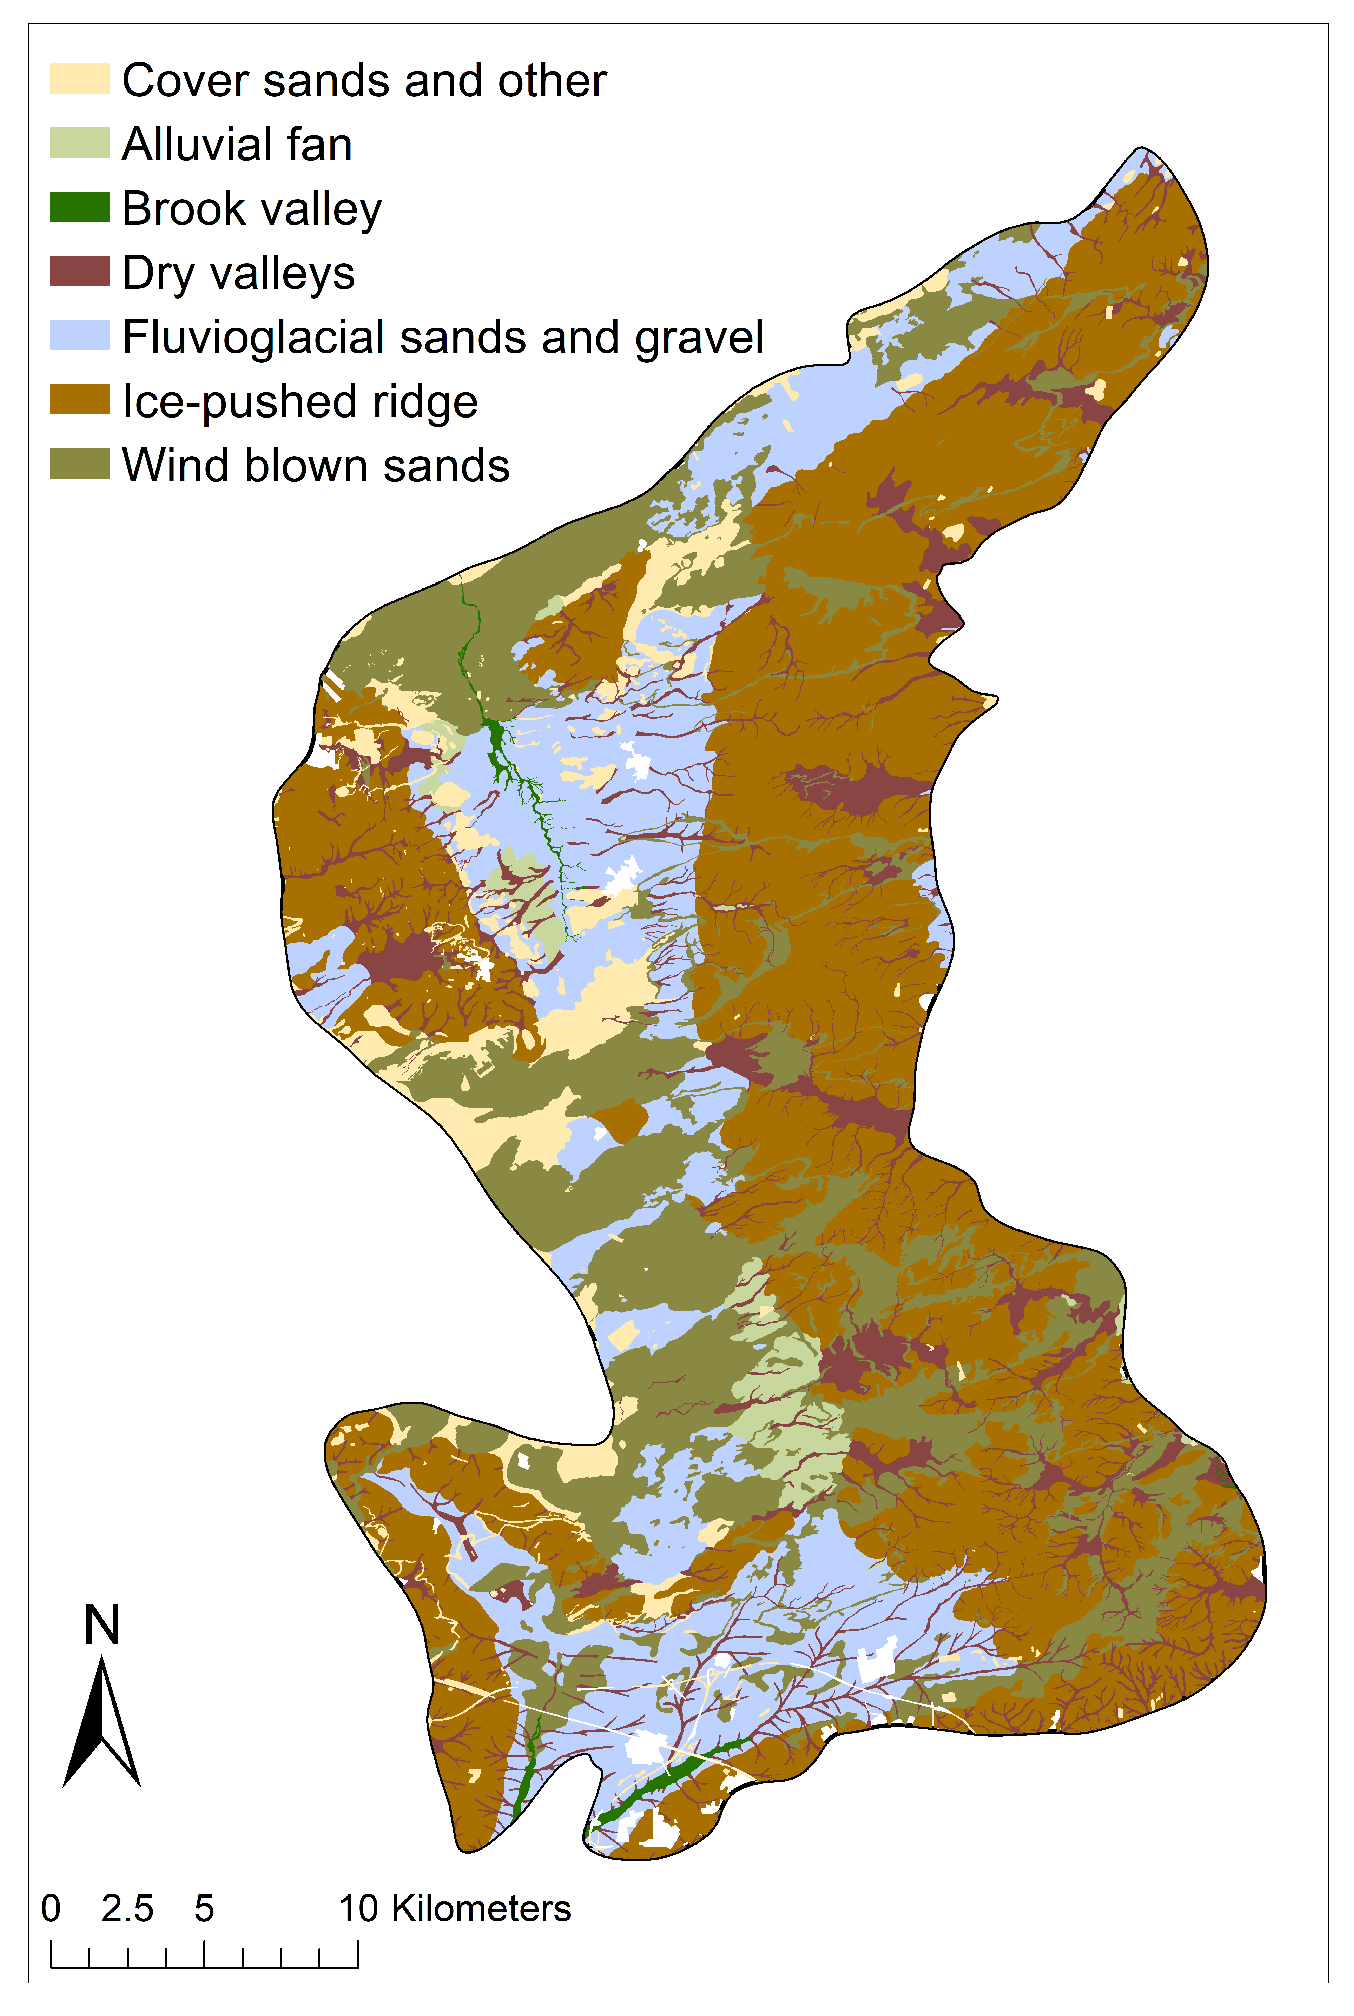
2. Site Description
3. Materials and Methods
3.1. Groundwater Model
3.2. Data
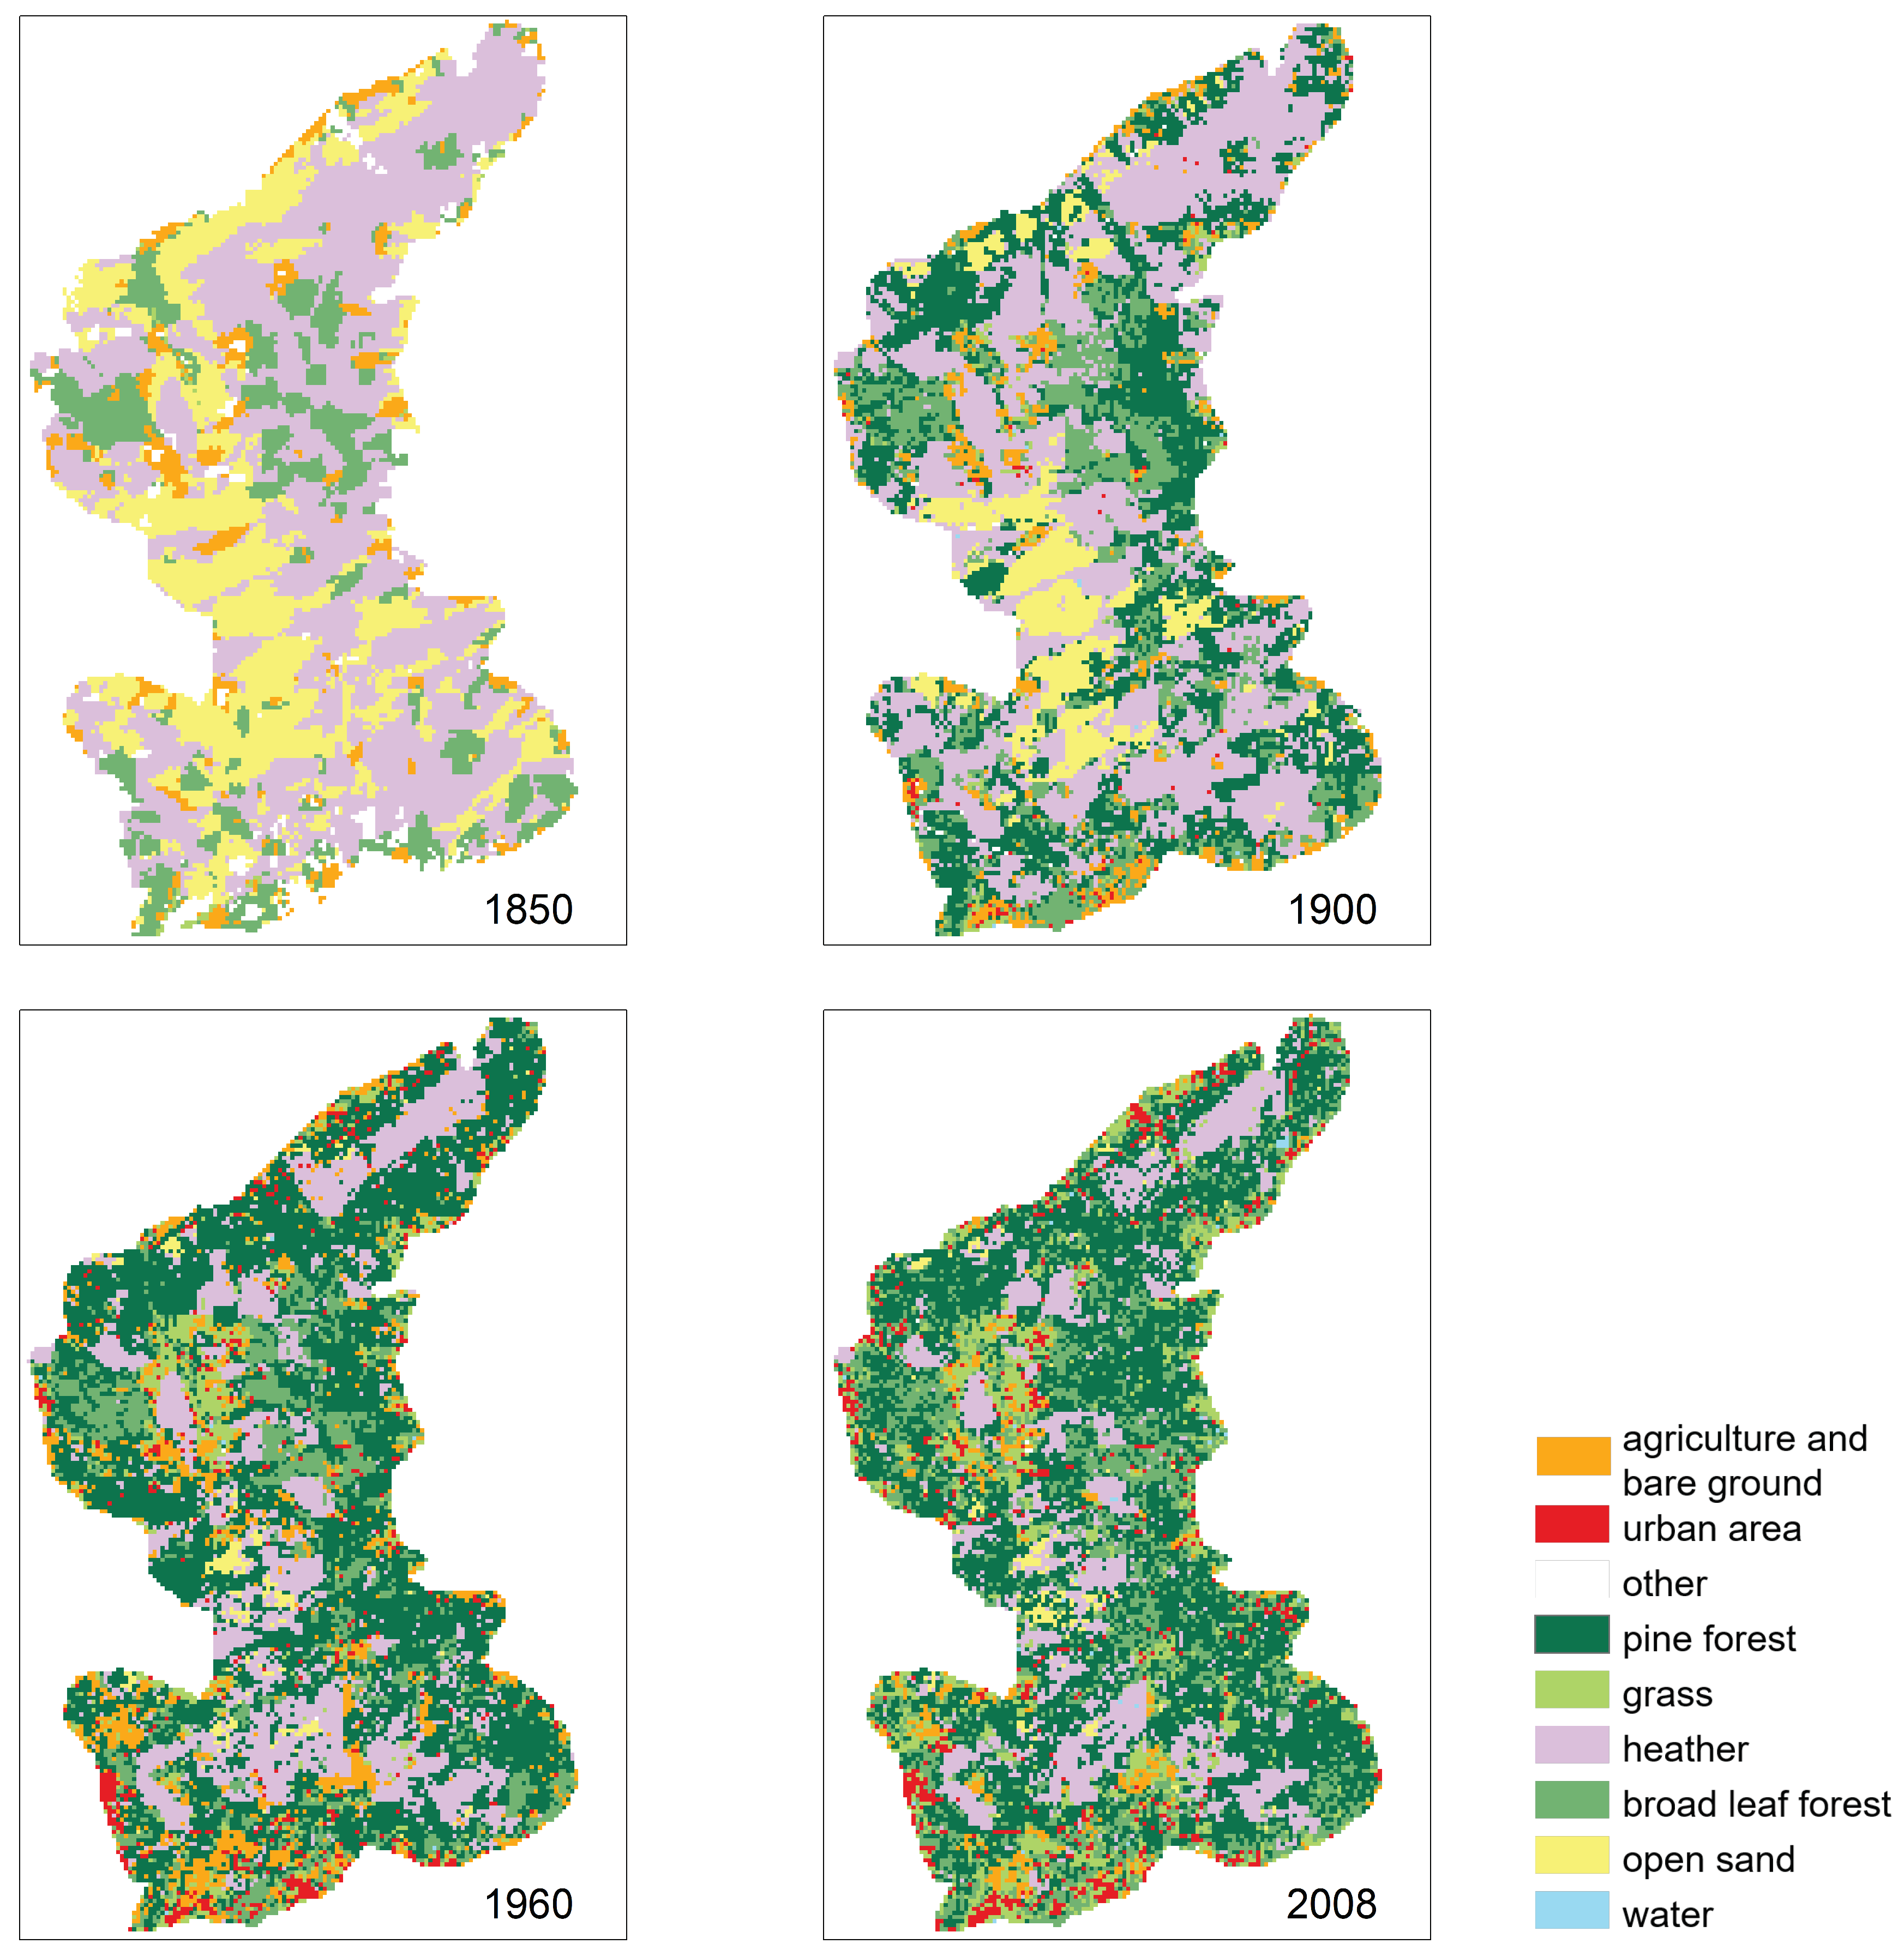
3.2.1. Historical Conditions
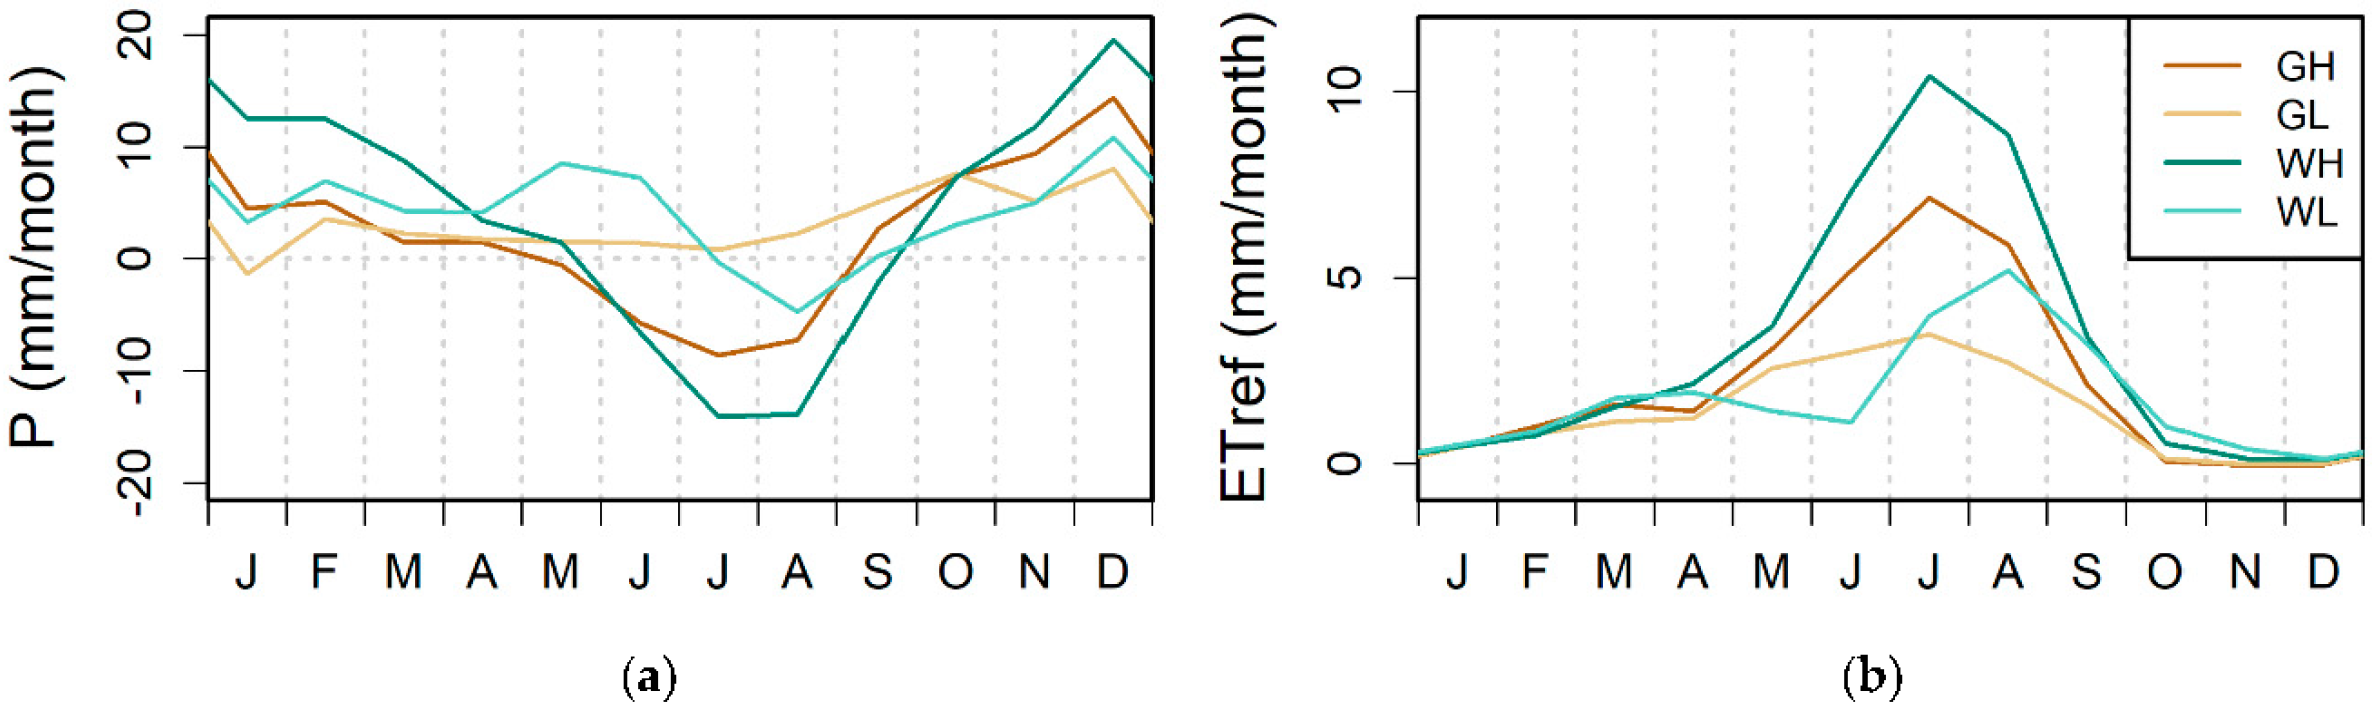
3.2.2. Future
4. Results
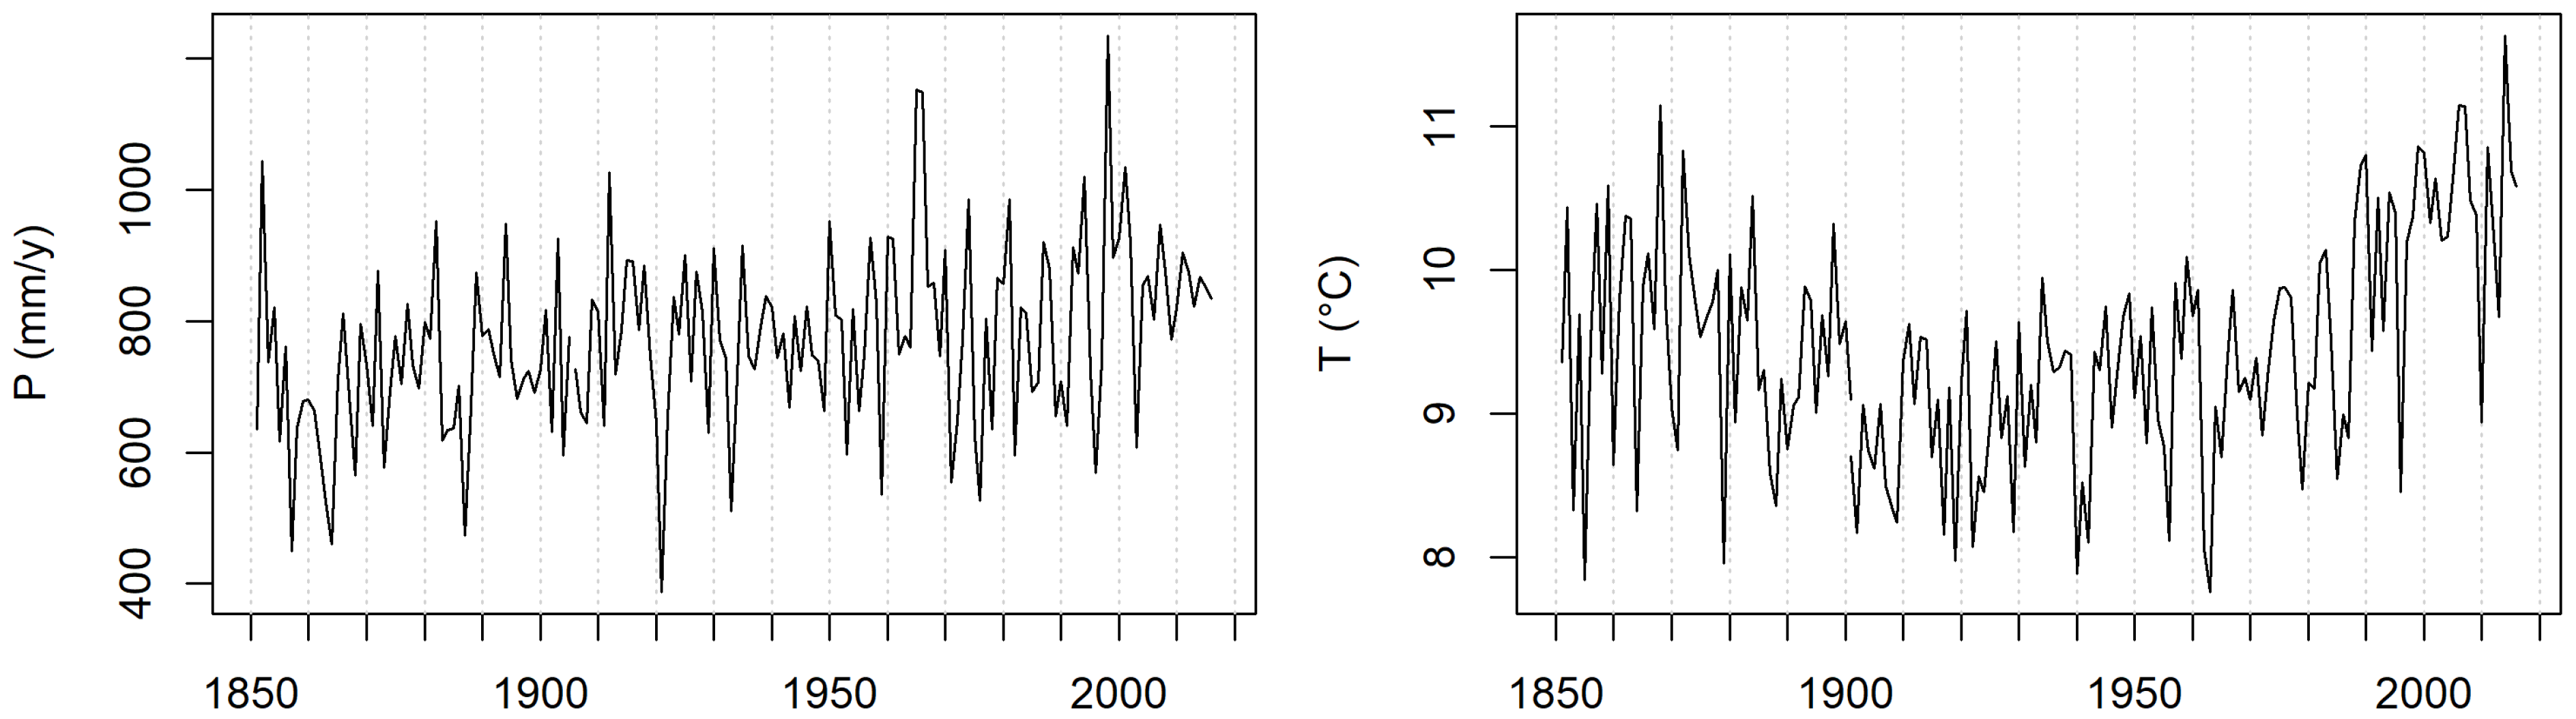
4.1. Analysis Historical Period
4.1.1. Historical Conditions
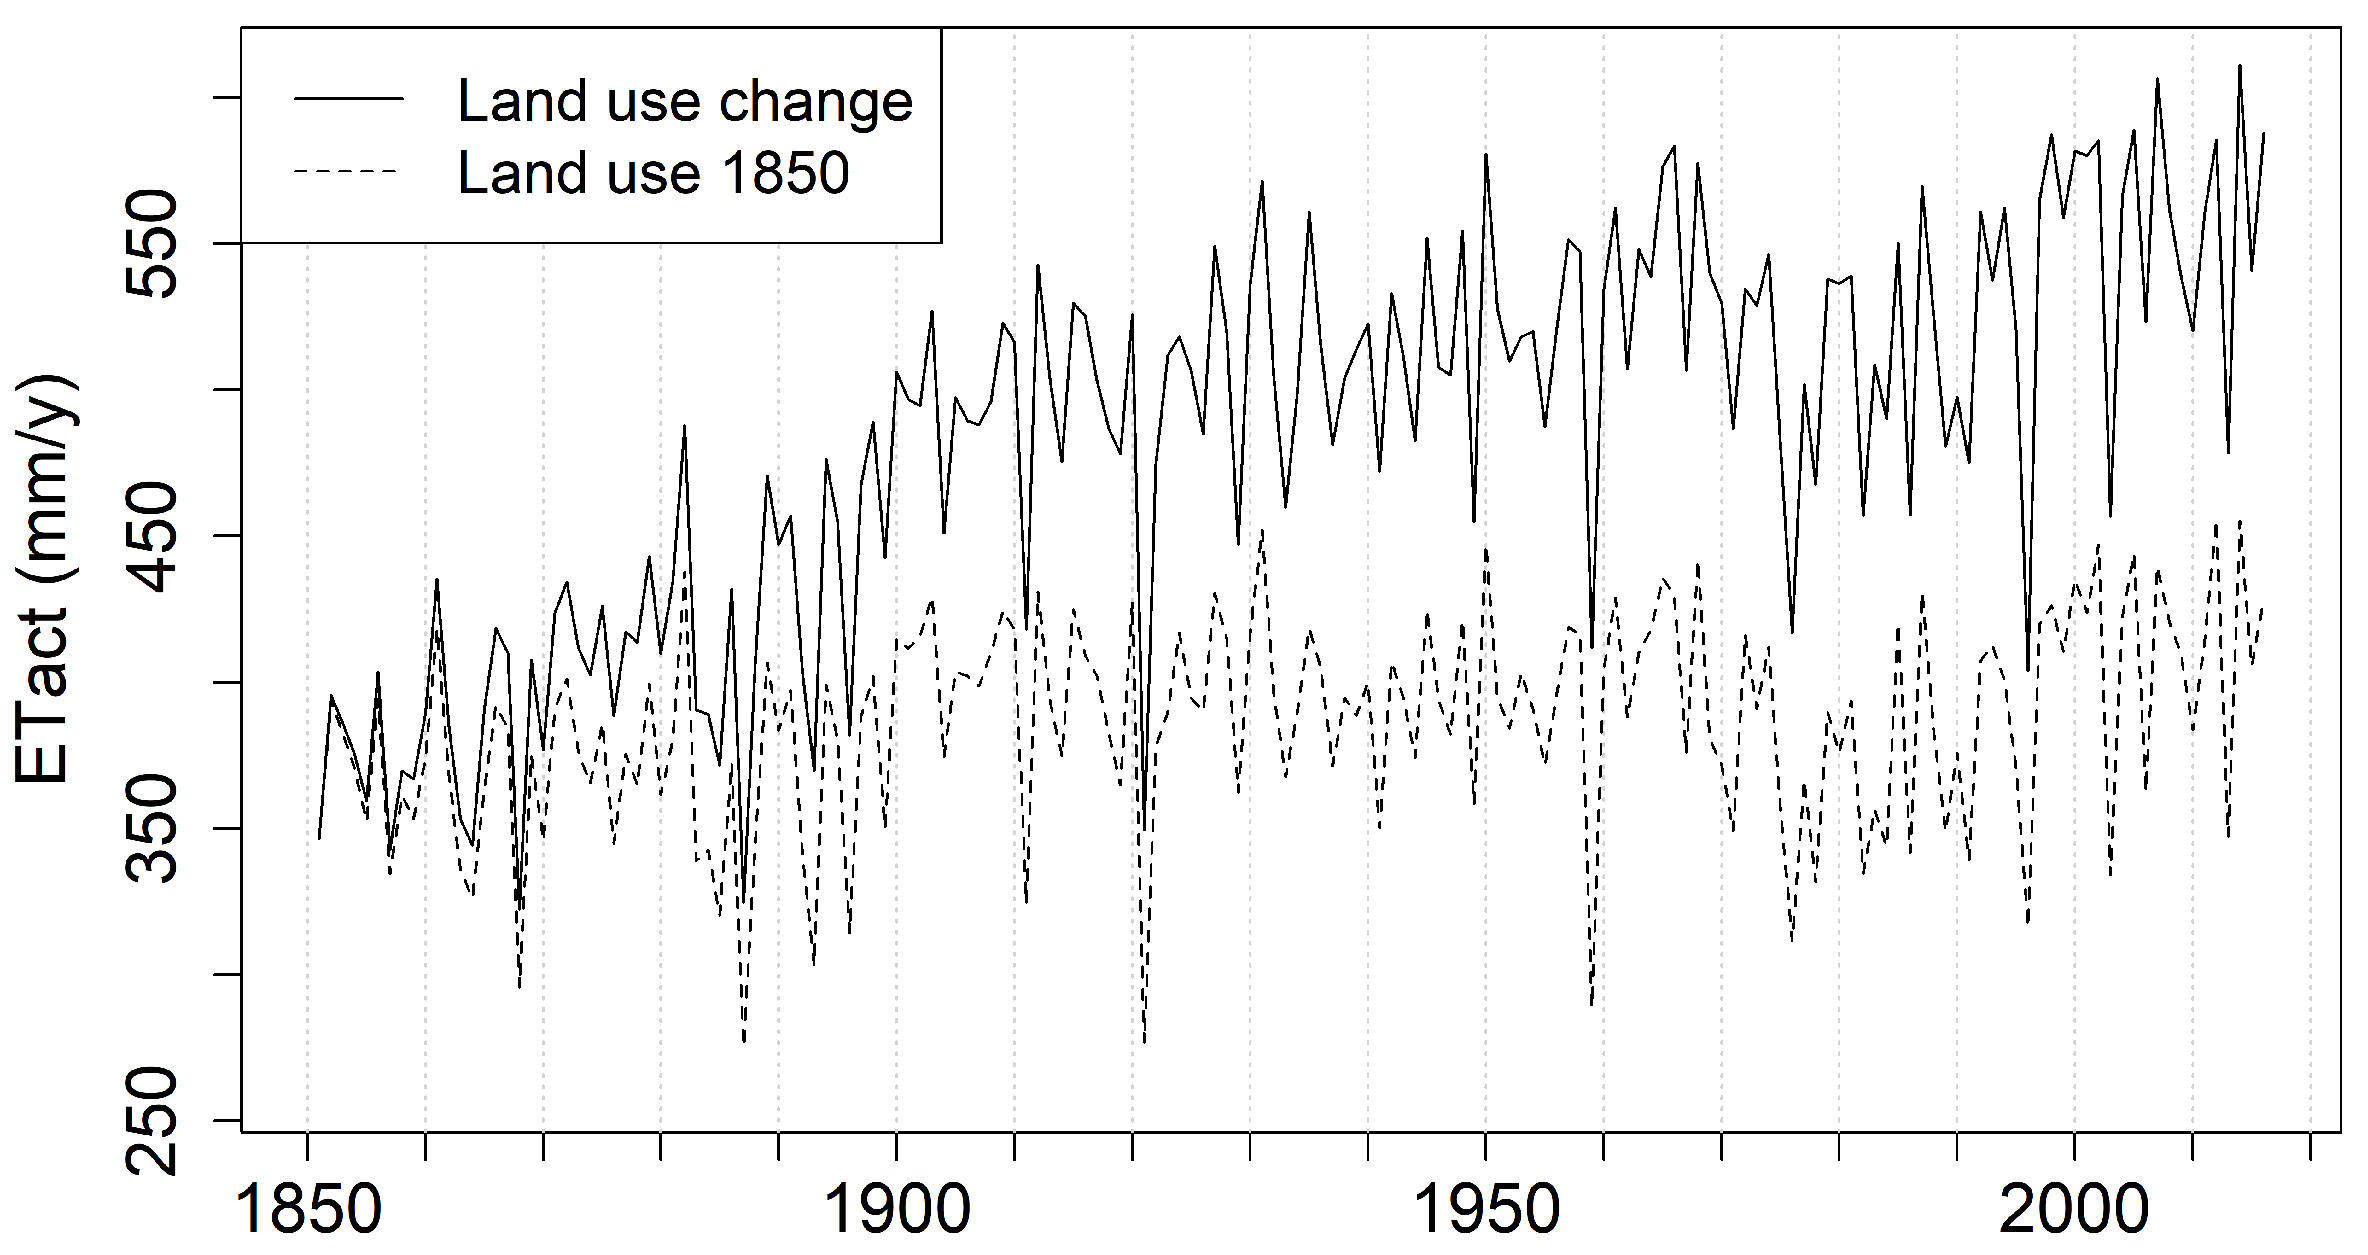
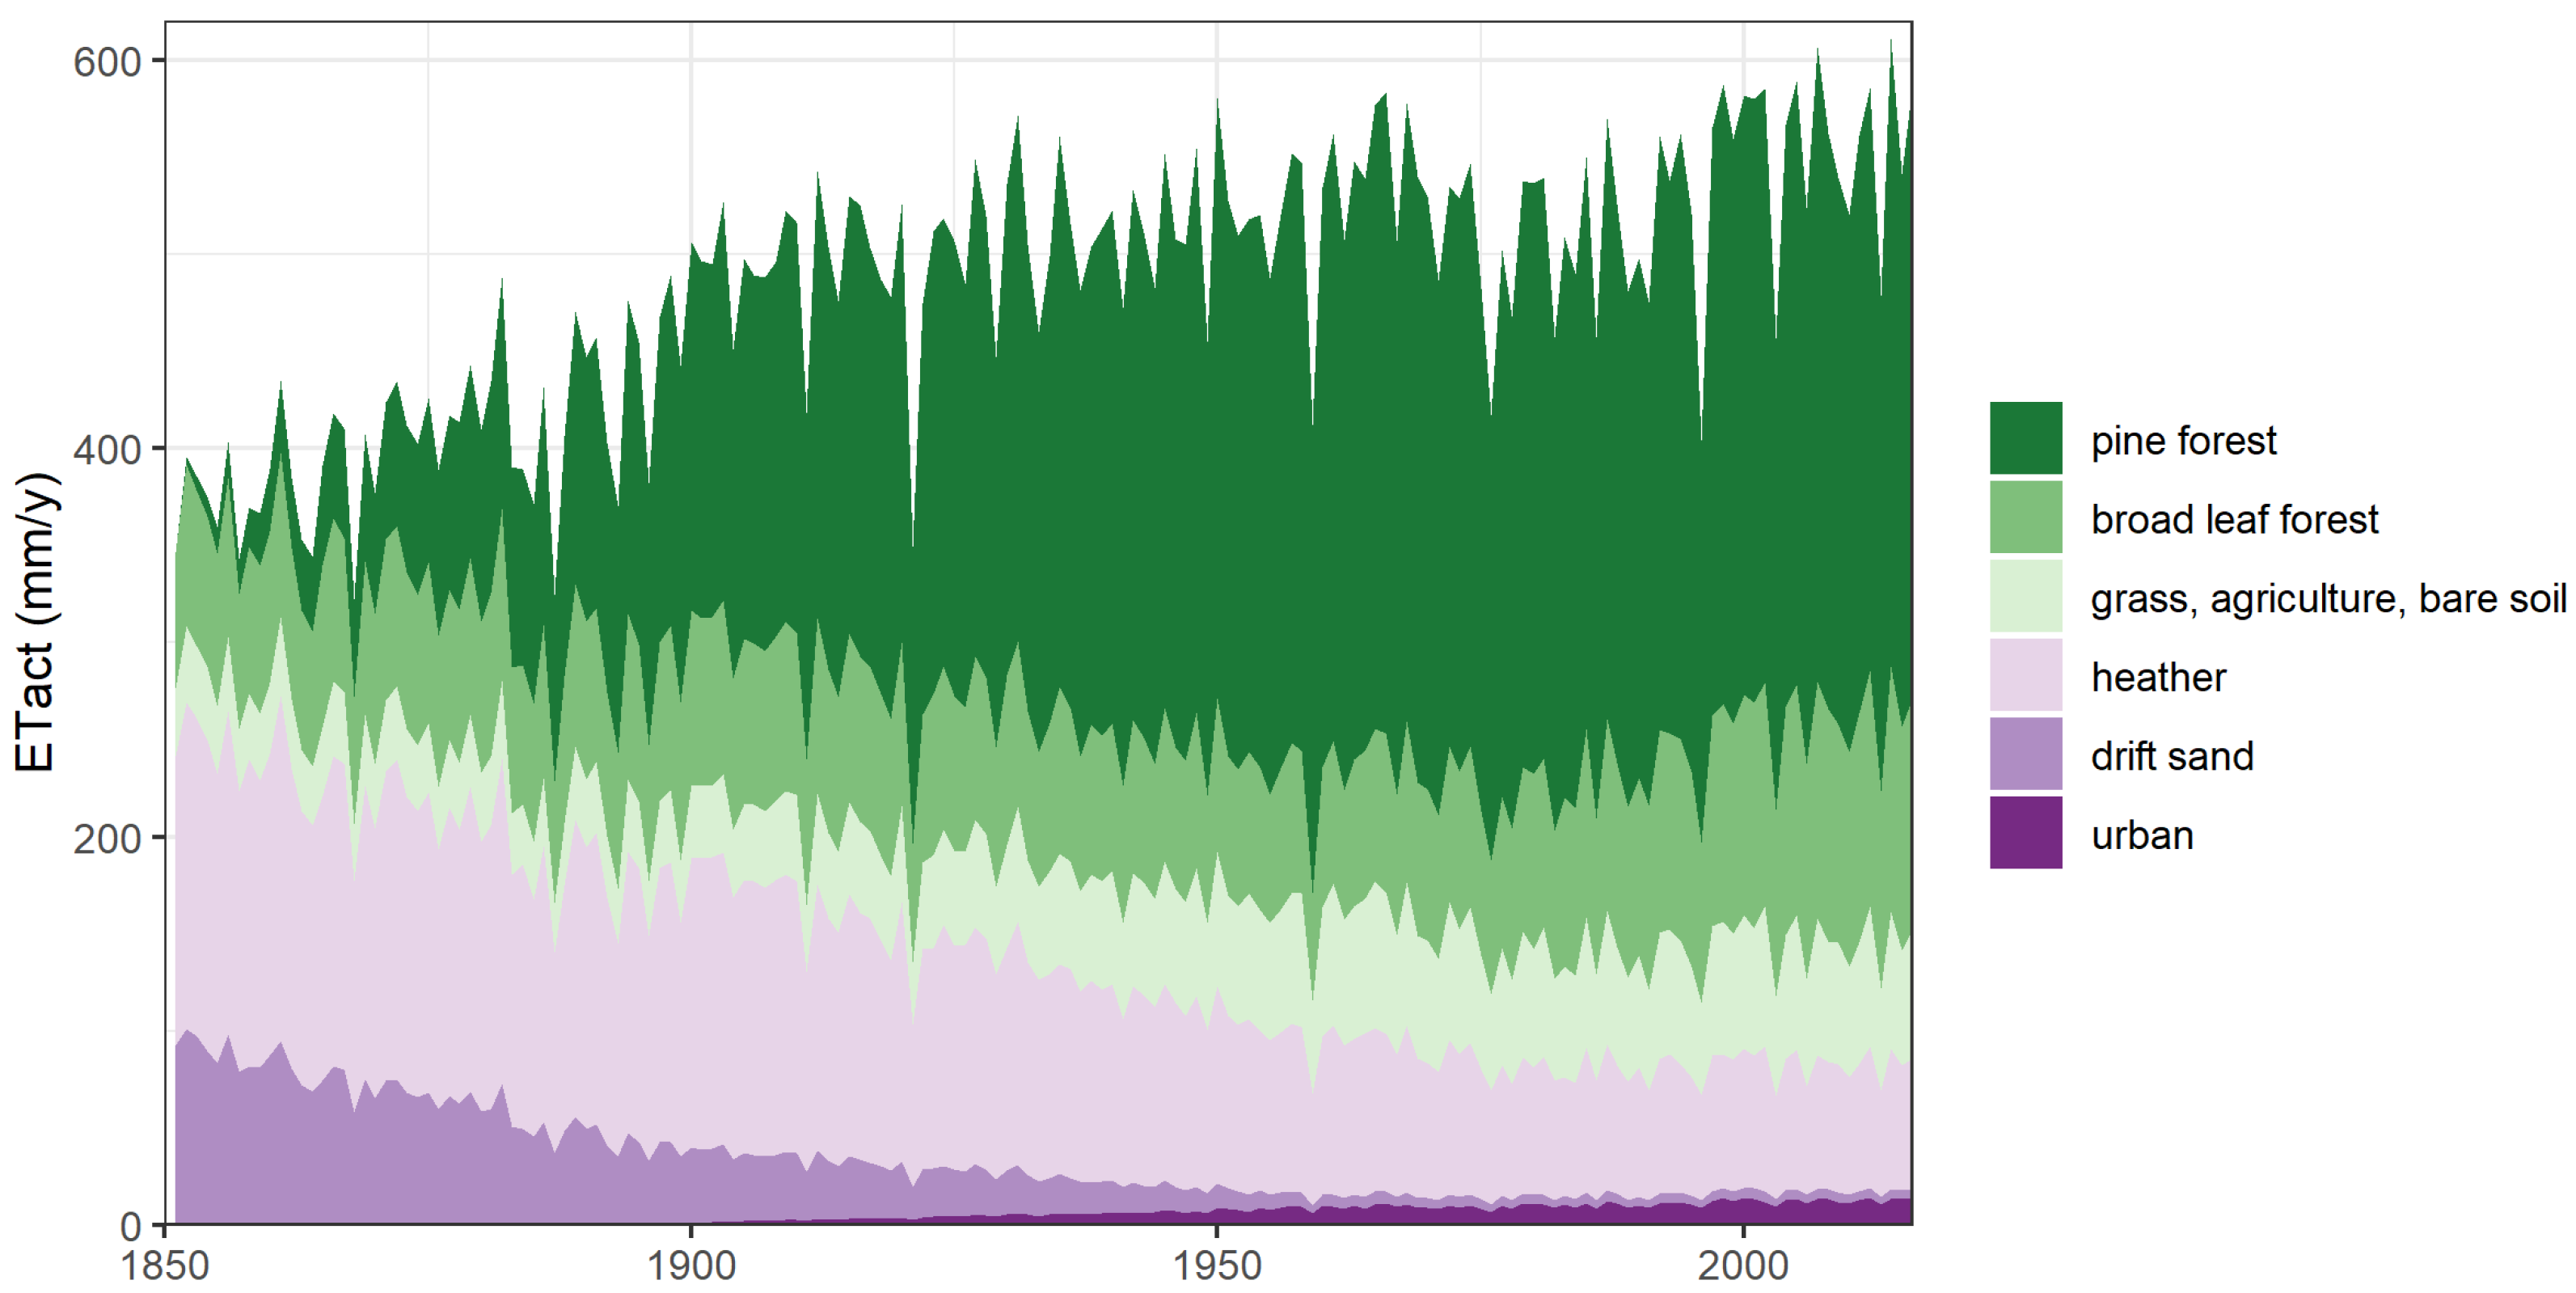
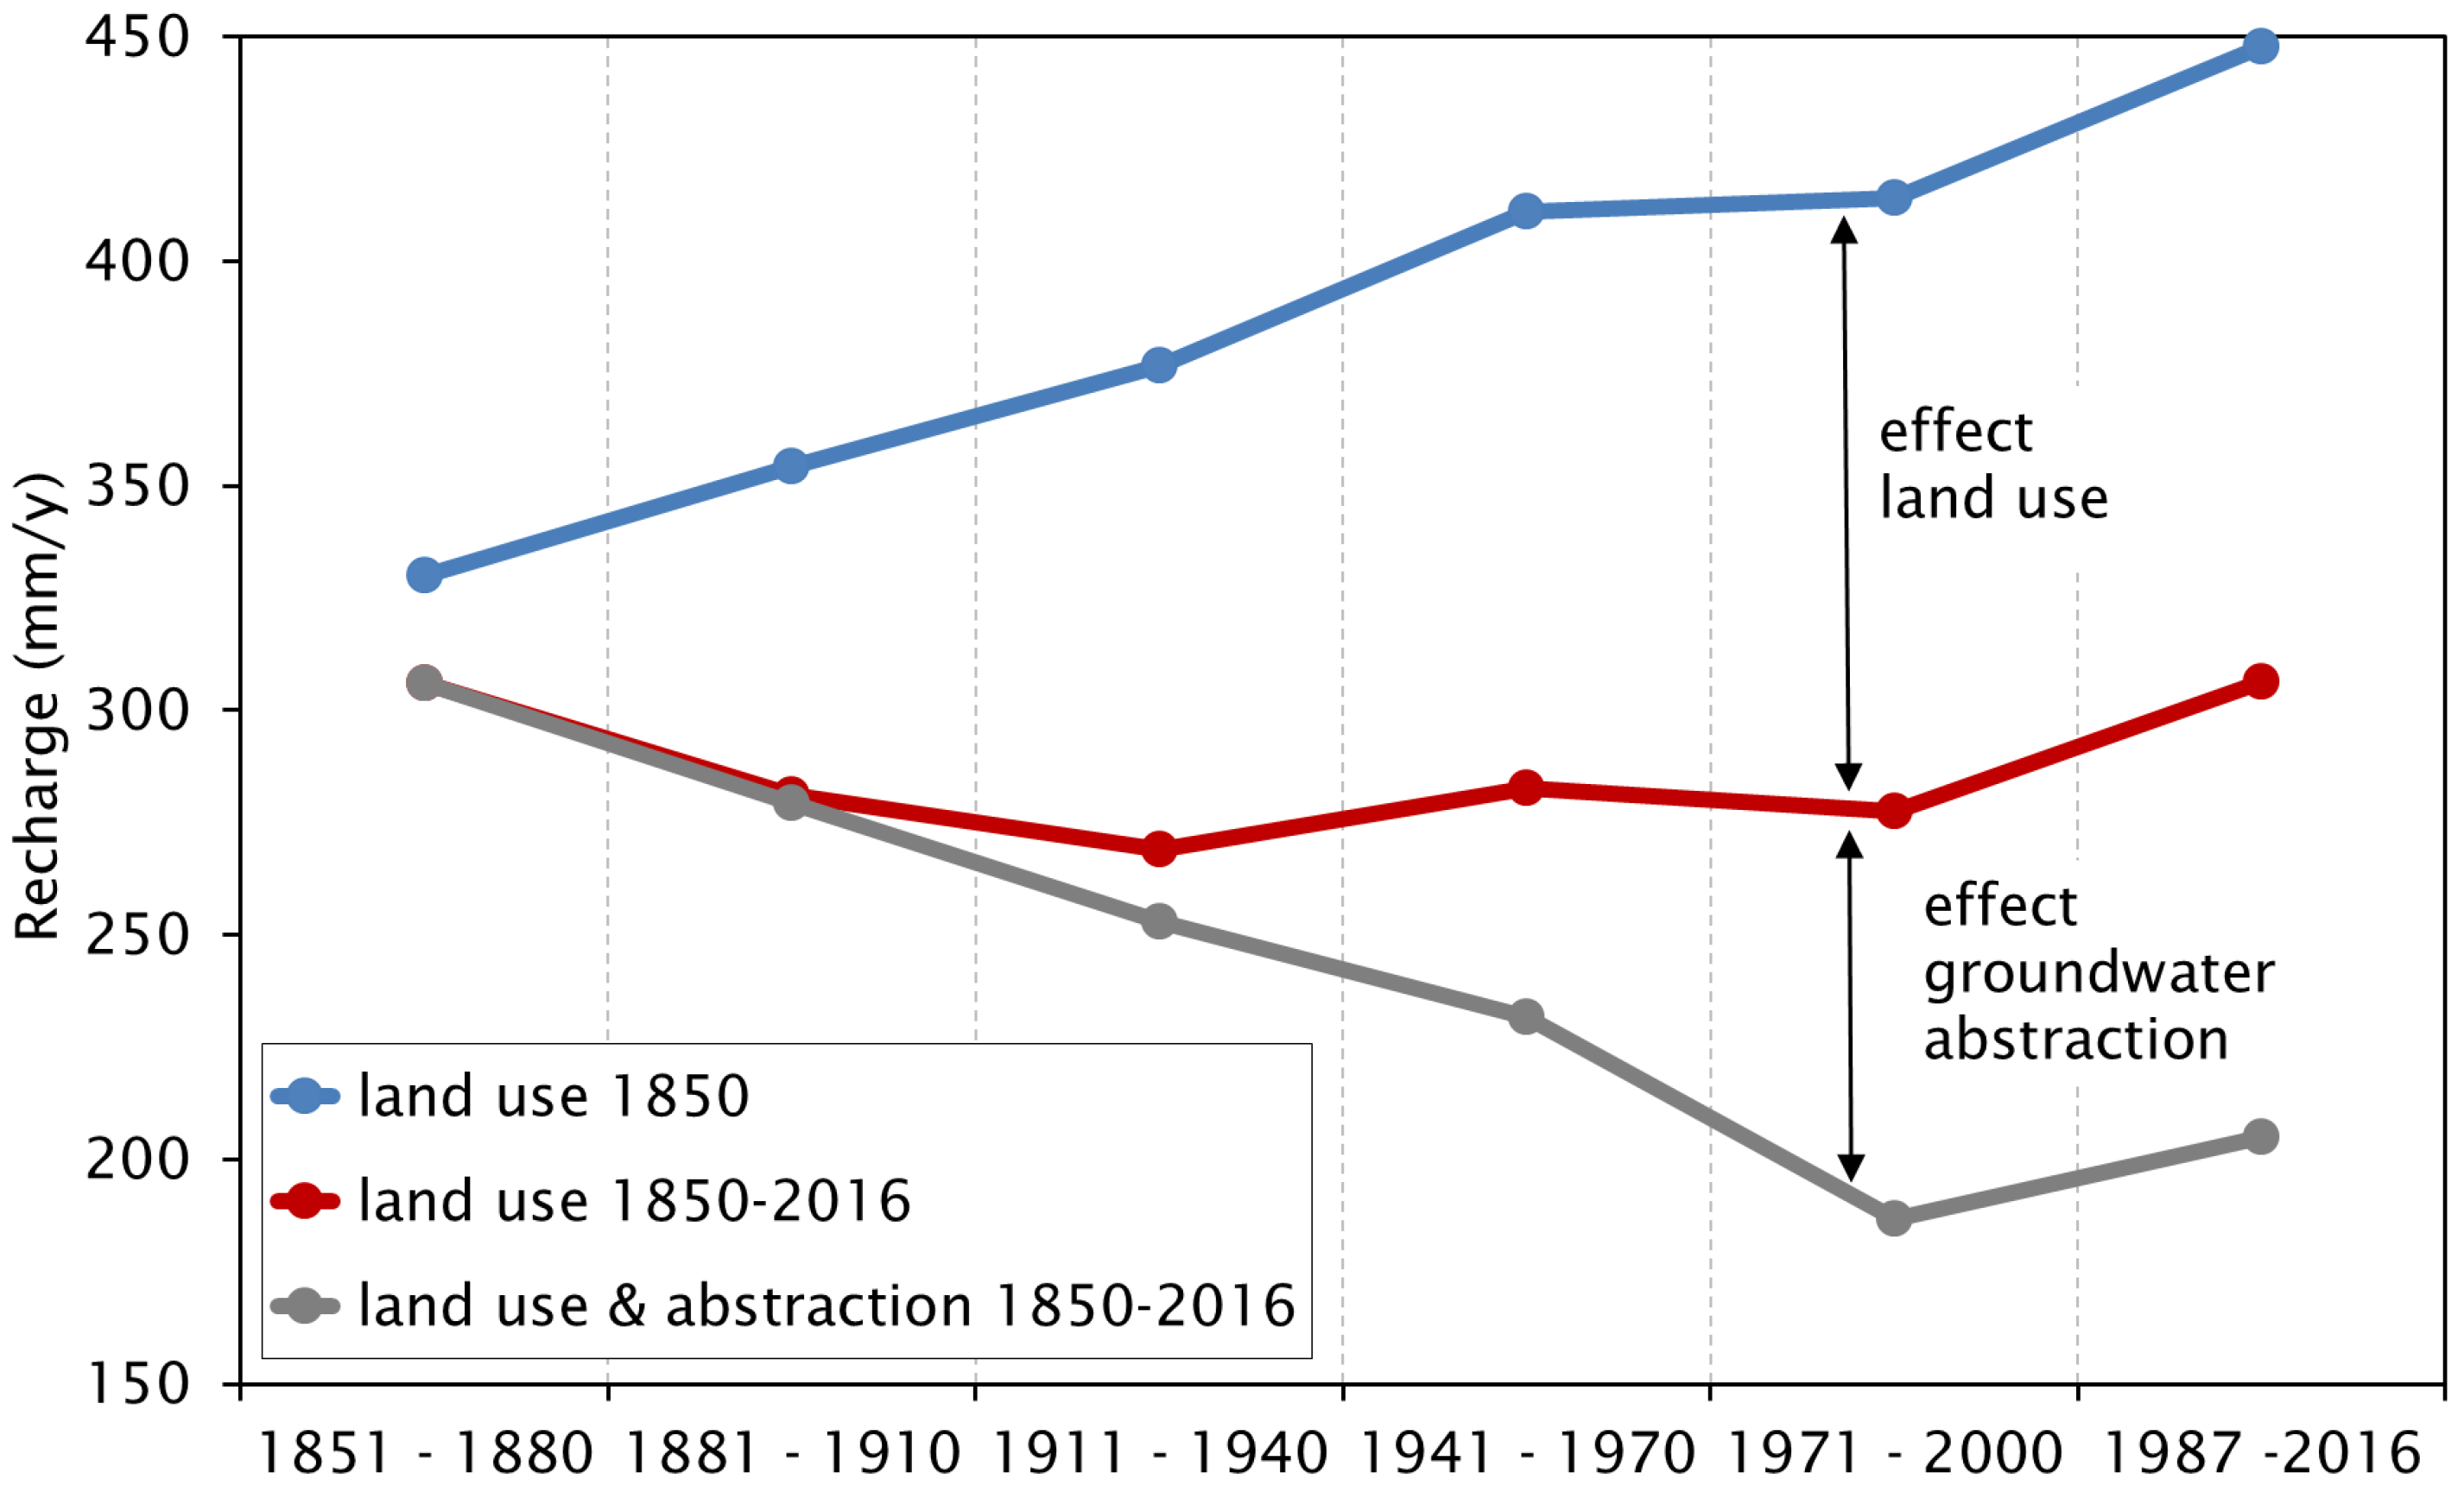
4.1.2. Impact of Changes in Historical Period
4.2. Analysis Future Period
5. Discussion
5.1. Uncertainty Evaporation
5.2. Scenarios for the Future
5.3. Relation to Previous Studies
6. Conclusions
Author Contributions
Funding
Conflicts of Interest
Abbreviations
| ET | reference evaporation |
| ET | actual evaporation (sum of evaporated interception, soil evaporation and transpiration) |
| G | moderate climate scenario with weak response to changes in air circulation patterns |
| G | moderate climate scenario with strong response to changes in air circulation patterns |
| KNMI | Royal Netherlands Meteorological Institute |
| P | precipitation |
| W | warm climate scenario with weak response to changes in air circulation patterns |
| W | warm climate scenario with strong response to changes in air circulation patterns |
References
- Gosling, S.N.; Arnell, N.W. A global assessment of the impact of climate change on water scarcity. Clim. Chang. 2016, 134, 371–385. [Google Scholar] [CrossRef] [Green Version]
- Schewe, J.; Heinke, J.; Gerten, D.; Haddeland, I.; Arnell, N.W.; Clark, D.B.; Dankers, R.; Eisner, S.; Fekete, B.M.; Colón-González, F.J.; et al. Multimodel assessment of water scarcity under climate change. Proc. Natl. Acad. Sci. USA 2014, 111, 3245–3250. [Google Scholar] [CrossRef] [PubMed] [Green Version]
- Witte, J.P.M.; Runhaar, J.; Van Ek, R.; Van Der Hoek, D.C.J.; Bartholomeus, R.P.; Batelaan, O.; van Bodegom, P.M.; Wassen, M.J.; Van der Zee, S.E.A.T.M. An ecohydrological sketch of climate change impacts on water and natural ecosystems for The Netherlands: Bridging the gap between science and society. Hydrol. Earth Syst. Sci. 2012, 16, 3945–3957. [Google Scholar] [CrossRef] [Green Version]
- Kummu, M.; Gerten, D.; Heinke, J.; Konzmann, M.; Varis, O. Climate-driven interannual variability of water scarcity in food production potential: A global analysis. Hydrol. Earth Syst. Sci. 2014, 18, 447–461. [Google Scholar] [CrossRef] [Green Version]
- Van Vliet, M.T.H.; Yearsley, J.R.; Ludwig, F.; Vögele, S.; Lettenmaier, D.P.; Kabat, P. Vulnerability of US and European electricity supply to climate change. Nat. Clim. Chang. 2012, 2, 676–681. [Google Scholar] [CrossRef]
- Delpla, I.; Jung, A.V.; Baures, E.; Clement, M.; Thomas, O. Impacts of climate change on surface water quality in relation to drinking water production. Environ. Int. 2009, 35, 1225–1233. [Google Scholar] [CrossRef]
- Klein Tank, A.; Beersma, J.; Bessembinder, J.; Van den Hurk, B.; Lenderink, G. KNMI’14 Climate Scenarios for The Netherlands; Technical Report; KNMI: De Bilt, The Netherlands, 2014; Available online: http://projects.knmi.nl/publications/showAbstract.php?id=10756 (accessed on 5 October 2020).
- Kløve, B.; Ala-Aho, P.; Bertrand, G.; Gurdak, J.J.; Kupfersberger, H.; Kværner, J.; Muotka, T.; Mykrä, H.; Preda, E.; Rossi, P.; et al. Climate change impacts on groundwater and dependent ecosystems. J. Hydrol. 2014, 518, 250–266. [Google Scholar] [CrossRef]
- Kundzewicz, Z.W.; Döll, P. Will groundwater ease freshwater stress under climate change? Hydrol. Sci. J. 2009, 54, 665–675. [Google Scholar] [CrossRef] [Green Version]
- Green, T.R.; Taniguchi, M.; Kooi, H.; Gurdak, J.J.; Allen, D.M.; Hiscock, K.M.; Treidel, H.; Aureli, A. Beneath the surface of global change: Impacts of climate change on groundwater. J. Hydrol. 2011, 405, 532–560. [Google Scholar] [CrossRef] [Green Version]
- Allen, A.; Chapman, D. Impacts of afforestation on groundwater resources and quality. Hydrogeol. J. 2001, 9, 390–400. [Google Scholar] [CrossRef]
- Scanlon, B.R.; Reedy, R.C.; Stonestrom, D.A.; Prudic, D.E.; Dennehy, K.F. Impact of land use and land cover change on groundwater recharge and quality in the southwestern US. Glob. Chang. Biol. 2005, 11, 1577–1593. [Google Scholar] [CrossRef]
- Dams, J.; Woldeamlak, S.T.; Batelaan, O. Predicting land-use change and its impact on the groundwater system of the Kleine Nete catchment, Belgium. Hydrol. Earth Syst. Sci. 2008, 12, 1369–1385. [Google Scholar] [CrossRef] [Green Version]
- Bosmans, J.H.C.; van Beek, L.P.H.; Sutanudjaja, E.H.; Bierkens, M.F.P. Hydrological impacts of global land cover change and human water use. Hydrol. Earth Syst. Sci. 2017, 21, 5603–5626. [Google Scholar] [CrossRef] [Green Version]
- Dolman, H.; Moors, E.; Elbers, J.; Snijders, W.; Hamaker, P. Het Waterverbruik Van Bossen in Nederland; Technical Report; Alterra: Wageningen, The Netherlands, 2000; Available online: http://www.climatexchange.nl/projects/boshydrologie/Waterverbruik_Bossen.pdf (accessed on 5 October 2020).
- Voortman, B.R.; Bartholomeus, R.P.; van der Zee, S.E.A.T.M.; Bierkens, M.F.P.; Witte, J.P.M. Quantifying energy and water fluxes in dry dune ecosystems of the Netherlands. Hydrol. Earth Syst. Sci. 2015, 19, 3787–3805. [Google Scholar] [CrossRef] [Green Version]
- Stuyfzand, P.J. Hydrochemistry and Hydrology of the Coastal Dune Area of the Western Netherlands. Ph.D. Thesis, Vrije Universiteit Amsterdam, Amsterdam, The Netherlands, 1993. [Google Scholar]
- Voortman, B.; van Huijgevoort, M.; Witte, J.P. Verdamping Van Natuurterreinen Berekend Met AZURE. De Parametrisatie Van Heide op Basis Van Lysimetermetingen en een Vergelijking Met Literatuurcijfers; Technical Report KWR2019.015; KWR: Nieuwegein, The Netherlands, 2019. [Google Scholar]
- Gleeson, T.; Alley, W.M.; Allen, D.M.; Sophocleous, M.A.; Zhou, Y.; Taniguchi, M.; VanderSteen, J. Towards Sustainable Groundwater Use: Setting Long-Term Goals, Backcasting, and Managing Adaptively. Groundwater 2012, 50, 19–26. [Google Scholar] [CrossRef]
- Taylor, R.G.; Scanlon, B.; Döll, P.; Rodell, M.; van Beek, R.; Wada, Y.; Longuevergne, L.; Leblanc, M.; Famiglietti, J.S.; Edmunds, M.; et al. Ground water and climate change. Nat. Clim. Chang. 2013, 3, 322–329. [Google Scholar] [CrossRef] [Green Version]
- Bierkens, M.F.P.; Wada, Y. Non-renewable groundwater use and groundwater depletion: A review. Environ. Res. Lett. 2019, 14, 063002. [Google Scholar] [CrossRef]
- Gehrels, J.C. Groundwater Level Fluctuations: Separation of Natural from Anthropogenic Influences and Determination of Groundwater Recharge in the Veluwe Area. Ph.D. Thesis, Vrije Universiteit Amsterdam, Amsterdam, The Netherlands, 1999. [Google Scholar]
- Van Engelenburg, J.; Hueting, R.; Rijpkema, S.; Teuling, A.J.; Uijlenhoet, R.; Ludwig, F. Impact of Changes in Groundwater Extractions and Climate Change on Groundwater-Dependent Ecosystems in a Complex Hydrogeological Setting. Water Resour. Manag. 2018, 32, 259–272. [Google Scholar] [CrossRef] [Green Version]
- van Alphen, H.J.; Alves, E.; aus der Beek, T.; Bruggeman, A.; Camera, C.; Fohrmann, R.; Fortunato, A.; Freire, P.; Iacovides, A.; Iacovides, I.; et al. Characterization of the Catchments and the Water Systems. Technical Report, BINGO Deliverable 3.1. 2016. Available online: http://www.projectbingo.eu/downloads/BINGO_Deliverable3.1_EC.pdf (accessed on 13 October 2020).
- Maas, G.J.; van der Meij, W.M.; van Delft, S.P.J.; Heidema, A.H. Toelichting bij de Legenda Geomorfologische Kaart Van Nederland 1:50,000 (2019); Wageningen Environmental Research: Wageningen, The Netherlands, 2019. [Google Scholar]
- Nijhuis, K. Historisch Landgebruik Van de Veluwe in Hydrologisch Perspectief. Master’s Thesis, Wageningen University, Wageningen, The Netherlands, 2017. [Google Scholar]
- De Lange, W.; Borren, W. Grondwatermodel AZURE versie 1.0. Actueel Instrumentarium voor de Zuiderzee Regio; Technical Report; Deltares: Delft, The Netherlands, 2014. [Google Scholar]
- Harbaugh, A.W. MODFLOW-2005, the U.S. Geological Survey Modular Ground-Water Model—The Ground-Water Flow Process; Technical Report; USGS, 2005. Available online: https://pubs.er.usgs.gov/publication/tm6A16 (accessed on 13 October 2020).
- van Walsum, P.E.V.; Groenendijk, P. Quasi steady-state simulation of the unsaturated zone in groundwater modeling of lowland regions. Vadose Zone J. 2008, 7, 769–781. [Google Scholar] [CrossRef]
- van Walsum, P.E.V.; Veldhuizen, A.A.; Groenendijk, P. SIMGRO 7.2.0, Theory and Model Implementation; Technical Report; Alterra: Wageningen, The Netherlands, 2011; Available online: http://nhi.nu/nl/files/8814/2662/2842/Handleiding_SIMGRO_7.2.0_Engels_Report_913_1_V7_2_0.pdf (accessed on 13 October 2020).
- Koeman, C. Geschiedenis Van de Kartografie Van Nederland: Zes Eeuwen Land-en Zeekarten en Stadsplattegronden; Canaletto: Alphen aan den Rijn, The Netherlands, 1983. [Google Scholar]
- Knol, W.C.; Kramer, H.; Gijsbertse, H. Historisch Grondgebruik Nederland; een Landelijke Reconstructie van het Grondgebruik Rond 1900; Alterra-Rapport 573; Alterra: Wageningen, The Netherlands, 2004; Available online: https://www.wur.nl/nl/Publicatie-details.htm?publicationId=publication-way-333238323739 (accessed on 13 October 2020).
- Hazeu, G.W.; Schuiling, C.; Dorland, G.J.; Oldengarm, J.; Gijsbertse, H.A. Landelijk Grondgebruiksbestand Nederland versie 6 (LGN6); Vervaardiging, Nauwkeurigheid en Gebruik; Alterra-Rapport 2012; Alterra: Wageningen, The Netherlands, 2010; Available online: https://www.wur.nl/nl/Publicatie-details.htm?publicationId=publication-way-333931373630 (accessed on 13 October 2020).
- Hargreaves, G.H.; Allen, R.G. History and evaluation of Hargreaves evapotranspiration equation. J. Irrig. Drain. Eng. 2003, 129, 53–63. [Google Scholar] [CrossRef]
- Makkink, G.F. Testing the Penman formula by means of lysimeters. J. Inst. Water Eng. 1957, 11, 277–288. [Google Scholar]
- Rutter, A.; Kershaw, K.; Robins, P.; Morton, A. A predictive model of rainfall interception in forests, 1. Derivation of the model from observations in a plantation of Corsican pine. Agric. Meteorol. 1971, 9, 367–384. [Google Scholar] [CrossRef]
- Šimůnek, J.; Šejna, M.; Saito, H.; Sakai, M.; Van Genuchten, M.T. The HYDRUS-1D Software Package for Simulating the Movement of Water, Heat, and Multiple Solutes in Variably Saturated Media, Version 4.08; HYDRUS Software Series 3; Technical Report; Department of Environmental Sciences, University of California Riverside: Riverside, CA, USA, 2008. [Google Scholar]
- KNMI. KNMI’14: Climate Change Scenarios for the 21st Century—A Netherlands Perspective; Technical Report; KNMI: De Bilt, The Netherlands, 2014. [Google Scholar]
- Neefjes, J. Landschapsbiografie Van de Veluwe: Historisch-Landschappelijke Karakteristieken en hun Ontstaan; Rijksdienst voor het Cultureel Erfgoed and Staatsbosbeheer: Amersfoort, The Netherlands, 2018; Available online: https://library.wur.nl/WebQuery/groenekennis/2284674 (accessed on 13 October 2020).
- Teuling, A.J.; Seneviratne, S.I.; Stöckli, R.; Reichstein, M.; Moors, E.; Ciais, P.; Luyssaert, S.; van den Hurk, B.; Ammann, C.; Bernhofer, C.; et al. Contrasting response of European forest and grassland energy exchange to heatwaves. Nat. Geosci. 2010, 3, 722–727. [Google Scholar] [CrossRef]
- van den Eertwegh, G.; Bartholomeus, R.; de Louw, P.; Witte, F.; van Dam, J.; van Deijl, D.; Hoefsloot, P.; Clevers, S.; Hendriks, D.; van Huijgevoort, M.; et al. Droogte in Zandgebieden Van Zuid-, Midden-en Oost-Nederland: Rapportage Fase 1: Ontwikkeling Van Uniforme Werkwijze Voor Analyse Van Droogte en Tussentijdse Bevindingen. Technical Report. 2019. Available online: https://edepot.wur.nl/511196 (accessed on 13 October 2020).
- Philip, S.Y.; Kew, S.F.; van der Wiel, K.; Wanders, N.; van Oldenborgh, G.J. Regional differentiation in climate change induced drought trends in The Netherlands. Environ. Res. Lett. 2020. [Google Scholar] [CrossRef]
- Wolters, H.A.; van den Born, G.J.; Dammers, E.; Reinhard, S. Deltascenario’s Voor de 21e Eeuw, Actualisering 2017; Technical Report; Deltares: Utrecht, The Netherlands, 2018; Available online: https://media.deltares.nl/deltascenarios/Deltascenarios_actualisering2017_hoofdrapport.pdf (accessed on 13 October 2020).
- Aus der Beek, T.; Alves, E.; Becker, R.; Bruggeman, A.; Fortunato, A.B.; Freire, P.; Gragne, A.; van Huijgevoort, M.H.J.; Iacovides, A.; Iacovides, I.; et al. D3.4 Model Results for Water and Land Use Scenarios Completed and Analysed. Technical Report, BINGO Deliverable 3.4. 2018. Available online: http://www.projectbingo.eu/content/deliverables (accessed on 13 October 2020).


| Variable | Indicator | Climate (1981–2010) | GL | GH | WL | WH |
|---|---|---|---|---|---|---|
| Temperature | Mean | 10.1 °C | +1.0 °C | +1.4 °C | +2.0 °C | +2.3 °C |
| Precipitation | Mean amount | 851 mm | +4% | +2.5% | +5.5% | +5% |
| Solar radiation | Solar radiation | 354 kJ/cm2 | +0.6% | +1.6% | −0.8% | +1.2% |
Publisher’s Note: MDPI stays neutral with regard to jurisdictional claims in published maps and institutional affiliations. |
© 2020 by the authors. Licensee MDPI, Basel, Switzerland. This article is an open access article distributed under the terms and conditions of the Creative Commons Attribution (CC BY) license (http://creativecommons.org/licenses/by/4.0/).
Share and Cite
Van Huijgevoort, M.H.J.; Voortman, B.R.; Rijpkema, S.; Nijhuis, K.H.S.; Witte, J.-P.M. Influence of Climate and Land Use Change on the Groundwater System of the Veluwe, The Netherlands: A Historical and Future Perspective. Water 2020, 12, 2866. https://doi.org/10.3390/w12102866
Van Huijgevoort MHJ, Voortman BR, Rijpkema S, Nijhuis KHS, Witte J-PM. Influence of Climate and Land Use Change on the Groundwater System of the Veluwe, The Netherlands: A Historical and Future Perspective. Water. 2020; 12(10):2866. https://doi.org/10.3390/w12102866
Chicago/Turabian StyleVan Huijgevoort, Marjolein H. J., Bernard R. Voortman, Sjoerd Rijpkema, Kelly H. S. Nijhuis, and Jan-Philip M. Witte. 2020. "Influence of Climate and Land Use Change on the Groundwater System of the Veluwe, The Netherlands: A Historical and Future Perspective" Water 12, no. 10: 2866. https://doi.org/10.3390/w12102866