Quantitative Detection and Attribution of Groundwater Level Variations in the Amu Darya Delta
by
 , , ,
, , ,
Xiaohui Pan
1,2,3,4,5,6 ,
,
Weishi Wang
7,
Tie Liu
1,2,5,6,8,*,
Yue Huang
1,2,5,6,8,
Philippe De Maeyer
4,5,6 ,
,
Chenyu Guo
1,2,3,
Yunan Ling
1,2,3 and
Shamshodbek Akmalov
8,9
1
State Key Laboratory of Desert and Oasis Ecology, Xinjiang Institute of Ecology and Geography, Chinese Academy of Sciences, Urumqi 830011, China
2
Key Laboratory of GIS & RS Application, Xinjiang Uygur Autonomous Region, Urumqi 830011, China
3
University of Chinese Academy of Sciences, Beijing 100049, China
4
Department of Geography, Ghent University, 9000 Ghent, Belgium
5
Sino-Belgian Joint Laboratory of Geo-Information, Urumqi 830011, China
6
Sino-Belgian Joint Laboratory of Geo-Information, 9000 Ghent, Belgium
7
Institute of Environmental Science and Geography, University of Potsdam, Karl-Liebknecht-Str. 24–25, 14476 Potsdam, Germany
8
CAS Research Center for Ecology and Environment of Central Asia, Urumqi 830011, China
9
Tashkent Institute of Irrigation and Agricultural Mechanization Engineers, Tashkent 999033, Uzbekistan
*
Author to whom correspondence should be addressed.
Water 2020, 12(10), 2869; https://doi.org/10.3390/w12102869
Submission received: 11 September 2020
/
Revised: 10 October 2020
/
Accepted: 12 October 2020
/
Published: 15 October 2020
(This article belongs to the Special Issue Assessment of Spatial and Temporal Variability of Water Resources)
Abstract
:In the past few decades, the shrinkage of the Aral Sea is one of the biggest ecological catastrophes caused by human activity. To quantify the joint impact of both human activities and climate change on groundwater, the spatiotemporal groundwater dynamic characteristics in the Amu Darya Delta of the Aral Sea from 1999 to 2017 were analyzed, using the groundwater level, climate conditions, remote sensing data, and irrigation information. Statistics analysis was adopted to analyze the trend of groundwater variation, including intensity, periodicity, spatial structure, while the Pearson correlation analysis and principal component analysis (PCA) were used to quantify the impact of climate change and human activities on the variabilities of the groundwater level. Results reveal that the local groundwater dynamic has varied considerably. From 1999 to 2002, the groundwater level dropped from −189 cm to −350 cm. Until 2017, the groundwater level rose back to −211 cm with fluctuation. Seasonally, the fluctuation period of groundwater level and irrigation water was similar, both were about 18 months. Spatially, the groundwater level kept stable within the irrigation area and bare land but fluctuated drastically around the irrigation area. The Pearson correlation analysis reveals that the dynamic of the groundwater level is closely related to irrigation activity within the irrigation area (Nukus: −0.583), while for the place adjacent to the Aral Sea, the groundwater level is closely related to the Large Aral Sea water level (Muynak: 0.355). The results of PCA showed that the cumulative contribution rate of the first three components exceeds 85%. The study reveals that human activities have a great impact on groundwater, effective management, and the development of water resources in arid areas is an essential prerequisite for ecological protection.
1. Introduction
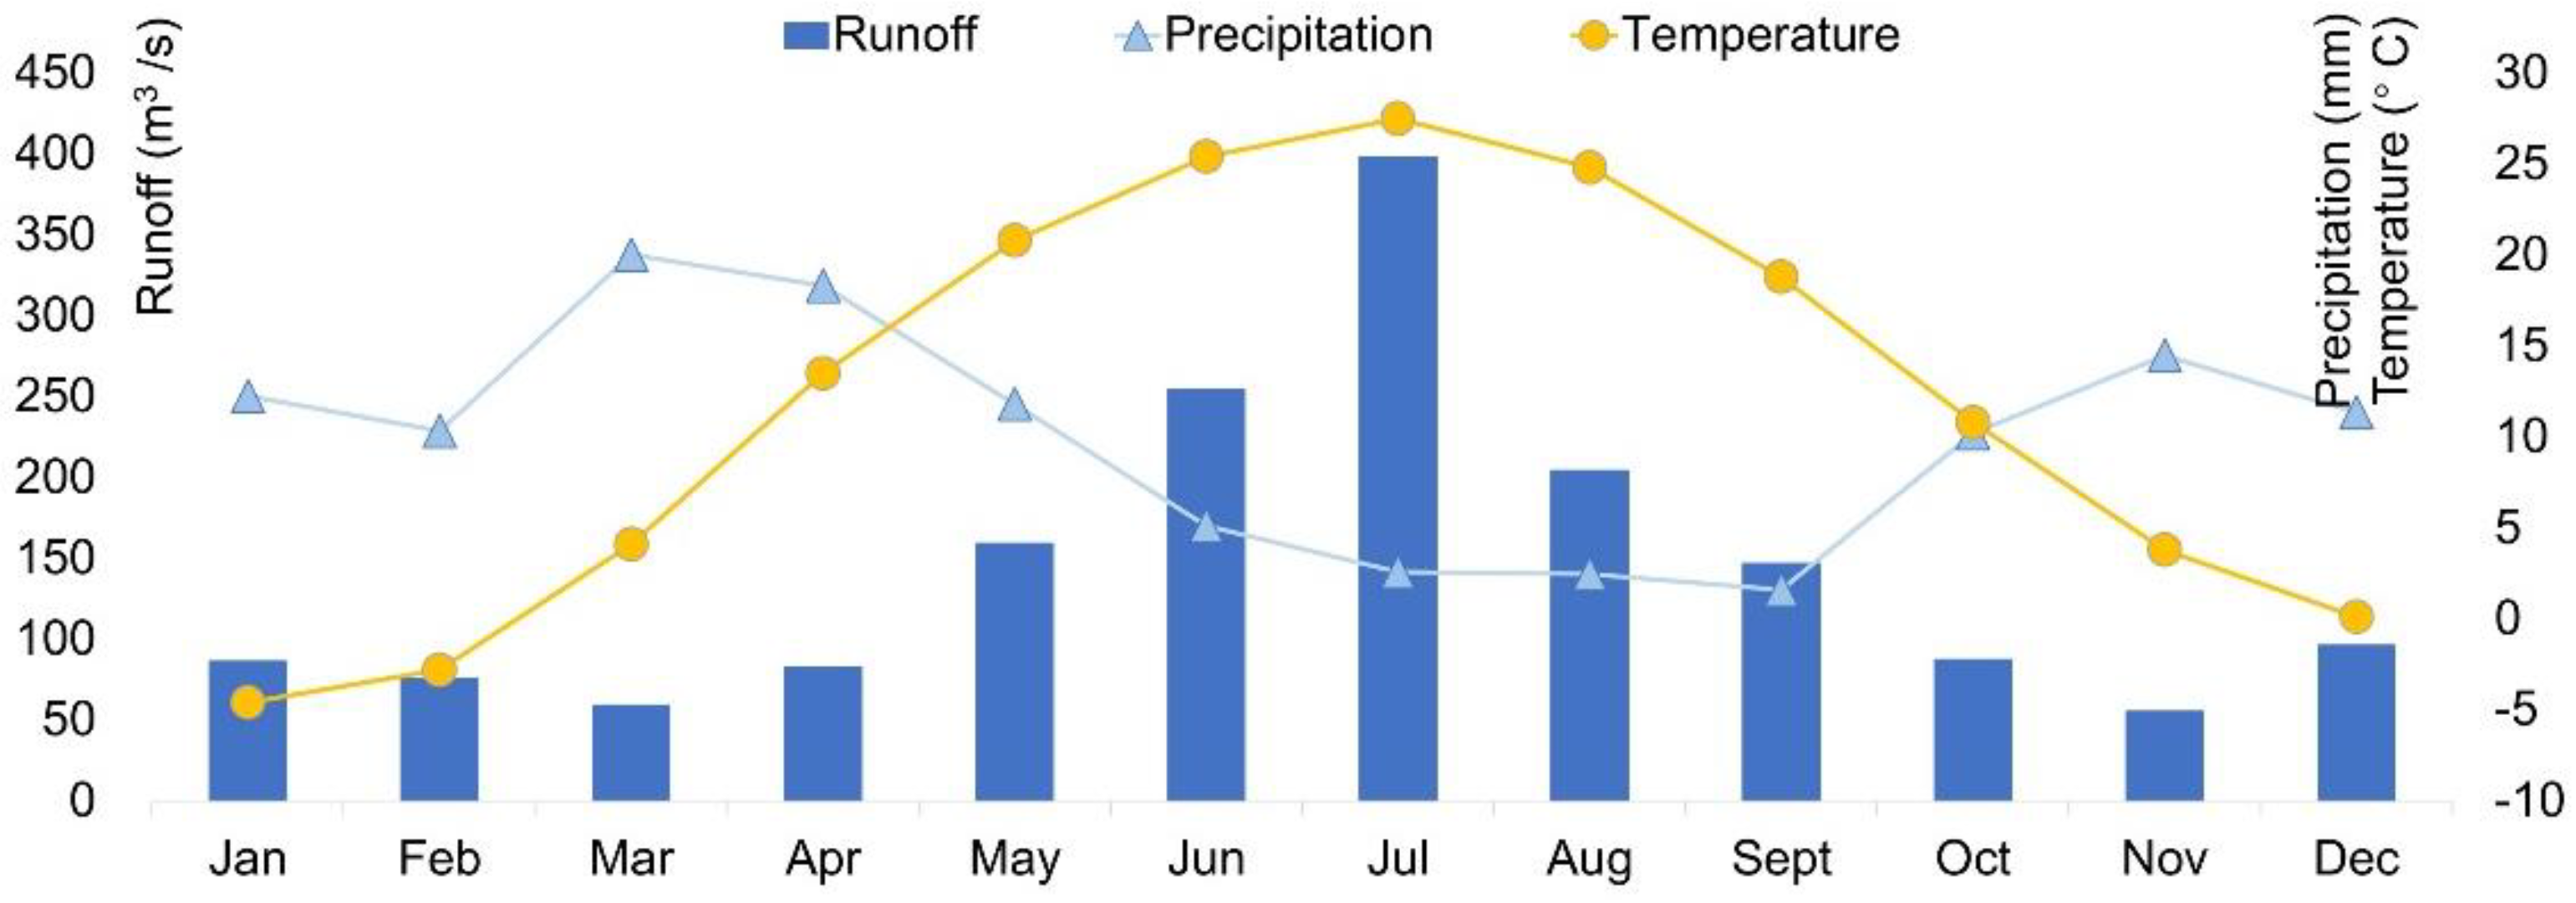
The Aral Sea is located in the deserts of western Central Asian, within Kazakhstan and Uzbekistan (43°24′~46°56′ N; 58°12′~61°59′ E), situated in a semi-arid to arid region west of the Tian Shan and the Pamir (Figure 1) [1]. The Aral Sea has two tributaries, Amu Darya and the Syr Darya rivers, mainly fed by precipitation and snowmelt of the high mountain ranges. Both of them discharge freshwater into the Aral Sea, which has no further outflow [2]. The average annual temperature is 9.4 °C, and the annual precipitation is between 100 and 140 mm (Figure 2) [1].
Since 1960, the Aral Sea has rapid desiccation and severely salinized, caused a series of ecological and environmental crises [3]. With a surface area of 67,500 km2, the Aral Sea was once the fourth-largest inland lake on the planet in 1960, while in the following years, the irrigation activity drastically reduced the inflow and further led to a sharp shrinkage [4]. Since then, it has shrunk by more than 80% of its surface area with approximately 90% of its volume and further led to a rapid increase in salinity, which rocketed up by 20 times from the year 1960 to 2010 [5]. As the lake’s bottom dries up to about 4000 km2, the groundwater level has dropped dramatically. In September 2009, the Aral Sea separated into the South (Large) Aral Sea in Uzbekistan and North (small) Aral Sea in Kazakstan by the artificial dam built in Kazakhstan. Since then, the northern part has been recovered while the southern part continues to deteriorate [6].
The dramatic shrinking of the Large Aral Sea has caused severe damage to the local ecological environment, economic and human habitation [7]. Dryness and exposed lake beds not only lead to the disappearance of the fishing industry but also frequent salt/sand storms, as well as ill effects on the crops, wild and livestock, particularly in the Amu Darya Delta [8]. This human-made environmental degradation was considered one of the greatest ecological catastrophes of the 20th century [9]. The main reason for the shrinking of the Aral Sea is the human activity and climate change, including the unsustainable recharge from the inflowing Amu Darya and Syr Darya rivers, which were adopted to supply irrigation for agriculture [10]. Crop production in arid areas consumes large amounts of water [11]. To meet the increasing crop demand driven by the population growth, agricultural consumption of freshwater soars correspondingly. The local government expanded irrigation areas from around 5 million ha in 1960 to 8.2 million ha in 2010, which greatly diminished the discharge of the Amu Darya and Syr Darya rivers. Featured as a terminal lake, there is no surface outflow in the Aral Sea, therefore, its water level is fundamentally determined by the joint effect of Amu Darya runoff, the groundwater discharge, and the net evaporation. The lake’s water level has fallen sharply since the 1960s, and groundwater input is likely to increase, thereby increasing the hydraulic gradient [6]. As the Amu Darya did not reach the Large Aral Sea anymore, the groundwater becomes a more decisive factor over the past several decades. Net groundwater inflow is estimated at −1.3 to 3.4 km3/year and is considered a significant part of water balance [12]. Due to the lack of long-term measurement of groundwater level for the entire basin, the understanding of the water balance in the Aral Sea is still inaccurate and incomprehensive.
Recent research indicated that the main reasons for the decrease in groundwater were reduced precipitation, shrinking river runoff, increased water consumption, low utilization rates of water resources [13,14,15,16,17]. Over the past decades, lots of efforts have been devoted to groundwater monitoring and characterization. Micklin [1] mainly used hydrologic and other data to analyze the changes in the hydrology and ecological environment of the Aral Sea concluded that in the early 1960s, excessive irrigation activities broke through the tipping point of the natural environment. Meanwhile, with the help of several future scenarios of the Aral Sea, he pointed that the restoration of the Aral Sea not only requires major capital and technical innovations, but also a feasible fundamental policy for long-term sustainable development. With the help of a 3-D sea-ice groundwater model, the groundwater discharge—as one of the investigated factors, could have influenced the Aral Sea salinity distribution in the 1990s [9]. Johansson et al. [18] analyzed the historical data set of groundwater level and salinity measurement of 24 monitoring wells located in Amu Darya Delta, the results showed that in the current unirrigated downstream area, the salinity of shallow groundwater (average 23 g/L) was much higher than current irrigation water (average 3 g/L). Ibrakhimov et al. [5] analyzed the spatial-temporal dynamics of the groundwater level and salinity in the Khorezm region, and the results showed that by the dynamic of position and salinity in the water table, the soil salinization increased by 3.5–14 t/ha of salts annually.
As a crucial factor in meeting the region’s freshwater demands, the influence of the sharp shrinkage of the Aral Sea on groundwater flow needs to be quantified. By using the water balance expression, and considering the uncertainty of the main evaporation terms, the groundwater could be treated as a fitting parameter in the Aral Sea water balance equation. An investigation by Jarsjö and Destouni [19] demonstrated a redistribution of the local groundwater flow field, where the groundwater discharge kept consistent in the southeast of the Aral Sea but increased in the northwestern area. However, most of the previous works that focused on water level and quality changes in local areas lacked spatial-temporal research on the groundwater of the entire Aral Sea Basin. From a global perspective, groundwater resources have played an irreplaceable role in solving water shortage in arid regions. Besides, scientific demonstration and effective management are essential guarantees and necessary premises for the development and utilization of groundwater resources in the arid areas [11]. The macro spatial distribution of the arid region and its degree of change are the keys to formulate a strategy for the rational use of regional groundwater. Therefore, it is of great importance to seek the possible causes of the variation. Nevertheless, several studies have investigated the spatiotemporal variation of the groundwater level, but due to the lack of sufficient, frequent, and regular data, the analysis of the temporal variation of the groundwater is still insufficient.
Many researchers use geostatistics as water resource management and decision tools to reveal the spatial-temporal structure of groundwater level fluctuations [20]. Statistical tests like the linear regression model, M–K [21] test were applied to understand the trend and rate of change in the groundwater level. This study focused on changes in the groundwater dynamic from 1999 to 2017. The linear regression analysis, wavelet analysis, and M–K test were used to detect the trend of groundwater changes, mutation points, and change points in time series. The Pearson correlation analysis was used to quantify the relationship and contribution of runoff, irrigation water, the Aral Sea water level, Normalized Vegetation Index (NDVI), and evapotranspiration (ET) on groundwater level changes. The PCA was used to quantitatively analyze the degree of influential factors driving changes in the groundwater level. This study aims to provide essential insight into quantifying groundwater recharge volume to the Aral Sea and understanding the mechanism of recharge.
2. Materials and Methods
2.1. Study Area
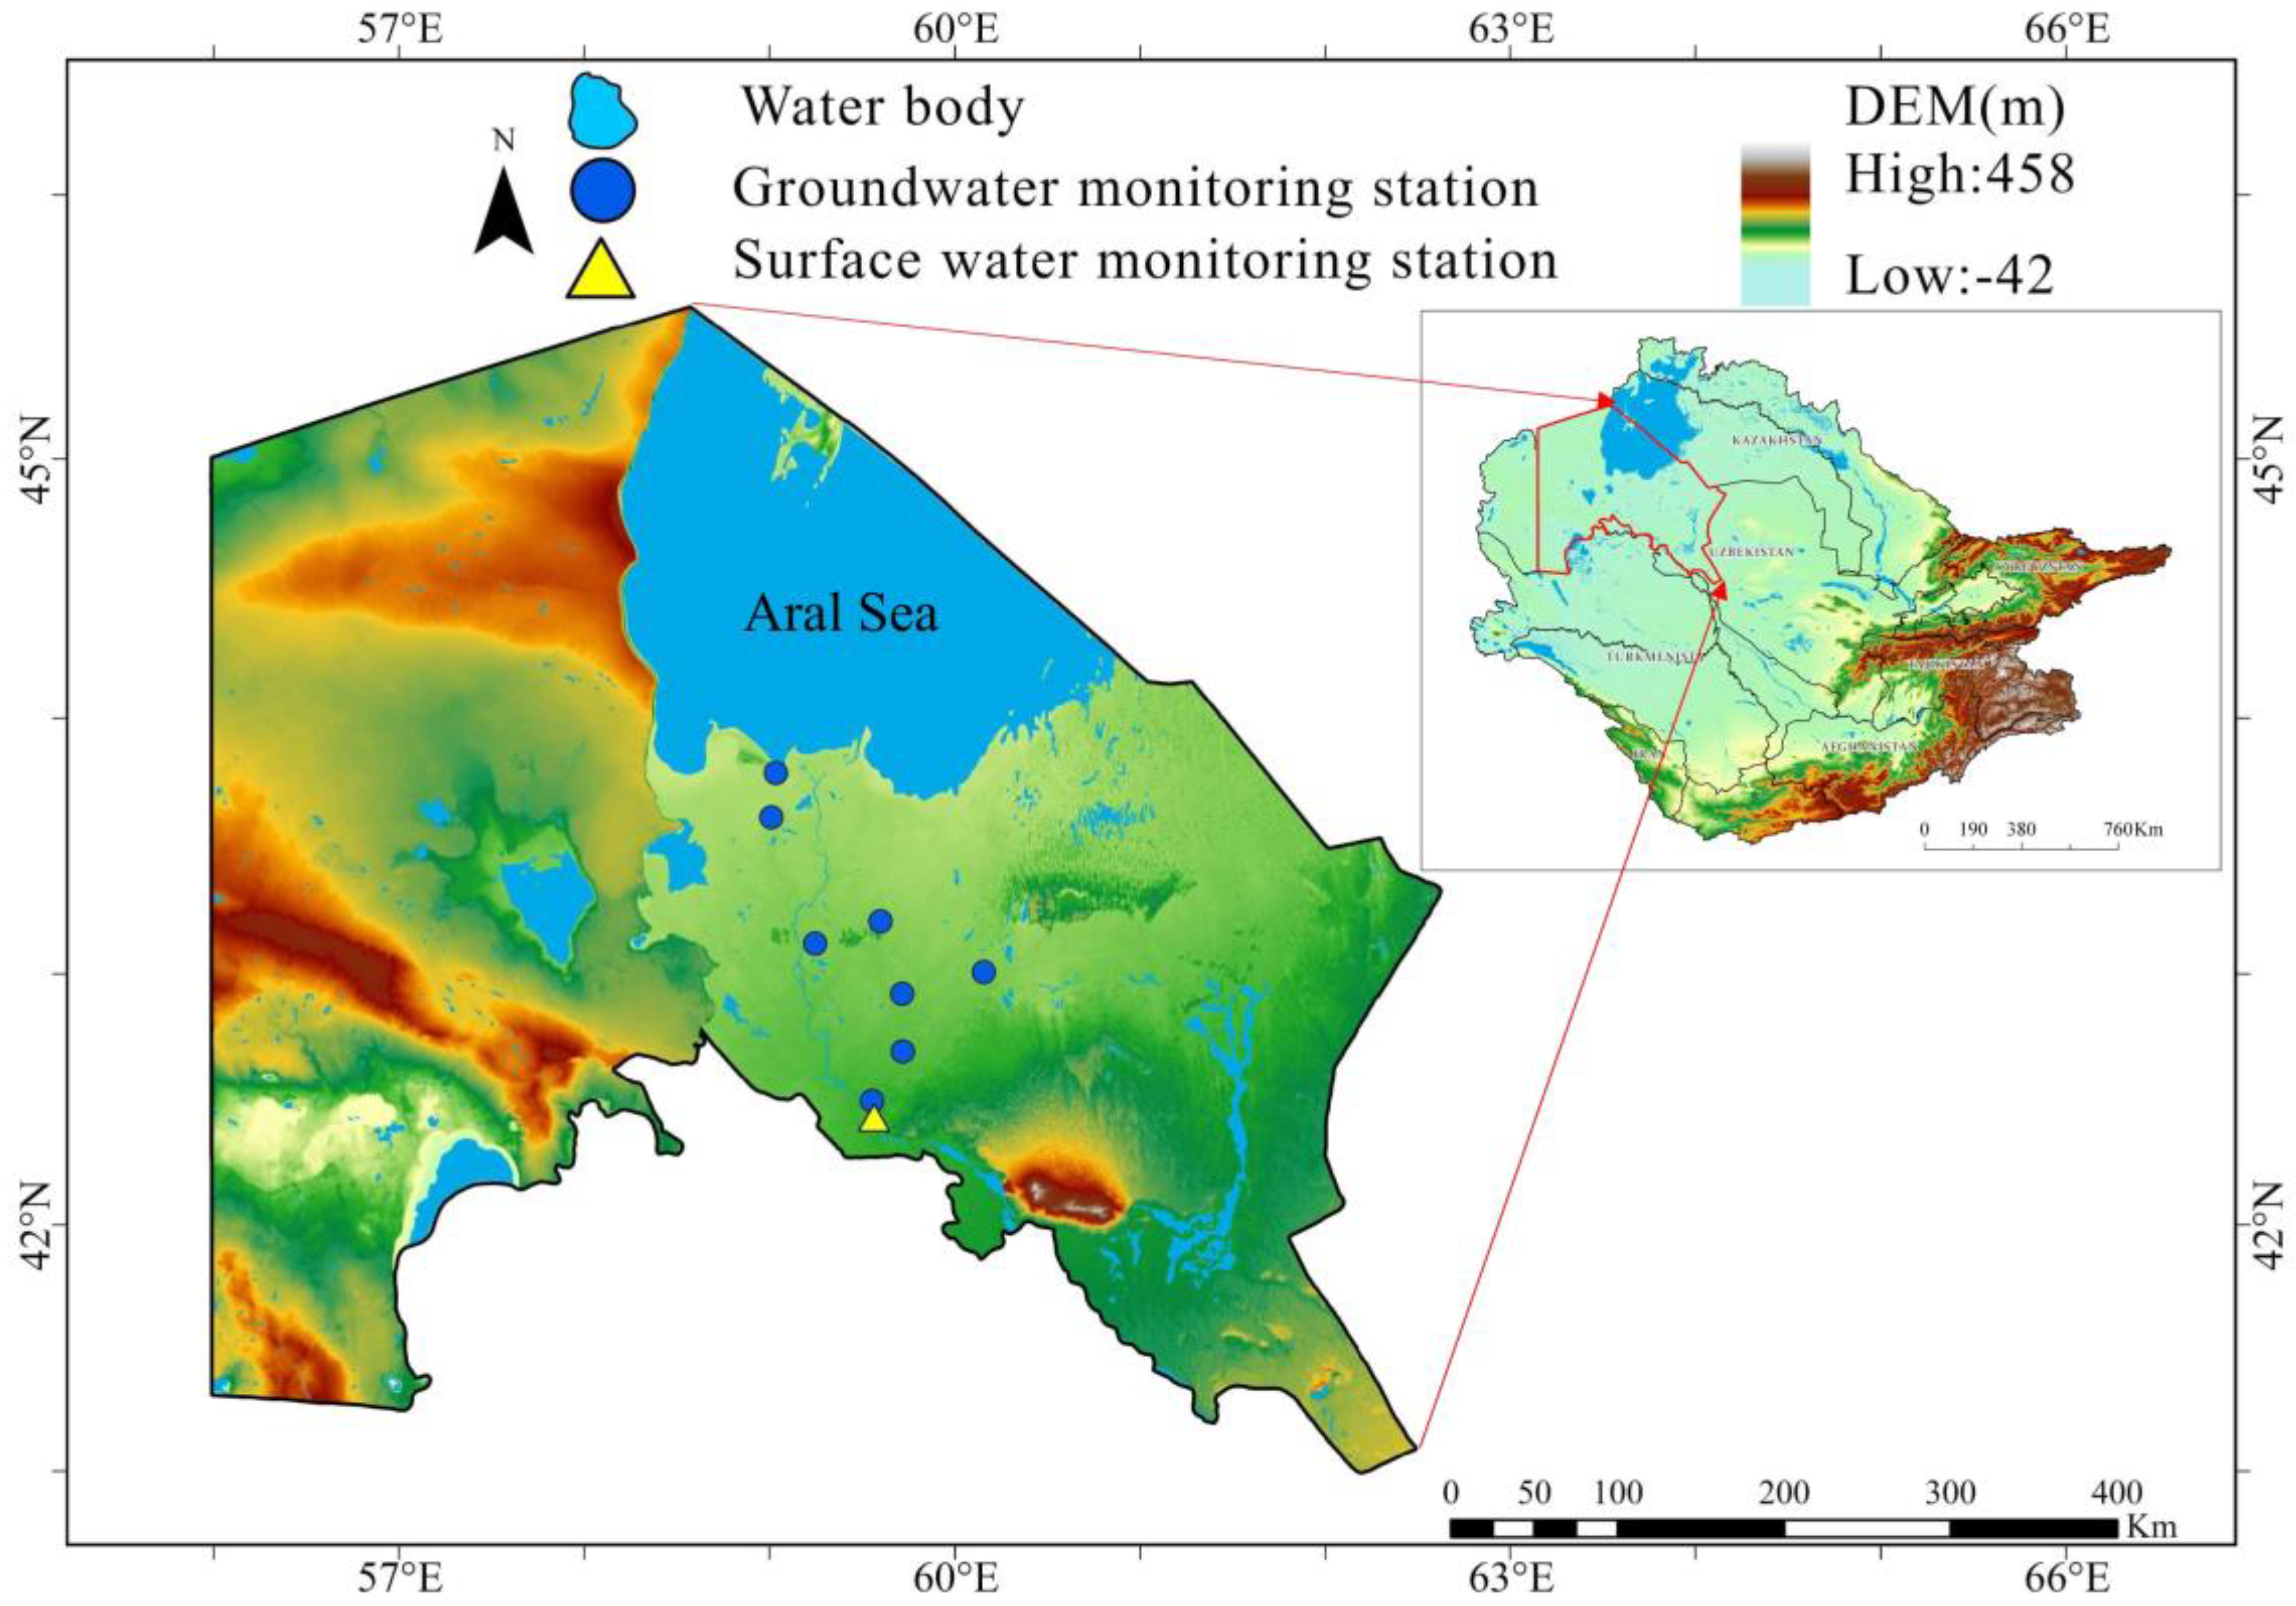
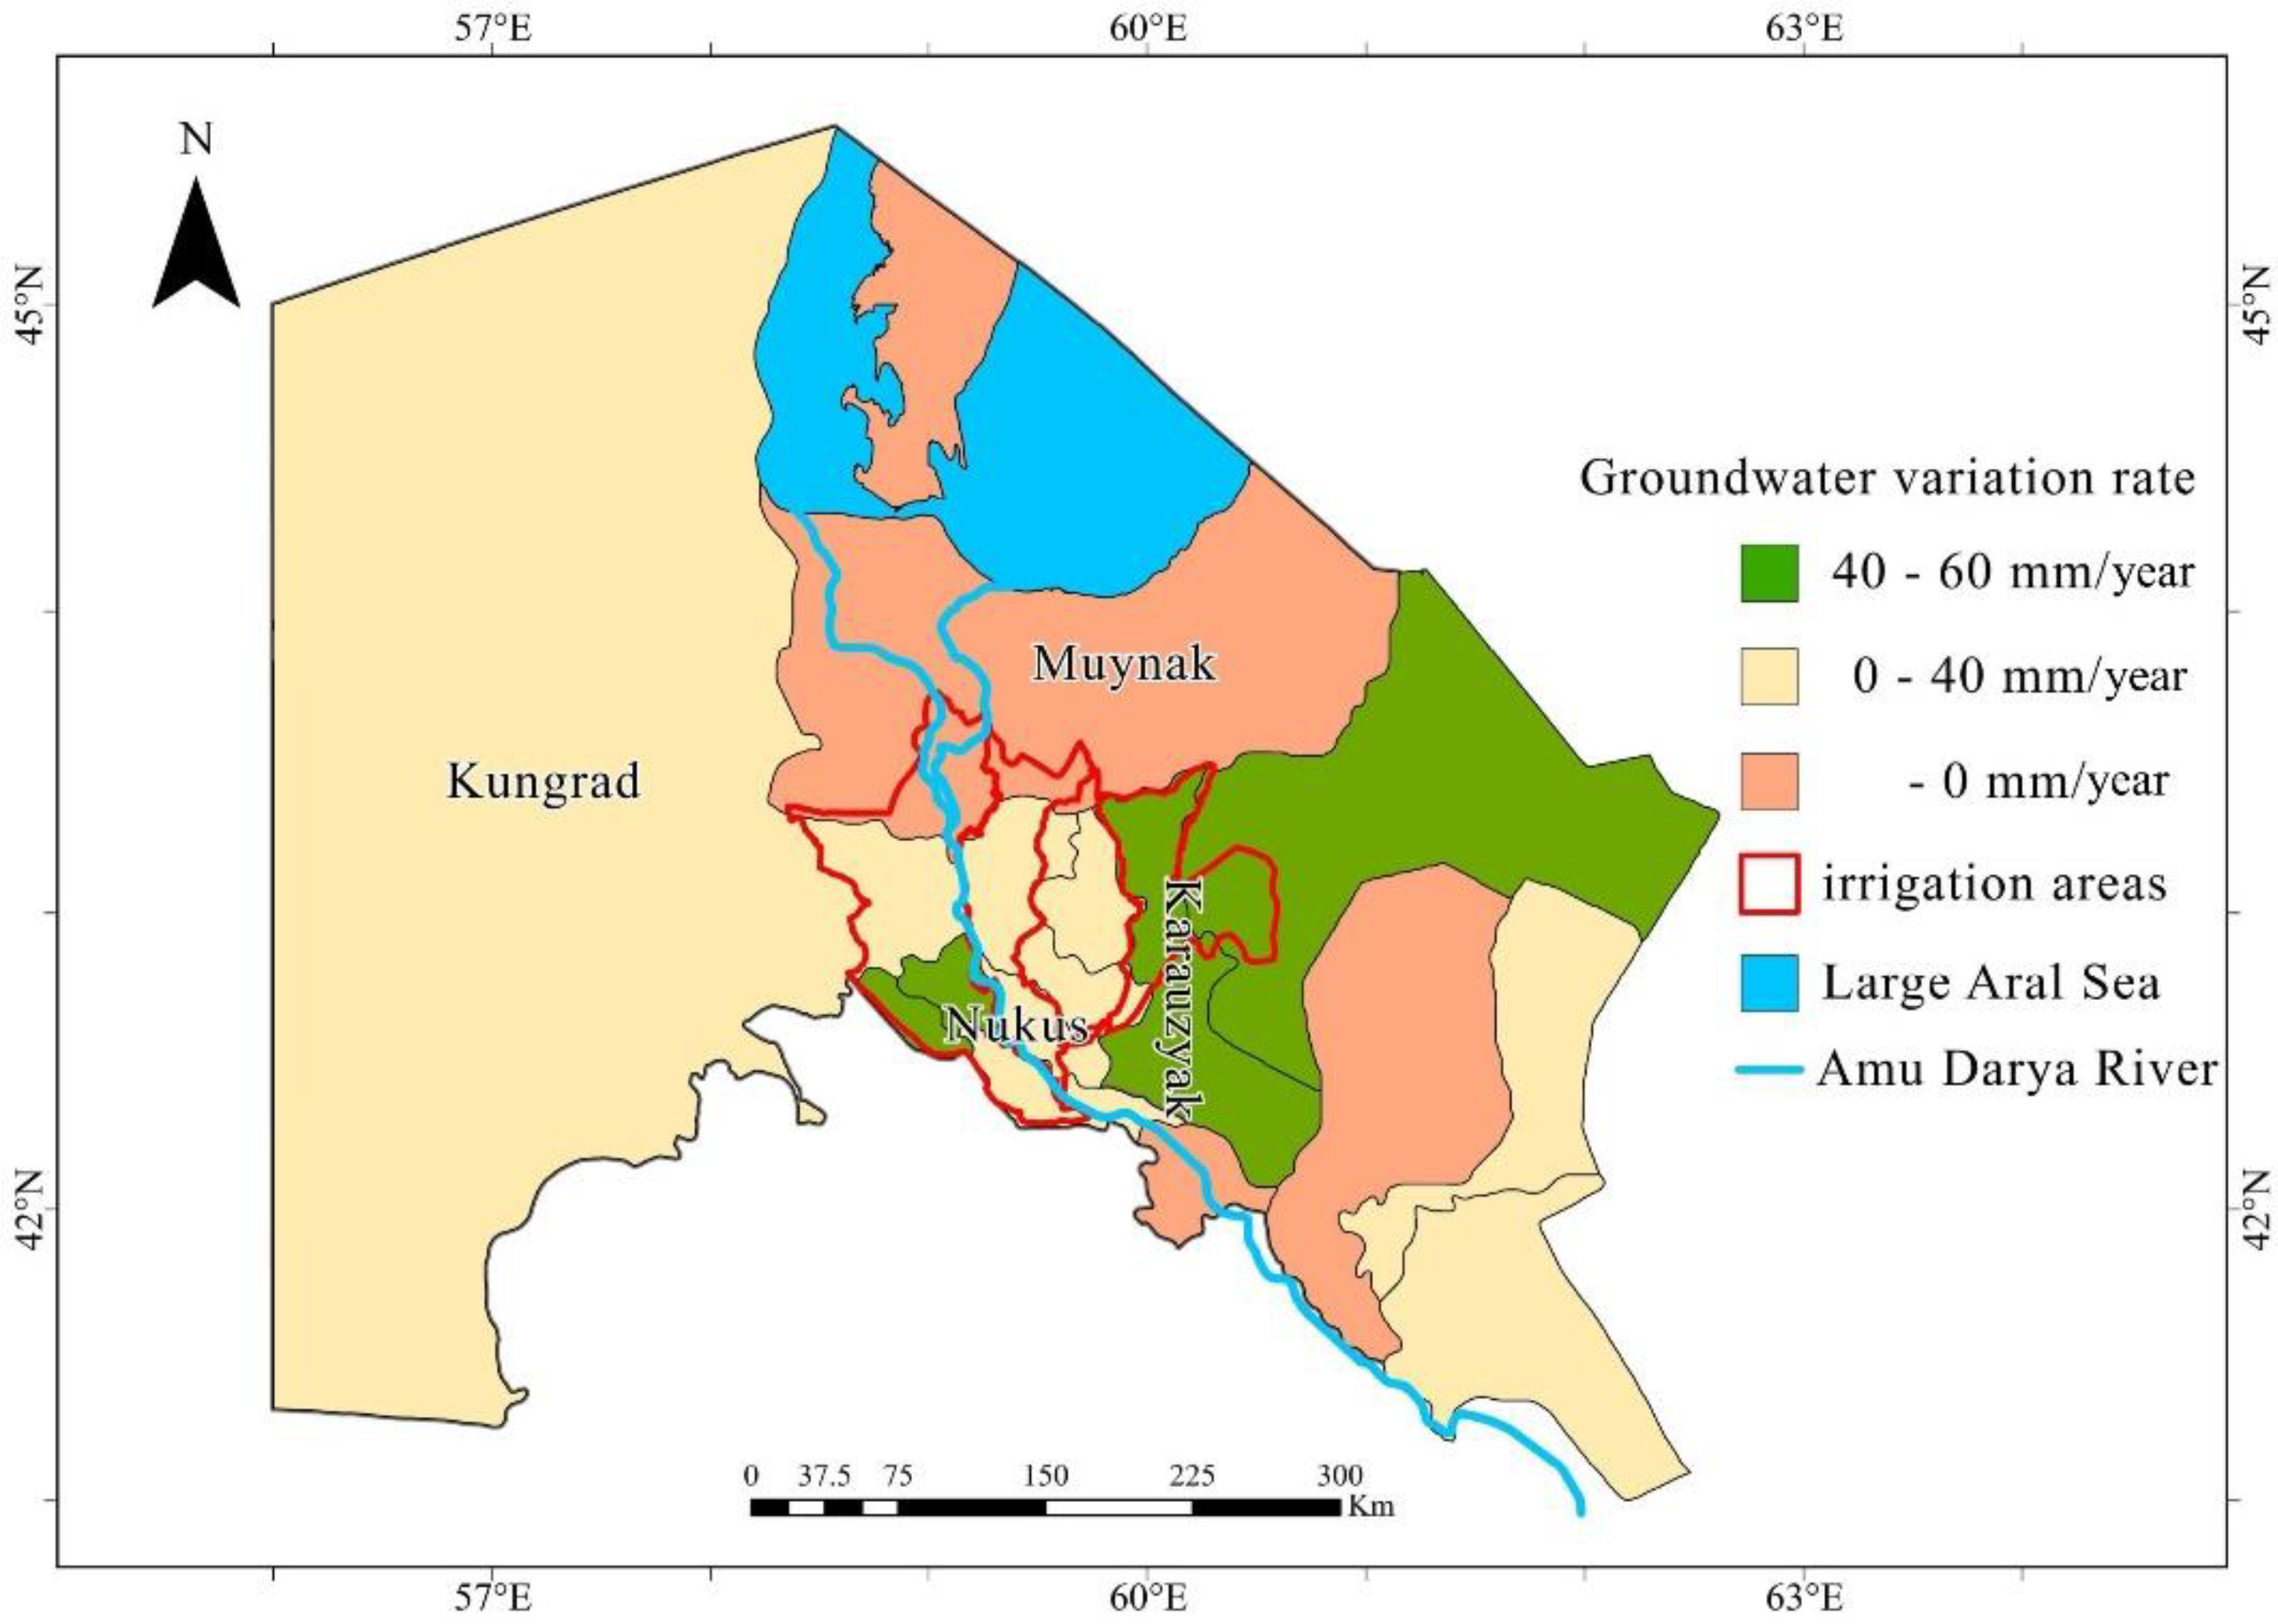
The Amu Darya Delta contains both surface water and groundwater that discharge into the shrinking Large Aral Sea and ultimately control its future destiny [18]. Karakalpakstan is an autonomous republic that covers the entire northwestern of Uzbekistan. As Karakalpakstan is the primary recharge area for groundwater in Amu Darya Delta, in this paper, groundwater level data from Karakalpakstan is used to analyze the characteristics of groundwater level changes in the Amu Darya Delta. The Karakalpakstan (41°19′~45°35′ N; 56°0′~62°20′ E) has an area of 160,000 km2, the elevation ranges between −42 and 458 m, bare area and cropland are the major land use/cover types, cotton and wheat are the main crops. The Aral Sea was subdivided into two separate waterbodies, while the Amu Darya river is the sole tributary of the Large Aral Sea. which serves as the drainage for the endorheic basin.
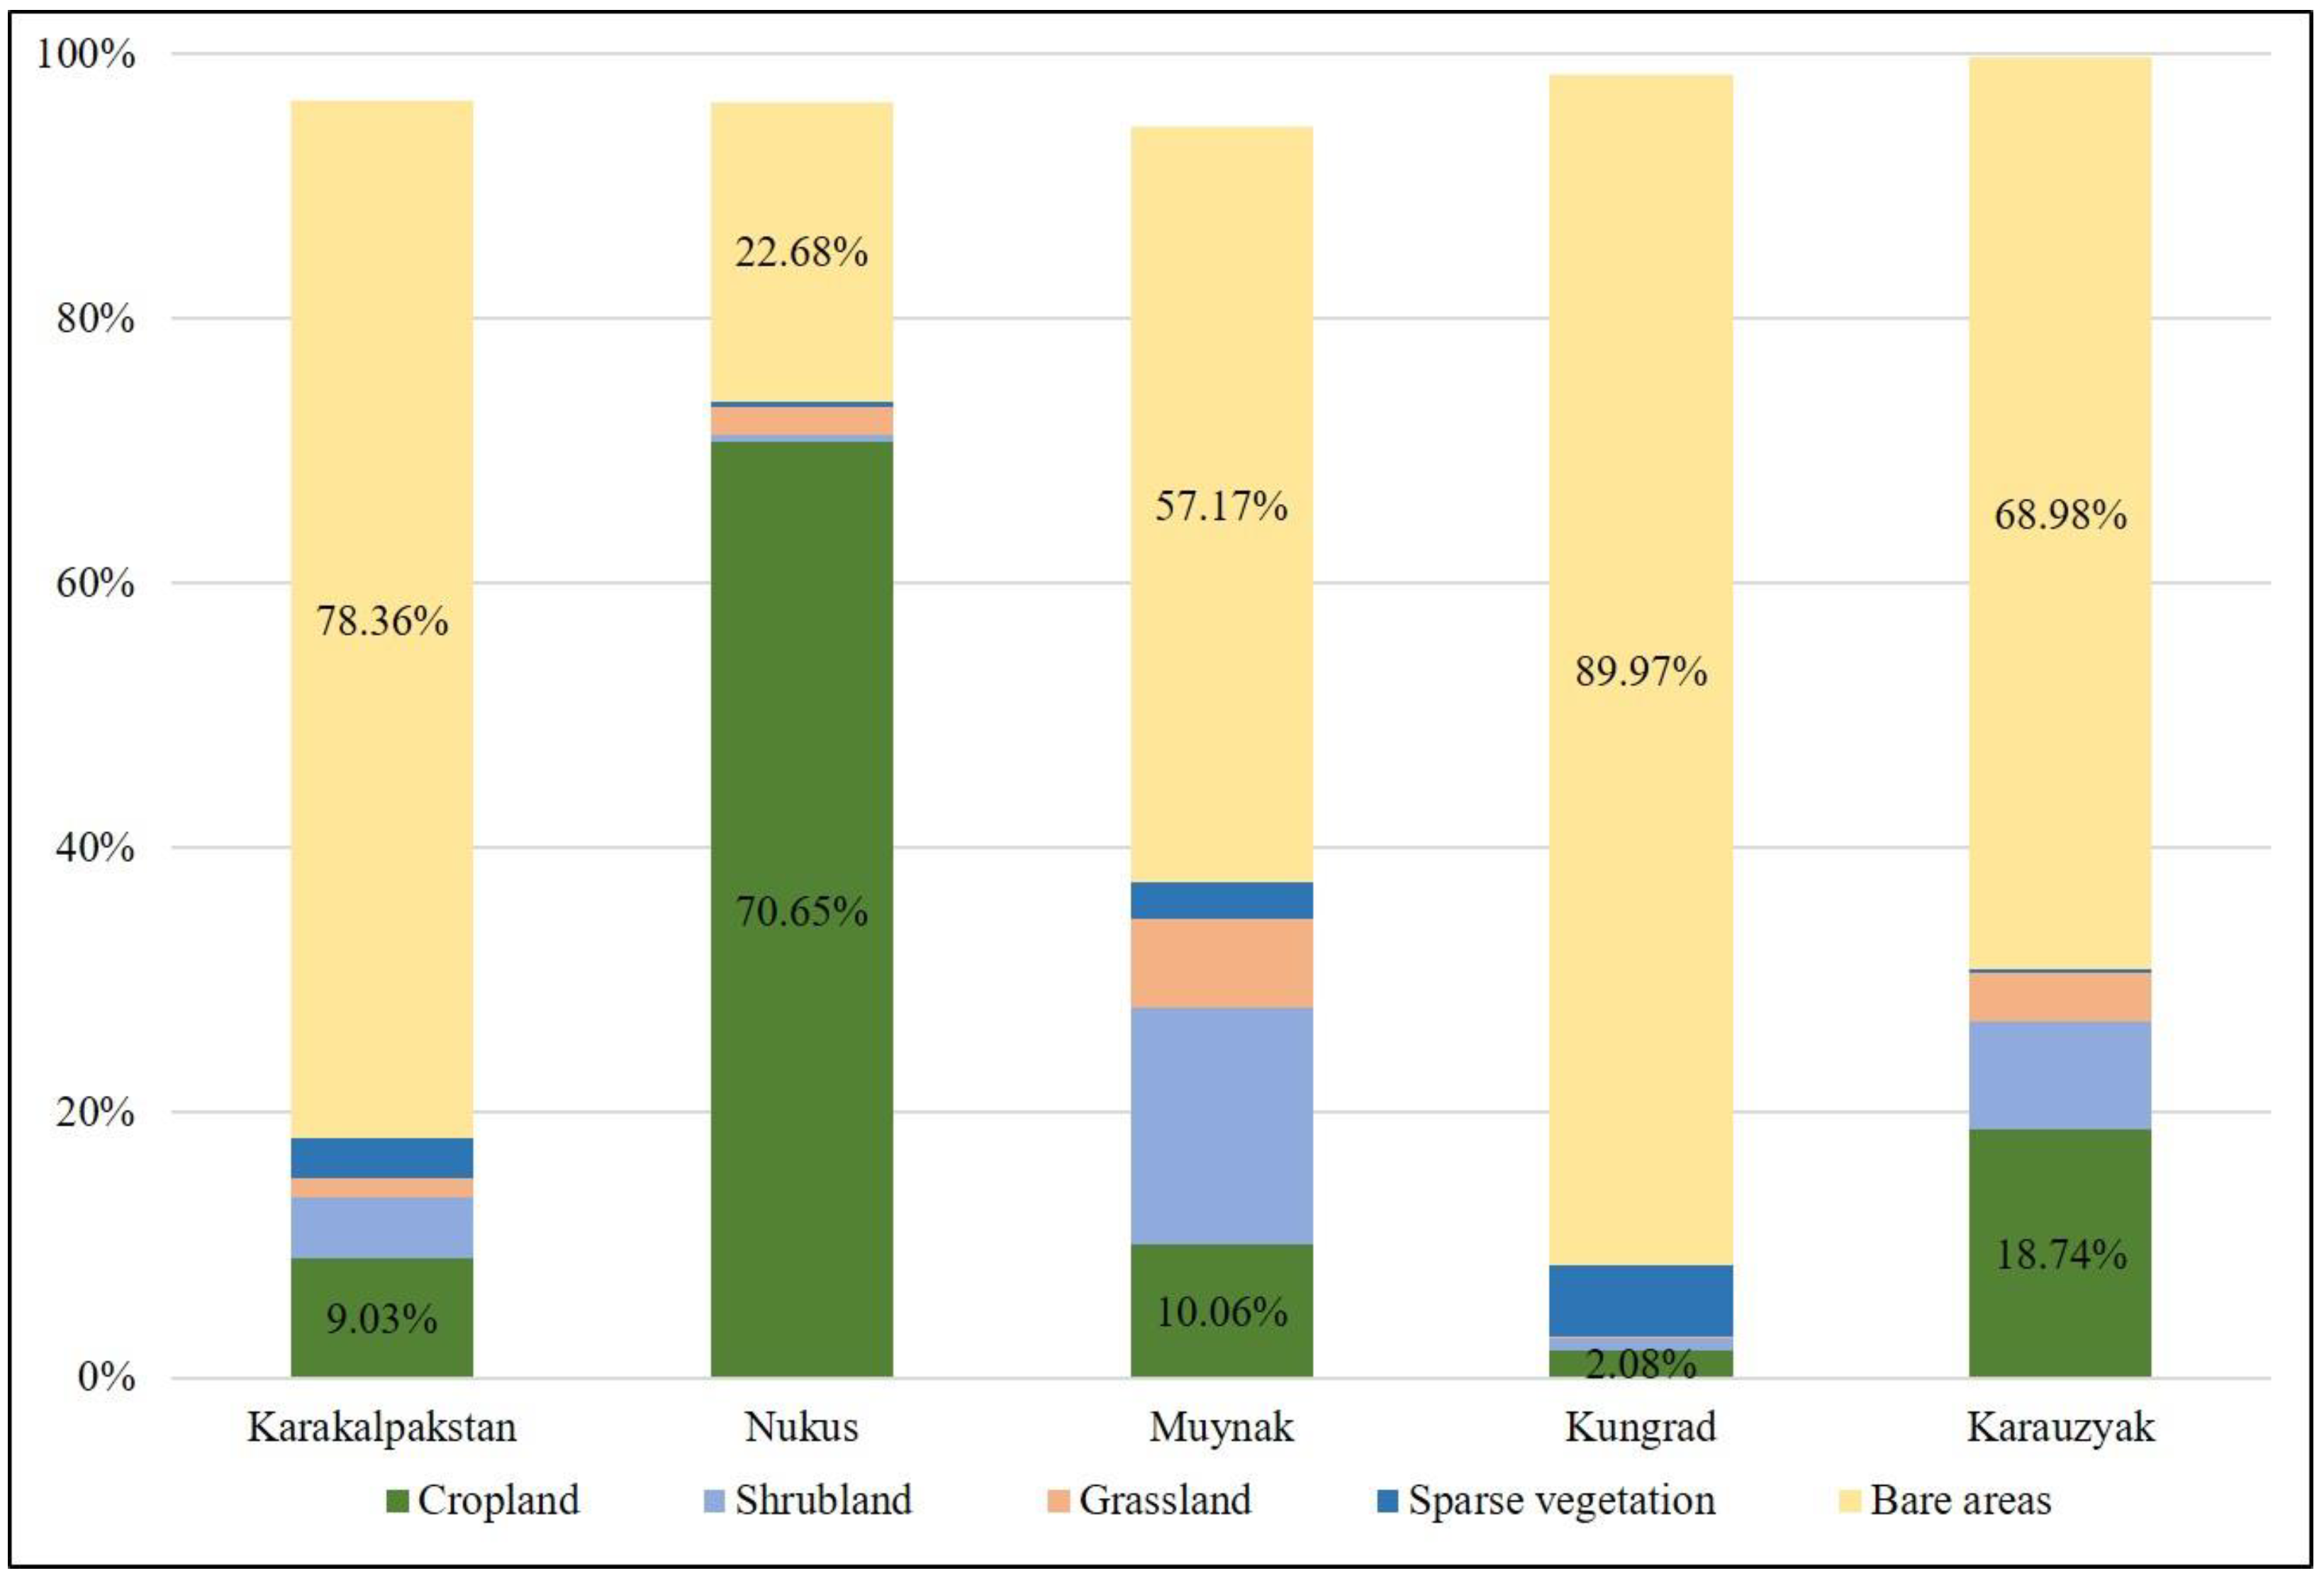
The land cover types in the study area are mainly cropland and bare areas (Figure 3), in which the groundwater varies differently. Cropland is primarily distributed around the Nukus district, and the rest is mostly bare areas. There are four main irrigation areas in the Amu Darya Delta, including Suenli, Kattagar-Bozatau, Kizketken-Kegeyli, and Kuanish Jarma, while their locations could be seen in Figure 6. According to acreage, land use type, variation characteristics, etc., four representative districts were selected for further analysis in this study. Nukus district is the capital of Karakalpakstan, where the most intensive human activities happen. Muynak district is closest to the Large Aral Sea, where the groundwater level has fallen the fastest from 1999 to 2017. Kungrad district covers the largest area in Karakalpakstan and mostly are bare areas. Part of the Karauzyak is an irrigation area, where groundwater levels have risen the fastest from 1999 to 2017.
2.2. Dataset
The monthly regional average groundwater depth from 1999 to 2017 at the Karakalpakstan was acquired from the Centre of Hydrometeorological Service of Uzbekistan. It was applied to estimating the trends of spatial-temporal variation. The data series of regional groundwater average was calculated basing on all wells within the district. The correlation between the groundwater dynamic and the joint effect of climate change and human activities was calculated by adopting the hydrometeorological data and remote sensing data. The hydrometeorological data, including the upstream runoff, the volume of irrigation water, the water level of the Large Aral Sea, was supplied by the local measurement of the Centre of Hydrometeorological Service of Uzbekistan. Among them, the upstream runoff data was represented by the nearest station (Samanbay station) to the study area. Remote sensing data includes the NDVI, the ET data, and the land cover data. The NDVI data are MODIS/MODIS13A1 datasets from 2000 to 2017 provided by the United States distributed data center for land processes (https://ipdaac.usgs.gov). The spatial resolution is 500 m and the temporal resolution is 16 d. The downloaded NDVI dataset is a 16-day synthesized L3-level data product, which has been pre-processed by radiation correction, atmospheric correction, and geometric correction. The maximum synthesis method is used to further eliminate partial interference cloud, atmosphere, and sun altitude angles. This paper mainly deals with the following data: the MODIS projection conversion tool MRT (MODIS Reprojection Tool) is used to splice, convert the projection type, and format the remote sensing images [22]. The ET data are Landsat TM/ETM/OLI and Landsat 8 products. The data were acquired from XIEG (the Key Laboratory of Remote Sensing and Geographic Information System, the Xinjiang Institute of Ecology and Geography, Urumqi, China), Chinese Academy of Sciences [23]. Considering the interference of cloud on data accuracy, the ET data were from the growing season (April to October) of 2000, 2005, 2010, 2012, and 2015. The XIEG calculates ET in the study area using the SEBAL (Surface Energy Balance Algorithms for Land) model. The SEBAL model is a typical method for ET inversion using remote sensing imagery based on the principle of energy balance. The model assumes that there are cold and hot limit pixels in the study area, which takes the spatial heterogeneity of the arid land into account, therefore, the SEBAL model has been widely used in remote sensing ET estimation in arid land [24]. To identify the type of land use, this study adopted the data of land cover classification map in 2015, while the spatial resolution is 300 m (http://esa-landcover-cci.org).
2.3. Methods
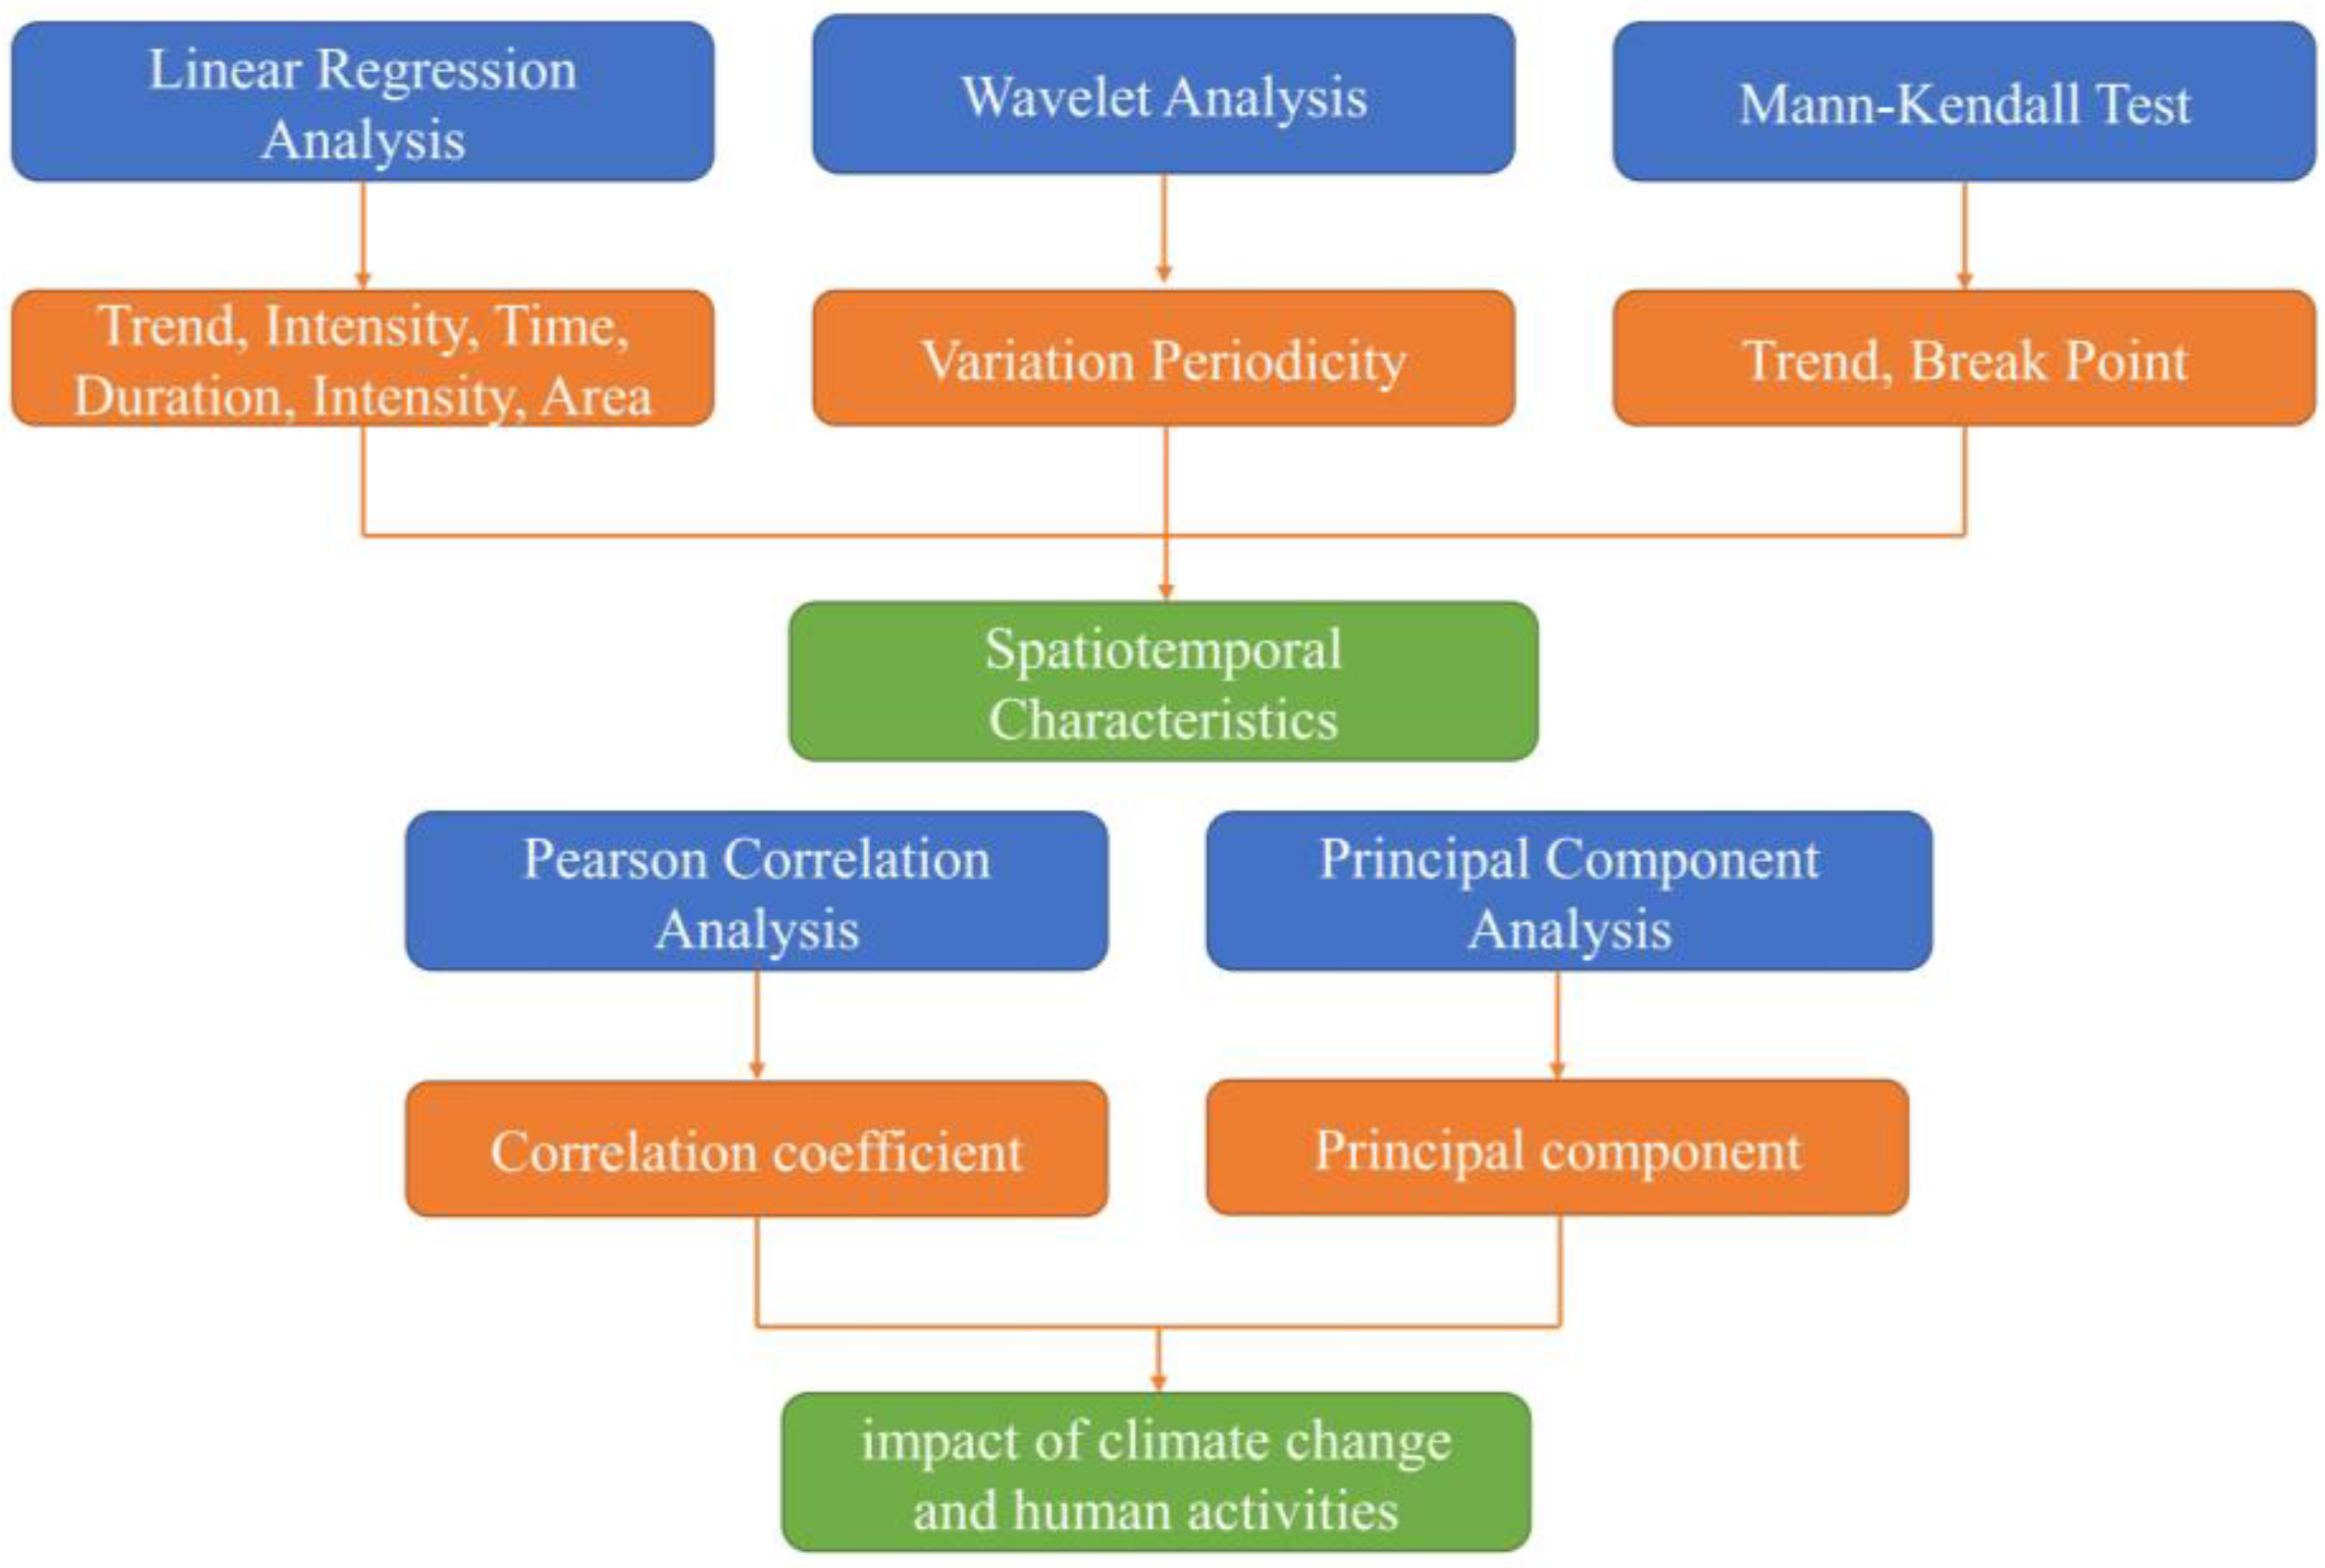
The Linear Regression Analysis is used to reveal the variation trend and intensity of groundwater level in time series. The Wavelet Analysis has been applied to identify the significant fluctuation period and extract useful information from the raw data [25,26,27,28,29]. The Non-Parametric M–K test was used to analyze the trends in the long-term groundwater level data [21,30,31]. Pearson Correlation Analysis is commonly used to analyze the relationship between two random variables [32,33]. To further identify factors that influence groundwater level in the study area, a PCA based on the five selected meteorological and hydrological parameters from the groundwater level dataset of 1999–2017 was performed [34]. Each method has a different focus while combining the results will give a comprehensive understanding of the groundwater system in the Amu Darya Delta (Figure 4).
2.3.1. Trend Analysis
For estimating the trend and intensity of groundwater levels on the time scale, linear regression analysis was adopted. The slope of the fitted equation can represent the variation trend of the groundwater level. A positive slope () represents a decreasing trend, while a larger absolute value of the slope suggests a faster reduction rate and vice versa. The definition of the statistic index is calculated as
In the formula: x is the groundwater level, is the average value of the groundwater level, y represents the y-th year (1999–2017, y is from 1–19), represents the average value of y. represents the slope of the trend line [35].
2.3.2. Wavelet Analysis
The wavelet analysis method has the characteristics of multi-resolution analysis in the time-frequency domain. Both can characterize multi-scale detailed analysis on the signal to obtain the change of each frequency with time and the relationship between different frequencies, so it is widely used in analyzing hydrological time series [36,37,38].
Compared with the real wavelets, complex wavelets can be more accurate in reflecting the periodicity of each scale of the hydrological sequence and the distribution of these periods in the time domain. The modulus of the complex wavelet transform coefficient indicates the strength of the characteristic time scale signal, and the real part represents the strength and phase information at different times. Therefore, complex wavelet analysis was chosen for periodic analysis of the groundwater level data series. The basic idea of wavelet analysis is to use a cluster of wavelet functions to represent or approximate a specific signal or function [25]. The Morlet wavelet is defined as
where is the dimensionless frequency and is dimensionless time. Strech the wavelet by varying its scale (), so that , and normalized to unit energy. The Morlet wavelet analysis () with time-frequency multi-resolution function, provides a good balance between time and frequency localization. The basic objective of the continuous wavelet transform (CWT) is to identify the main oscillations of signals in the time-frequency domain. The wavelet function is the key to wavelet analysis. It refers to a class of functions that are oscillating and quickly decay to zero. The CWT of time series (), sharing a uniform time step , is defined as the convolution with a shifted and scaled factor of and normalized wavelet. The CWT is shown as below:
The basic principle of wavelet analysis can be known from Equation (3), that is the low-frequency or high-frequency information of the signal is obtained by increasing or decreasing the scaling scale and then analyzing the profile or details of the signal to achieve different local time characteristics and spatial characteristics of the signal analysis [27]. In other words, CWT applies wavelet as a band-pass filter to time series. CWT can clearly reveal the various oscillation period hidden in the time series, fully reflect the variation trend of the system in different time scales.
Integrating the squared value of the wavelet coefficient in the domain can obtain the wavelet variance, it can be written as
It can be known from Equation (4) that it can reflect the distribution of the energy of the signal fluctuation with the scale . Therefore, the wavelet variance figure can be used to determine the relative intensity of different scale disturbances in the signal and major time scale, which is the main period. The MATLAB package of wavelet analysis is provided by Grinsted [26].
2.3.3. Non-Parametric Mann–Kendall Test
The M–K test is usually used to detect a series of trends in the long term of environmental data, climate data, or hydrological data [39]. The main advantage of the M–K test is that the sample does not need to obey any particular statistical distribution. The original hypothesis (H0) of the M–K test is that in the sample analyzed, there is no trend or serial correlation with the alternative hypothesis (H1), which assumes an increase or decrease in the monotonic trend.
The M–K test statistic is calculated as follows:
When , the absolute value of is directly compared with the theoretical distribution of derived by M–K. Positive values of indicate an upward trend, while negative values indicate a downward trend. When , the statistic is normally distributed with a mean of 0.
The variance statistic is calculated as follow:
If , the standard normal distribution system variable is given as
The statistic is standard normally distributed. If , it means an increasing trend, if , it means a decreasing trend. Testing for monotonic increases or decreases, a bilateral trend test at α level of significance is used. If , then the null hypothesis (H0) is rejected, which is “there is no trend in time series of groundwater levels” [40]. If , the sample passes the significance test at a confidence interval of 95%.
Another test statistic can be calculated by building a column order:
The statistical variables are calculated as follows:
The is standard normally distributed when , it indicates an obvious trend that happened in the sequence. Reverse time series and performing the corresponding calculations will produce the following results:
By combining the and , groundwater level trends, and breakpoints can be clearly identified. If , it means an upward trend, if , it means a downward trend. When the value exceeds a critical straight line (+1.96, −1.96), it indicates a clear upward or downward trend. If the and curves have an intersection and were within the 95% confidence interval, this indicated that the groundwater level trend has mutated at this point.
2.3.4. Pearson Correlation Analysis
The dynamic change of groundwater is a complex natural process, human activities and climate change have a huge impact on them. The Pearson correlation analysis [32] is usually used to analyze the degree of correlation between the two random variables by calculating the correlation coefficient. In this study, factors considered to have an impact on groundwater levels are the upstream runoff, irrigation water, NDVI, evapotranspiration, and the Large Aral Sea level. Pearson’s correlation coefficient is calculated as follows:
The is Pearson’s correlation coefficient, the and are the values of two factors. The value of the correlation coefficient is between −1 and +1. The positive values indicate a positive correlation, while negative values indicate a negative correlation. The closer the absolute value of the correlation coefficient to 1, the stronger the correlation is. The closer the absolute value of the correlation coefficient to 0, the weaker the correlation is [33]. The Pearson correlation analysis is performed with SPSS Statistics (version 24.0; SPSS Inc., Chicago, IL, USA).
2.3.5. Principal Component Analysis
PCA is a bilinear model based on constructing common variables, which are linear combinations of the original variables [41]. These factors are called principal components (PCs) and are used to extract hidden structures from the raw data. PCs interpret the direction of the maximum variance under the constraint of orthogonality. PCA can analyze a large number of samples characterized by multiple variables simultaneously, so it is often used to extract variables in hydrological studies [42]. Variable extraction is done by compressing multi-dimensional variables into a low-dimensional form of new unrelated variables, explaining the largest variance of all original variables [43]. In this study, PCA was implemented in the factor analysis, and the factor is an upstream runoff, irrigation water, NDVI, evapotranspiration, and water level of the Large Aral Sea. The PCA analysis is performed with SPSS Statistics.
3. Results
3.1. Spatial-Temporal Variation of Groundwater Level
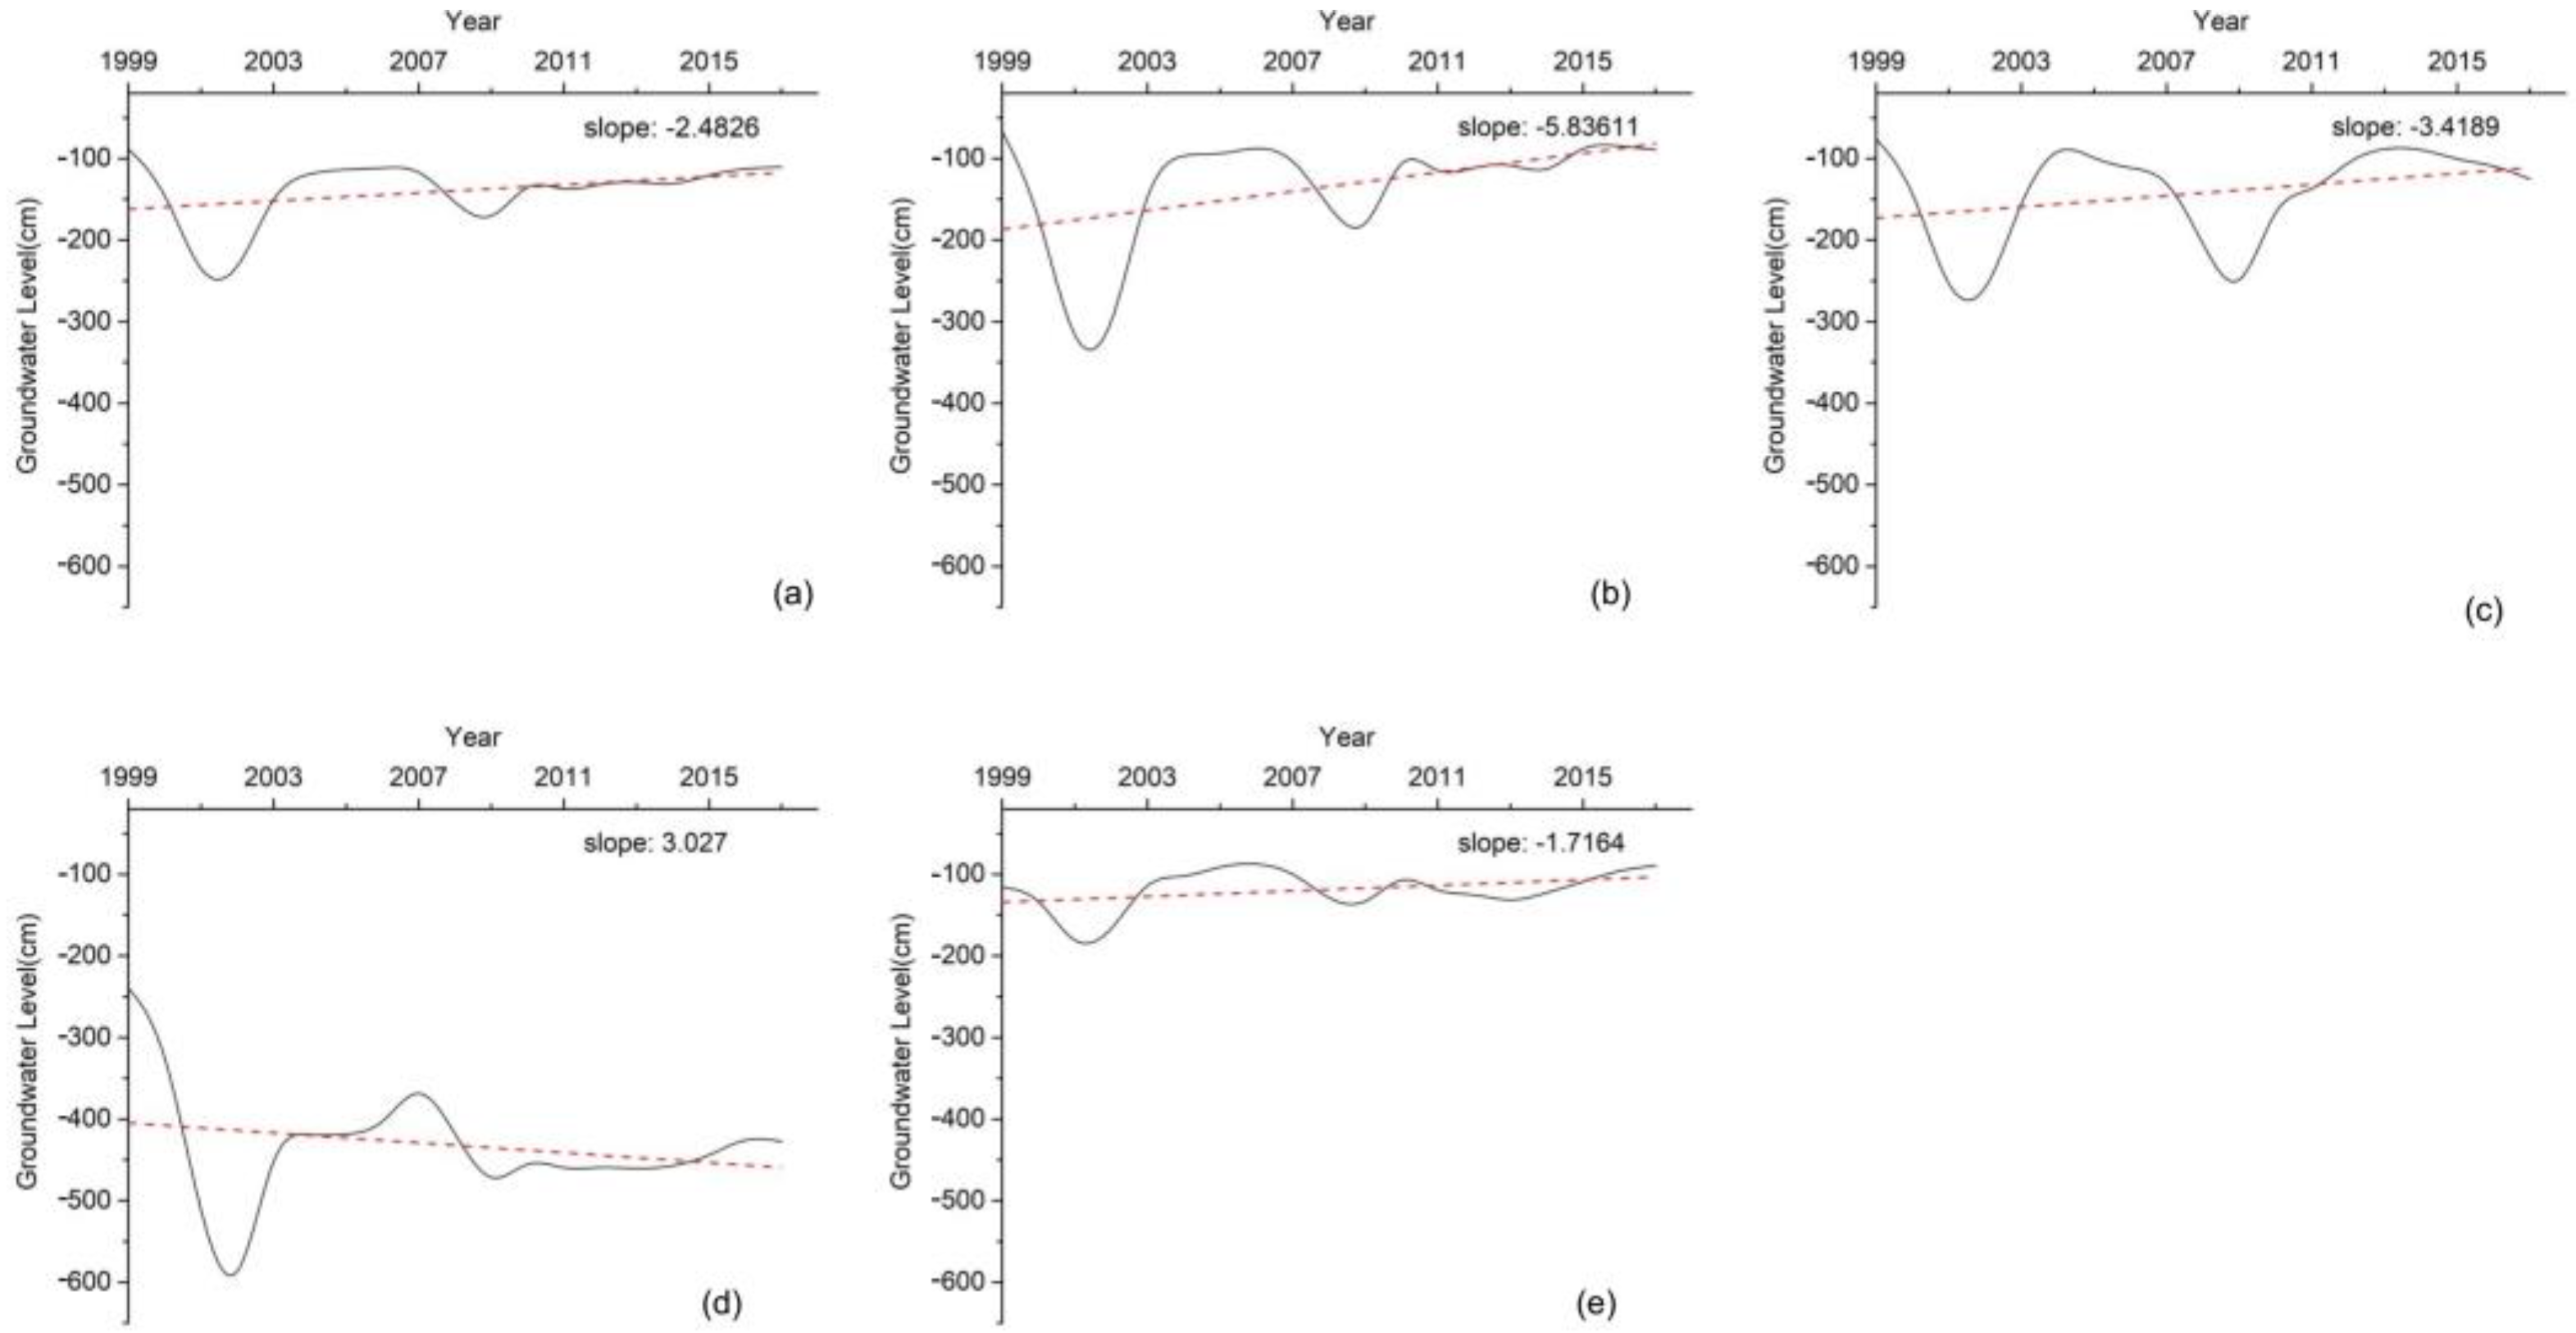
To understand the spatial-temporal variation characteristics of the groundwater level in the Amu Darya Delta, the regional mean of the groundwater level from 1999 to 2017 was adopted in this study. The slope calculated by the trend analysis was used to indicate the direction of change and further calculate the F test’s confidence level. It shows that most regional groundwater levels increased with fluctuation, except three districts, which showed a decreasing trend (Figure 5). As can be seen, Karakalpakstan shows a significant increasing trend (p < 0.01), and the rate of increase is 24.83 mm/year. The district with the fastest groundwater level increase is Karauzyak, where it reaches 58.36 mm/year (p < 0.01). However, the significant decreasing trend (p < 0.01) was shown in three other districts, separately Muynak, Beruniy, and Amudarya, with a decreasing rate of 30.27 mm/year, 10.41 mm/year, and 5.52 mm/year, respectively. From 1999 to 2002, groundwater in Amu Darya Delta dropped rapidly. Among the districts, the Muynak dropped from −239 cm to −643 cm, and the Karauzyak dropped from −67 cm to −352 cm. From 2002 to 2004, groundwater in most areas recovered to 1999 levels, but Muynak only recovered to −421 cm. In contrast, Karauzyak recovered to −92 cm. The groundwater experienced another sharp decline from 2007 to 2009, while from 2009 to 2010 it bounced back to the level of 2007. The fluctuation range is smaller than that from 1999 to 2004, while Muynak did not return to its original level after these two fluctuations.
To further analyze the spatial variation of groundwater level variations in the Amu Darya Delta, Figure 6 shows the spatial distribution of the slope rate. As can be seen, the groundwater in the irrigation area basically follows an increasing trend, except Muynak, which shows a declining trend. Moreover, the groundwater level of the two non-irrigation areas where the Amu Darya River flows through shows a declining trend. Besides, in the center of the irrigation area, the groundwater keeps stable, and in the bilateral, the groundwater variates more quickly. It can be concluded that the variation of groundwater level is closely related to the distribution of irrigation areas.
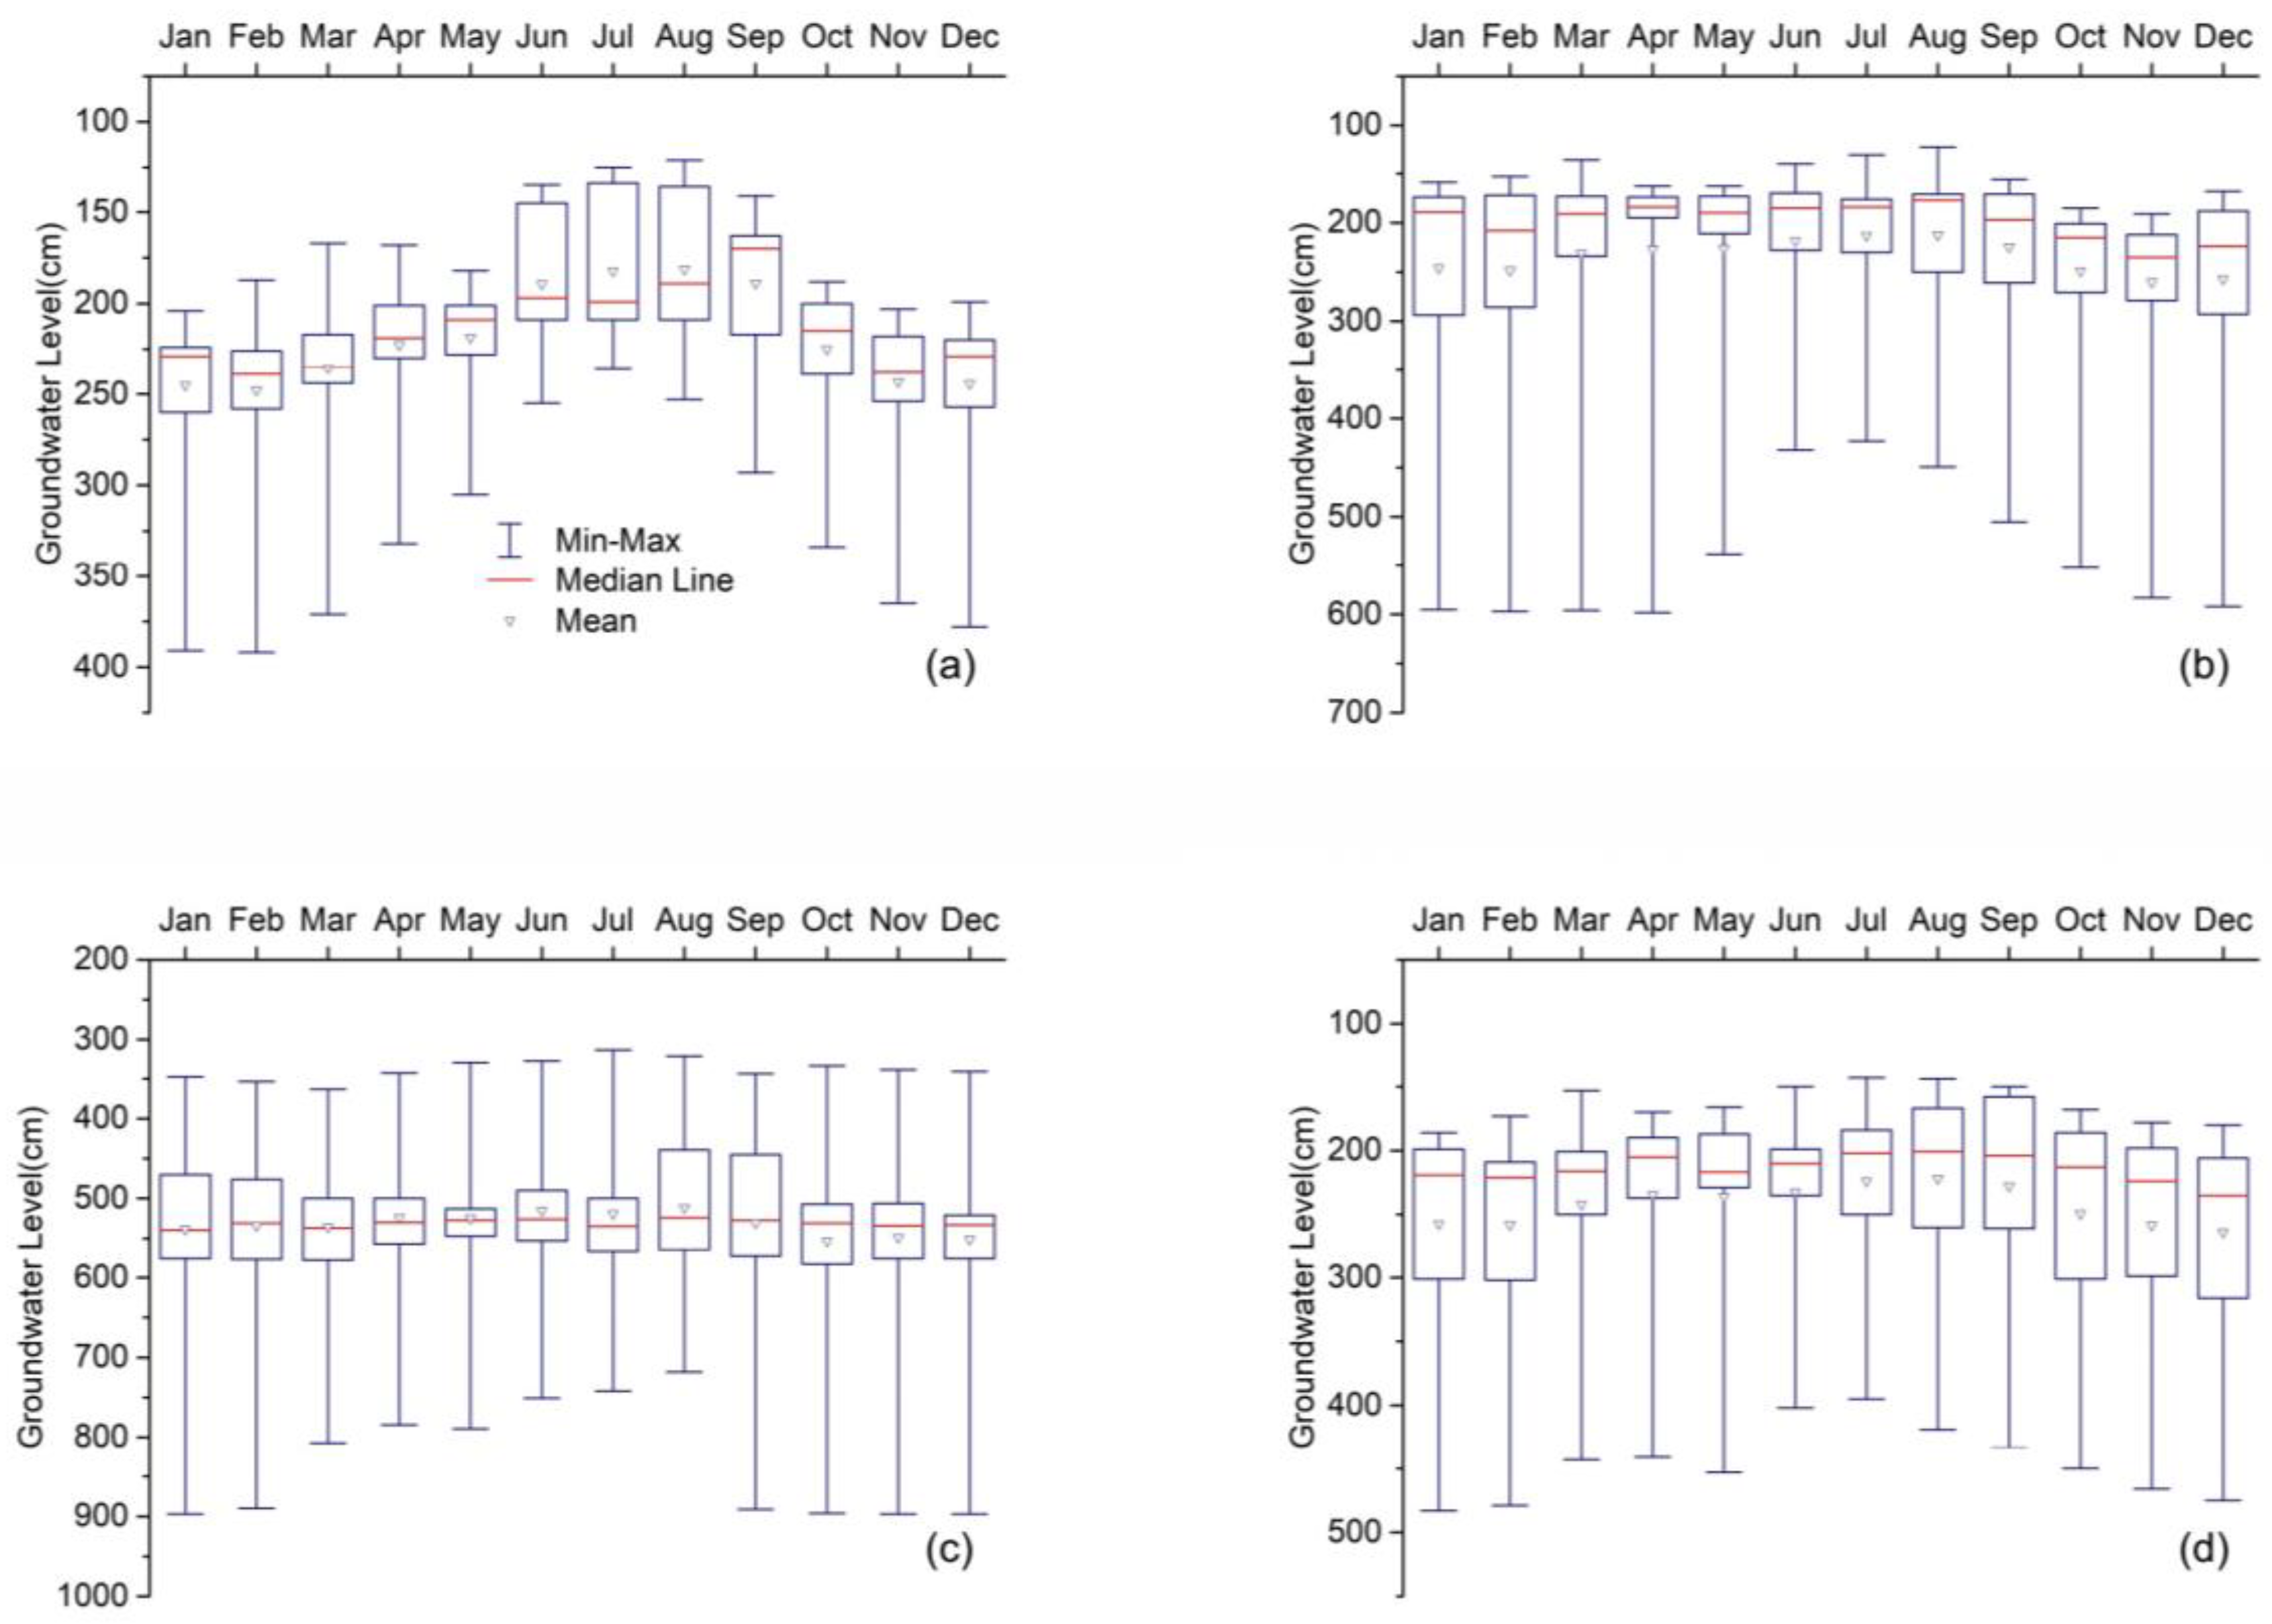
To understand the variation characteristics of groundwater levels on a monthly scale, the box plot was adopted to show the variation range in each month in the past 19 years. As shown in Figure 7, the data distribution in Nukus is different from other districts. Both its upper and lower limits of June, July, and August are higher than in other months, while the interquartile range is also broader. In general, the distance from the lower limit to the median is much greater than the distance from the upper limit to the median.
3.2. Periodic Analysis of Groundwater Level
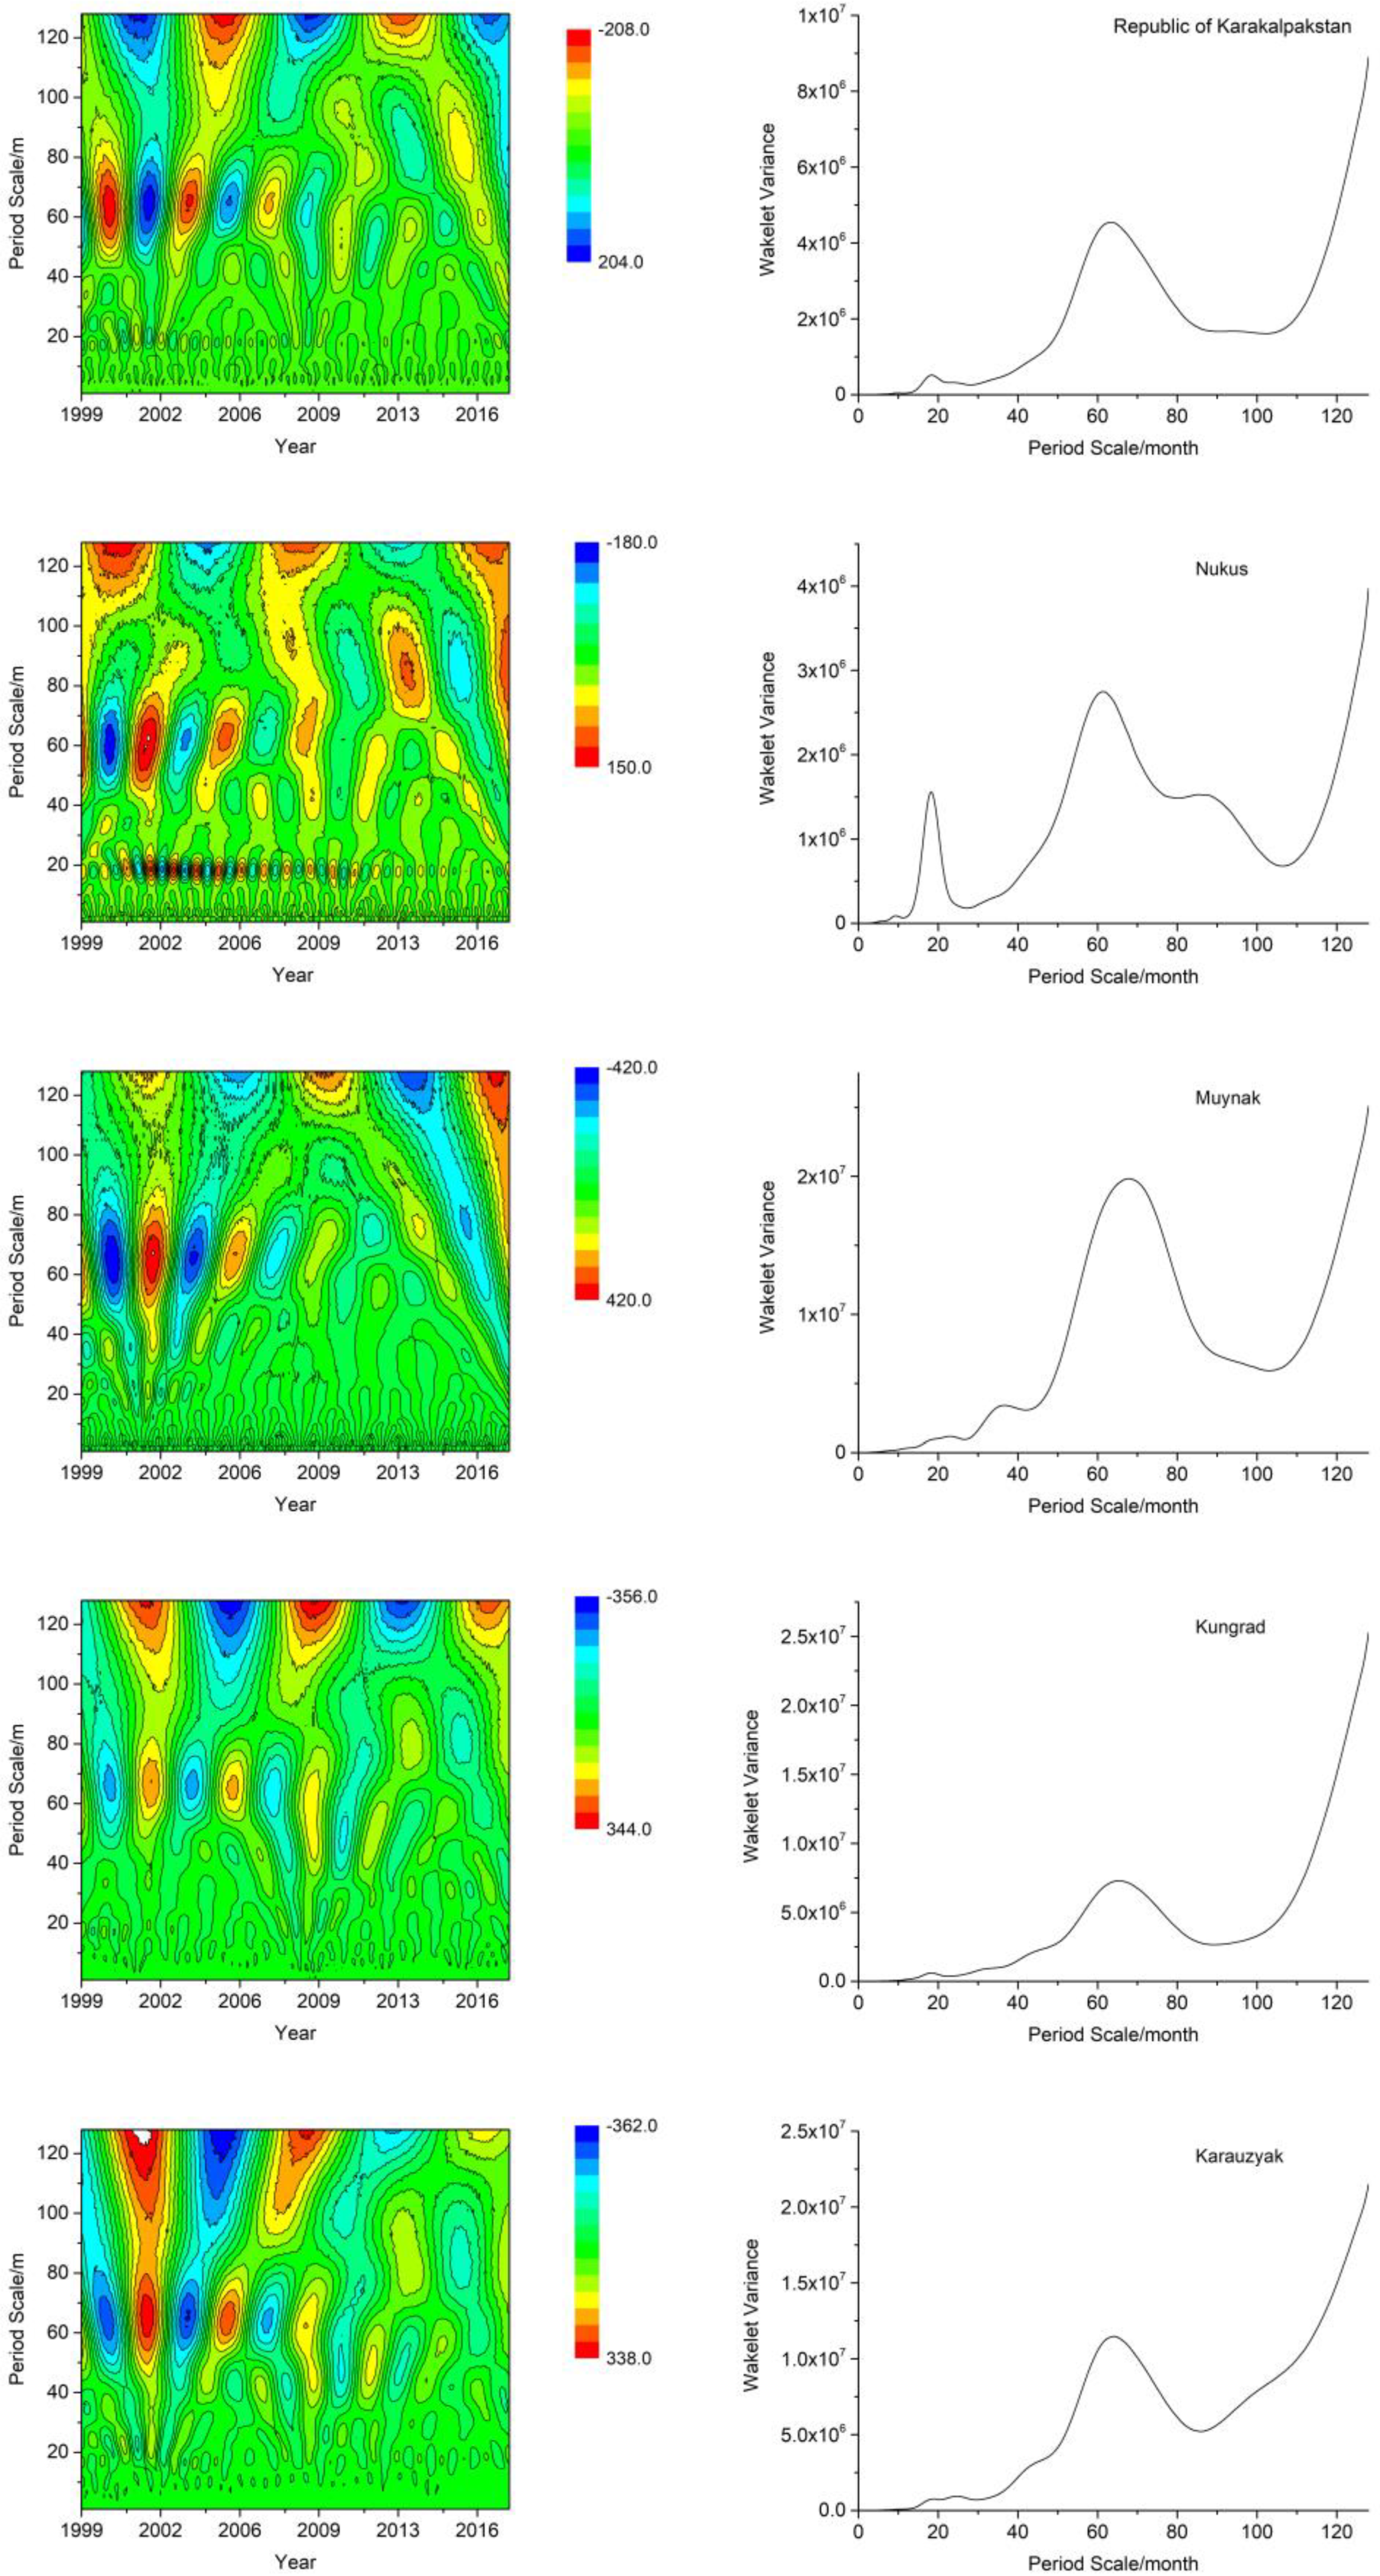
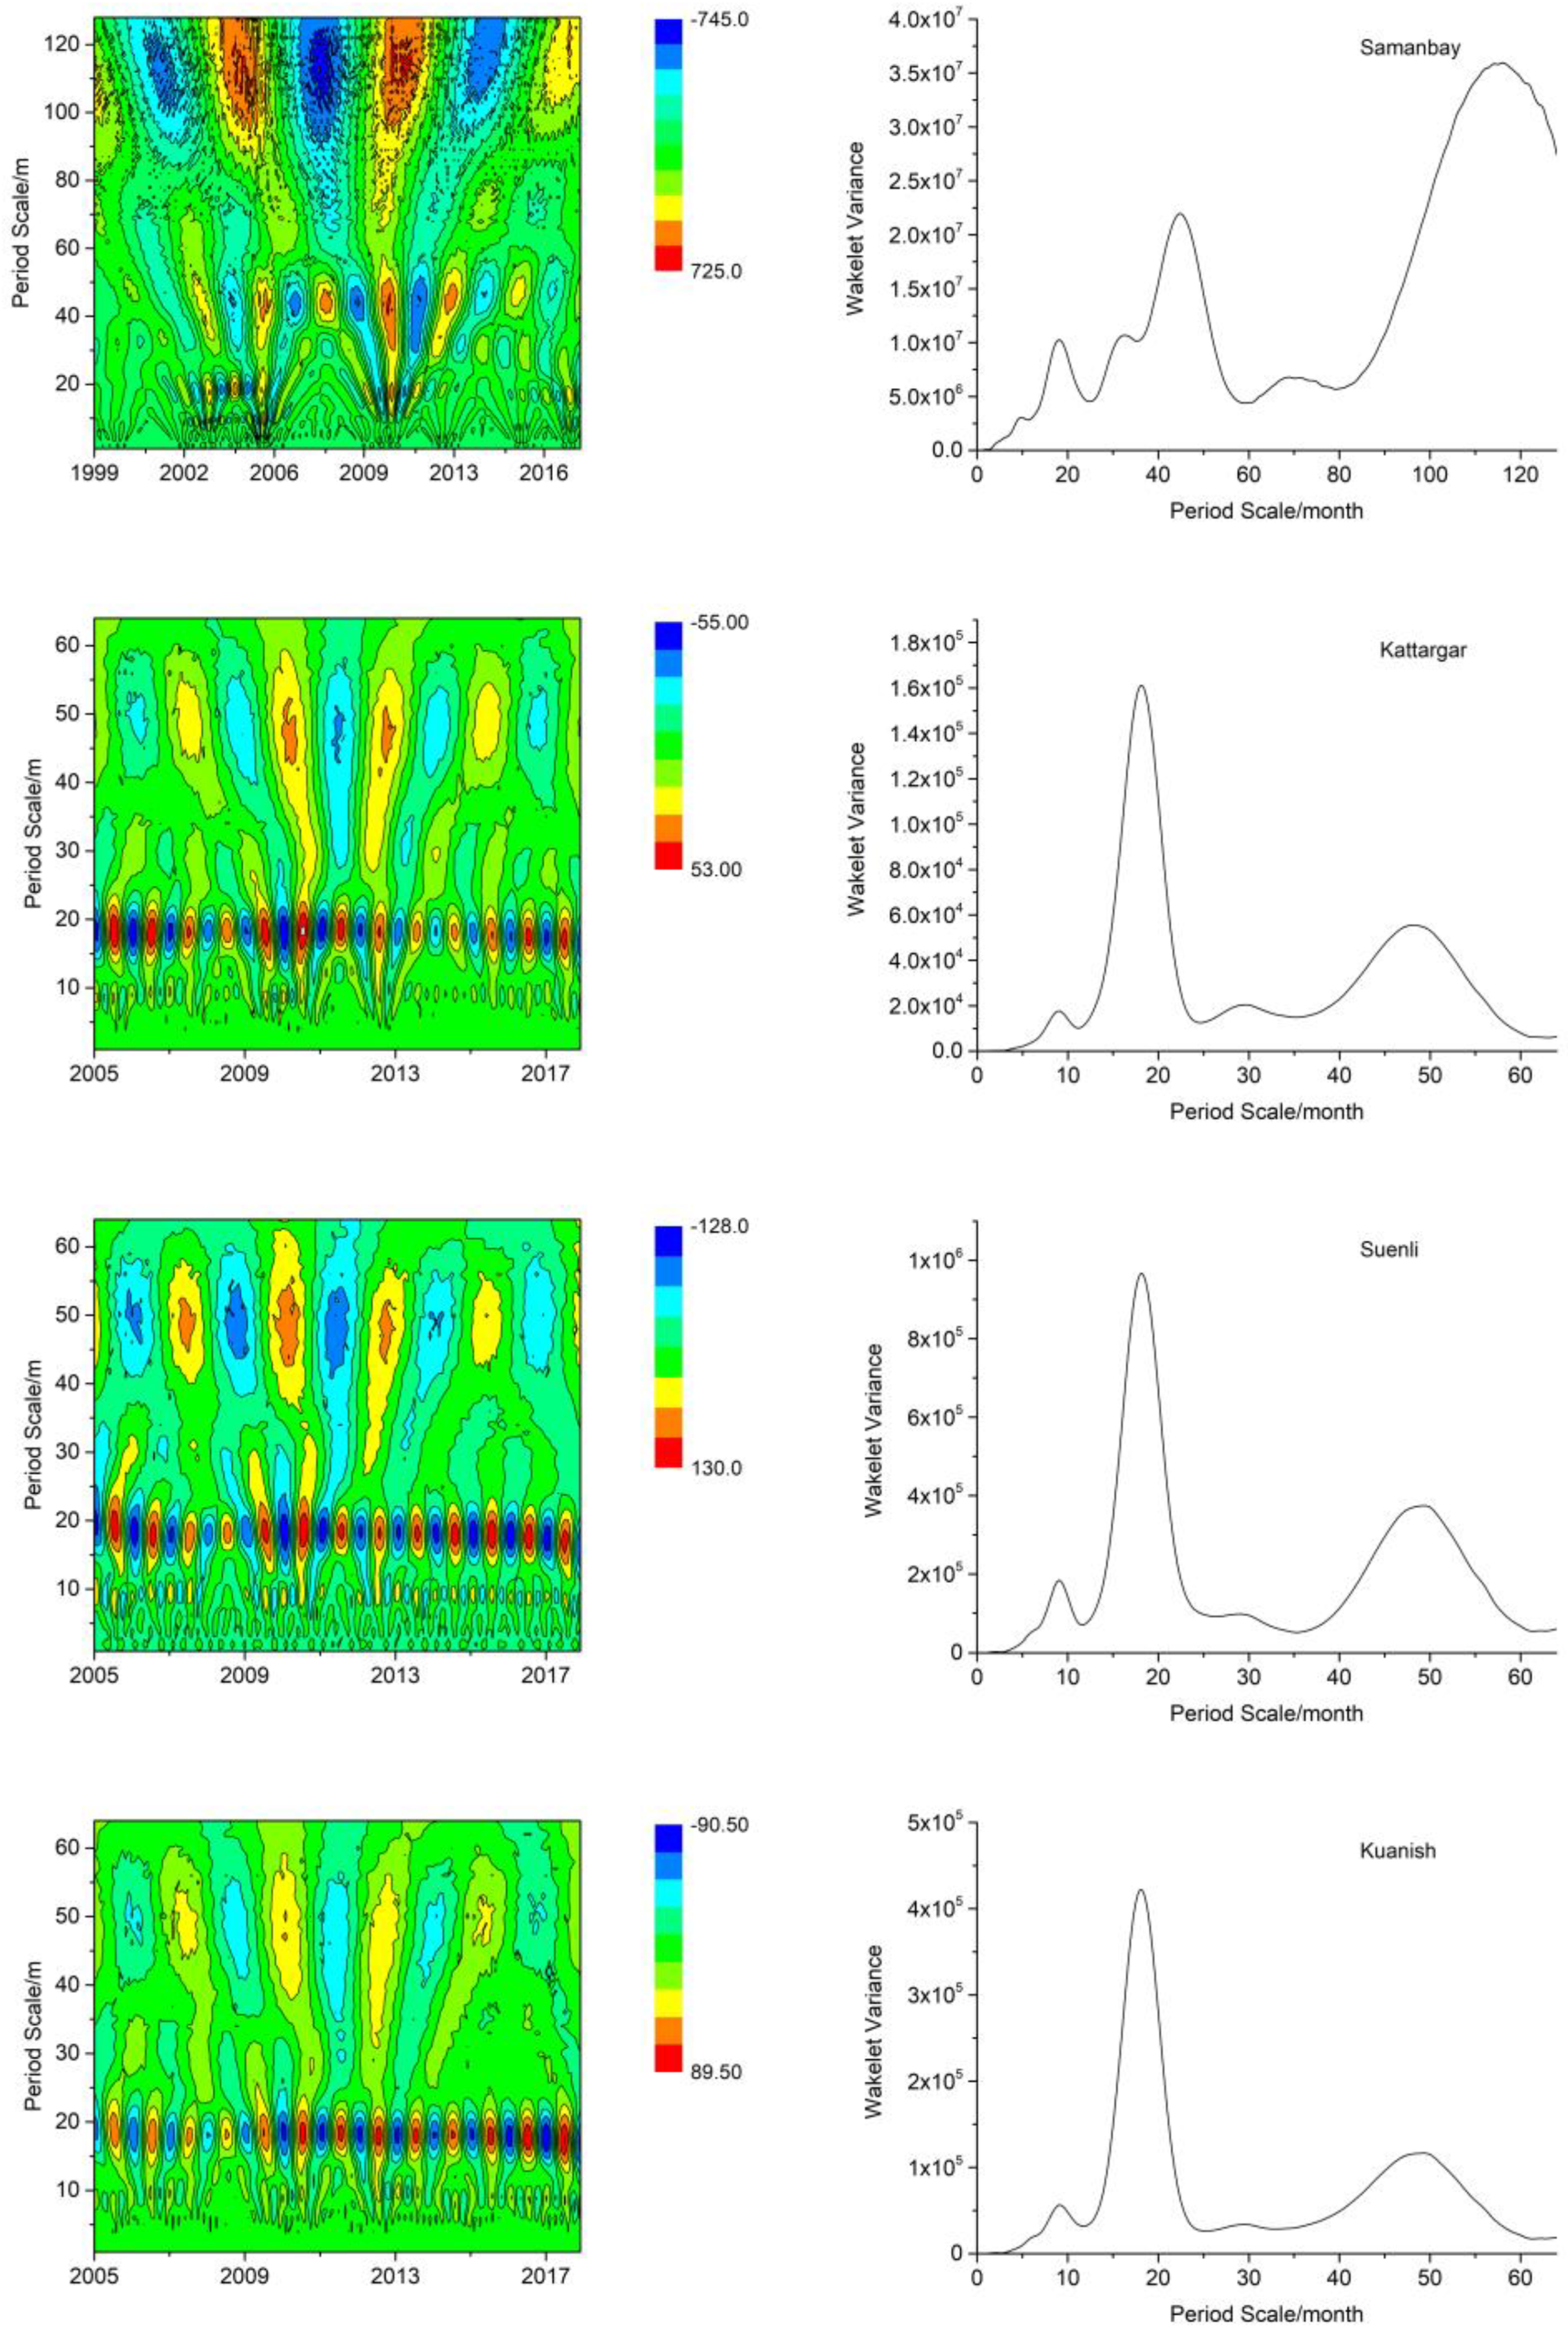
To further identify the periodic components of the Amu Darya Delta hydrological sequence and its distribution in the time domain, Morlet wavelets function with the good locality in the time domain and frequency domain are selected in this study for periodic analysis of the monthly mean groundwater level sequence. The periodic oscillation characteristics of the groundwater level in the Amu Darya Delta on different time scales from 1999 to 2017 are shown in Figure 8. The groundwater level in the study area generally exhibits a small-scale nesting under a large-scale feature. Combining the contour plot of the real part of the wavelet coefficient and the plot of the variance of the wavelet, it can be seen that there is a large period of 64 months and a small period of 18 months in the four study areas, as well as the entire Amu Darya Delta. The 18 months period is most apparent in the Nukus (Figure 8), while the 64 months can be well captured in all. However, the conclusion on the 64 months period could be less solid as 18 months, as the whole study period (228 months) is less than fourfold of it. By the end of 2017, under the above-mentioned time scale, the contours of groundwater level rise were not closed, indicating that the average monthly groundwater level in the study area will continue to decline.
To further analyze the relationship between the groundwater level and the influencing factors on the period, this study also performed wavelet analysis on runoff and irrigation water (Figure 9). The data from Samanbay station show that the runoff of the Amu Darya river mainly has a large period of 45 months and a small period of 18 months. By the end of 2017, under the above-mentioned time scale, the contours of runoff decline were not closed, indicating that the average monthly runoff in the Amu Darya river will continue to reduce. The data from Kattargar, Suenli, Kuanish irrigation area shows that the irrigation water has a large period of 47 months, a medium period of 29 months, and two small periods of 18 and 8 months. Among them, the 18 months had the largest amplitude and could be considered as the main period.
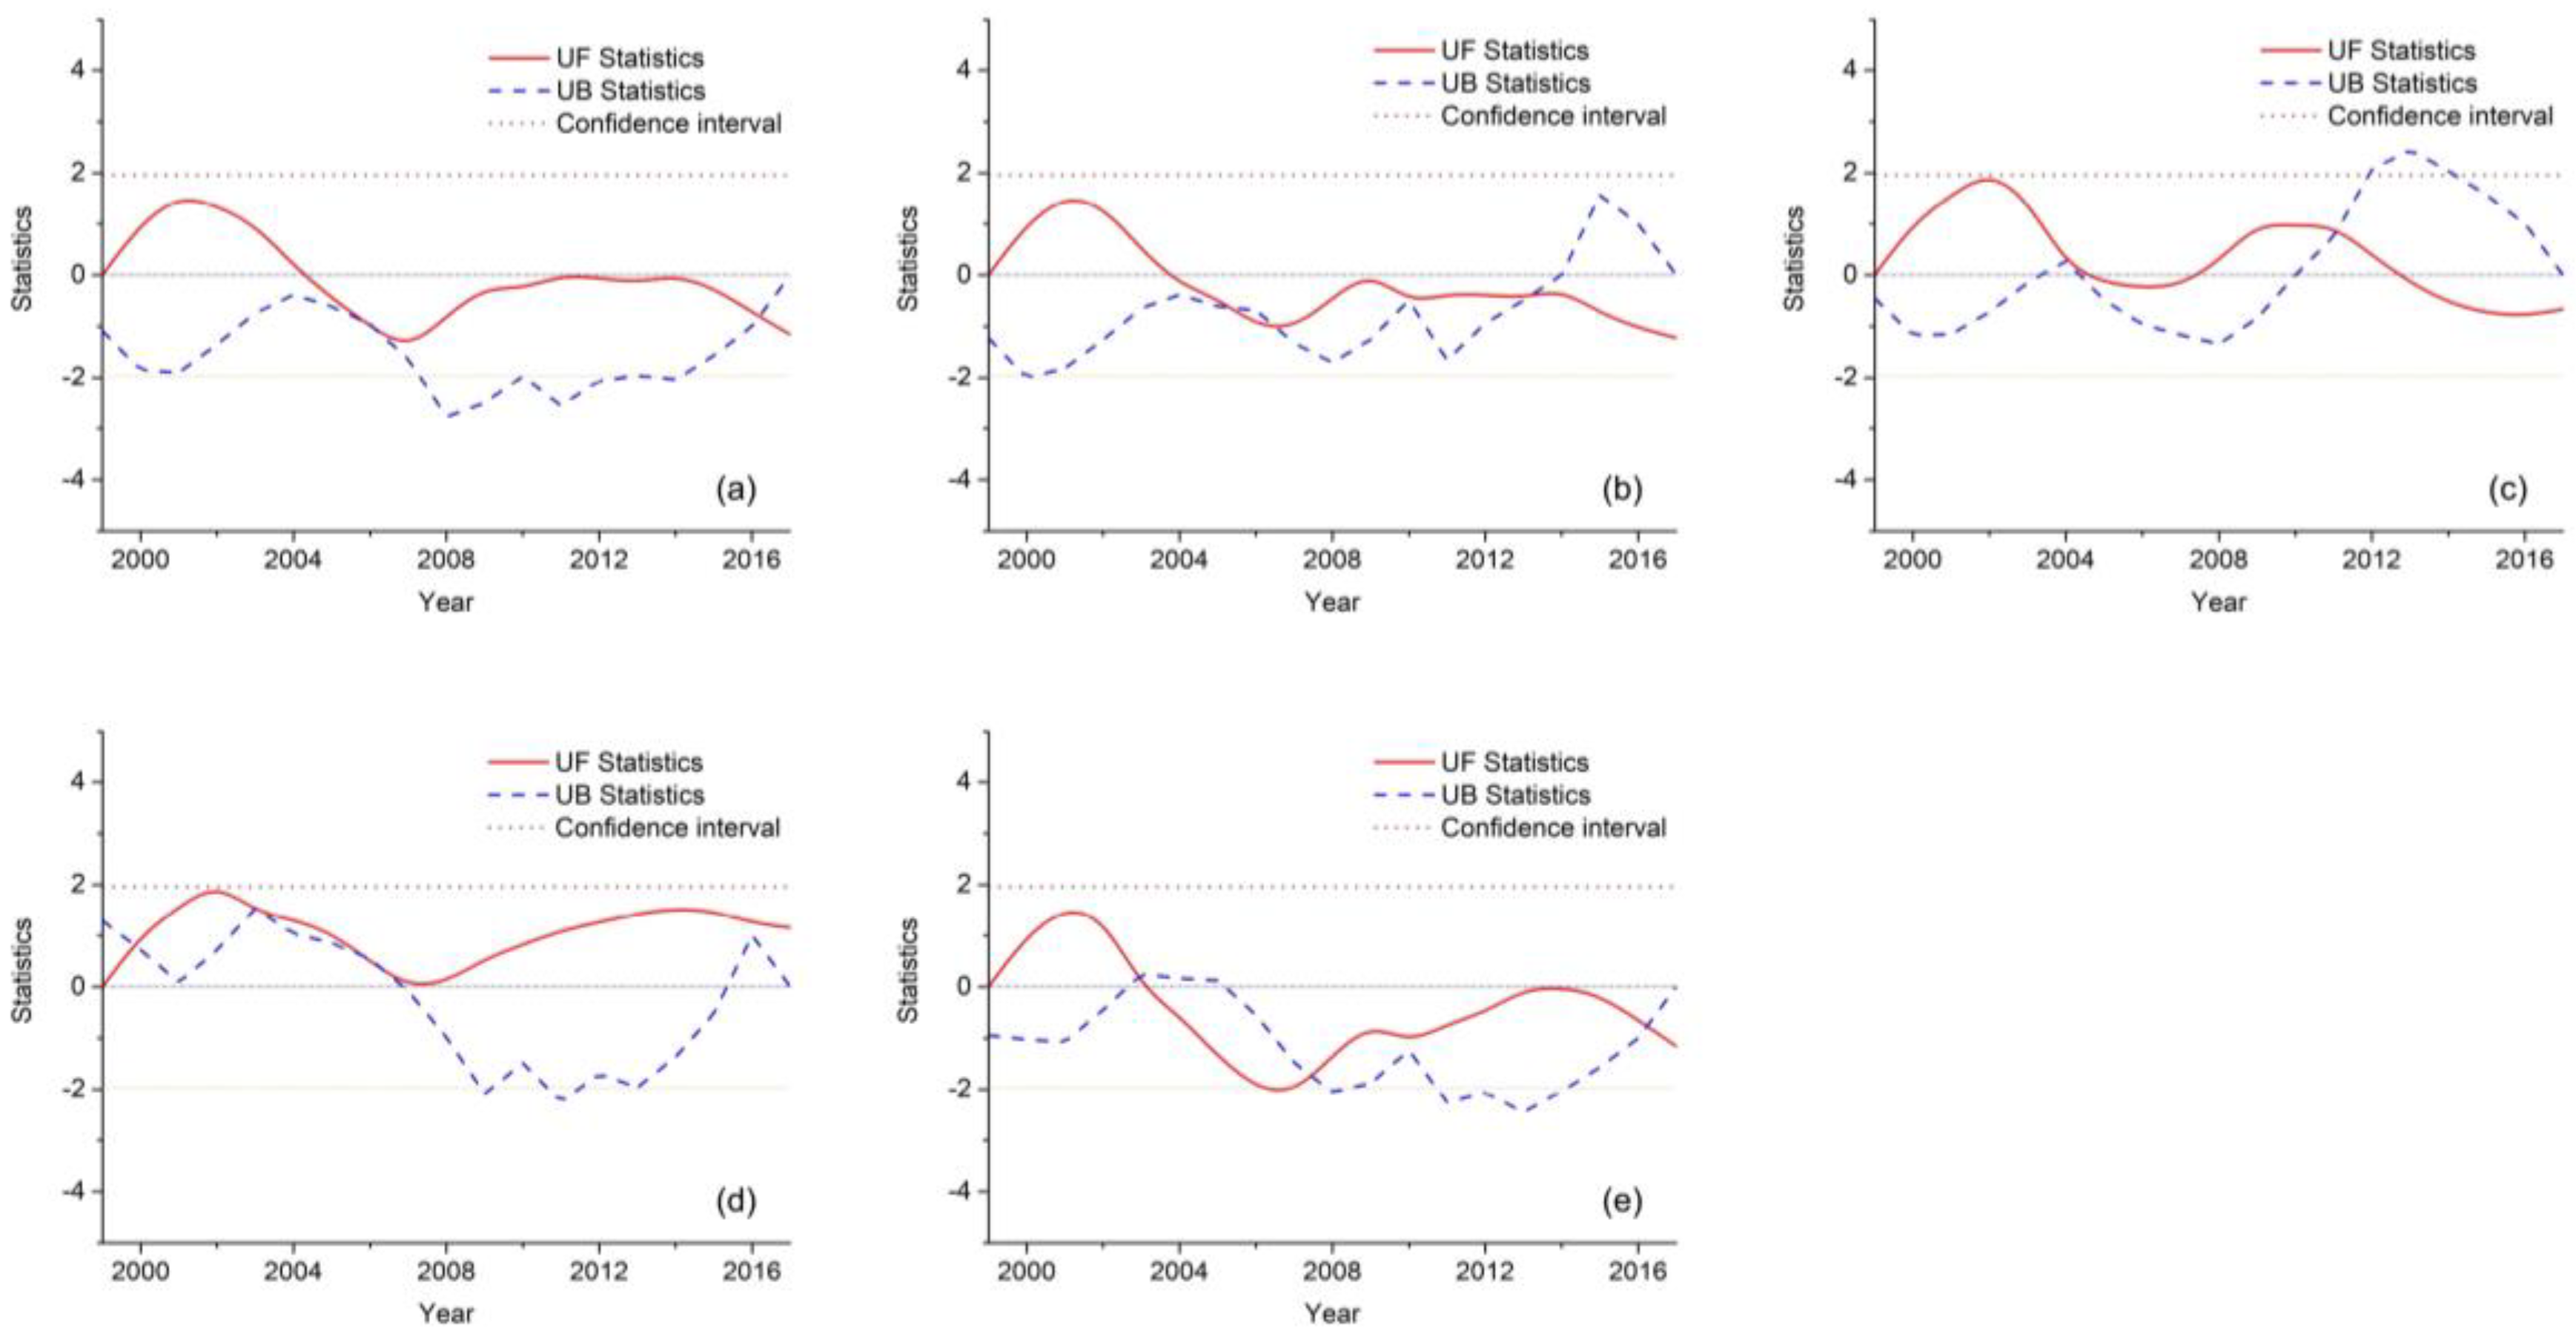
3.3. Mutation Analysis
The breakpoints of the groundwater level sequence in the Amu Darya Delta is tested by the M–K test. As this method does not require the samples to confirm a statistical distribution function, it has been widely used in hydrological variation test [44,45,46]. As shown in Figure 5, Karakalpakstan’s groundwater level continued to decline in 1999–2004, gradually rose in 2004–2017. Correspondingly, Figure 10 shows that the annual groundwater level appeared to mutate in 2006, 2016 (within the 95% confidence interval). At the same time, the M–K test was also applied to four typical districts in the study area. The groundwater level in Muynak district shows a continuous decline during 1999–2017 and appeared to mutate in 2000 and 2006. The groundwater level of Nukus fell in 1999–2003, rose in 2003–2017, and appeared to mutate in 2003, 2007, and 2016. The groundwater level of Kungrad fell in 1999–2004, 2007–2013, rose in 2004–2007, 2013–2017, and appeared to mutate in 2011. The groundwater level of Karauzyak fell in 1999–2004, continued rising in 2004–2017, and appeared to mutate in 2006 and 2013. All the above-mentioned points were within the 95% confidence interval.
In this study, the breakpoint of the groundwater level was indicated by the M–K test as 2007, 2013, and 2016. However, many factors cause various changes in the groundwater level, this study will explore the response of groundwater level to various influencing factors.
3.4. Pearson Correlation Analysis of Groundwater
To further analyze the impact of climate change and human activities on groundwater levels in different regions, the Pearson Correlation Coefficient method is selected to quantify the correlation of groundwater level on various factors. The analysis factors are the environmental characteristics of different regions, selected upstream runoff, irrigation water, NDVI, evapotranspiration, Large Aral Sea level. It can be seen in Table 1, Nukus is an irrigation area, where the groundwater level is highly correlated with upstream runoff (−0.406 *), irrigation water (−0.583 *), and NDVI (−0.581 *). Part of the Karauzyak is also in the irrigation area, and the groundwater level has a relatively weak correlation with irrigation water (−0.303 *). Due to Muynak is close to the Large Aral Sea, the groundwater level shows a relatively strong correlation with the Large Aral Sea level (0.355 *). Kungrad is located in bare lands, where the groundwater level shows a weak correlation with irrigation water (−0.222 *) and NDVI (−0.195 *). However, its correlation coefficient between the groundwater level (0.026) and evapotranspiration (0.221) does not pass the significance test.
3.5. Principal Component Analysis
To identify the main influencing factors of groundwater in the study area, we used the method of Principal Component Analysis. Eigenvalues indicate the degree of variation of the data in the principal components. The first three principal components of each area were 87.76%, 88.67%, 86.84%, and 87.18%. Therefore, other principal components can be omitted to reduce the dimension of the variable.
The new variables , , , , and are derived from the influencing factors and component coefficients. The expressions of the common factor for each area are as follows:
In the formula: is evapotranspiration; is Amu Darya river runoff; is irrigation water; is NDVI; is the Large Aral Sea water level. Because the explanations of PC2 and PC3 cannot be established logically, this article only lists PC1 as a representative.
4. Discussion
4.1. Spatial-Temporal Characteristics of Groundwater Level in the Amu Darya Delta
The amount of groundwater resources in the aquifer is closely related to the change of groundwater level in spatial-temporal dimensions. The increase and decrease of the groundwater level reflect the relationship between groundwater recharge and discharge. According to the analysis results, the groundwater level in most areas of the Amu Darya Delta increased in fluctuation from 1999 to 2017, except three districts decreased (Table 2). The districts in the table can be divided into three categories by the rate, which are: (i) the districts where the groundwater level rises fast, (ii) the districts with slower increase rates, and (iii) the districts that fall. The districts where the groundwater levels increasing rapidly are Karauzyak, Kanlykul, Shamanbay, and Takhtakupyr, which are located on the two wings of the irrigation area (Figure 11). Because of the substantial decline of the groundwater level in 1999–2002 and restore to the original groundwater level after irrigation supply, the fluctuation rates in these areas were relatively large. The districts where the groundwater levels rose slowly are Nukus, Ellikkala, Turtkul, Kungrad, Chimbay, and Kegeyli. As the Amu Darya river passes through these areas, and some of them continued receiving the irrigation water, the groundwater level fluctuations were relatively stable. The districts where the groundwater levels dropped are Muynak, Berunity, and Amudarya, which are not in the main irrigation area while the Amu Darya River passed through. Besides, Muynak is close to the Large Aral Sea. The main reason for their decrease of the groundwater table is short of continuous replenishment from irrigation water, while the runoff of the Amu Darya River continued to decrease, and the Large Aral Sea kept shrinking. On a monthly scale, the impact of agricultural irrigation on groundwater levels is dominant. Increased precipitation in mountainous areas and reduced water balance deficits during the 1990s resulted in a slower Aral Sea recession. A severe drought occurred between 2000 and 2001, with an average river inflow was only about 2 km3/year. Between 2002 to 2010, lower inflows resulted in the water balance were significantly reduced. According to the results of the mutation detection, the groundwater level data in most areas appeared to mutate in 2006. The reason is most likely attributed to a 13-km dam built by Kazakhstan in August 2005, which completely isolated the hydraulic connection between the Large Aral Sea and the Small Aral Sea. It is the most crucial manual intervention in the last two decades [3]. Nukus is an important cotton-growing area. During the irrigation period (from June to August), the area’s groundwater level accordingly peaked. It can be concluded that the spatial dynamics of groundwater levels are closely related to land cover types. By comparing the results of wavelet analysis, the groundwater level of Nukus, runoff of the Amu Darya river, and irrigation water shared a period of 18 months. A plausible interpretation could be based on the irrigation schedule. In this area, there is irrigation in December to restrain salt content, in March for the spring planting, and in July during the summer. It might form an oscillation period of 0.5, 1, and 1.5 years. Furthermore, the irrigation quantity is dominated by the crop kind and climate condition, which might even combine the small periodical event forming a longer oscillation period. The 18 months is 1.5 times that of 12 months, which could be the abovementioned result. However, the fluctuation mechanism of the groundwater level is very complicated, which is the result of the combined action of many factors.
Although the groundwater level has increased in recent years, it is found that the Aral Sea Basin suffered from a consistent drying trend and experienced more drought events [8]. During drought periods, the Amu Darya river discharges less water into the Large Aral Sea and more water is extracted for irrigation. These activities will seriously affect the local ecological environment.
4.2. Attribution Analysis of Groundwater Spatial-Temporal Changes
The impact of human activities on the environment of the Amu Darya Delta is thought to be profound. Irrigation water is the main method of water resource utilization in the Amu Darya Delta. The irrigation water takes up about 90% of the total water consumption [47]. Many scientists, scholars, government officials, and residents believe that the transition to the utilization of water resources is the number one reason for the shrinking of the Aral Sea. The researchers analyzed the irrigated area of the Amu Darya Delta and the reservoir capacity of the Amu Darya from 1960 to 2015. The result shows: the Aral Sea has a significant negative correlation with the irrigated area and reservoir capacity in the Amu Darya Delta, especially the correlation with the irrigated area in the Amu Darya Delta is the largest. It can be seen that the amount of irrigation water in the basin is an important factor affecting the surface area change of the Aral Sea [1]. In this paper, based on the results of correlation analysis and PCA, it can be concluded that the irrigation water is closely related to groundwater level, especially in irrigation areas. The middle and upper reaches of the Amu Darya flow through important agricultural areas and core cities with huge water consumption [48]. Nukus, as the capital, is also an important agricultural area. The Nukus’s groundwater level is closely related to runoff, irrigation water, and NDVI. Part of Karauzyak is also the agricultural area, however, with less irrigation area than Nukus, the correlation is slightly weaker. Karakalpakstan is mostly bare land, and the evapotranspiration is low. However, in Kungrad and Muynak the correlation between the groundwater level and the evapotranspiration didn’t pass the significant test. For Muyak which is mainly bareland and close to the Aral Sea, the Amu Darya River runoff has been largely consumed in the upper and middle reaches, therefore, the groundwater level is only closely connected to the Aral Sea level. Kungrad is mostly bare land and only a small part is the irrigation area, therefore only irrigation water is related to the groundwater level. In general, it can be seen from the result that because the data used in this paper is the regional average, the spatial resolution is low and the regional division is not accurate enough. Limited by the short available time series data, the groundwater changes were not fully revealed in the Amu Darya Delta.
5. Conclusions
Understanding the spatiotemporal characteristics of groundwater levels is essential for water resource management and restoration of the Aral Sea. A relatively comprehensive analysis of the spatiotemporal characteristics of groundwater dynamic and the influencing factors was achieved based on long-term groundwater level data, climate change data, and human activities data. Trend analysis is used to observe the trend of groundwater levels at different scales; Wavelet analysis is used to analyze the periodicity of groundwater level changes. The breaking points are detected by the M–K test. Finally, Correlation analysis and PCA analysis were used to determine the key factors affecting groundwater levels in areas with different land cover types.
This investigation covers four representative regions in the Amu Darya Delta, which showed various features in groundwater level dynamics and land cover types. In the catchment level, the investigation time frame (19 years) covered a period of a sharp drop in groundwater level (from 1999 to 2002) and the following slow recovery process (from 2002 to 2010). It could be attributed to the firstly continued shrinking of the Aral Sea and the higher runoff from 2002 to 2010. To zoom into the different districts within the catchment, the groundwater dynamic is also controlled by different factors. In the irrigation area, the groundwater level, in general, showed an increasing trend. However, for Muynak, which is close to the Large Aral Sea, a declining trend was observed. The Box plot result in Nukus indicated a higher groundwater level period overlapping the irrigation time frame. For the groundwater dynamic periodicity, a shared period of 18 months was found in irrigation water. The further Pearson Correlation analysis showed that the groundwater level dynamic was related to different factors, which are separate, the irrigation water and NDVI in the irrigated area, evapotranspiration in the bare land. For Muynak, which is the nearest district to the Large Aral Sea, the groundwater level is mainly related to the water level of the Large Aral Sea. From the above conclusions, it can be concluded that the temporal and spatial changes of groundwater levels are mainly affected by agricultural irrigation, human activities have severely affected hydrological characteristics in the Amu Darya Delta.
The results of this paper fill the gaps in quantitative research on the groundwater in the Aral Sea and confirms the huge impact of human activities on local water resources. The results of this research can serve as a scientific basis for policy design. It provides some suggestions for the rational management of water resources and agricultural development planning, to reduce the excessive damage caused by social development to the ecological environment. In this paper, we conducted a comprehensive statistical analysis with available data, provides new insights for future research on groundwater in the Amu Darya Delta. Due to the lack of measured data and low spatial resolution in Central Asia, the analysis results are relatively rough. However, the Aral Sea crisis is not over. Groundwater resources play a more and more important role in social development. Therefore, increasing the sampling intensity both spatially and temporally would be of great benefit for future study. At the same time, collecting data of the earlier period, extending the length of the available data set could better estimate the trend of the change. In the future, a more accurate quantification on the volume of groundwater recharge to the Large Aral Sea and its spatial-temporal dynamic should be studied.
Author Contributions
T.L. and P.D.M. conceived and designed the framework of this study; X.P., W.W., Y.H., C.G., Y.L., and S.A. collected and processed the data; X.P. analyzed the results and wrote the paper. All authors have read and agreed to the published version of the manuscript.
Funding
This study was supported by the Strategic Priority Research Program of the Chinese Academy of Sciences, Pan-Third Pole Environment Study for a Green Silk Road (Grant No. XDA20060303), the State’s Key Project of Research and Development Plan (Grant No. 2017YFC0404501), the National Natural Science Foundation of China (Grant No. 41761144079), the International Partnership Program of the Chinese Academy of Sciences (Grant No. 131551KYS B20160002), CAS Interdisplinary Innovation Team (Grant No. JCTD-2019-20), CAS Research Center for Ecology and Environment of Central Asia (Grant No. Y934031) and Regional Collaborative Innovation Project of Xinjiang Uygur Autonomous Regions (Grant No. 2020E01010).
Conflicts of Interest
The authors declare no conflict of interest.
References
- Burr, G.S.; Kuzmin, Y.V.; Krivonogov, S.K.; Gusskov, S.A.; Cruz, R.J. A history of the modern Aral Sea (Central Asia) since the Late Pleistocene. Quat. Sci. Rev. 2019, 206, 141–149. [Google Scholar] [CrossRef]
- Schettler, G.; Oberhänsli, H.; Hahne, K. Ra-226 and Rn-222 in saline water compartments of the Aral Sea region. Appl. Geochem. 2015, 58, 106–122. [Google Scholar] [CrossRef]
- Micklin, P. The future Aral Sea: Hope and despair. Environ. Earth Sci. 2016, 75, 844. [Google Scholar] [CrossRef]
- Micklin, P. Desiccation of the Aral Sea: A Water Management Disaster in the Soviet Union. Science 1988, 241, 170–1176. [Google Scholar] [CrossRef] [Green Version]
- Sharma, A.; Huang, H.P.; Zavialov, P.; Khan, V. Impact of Desiccation of Aral Sea on the Regional Climate of Central Asia Using WRF Model. Pure Appl. Geophys. 2018, 175, 465–478. [Google Scholar] [CrossRef]
- Micklin, P. The past, present, and future Aral Sea. Lakes Reserv. Res. Manag. 2010, 15, 193–213. [Google Scholar] [CrossRef]
- Ibrakhimov, M.; Khamzina, A.; Forkutsa, I.; Paluasheva, G.; Lamers, J.P.A.; Tischbein, B.; Vlek, P.L.G.; Martius, C. Groundwater table and salinity: Spatial and temporal distribution and influence on soil salinization in Khorezm region (Uzbekistan, Aral Sea Basin). Irrig. Drain. Syst. 2007, 21, 219–236. [Google Scholar] [CrossRef]
- Guo, H.; Bao, A.; Liu, T.; Jiapaer, G.; Ndayisaba, F.; Jiang, L.; Kurban, A.; De Maeyer, P. Spatial and temporal characteristics of droughts in Central Asia during 1966–2015. Sci. Total Environ. 2018, 624, 1523–1538. [Google Scholar] [CrossRef]
- Alekseeva, I.; Jarsjö, J.; Schrum, C.; Destouni, G. Reproducing the Aral Sea water budget and sea-groundwater dynamics between 1979 and 1993 using a coupled 3-D sea-ice-groundwater model. J. Mar. Syst. 2009, 76, 296–309. [Google Scholar] [CrossRef]
- Long, A.; Deng, M.; Xie, L.; Li, X.; Wang, J.; Su, H.; Wu, S. Exploring analysis on the adaptive countermeasures to water resources evolvement under the climate change in Xinjiang and Aral Sea Basin. Arid Land Geogr. 2012, 35, 377–387. [Google Scholar]
- Li, X.; Zhang, C.; Huo, Z. Optimizing irrigation and drainage by considering agricultural hydrological process in arid farmland with shallow groundwater. J. Hydrol. 2020, 585, 124785. [Google Scholar] [CrossRef]
- Micklin, P. The Aral Sea Disaster. Annu. Rev. Earth Planet. Sci. 2007, 35, 47–72. [Google Scholar] [CrossRef] [Green Version]
- Vitola, I.; Vircavs, V.; Abramenko, K.; Lauva, D.; Veinbergs, A. Precipitation and air temperature impact on seasonal variations of groundwater levels. Environ. Clim. Technol. 2012, 10, 25–33. [Google Scholar] [CrossRef] [Green Version]
- Choi, Y.; Choi, Y.; Le, T.H.; Shin, S.; Kwon, D. Groundwater levels estimation and forecasting by integrating precipitation-based period-dividing algorithm and response surface methodology. Desalin. Water Treat. 2015, 54, 1270–1280. [Google Scholar] [CrossRef]
- Eshtawi, T.; Evers, M.; Tischbein, B. Quantifying the impact of urban area expansion on groundwater recharge and surface runoff. Hydrol. Sci. J. 2016, 61, 826–843. [Google Scholar] [CrossRef]
- Eshtawi, T.; Evers, M.; Tischbein, B. Potential impacts of urban area expansion on groundwater level in the Gaza Strip: A spatial-temporal assessment. Arab. J. Geosci. 2015, 8, 10565–10584. [Google Scholar] [CrossRef]
- Siebert, S.; Burke, J.; Faures, J.M.; Frenken, K.; Hoogeveen, J.; Döll, P.; Portmann, F.T. Groundwater use for irrigation—A global inventory. Hydrol. Earth Syst. Sci. 2010, 14, 1863–1880. [Google Scholar] [CrossRef] [Green Version]
- Johansson, O.; Aimbetov, I.; Jarsjö, J. Variation of groundwater salinity in the partially irrigated Amudarya River delta, Uzbekistan. J. Mar. Syst. 2009, 76, 287–295. [Google Scholar] [CrossRef]
- Jarsjö, J.; Destouni, G. Groundwater discharge into the Aral Sea after 1960. J. Mar. Syst. 2004, 47, 109–120. [Google Scholar] [CrossRef]
- Ahmadi, S.H.; Sedghamiz, A. Geostatistical analysis of spatial and temporal variations of groundwater level. Environ. Monit. Assess. 2007, 129, 277–294. [Google Scholar] [CrossRef]
- Mann, H.B. Nonparametric Tests Against Trend. Econometrica 1945, 13, 245. [Google Scholar] [CrossRef]
- Luo, M.; Jiapaer, G.; Guo, H.; Guo, H.; Zhang, P.; Meng, F.; Liu, T. Spatial-temporal Variation of Growing-season NDVI and Its Responses to Hydrothermal Condition in the Tarim River Basin from 2000 to 2013. J. Nat. Resour. 2017, 32, 50–63. [Google Scholar]
- Liu, Z.; Huang, Y.; Liu, T.; Li, J.; Xing, W.; Akmalov, S.; Peng, J.; Pan, X.; Guo, C.; Duan, Y. Water Balance Analysis Based on a Quantitative Evapotranspiration Inversion in the Nukus Irrigation Area, Lower Amu River Basin. Remote Sens. 2020, 12, 2317. [Google Scholar] [CrossRef]
- Allen, R.; Irmak, A.; Trezza, R.; Hendrickx, J.M.H.; Bastiaanssen, W.; Kjaersgaard, J. Satellite-based ET estimation in agriculture using SEBAL and METRIC. Hydrol. Process. 2011, 25, 4011–4027. [Google Scholar] [CrossRef]
- Zhang, J.; Zhang, X.; Niu, J.; Hu, B.X.; Soltanian, M.R.; Qiu, H.; Yang, L. Prediction of groundwater level in seashore reclaimed land using wavelet and artificial neural network-based hybrid model. J. Hydrol. 2019, 577, 123948. [Google Scholar] [CrossRef]
- Chernick, M.R. Wavelet Methods for Time Series Analysis. Technometrics 2001, 43, 491. [Google Scholar] [CrossRef]
- Labat, D. Cross wavelet analyses of annual continental freshwater discharge and selected climate indices. J. Hydrol. 2010, 385, 269–278. [Google Scholar] [CrossRef]
- Grinsted, A.; Moore, J.C.; Jevrejeva, S. Application of the cross wavelet transform and wavelet coherence to geophysical time series. Nonlinear Process. Geophys. 2004, 11, 561–566. [Google Scholar] [CrossRef]
- Menezes, J.M.P.; Barreto, G.A. Long-term time series prediction with the NARX network: An empirical evaluation. Neurocomputing 2008, 71, 3335–3343. [Google Scholar] [CrossRef]
- Meng, F.; Liu, T.; Huang, Y.; Luo, M.; Bao, A.; Hou, D. Quantitative detection and attribution of runoff variations in the Aksu River Basin. Water 2016, 8, 338. [Google Scholar] [CrossRef] [Green Version]
- Bevan, J.M.; Kendall, M.G. Rank Correlation Methods. Statistician 1971, 20, 74. [Google Scholar] [CrossRef]
- Pearson, K. Mathematical contributions to the theory of evolution. Proc. R. Soc. 1896, 60, 489–498. [Google Scholar]
- Brenneman, W.A. Statistics for Research. Technometrics 2005, 47, 100. [Google Scholar] [CrossRef]
- Huang, G.; Sun, J.; Zhang, Y.; Chen, Z.; Liu, F. Impact of anthropogenic and natural processes on the evolution of groundwater chemistry in a rapidly urbanized coastal area, South China. Sci. Total Environ. 2013, 463–464, 209–221. [Google Scholar] [CrossRef] [PubMed]
- Liang, K.Y.; Zeger, S.L. Longitudinal data analysis using generalized linear models. Biometrika 1986, 73, 13–22. [Google Scholar] [CrossRef]
- Zhang, X.; Dong, F.; Dai, H.; Hu, B.X.; Qin, G.; Li, D.; Lv, X.; Dai, Z.; Soltanian, M.R. Influence of lunar semidiurnal tides on groundwater dynamics in estuarine aquifers. Hydrogeol. J. 2020, 28, 1419–1429. [Google Scholar] [CrossRef]
- Salam, R.; Towfiqul Islam, A.R.M.; Islam, S. Spatiotemporal distribution and prediction of groundwater level linked to ENSO teleconnection indices in the northwestern region of Bangladesh. Environ. Dev. Sustain. 2020, 22, 4509–4535. [Google Scholar] [CrossRef]
- Rezaei, A.; Gurdak, J.J. Large-scale climate variability controls on climate, vegetation coverage, lake and groundwater storage in the Lake Urmia watershed using SSA and wavelet analysis. Sci. Total Environ. 2020, 724, 138273. [Google Scholar] [CrossRef]
- Patle, G.T.; Singh, D.K.; Sarangi, A.; Rai, A.; Khanna, M.; Sahoo, R.N. Time series analysis of groundwater levels and projection of future trend. J. Geol. Soc. India 2015, 85, 232–242. [Google Scholar] [CrossRef]
- Pathak, A.A.; Dodamani, B.M. Trend Analysis of Groundwater Levels and Assessment of Regional Groundwater Drought: Ghataprabha River Basin, India. Nat. Resour. Res. 2019, 28, 631–643. [Google Scholar] [CrossRef]
- Bhurtun, P.; Lesven, L.; Ruckebusch, C.; Halkett, C.; Cornard, J.-P.; Billon, G. Understanding the impact of the changes in weather conditions on surface water quality. Sci. Total Environ. 2019, 652, 289–299. [Google Scholar] [CrossRef] [PubMed]
- Su, H.; Wang, J.; Liu, J. Geochemical factors controlling the occurrence of high-fluoride groundwater in the western region of the Ordos basin, northwestern China. Environ. Pollut. 2019, 252, 1154–1162. [Google Scholar] [CrossRef] [PubMed]
- El Alfy, M.; Lashin, A.; Abdalla, F.; Al-Bassam, A. Assessing the hydrogeochemical processes affecting groundwater pollution in arid areas using an integration of geochemical equilibrium and multivariate statistical techniques. Environ. Pollut. 2017, 229, 760–770. [Google Scholar] [CrossRef] [PubMed]
- Gautam, A.; Rai, S.C.; Rai, S.P. Impact of anthropogenic activities on the alluvial aquifers of north-east Punjab, India. Environ. Monit. Assess. 2020, 192, 527. [Google Scholar] [CrossRef] [PubMed]
- Ducci, D.; Della Morte, R.; Mottola, A.; Onorati, G.; Pugliano, G. Evaluating upward trends in groundwater nitrate concentrations: An example in an alluvial plain of the Campania region (Southern Italy). Environ. Earth Sci. 2020, 79, 319. [Google Scholar] [CrossRef]
- Hamidov, A.; Khamidov, M.; Ishchanov, J. Impact of climate change on groundwater management in the northwestern part of Uzbekistan. Agronomy 2020, 10, 1173. [Google Scholar] [CrossRef]
- Deng, M.J.; Long, A.H.; Zhang, Y.; Li, X. Assessment of water resources development and utilization in the five Central Asia countries. Adv. Earth Sci. 2010, 25, 1347–1356. [Google Scholar]
- Karthe, D.; Chalov, S.; Borchardt, D. Water resources and their management in central Asia in the early twenty first century: Status, challenges and future prospects. Environ. Earth Sci. 2015, 73, 487–499. [Google Scholar] [CrossRef]
Figure 1.
The geographic location of the Amu Darya Delta, groundwater monitoring stations (blue dots), and surface water monitoring stations (orange triangles). The Digital Elevation Model is from the Shuttle Radar Topography Mission (http://srtm.csi.cgiar.org/).
Figure 1.
The geographic location of the Amu Darya Delta, groundwater monitoring stations (blue dots), and surface water monitoring stations (orange triangles). The Digital Elevation Model is from the Shuttle Radar Topography Mission (http://srtm.csi.cgiar.org/).

Figure 2.
Schematic diagram of the multi-year monthly average temperature (yellow line) and precipitation (blue line) (1991–2018) at the Nukus meteorological station; and runoff (blue bar) (1992–2018) at Samanbay hydrological station. With a similar numeric range of variation, the precipitation and temperature share the secondary y-axis.

Figure 3.
Major land cover types in the Amu Darya Delta.

Figure 4.
Research process.

Figure 5.
Annual groundwater level variations and trends in the Amu Darya Delta from 1999 to 2017 in Karakalpakstan (a), Karauzyak (b), Kungrad (c), Muynak (d), Nukus (e).
Figure 5.
Annual groundwater level variations and trends in the Amu Darya Delta from 1999 to 2017 in Karakalpakstan (a), Karauzyak (b), Kungrad (c), Muynak (d), Nukus (e).

Figure 6.
Spatial distribution of groundwater variation trend in 1999–2017 (The data series of regional groundwater average was calculated basing on all wells in the district).
Figure 6.
Spatial distribution of groundwater variation trend in 1999–2017 (The data series of regional groundwater average was calculated basing on all wells in the district).

Figure 7.
Statistical analysis (box-plot) of the monthly average groundwater level from 1999 to 2017 in Nukus (a), Karauzyak (b), Muynak (c), Kungrad (d).
Figure 7.
Statistical analysis (box-plot) of the monthly average groundwater level from 1999 to 2017 in Nukus (a), Karauzyak (b), Muynak (c), Kungrad (d).

Figure 8.
Monthly average groundwater level wavelet coefficient real part contour figure and wavelet variance figure from 1999 to 2017.
Figure 8.
Monthly average groundwater level wavelet coefficient real part contour figure and wavelet variance figure from 1999 to 2017.

Figure 9.
Monthly average runoff and irrigation water wavelet coefficient real part contour figure and wavelet variance figure.
Figure 9.
Monthly average runoff and irrigation water wavelet coefficient real part contour figure and wavelet variance figure.

Figure 10.
Groundwater level variation trends of the M–K test from 1999 to 2017 in Karakalpakstan (a), Karauzyak (b), Kungrad (c), Muyanak (d), Nukus (e).
Figure 10.
Groundwater level variation trends of the M–K test from 1999 to 2017 in Karakalpakstan (a), Karauzyak (b), Kungrad (c), Muyanak (d), Nukus (e).

Figure 11.
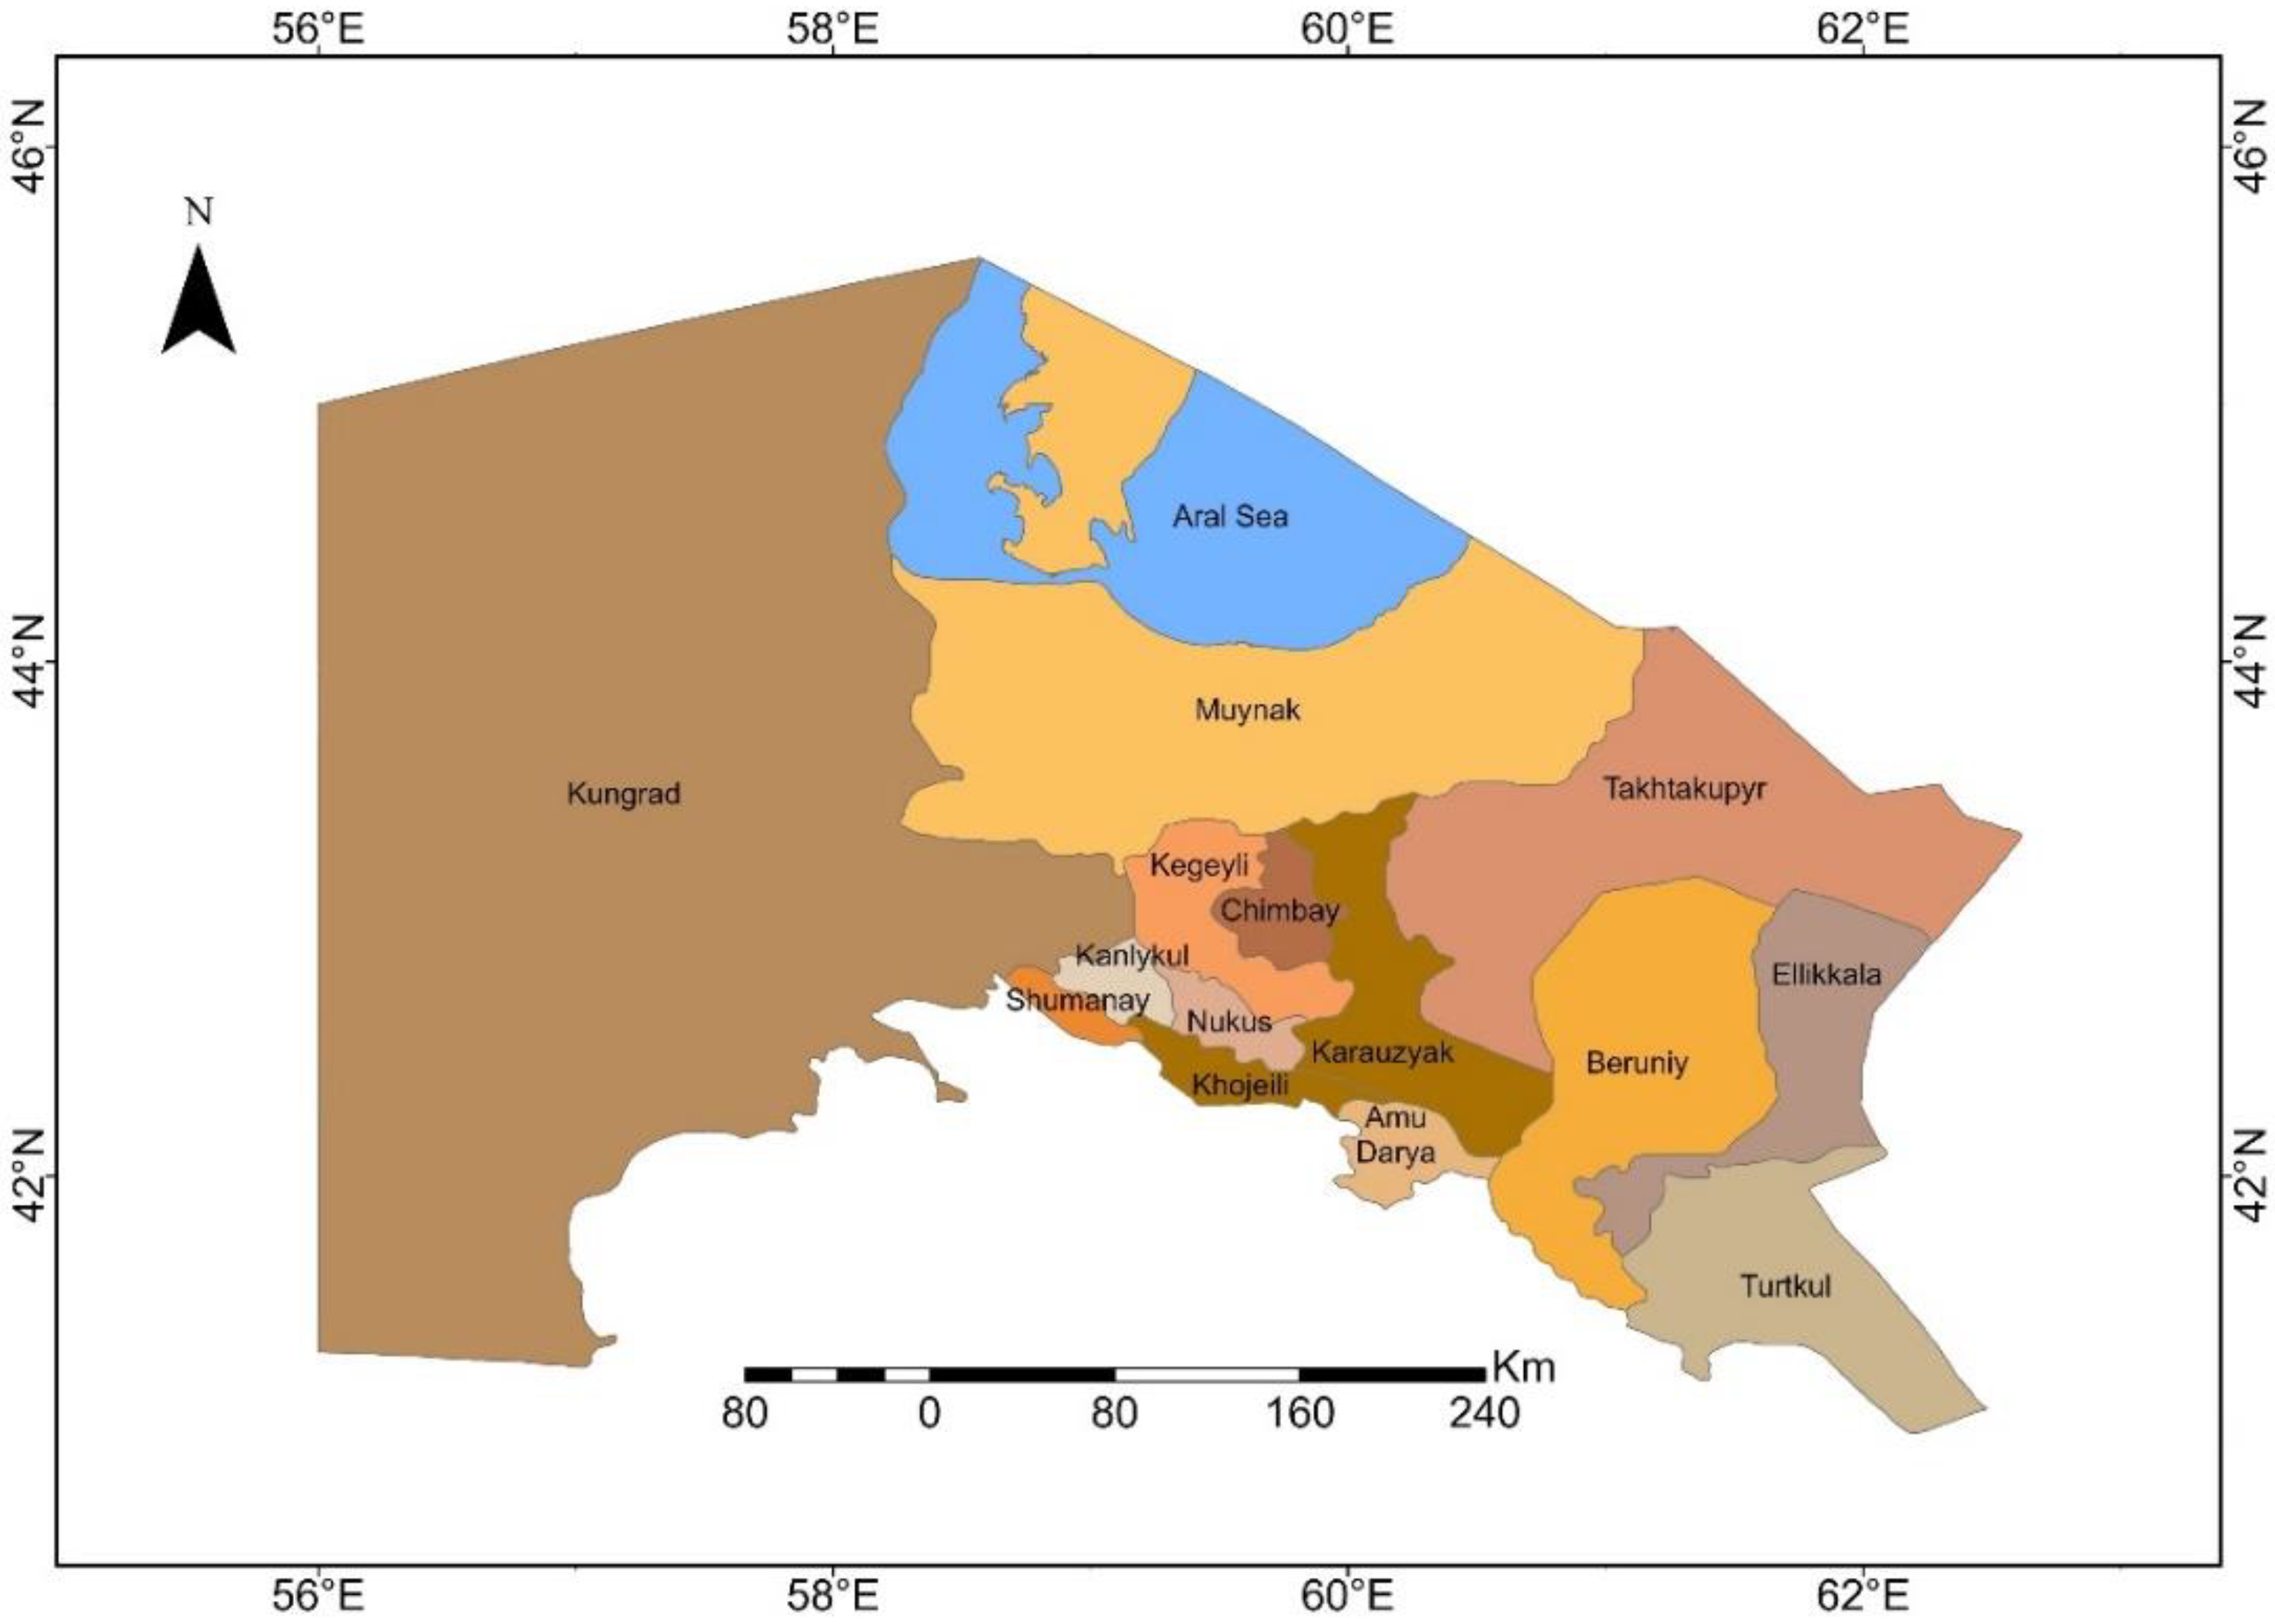
Administrative Map of Karakalpakstan.


Table 1.
The correlation coefficient between the monthly average groundwater level and upstream runoff, irrigation water, NDVI, evapotranspiration, and Aral Sea level in the Amu Darya Delta.
Table 1.
The correlation coefficient between the monthly average groundwater level and upstream runoff, irrigation water, NDVI, evapotranspiration, and Aral Sea level in the Amu Darya Delta.
| Factor | Nukus | Muynak | Kungrad | Karauzyak |
|---|---|---|---|---|
| Upstream runoff | −0.406 * | 0.064 | −0.176 * | −0.236 * |
| Irrigation water | −0.583 * | −0.047 | −0.222 * | −0.303 * |
| NDVI | −0.581 * | −0.09 | −0.195 * | −0.223 * |
| Evapotranspiration | −0.196 | 0.382 | 0.221 | 0.11 |
| Aral Sea level | 0.105 | 0.355 * | 0.026 | 0.173 * |
p-value < 0.001 (*).
Table 2.
Groundwater level variation rate from 1999–2017.
| District | Nukus | Muynak | Kungrad | Karauzyak | Chimbay | Ellikkala | Turtkul | Kanlykul | Shamanbay | Takhtakupyr | Khojeili | Beruniy | Amudarya | Kegeyli |
|---|---|---|---|---|---|---|---|---|---|---|---|---|---|---|
| Rate (mm/year) | 17.16 | −30.27 | 34.19 | 58.36 | 32.95 | 14.88 | 17.15 | 51.13 | 46.08 | 48.59 | 5.87 | −10.41 | −5.52 | 12.88 |
Publisher’s Note: MDPI stays neutral with regard to jurisdictional claims in published maps and institutional affiliations. |
© 2020 by the authors. Licensee MDPI, Basel, Switzerland. This article is an open access article distributed under the terms and conditions of the Creative Commons Attribution (CC BY) license (http://creativecommons.org/licenses/by/4.0/).
Share and Cite
MDPI and ACS Style
Pan, X.; Wang, W.; Liu, T.; Huang, Y.; Maeyer, P.D.; Guo, C.; Ling, Y.; Akmalov, S. Quantitative Detection and Attribution of Groundwater Level Variations in the Amu Darya Delta. Water 2020, 12, 2869. https://doi.org/10.3390/w12102869
AMA Style
Pan X, Wang W, Liu T, Huang Y, Maeyer PD, Guo C, Ling Y, Akmalov S. Quantitative Detection and Attribution of Groundwater Level Variations in the Amu Darya Delta. Water. 2020; 12(10):2869. https://doi.org/10.3390/w12102869
Chicago/Turabian StylePan, Xiaohui, Weishi Wang, Tie Liu, Yue Huang, Philippe De Maeyer, Chenyu Guo, Yunan Ling, and Shamshodbek Akmalov. 2020. "Quantitative Detection and Attribution of Groundwater Level Variations in the Amu Darya Delta" Water 12, no. 10: 2869. https://doi.org/10.3390/w12102869
Note that from the first issue of 2016, this journal uses article numbers instead of page numbers. See further details here.