A Complex Method for Estimation of Multiple Abiotic Hazards in Forest Ecosystems


1
Department of Applied and Landscape Ecology, Mendel University in Brno, Zemědělská 1, 613 00 Brno, Czech Republic
2
Czech Hydrometeorological Institute, Brno—Branch Office, Kroftova 43, 616 67 Brno, Czech Republic
3
Department of Crop Science, Breeding and Plant Medicine, Mendel University in Brn, Zemědělská 1, 613 00 Brno, Czech Republic
*
Author to whom correspondence should be addressed.
Water 2020, 12(10), 2872; https://doi.org/10.3390/w12102872
Submission received: 27 August 2020
/
Revised: 9 October 2020
/
Accepted: 11 October 2020
/
Published: 15 October 2020
(This article belongs to the Special Issue Impact of Natural Hazards on Forest Ecosystems and Their Surrounding Landscape under Climate Change)
Abstract
:Forest ecosystems are faced with a variety of threats, including increasingly prolonged droughts and other abiotic stresses such as extreme high temperatures, very strong wind, invasive insect outbreaks, and the rapid spread of pathogens. The aim of the study was to define crucial abiotic stressors affecting Central Europe forest ecosystems and, with regard to their possible simultaneous effect, develop a universal method of multi-hazard evaluation. The method was then applied to the particular area of interest represented by part of the Czech Republic with forest land cover (12–19 ° E, 48–51 ° N). Based on National Threat Analysis, the most significant threats of natural origin with a close relationship to forest stability were identified as drought, high temperature, and wind gusts. Using suitable indicators, a level of their risk based on occurrence and consequences was estimated. The resulting combined level of risk, divided into five categories, was then spatially expressed on a grid map. The novelty of our paper lies in: (i) all relevant climatic data were combined and evaluated simultaneously with respect to the different level of risk, (ii) the developed methodological road map enables an application of the method for various conditions, and (iii) multiple hazards were estimated for the case study area.
1. Introduction
Forest ecosystems are affected by various threats, including increasingly prolonged and severe droughts and other abiotic stresses, invasive insect outbreaks, and the rapid spread of pathogens [1]. The impact of climate change on forests is an important issue that concerns a large number of the international scientific community [2,3,4,5].
Safety and security of ecosystems, and their fundamental functions and services, is a crucial security issue. Serious damage to the environment has far-reaching implications, including endangered basic functions of states, as evidenced by environmental crises that have led to conflict escalation in the past. Environmental threats have two time horizons. Threats caused by extreme meteorological events, such as storms and floods, constitute a sudden and intense emergency, whereas others, such as droughts, are characterized by a slow and gradual development. A complex approach must address not only both time dimensions but also all phases and mutual combinations. It has been proven that environmental crises do not arise only as a consequence of particular stressors but also by their combination and interactions. Previous events clearly indicate that environmental crises are typified by synergic, cascade, and domino effects, when one stressor is forced or weakened by others. Several crises with different triggers can affect an ecosystem simultaneously and their resulting effect is much stronger. Ref. [6] developed and tested individual and collective multi-hazard risks and noted that natural hazards are often studied in isolation. However, there is a great need to examine hazards holistically to better manage the complexity of threats found in a given region. Many regions of the world have complex hazard landscapes in which risk from individual and/or multiple extreme events is omnipresent. The issue of multiple hazards is also a subject of a UN strategy for disaster risk reduction and part of the consecutive Sendai Framework for 2015–2030. The framework introduces innovative risk attitudes, ranging from risk control to risk management, thus creating the opportunity for strengthened prevention and for the application of the BBB principle—"Build Back Better”—even in the case of the ecosystems and planting of forests. Analogously, the EU Science Hub has highlighted the need for multi-hazard assessment when prioritizing security research for 2021–2030.
A wide range of national and international organizations and strategic documents exist, such as the United Nations Office for Disaster Risk Reduction (UNISDR) and the consecutive Sendai Framework for Disaster Risk Reduction 2015–2030 [7]. In addition, the European Commission’s Science and Knowledge Service (EU Science Hub), the Internal Security Strategy for the European Union [8], Transforming Our World, the 2030 Agenda for Sustainable Development [9], the United Nations Framework Convention on Climate Change (UNFCCC) [10], the Strategic Concept for the Defence and Security of the Members of the North Atlantic Treaty Organisation [11], and the Conception of Environmental Security of the Czech Republic [12] each identify and address relevant security risks, including natural catastrophes and risk of natural origins. At the Czech national level, the basic security document, Security Strategy of the Czech Republic 2015 [13], includes catastrophes of natural origin with anthropological risks among the basic security issues. A detailed classification and description of particular risks was conducted in [12]. Coordinated by the Ministry of Defense, a complex Threat analysis for the Czech Republic was also carried out [14]. The final report summarizes the natural abiotic threats with an unacceptable level of risk: floods and extreme precipitation, long-term drought, extremely high temperature, and high wind speed and gusts. These risks were amplified when combined.
1.1. High Temperature and Heat Wave and Forest
The increasing trend in the number and intensity of heat waves is likely to continue throughout the 21st century. Heat waves are often accompanied by drought. Heat wave events affect a wide variety of tree functions. Photosynthesis is reduced, photooxidative stress increases, leaves abscise, and the growth rate of the remaining leaves decreases. Stomatal conductance of some species increases at high temperatures, which may be a mechanism for leaf cooling. Heat stress reduces growth and alters biomass allocation. When drought stress accompanies heat waves, the negative effects of heat stress worsen and can lead to tree mortality [15,16,17].
Other authors [18,19] also emphasize that common temperate European forest tree species are more vulnerable to extreme drought and heat waves. Because drought and heat events are likely to occur more frequently due to climate change, temperate European forests might approach a point at which a substantial ecological and economic transition is required. The study of [20] also highlights the urgent need for a pan-European ground-based monitoring network that is suitable for monitoring individual tree mortality.
1.2. Drought and Forest
Climate scenarios predict a rapid warming and an increase in the frequency and duration of droughts across Europe [21]. One of Central Europe’s most severe summers, characterized by a long drought and heat wave, was recorded in 2018. On par with that of 2003, the summer of 2018 was classified as the most severe event in Europe of the previous 500 years. Nonetheless, the drought event in 2018 was climatically more extreme and had a larger impact on Central Europe’s forest ecosystems than the 2003 drought. The most ecologically and economically important tree species in the temperate forests of Austria, Slovakia, Germany, and Switzerland showed severe symptoms of drought stress, such as exceptionally low foliar water potentials crossing the threshold for xylem hydraulic failure, widespread leaf discoloration, premature leaf shedding, and drought-induced tree mortality [22]. Moreover, in the following year the forests were highly vulnerable to secondary drought impacts, such as insect or fungal infection pressure [20,23]. Productive, hydrological, and soil protection functions are harmed in mountain forests subject to such disasters [24,25].
According to [26], drought-induced tree mortality in Israel has been observed in diffuse patterns in forests, typically affecting approximately 5% of the trees in each forest. “Hotter” droughts may have more severe impacts on terrestrial vegetation than “normal” droughts (i.e., droughts that occur at lower, more typical temperatures) [27]. Ref. [28] evaluated the consequences of the 2000 and 2012 droughts on stands of Scots pine forest in Romania. In these two years, low precipitation and warm conditions during the growing season significantly reduced Scots pine growth and productivity, and triggered mortality events in some areas. The authors concluded that it is necessary to develop adaptive forest management and mitigation strategies across drought-prone forested regions of Europe as a response to extreme climate events.
1.3. Windstorms and Wind Gusts and Forests
Windstorms and strong winds cause major disturbances and consequent economic losses in European forests. During the past century, in particular, forests in Europe have suffered from windstorms and this trend is likely to continue [18,29,30,31]. For example, in Finland, a total of 7 million m3 of timber was damaged in 2001 in two separate storms (Pyry and Janika) in autumn, and four strong storms caused damage in 2010 [32].
Wind damage is influenced by forest characteristics (e.g., tree species, tree height, crown and rooting characteristics, and stand density), forest management, and the abiotic environment, particularly local wind and soil conditions [33,34,35]. The mean wind speed and duration, in addition to gust level, are also significant influences.
According to [34,36], the probability of wind damage increases with tree height and for certain species, e.g., Norway spruces are particularly vulnerable to wind. Forest management also influences wind damage sensitivity. Trees grown in sheltered conditions and later exposed to wind are especially sensitive to damage [34,37,38]. Areas exposed to strong wind gusts [39] or where rooting conditions are limited due to soil characteristics [40] are more predisposed to wind damage.
Ref. [41] studied combined information on windstorms and damage to forest stands from a long-term perspective (1801–2015). The concentration of extremely damaging windstorms after 1950 (9 of the 14 selected) is an indication of increasing windstorm damage to forests in the Czech Republic. This can be partly attributed to the cultivation of two tree generations of spruce monoculture in places where diverse forests once stood, and clear-felling management of those forests.
2. Materials and Methods
2.1. Methodological Roadmap in Eight Steps
- Identification of relevant threats
- Election of suitable indicator for each threat (see Table 1)
- Overlapping of three risk maps
- Final determination of combined abiotic risk according to Table 9
- Spatial expression of combined risk (Figure 7).
2.1.1. Steps 1 and 2: Identification of Relevant Threats and Election of Suitable Indicator for Each Threat
2.1.2. Step 3: Estimation of Level of Risk for Each Threat
Estimation of the level of risk for each threat was conducted using the basic idea that the level of risk is related to the frequency of occurrence and the level of consequence (Equations (1) and (2)). The values of both F and C range from 0 to 10. The method of estimation of frequency and consequence is described in detail by [14].
where R is the level of risk, F is the frequency (see Table 2), and C is the consequence.
where 0.4 and 0.2 are weight coefficients; CP is the consequence on people coefficient (see Equation (3) and Table 3); CEn is the consequence on the environment coefficient (see Table 4); CEc is the consequence on the economy coefficient (see Table 5); and CS is the social consequences coefficient (see Equation (4) and Table 6).
where CP1 is the coefficient of mortality and CP2 is the coefficient of endangered people.
where CS1 is the coefficient of people affected by restrictions, CS2 is the duration of the restrictions coefficient, and CS3 is the level of restrictions coefficient.
R = F × C
C = 0.4 × CP + 0.2 × CEn + 0.2 × CEc + 0.2 × CS
CP = (CP1 + CP2)/2
CS = (CS1 + CS2 + CS3)/3
2.1.3. Data Source
To spatially determine the degree of abiotic risk, it was necessary to prepare raster data layers with categorized values of individual selected indicators (tropical day, TD; water balance, WB; WS10—see Table 1). For the preparation of raster data layers, a data set of 268 technical climatological stations was used. A technical series of meteorological elements was created in daily intervals on the basis of measured data of the Czech Hydrometeorological Institute (CHMI) climatological station network. The process of creating a technical series of meteorological elements comprised a combination of several data quality control procedures, completion of missing values, and homogenization of time series [42,43,44].
2.1.4. Period of Estimation
All indicators in Table 1 were expressed as average values for the 20 year period of 2000–2019.
2.1.5. Description of Indicators
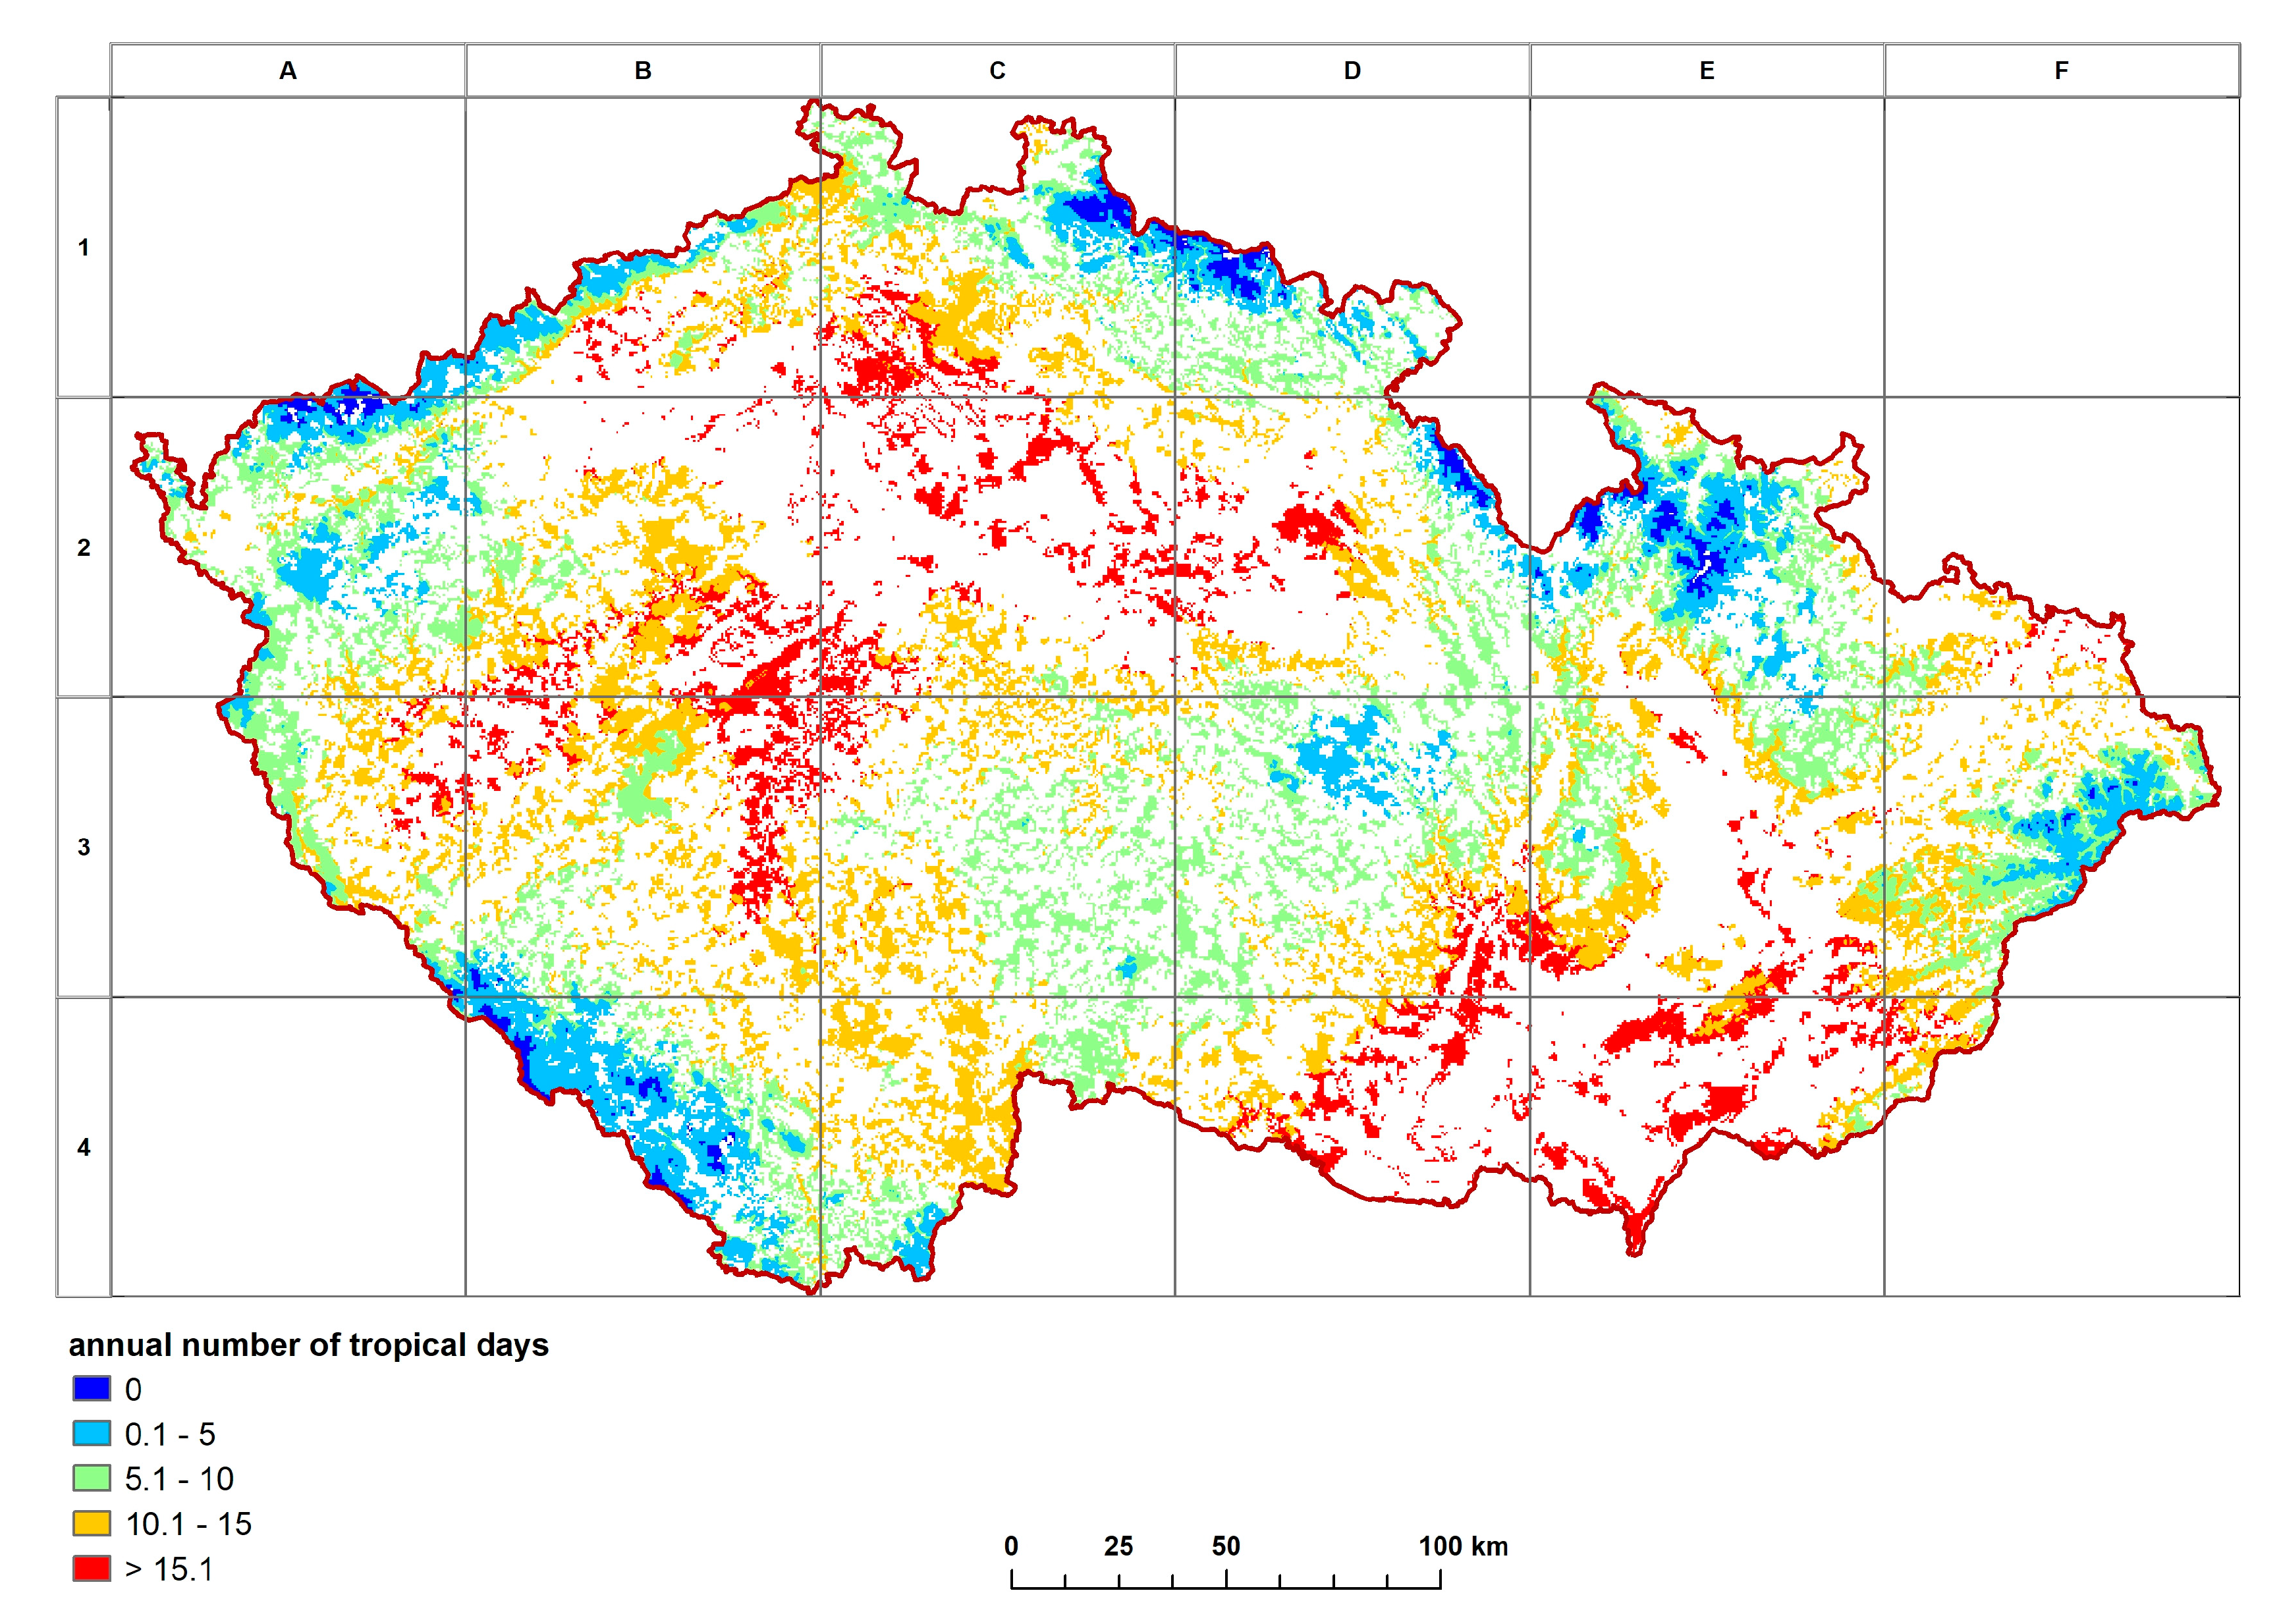
TD: A tropical day is defined as a day in which the maximum air temperature measured at a height of 2 m above the ground reaches or exceeds 30 °C. The annual number of TDs thus reflects extreme heat weather conditions of the locality.
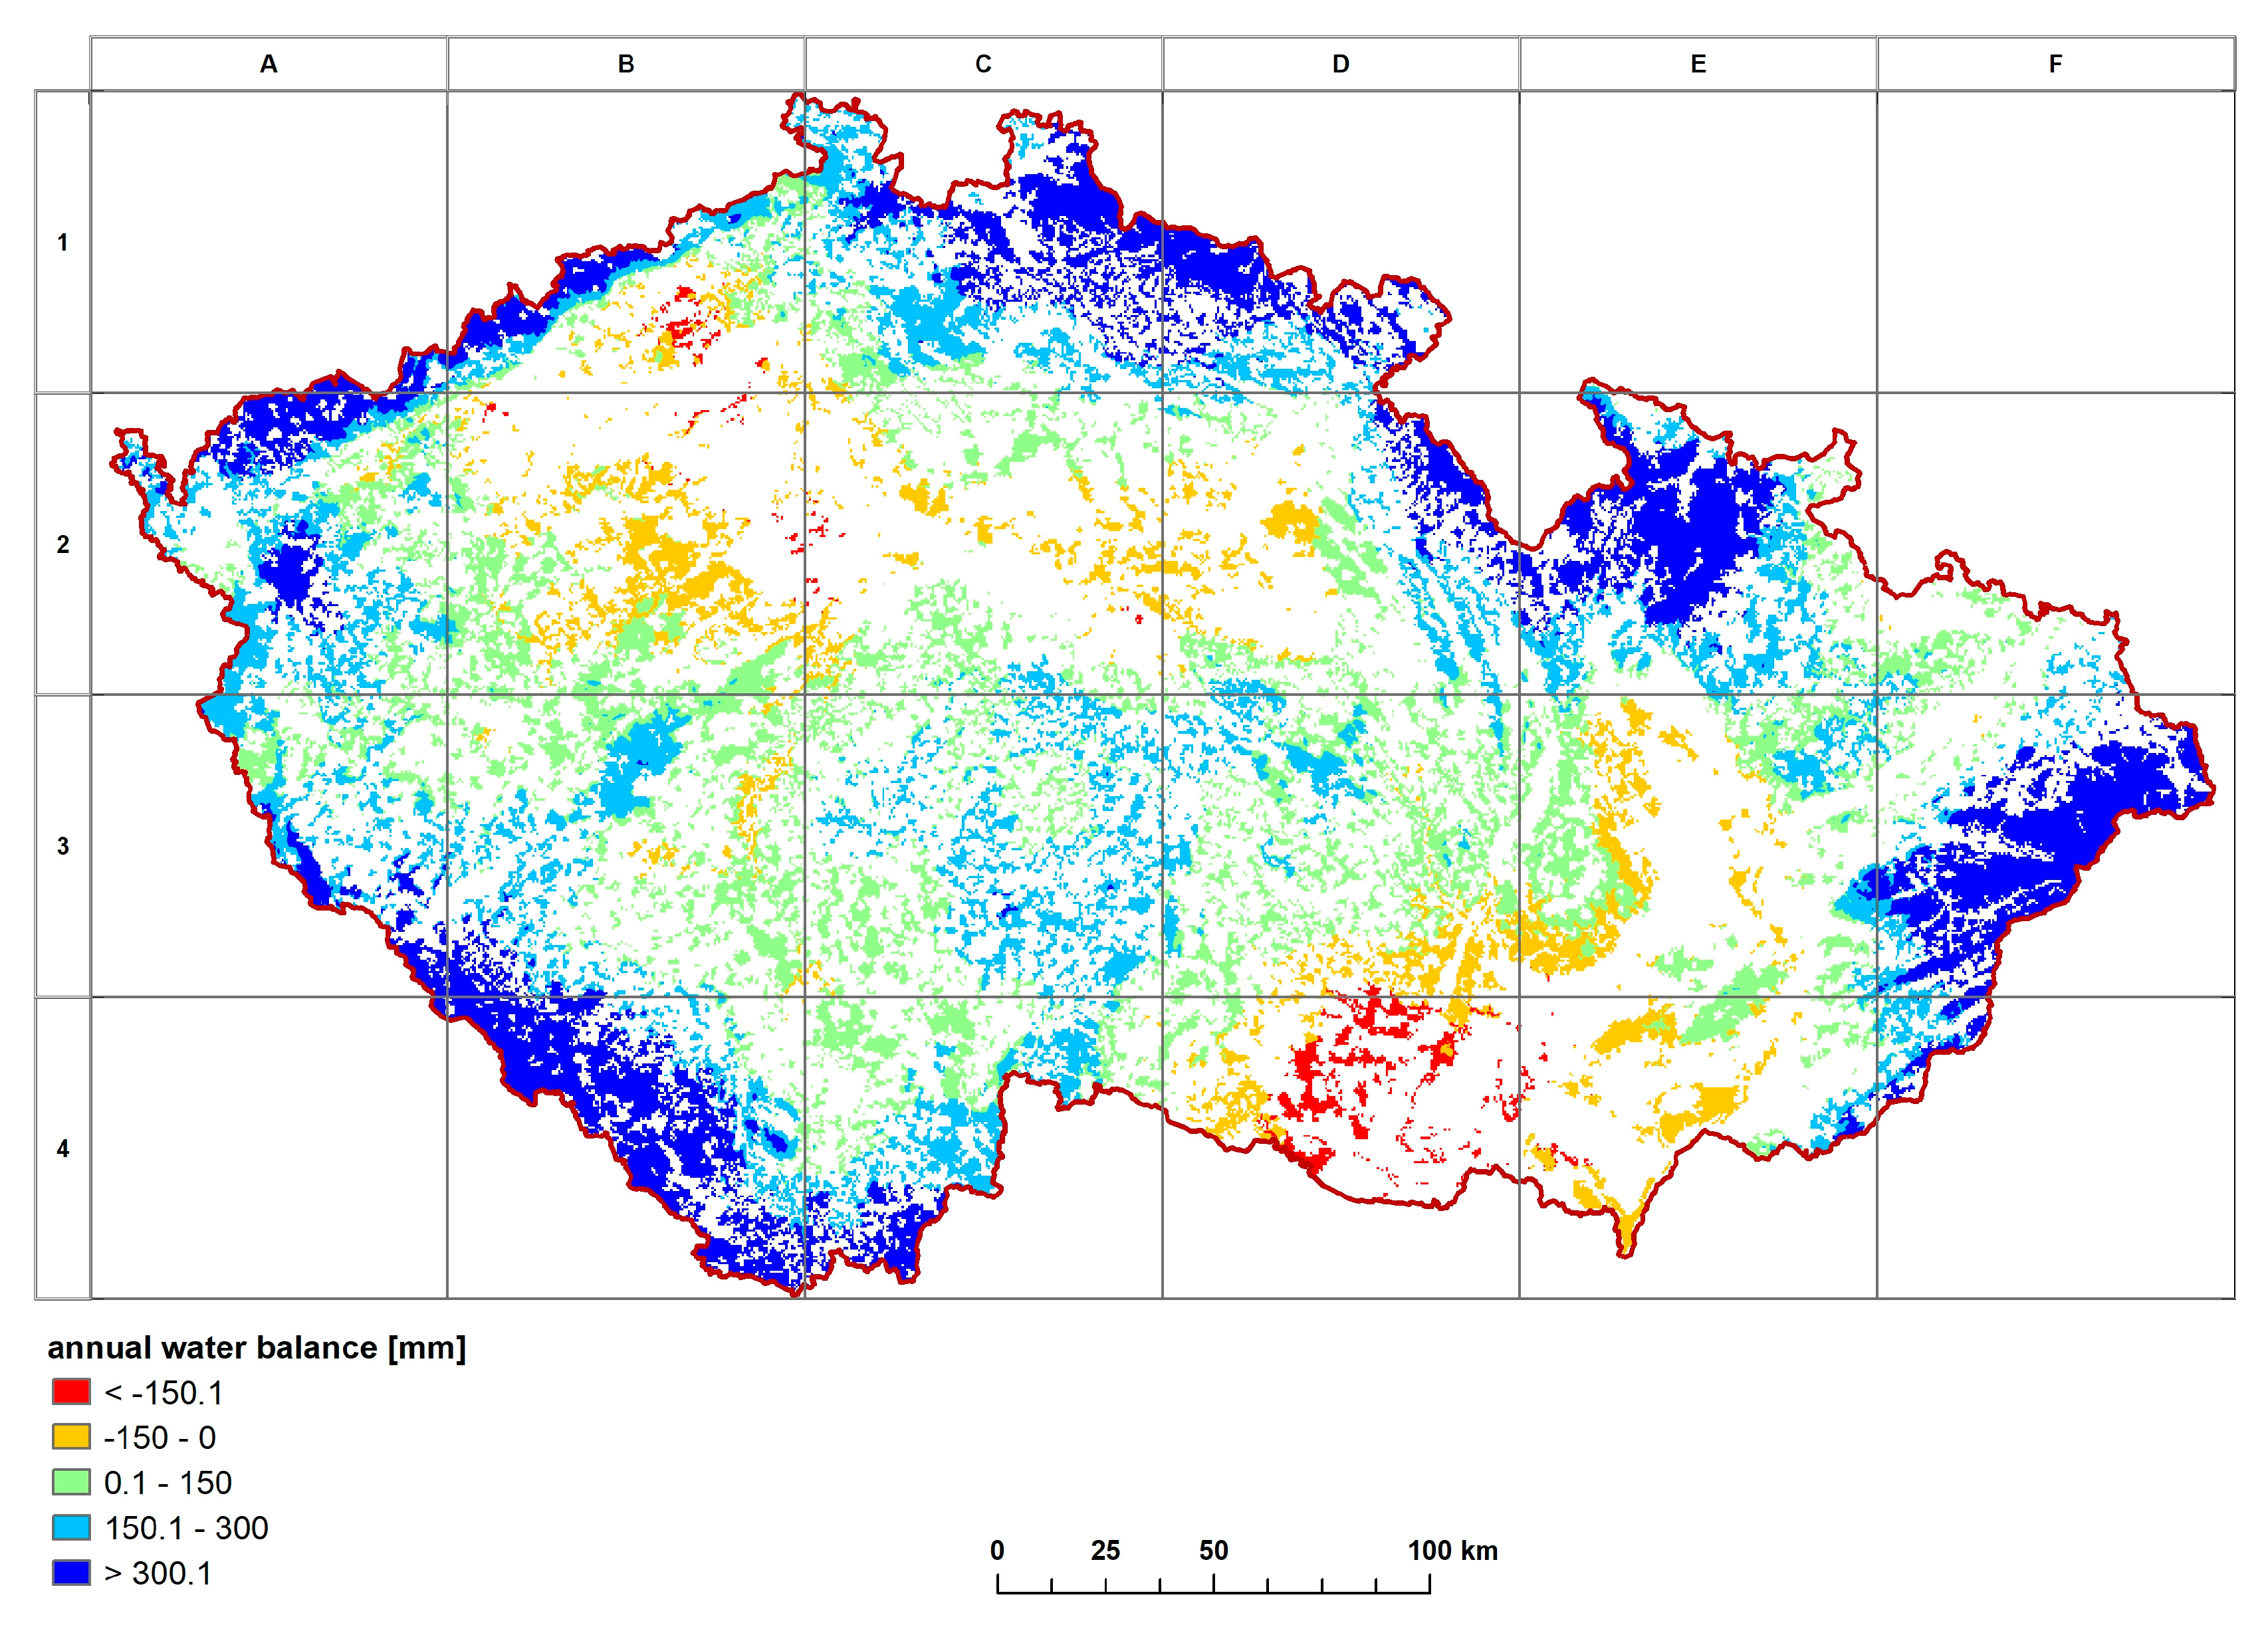
WB: As a characteristic that indicates an increased probability of drought, the water balance is used to analyze the moisture conditions in the landscape in a straightforward manner during a certain period. The water balance is calculated as the difference between precipitation and potential evapotranspiration of grassland. Evapotranspiration in its potential form is practically identical to the maximum possible value of evaporation under optimal humidity conditions. When calculating potential evapotranspiration, the moisture conditions of the subsoil formed by the soil horizon are not taken into account. In essence, potential evapotranspiration expresses the influence of climatic conditions on the water balance (and also on evaporation) while suppressing all other factors that affect evaporation (soil moisture, etc.). This provides the scope for the concept of a climate water balance. In this study, the agrometeorological model AVISO [45,46,47] based on the complete Penman–Monteith combined equation (modified to the conditions of the Czech Republic) with correction for temperature of the evaporating surface and calculation of the expression of air humidity using water vapor pressure, was used to calculate grassland evapotranspiration.
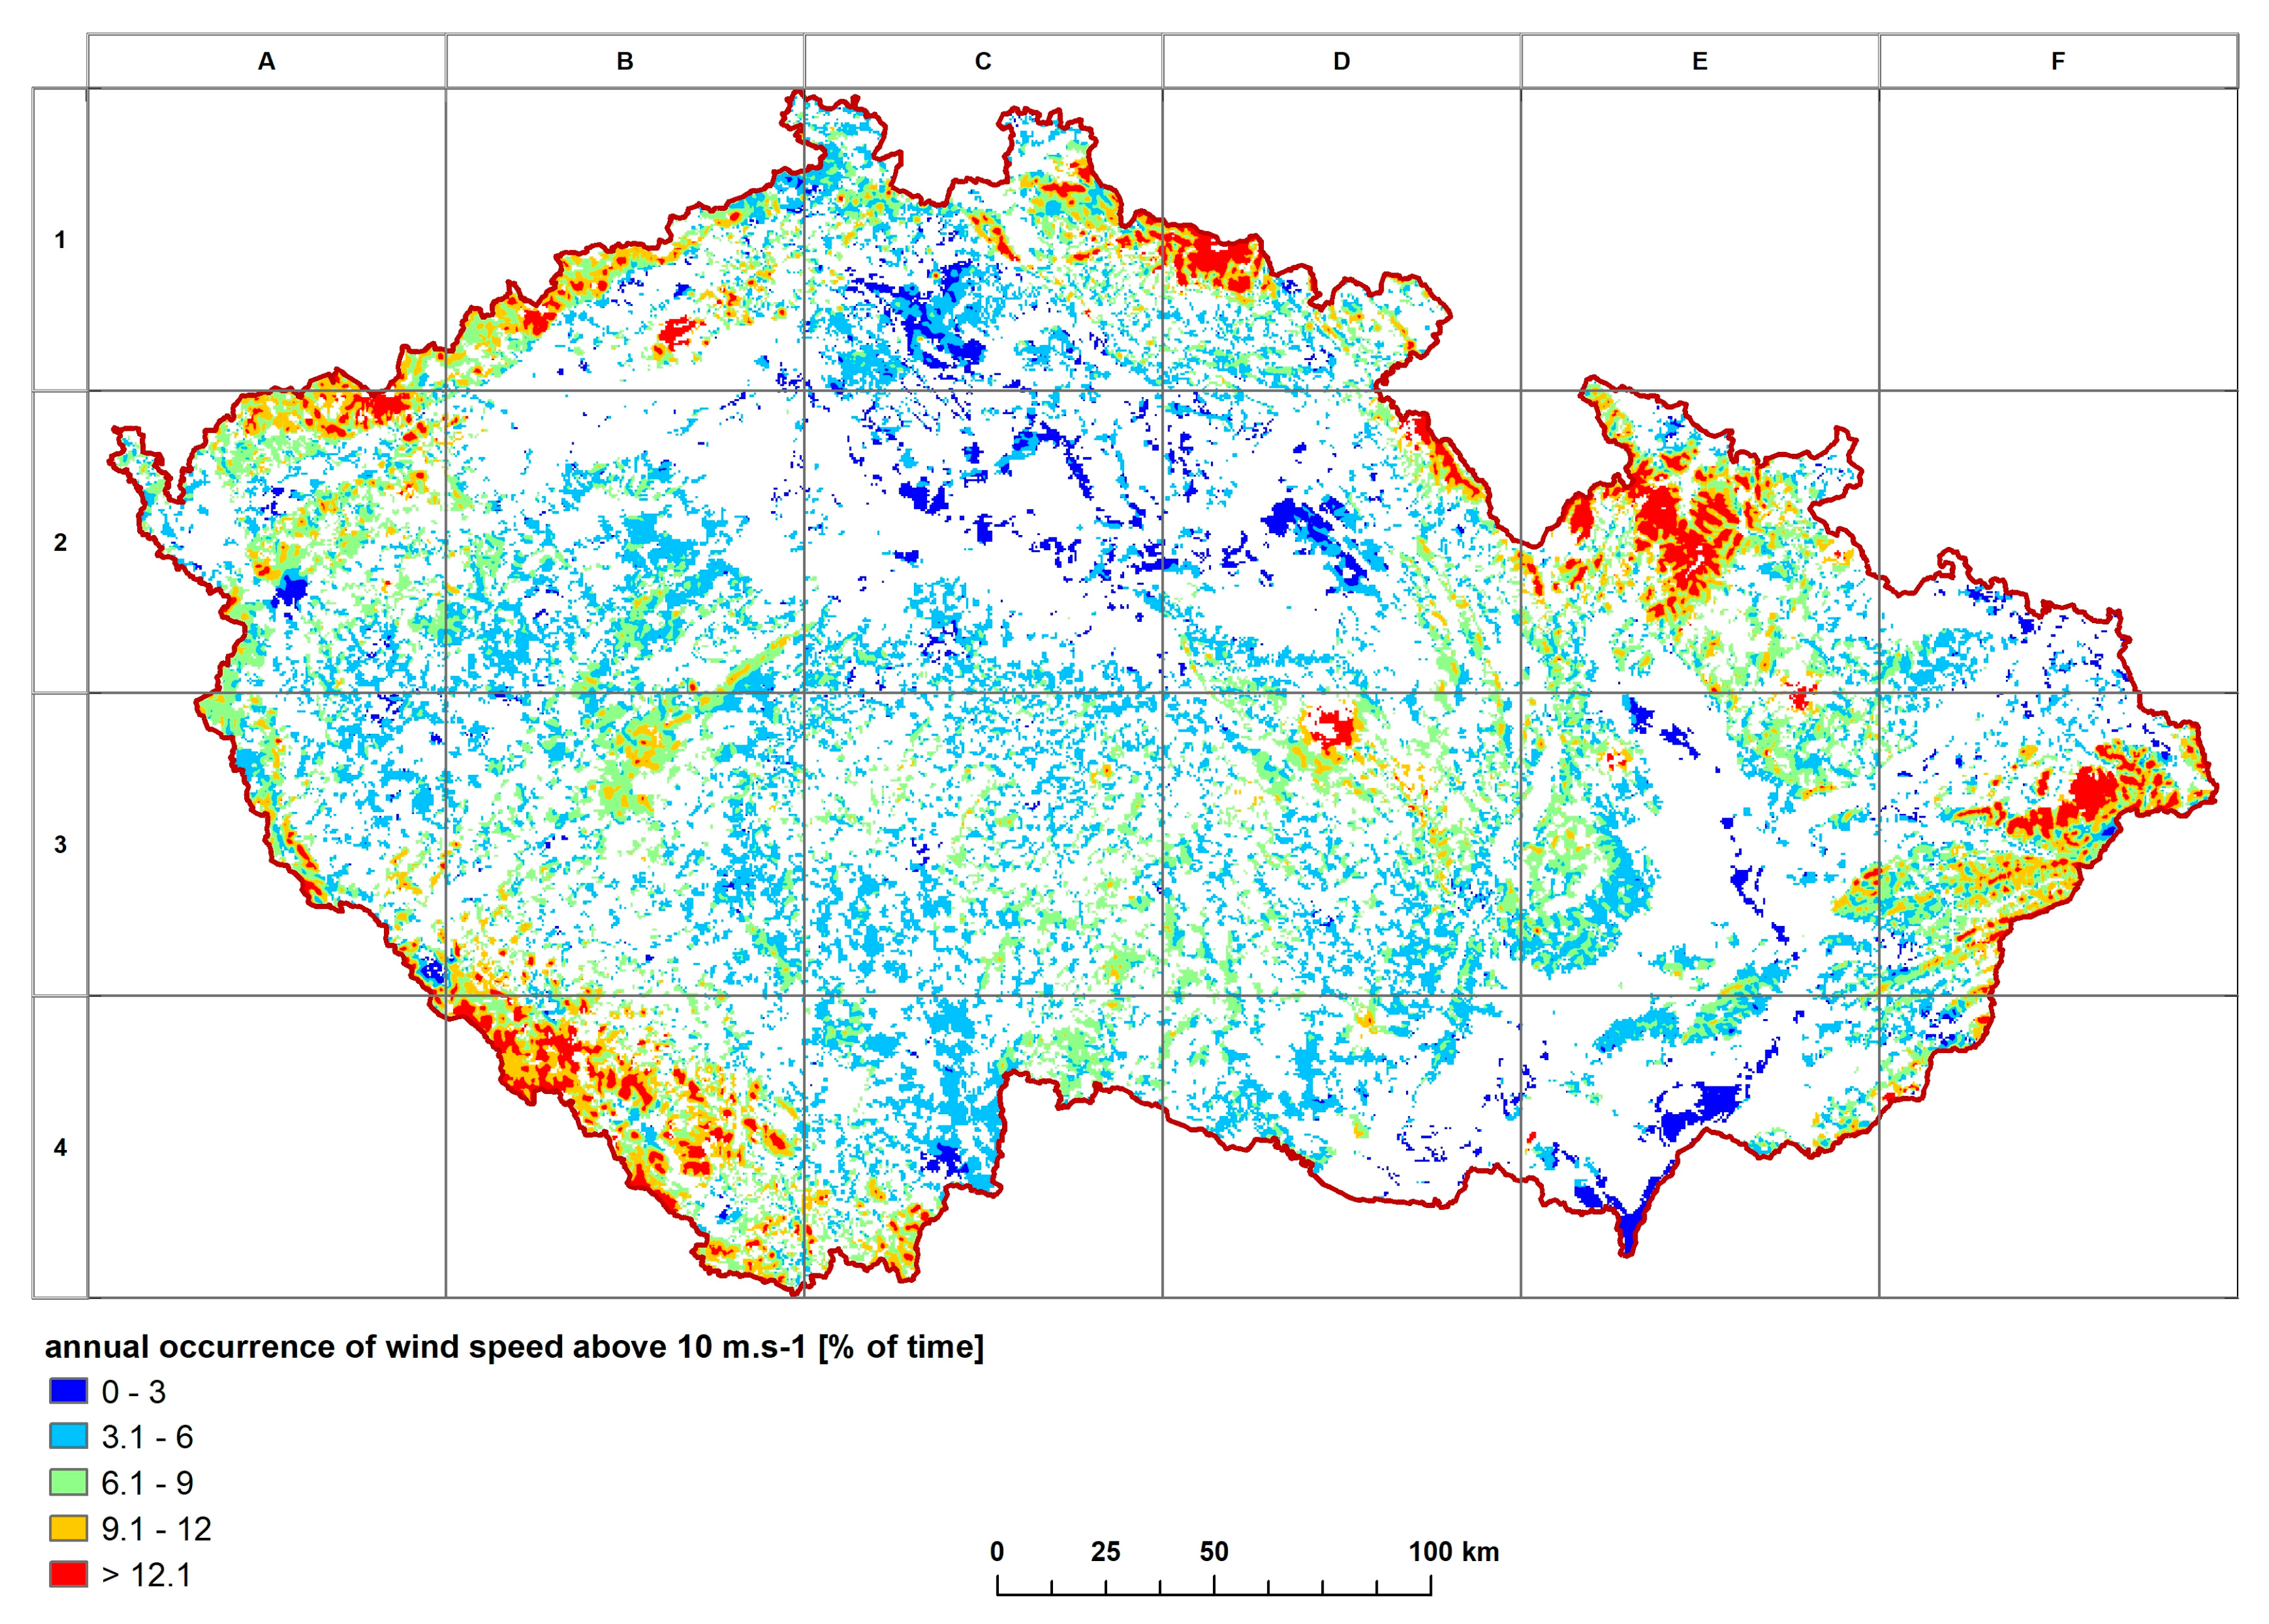
WS10: To calculate the risk of wind threat, measurements of wind gusts in 15 and 10 min intervals from a set of 210 meteorological stations during the period 2000–2019 were processed. From these values, the percentage of total measurements with wind gusts above 10 m s−1 was calculated for the whole year. The long-term average value of each of the 3 indicators for the period 2000–2019 was then calculated individually for each station used. The preparation of climatic data and subsequent statistical analysis, including interpolation, was performed using statistical tools included in the ProClim software.
2.1.6. Software Used and Interpolation Method
The point values of long-term annual water balance, long-term annual number of tropical days, and long-term annual occurrence of wind speed above 10 m s−1 for the period 2000–2019 were interpolated and used to produce raster layers. The interpolation method used for raster creation was regression kriging with residuals remaining using a set of predictors (altitude, station position, slope, and terrain orientation). The resulting raster layers were processed in the ArcGIS 10.5 environment, in which raster selection was performed only on areas with forest stands. Grids were reclassified into 5 categories and were assigned a risk level value according to Table 7. The division into categories was performed according to a constructed histogram of the grid values using Sturges’ rule and maintaining a partially regular range of value intervals. The result of the categorization is evident from the graphs of the percentage of raster cells in the individual classes.
The resulting raster layer of combined risk was created as the sum of reclassified raster layers of 3 indicators. Its categorization was performed in the same way as for the input indicators, when 5 categories with a range of intervals of 2 were determined. The individual layers of indicators, in addition to the combined risk layers, were processed into the final map form.
2.1.7. Area of Interest
The area of interest is located in central Europe (12–19 ° E, 48–51 ° N) and represents part of the Czech Republic, namely the area with forest land cover (see Figure 1). CHMI reports long-term (1990–2019) average annual precipitation of 614.4 mm, average annual temperature of 9 °C, annual average wind velocity in spring (March–May) of 2.5 m s−1, and annual average wind velocity in autumn (September–November) of 2.2 m s−1. The lowest wind velocity occurs during summer, whereas spring and autumn are windier [48].
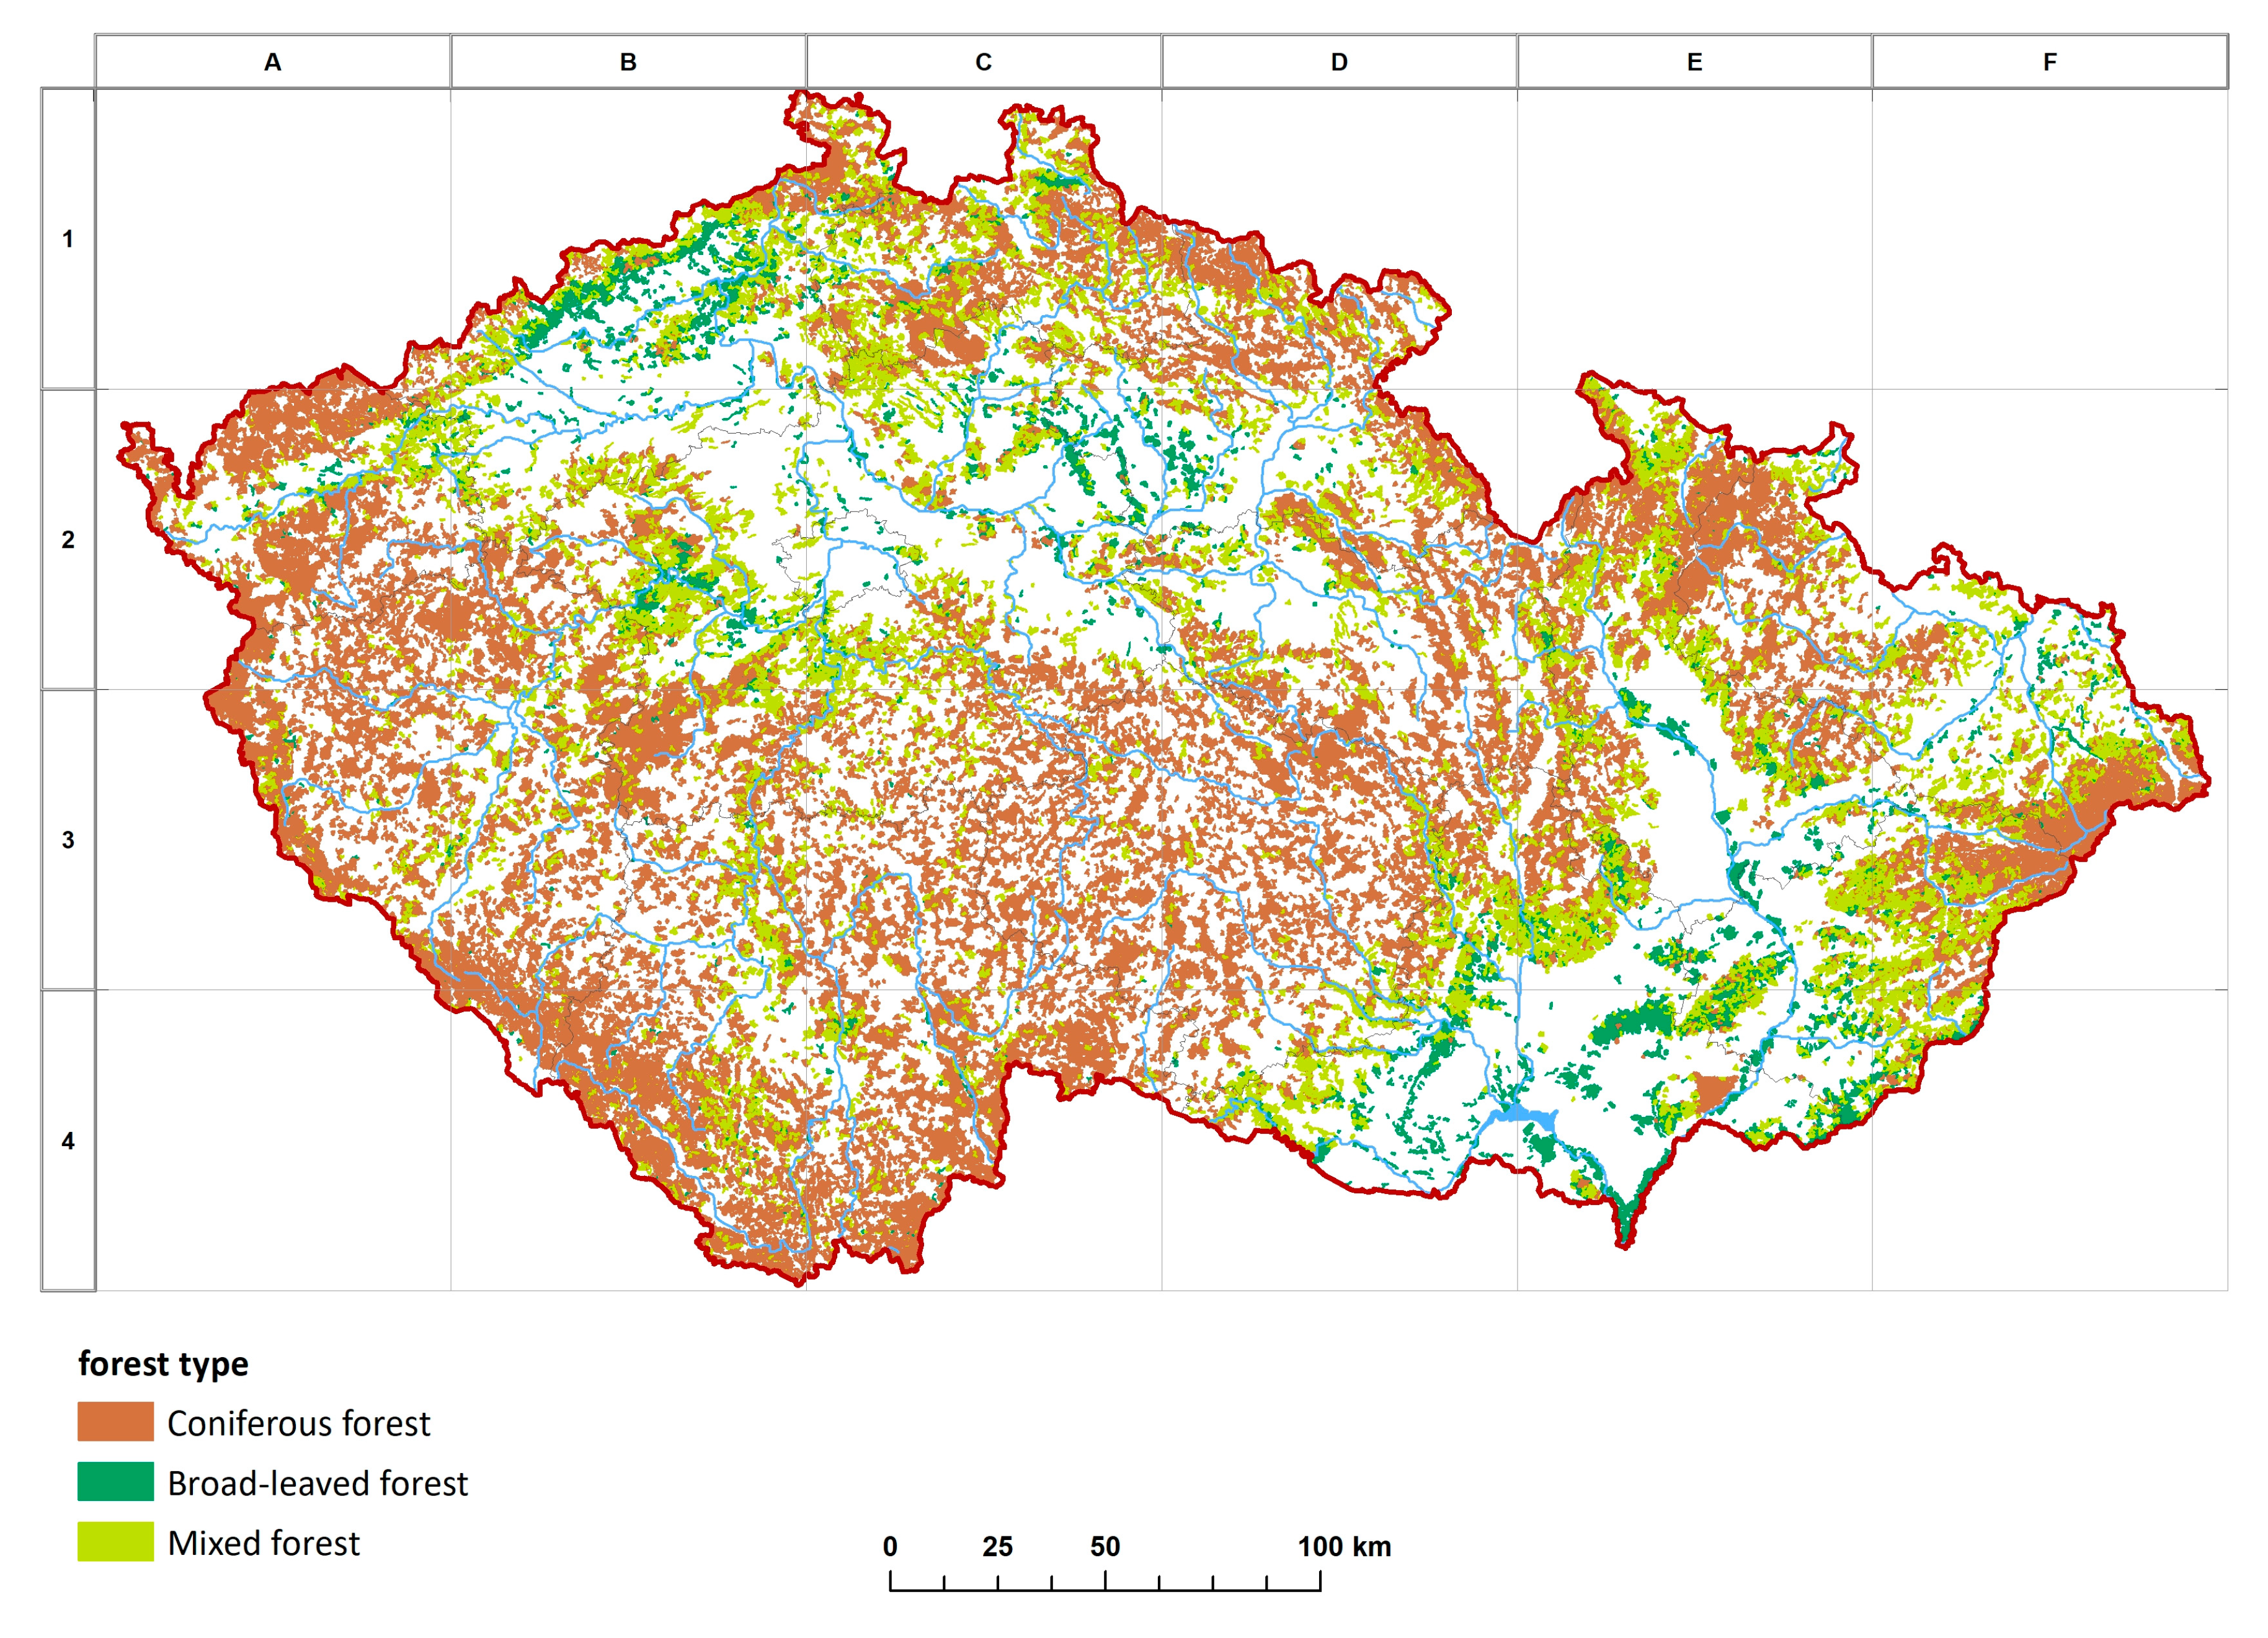
The potential natural forest cover of the Czech Republic is 98%, whereas the present-day forested area is 34%. Roughly half of the forests in the Czech Republic are managed by Lesy CR (a state enterprise). Other major owners are private owners (25%), and towns and municipalities (17%) [49]. Of the total Czech territory (comprising 78,866 km2), the forested area increased from 28.9% in 1845 to 33.7% in 2010 (29.0% in 1896, 30.2% in 1948, and 33.3% in 1990). The area of the main coniferous trees, i.e., spruce and pine, is declining, whereas the percentage of fir shows a slight, steady rise. The proportion of deciduous trees, particularly beech and oak, is also increasing. Figure 2 presents the species composition of forests in the Czech Republic.
3. Results
3.1. Estimation of Level of Risk for Each Threat Based on Results of the Threat Analysis for the Czech Republic (2015)
3.1.1. Step 4: Calculation of Long-Term Annual Value of All Indicators
The greatest risk of high temperatures due to the long-term number of tropical days is in areas with lower altitude, particularly South Moravia and central Bohemia (Figure 3). The risk based on the long-term annual water balance largely corresponds to the risk of high temperatures. The riskiest part of the Czech Republic is mainly South Moravia (Figure 4). The risk of wind gusts based on annual wind speeds above 10 m s−1 is highest in mountainous areas, i.e., the areas with the highest altitude. These mountain areas are adjacent to the borders of the Czech Republic (Figure 5).
3.1.2. Step 5: Division of Each Indicator into Five Risk Categories
According to level of risk of each threat (see Table 7), weights were assigned to indicate significance; the threat with the lowest risk level (DG: risk level of 36) was assigned a value of 1.
Table 8 provides an overall summary of all threat categories, their weights, and the range of relevant indicators.
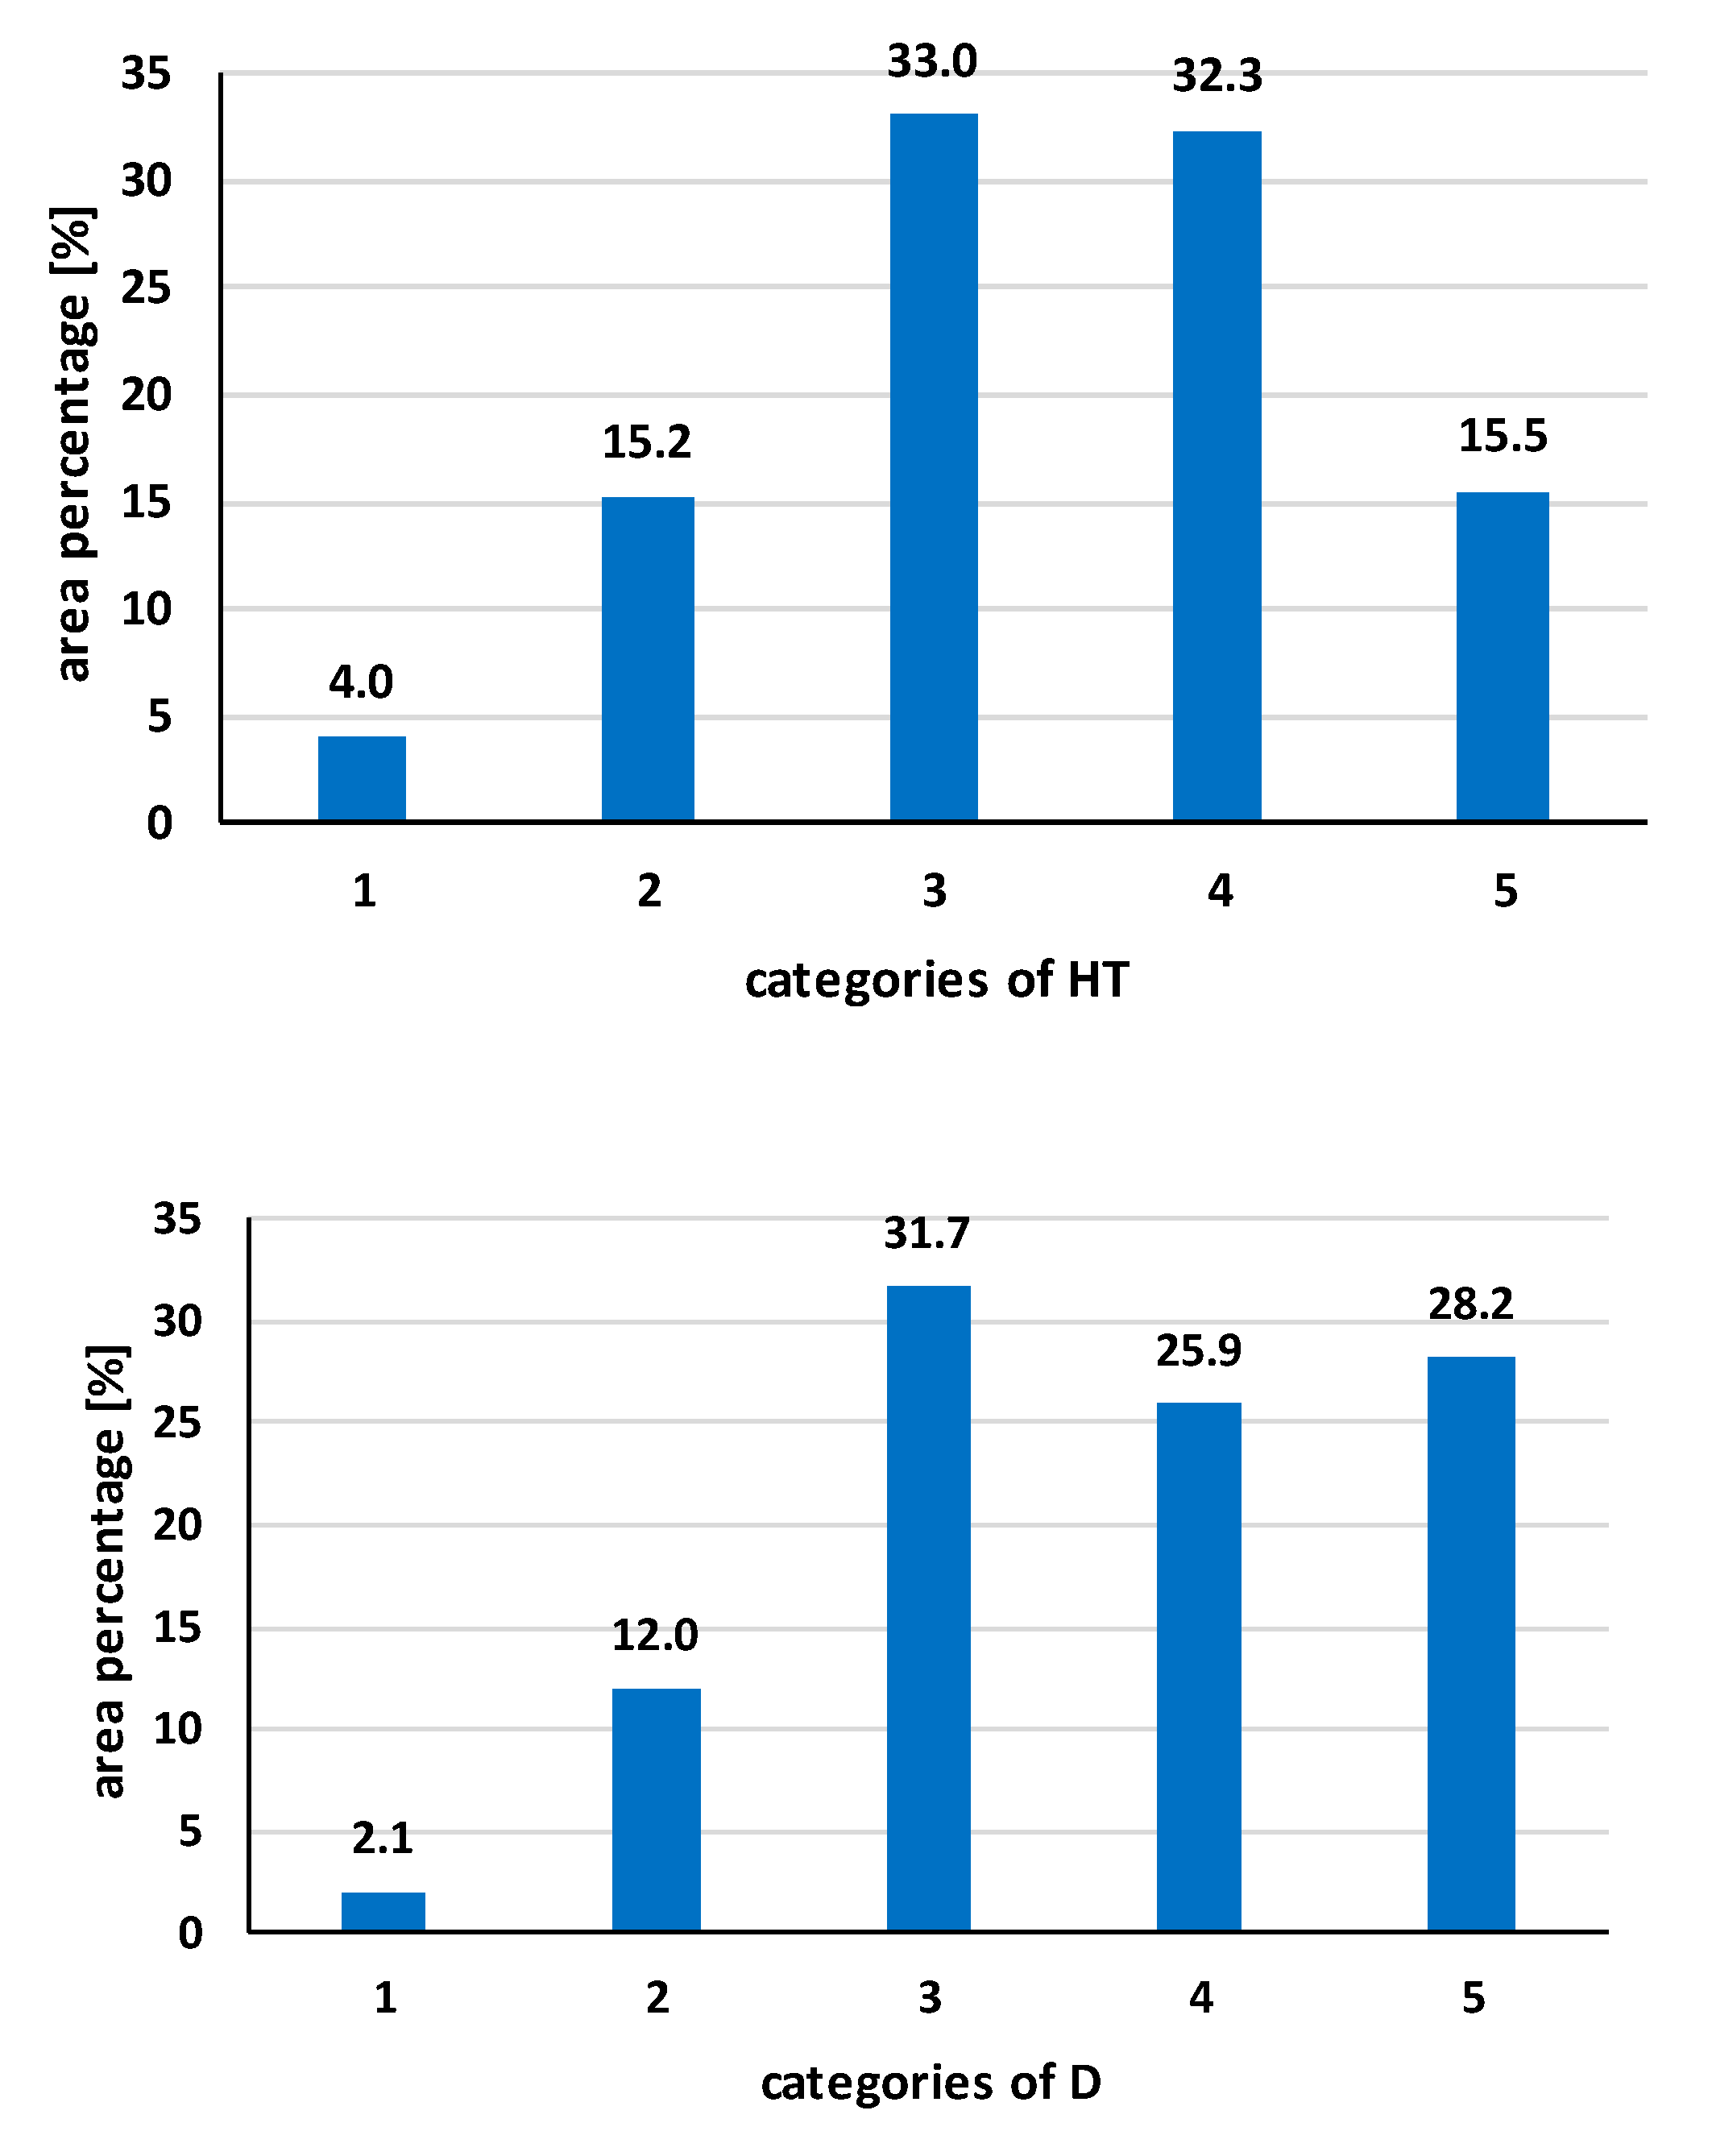
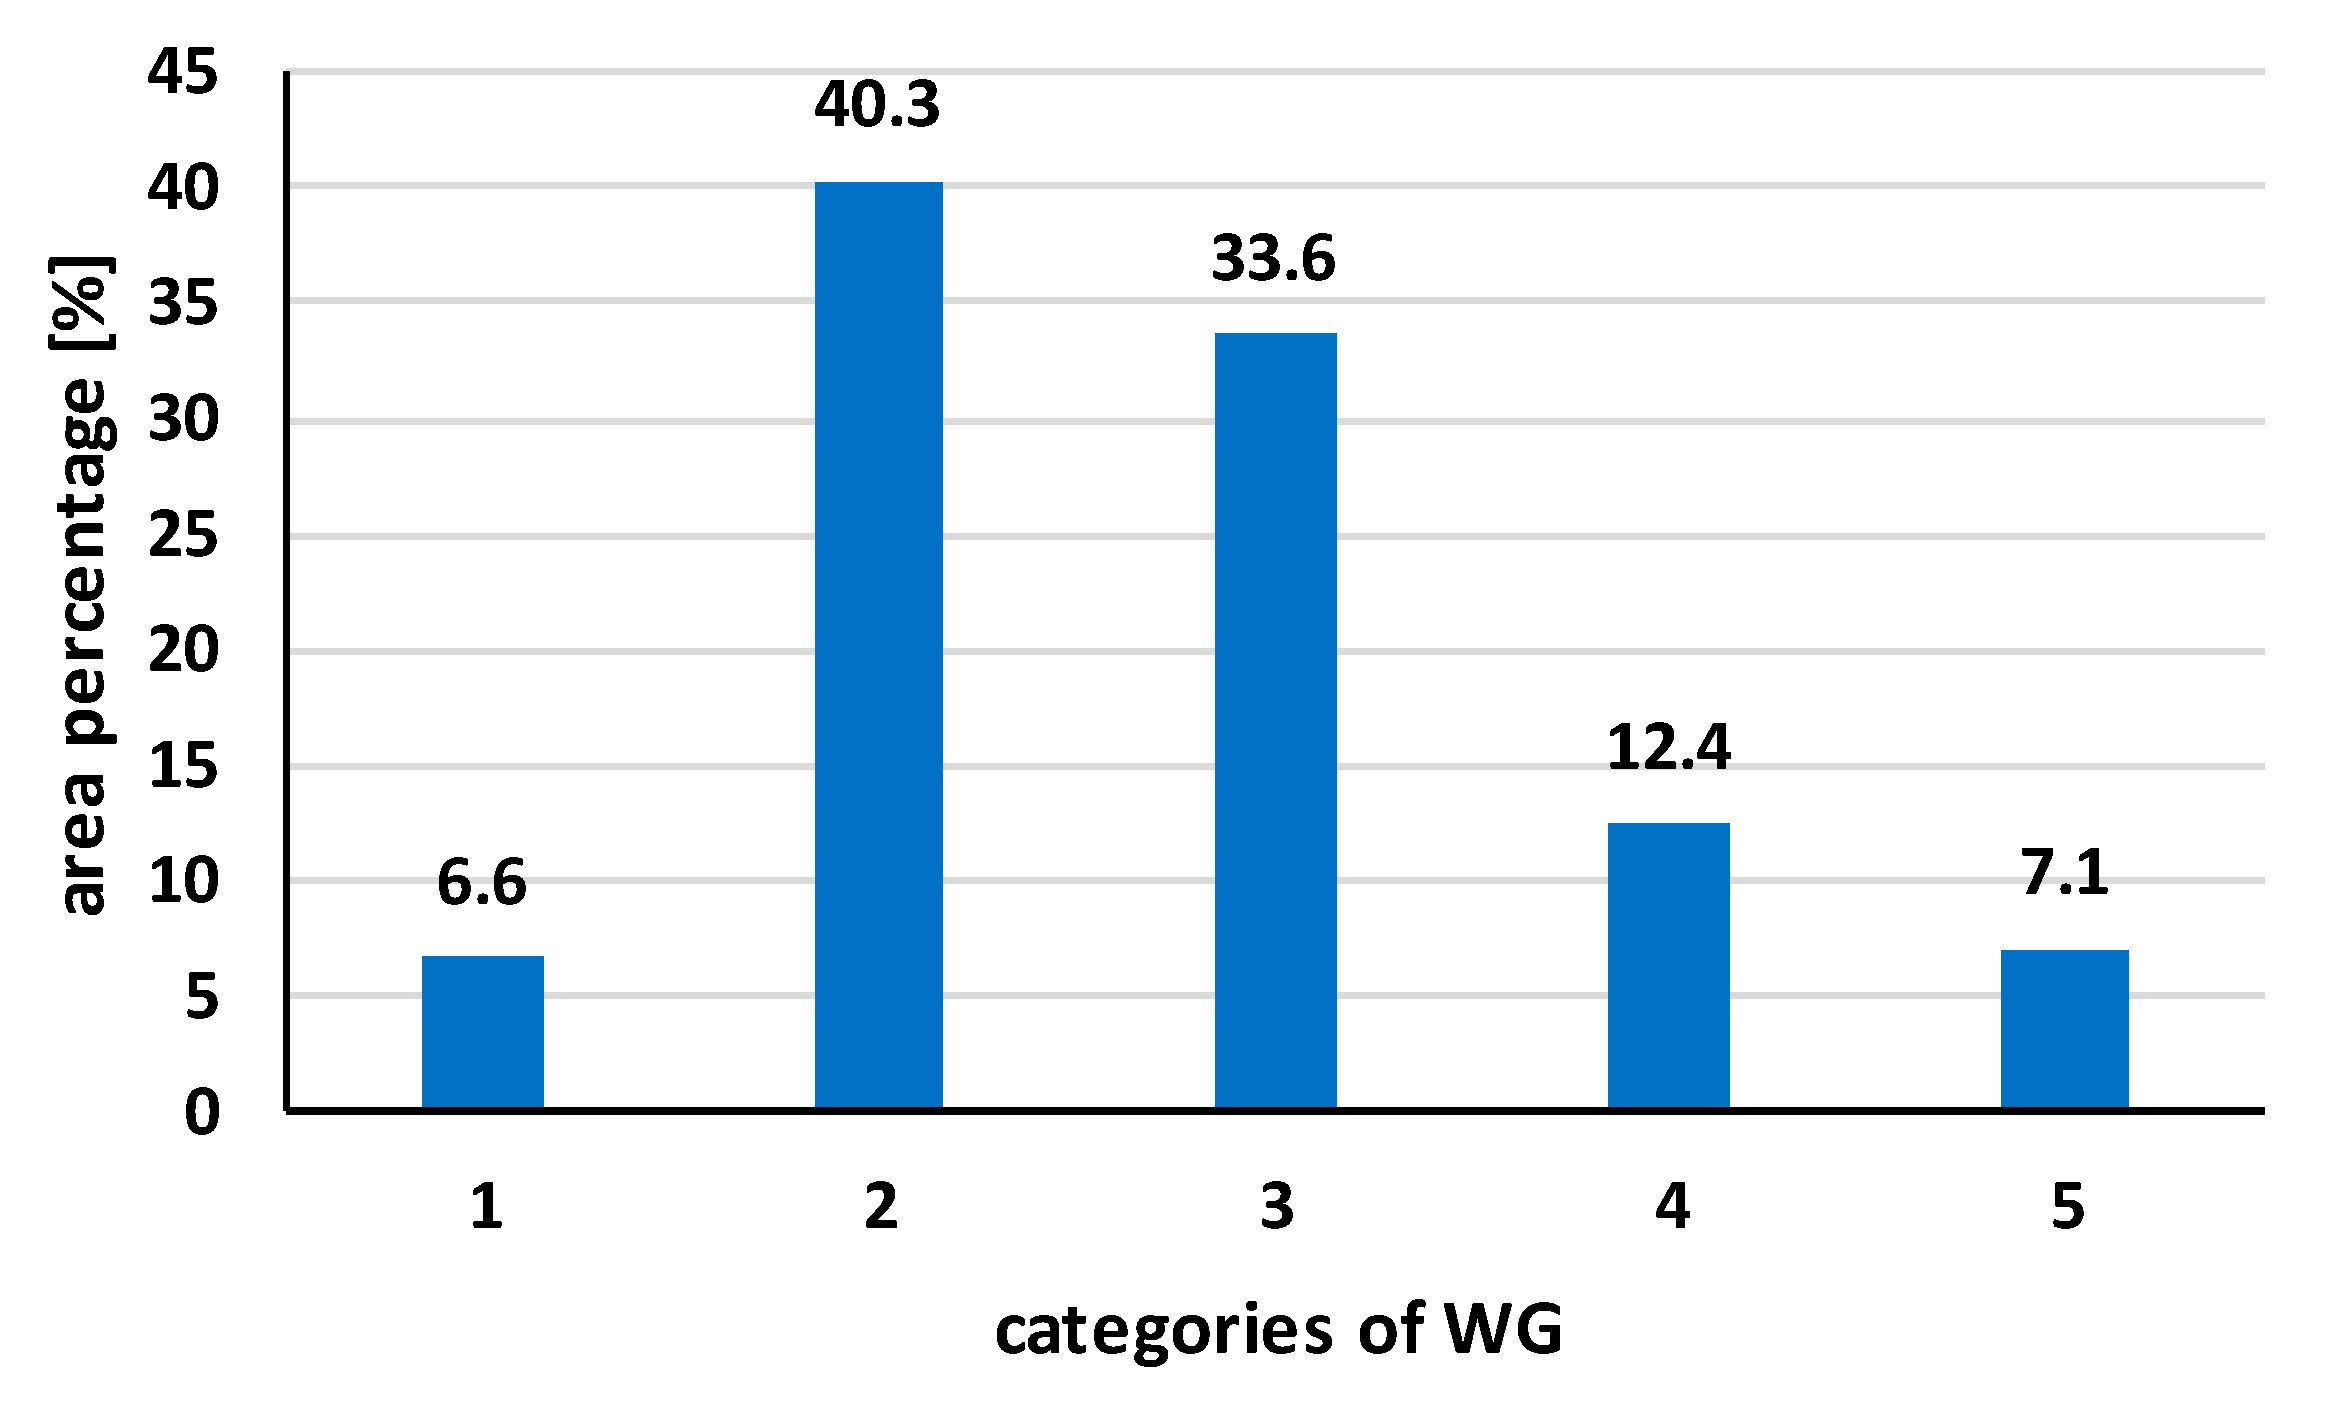
In terms of drought risk, the majority of the case study area falls into category 3. In the case of high temperatures, most areas of the case study fall into category 3. In terms of wind gust risk, category 2 covers the majority of the area (Figure 6).
3.1.3. Steps 6–8: Overlapping of Three Risk Maps, Final Determination of Combined Abiotic Risk (According to Table 7), and Spatial Expression of Combined Risk
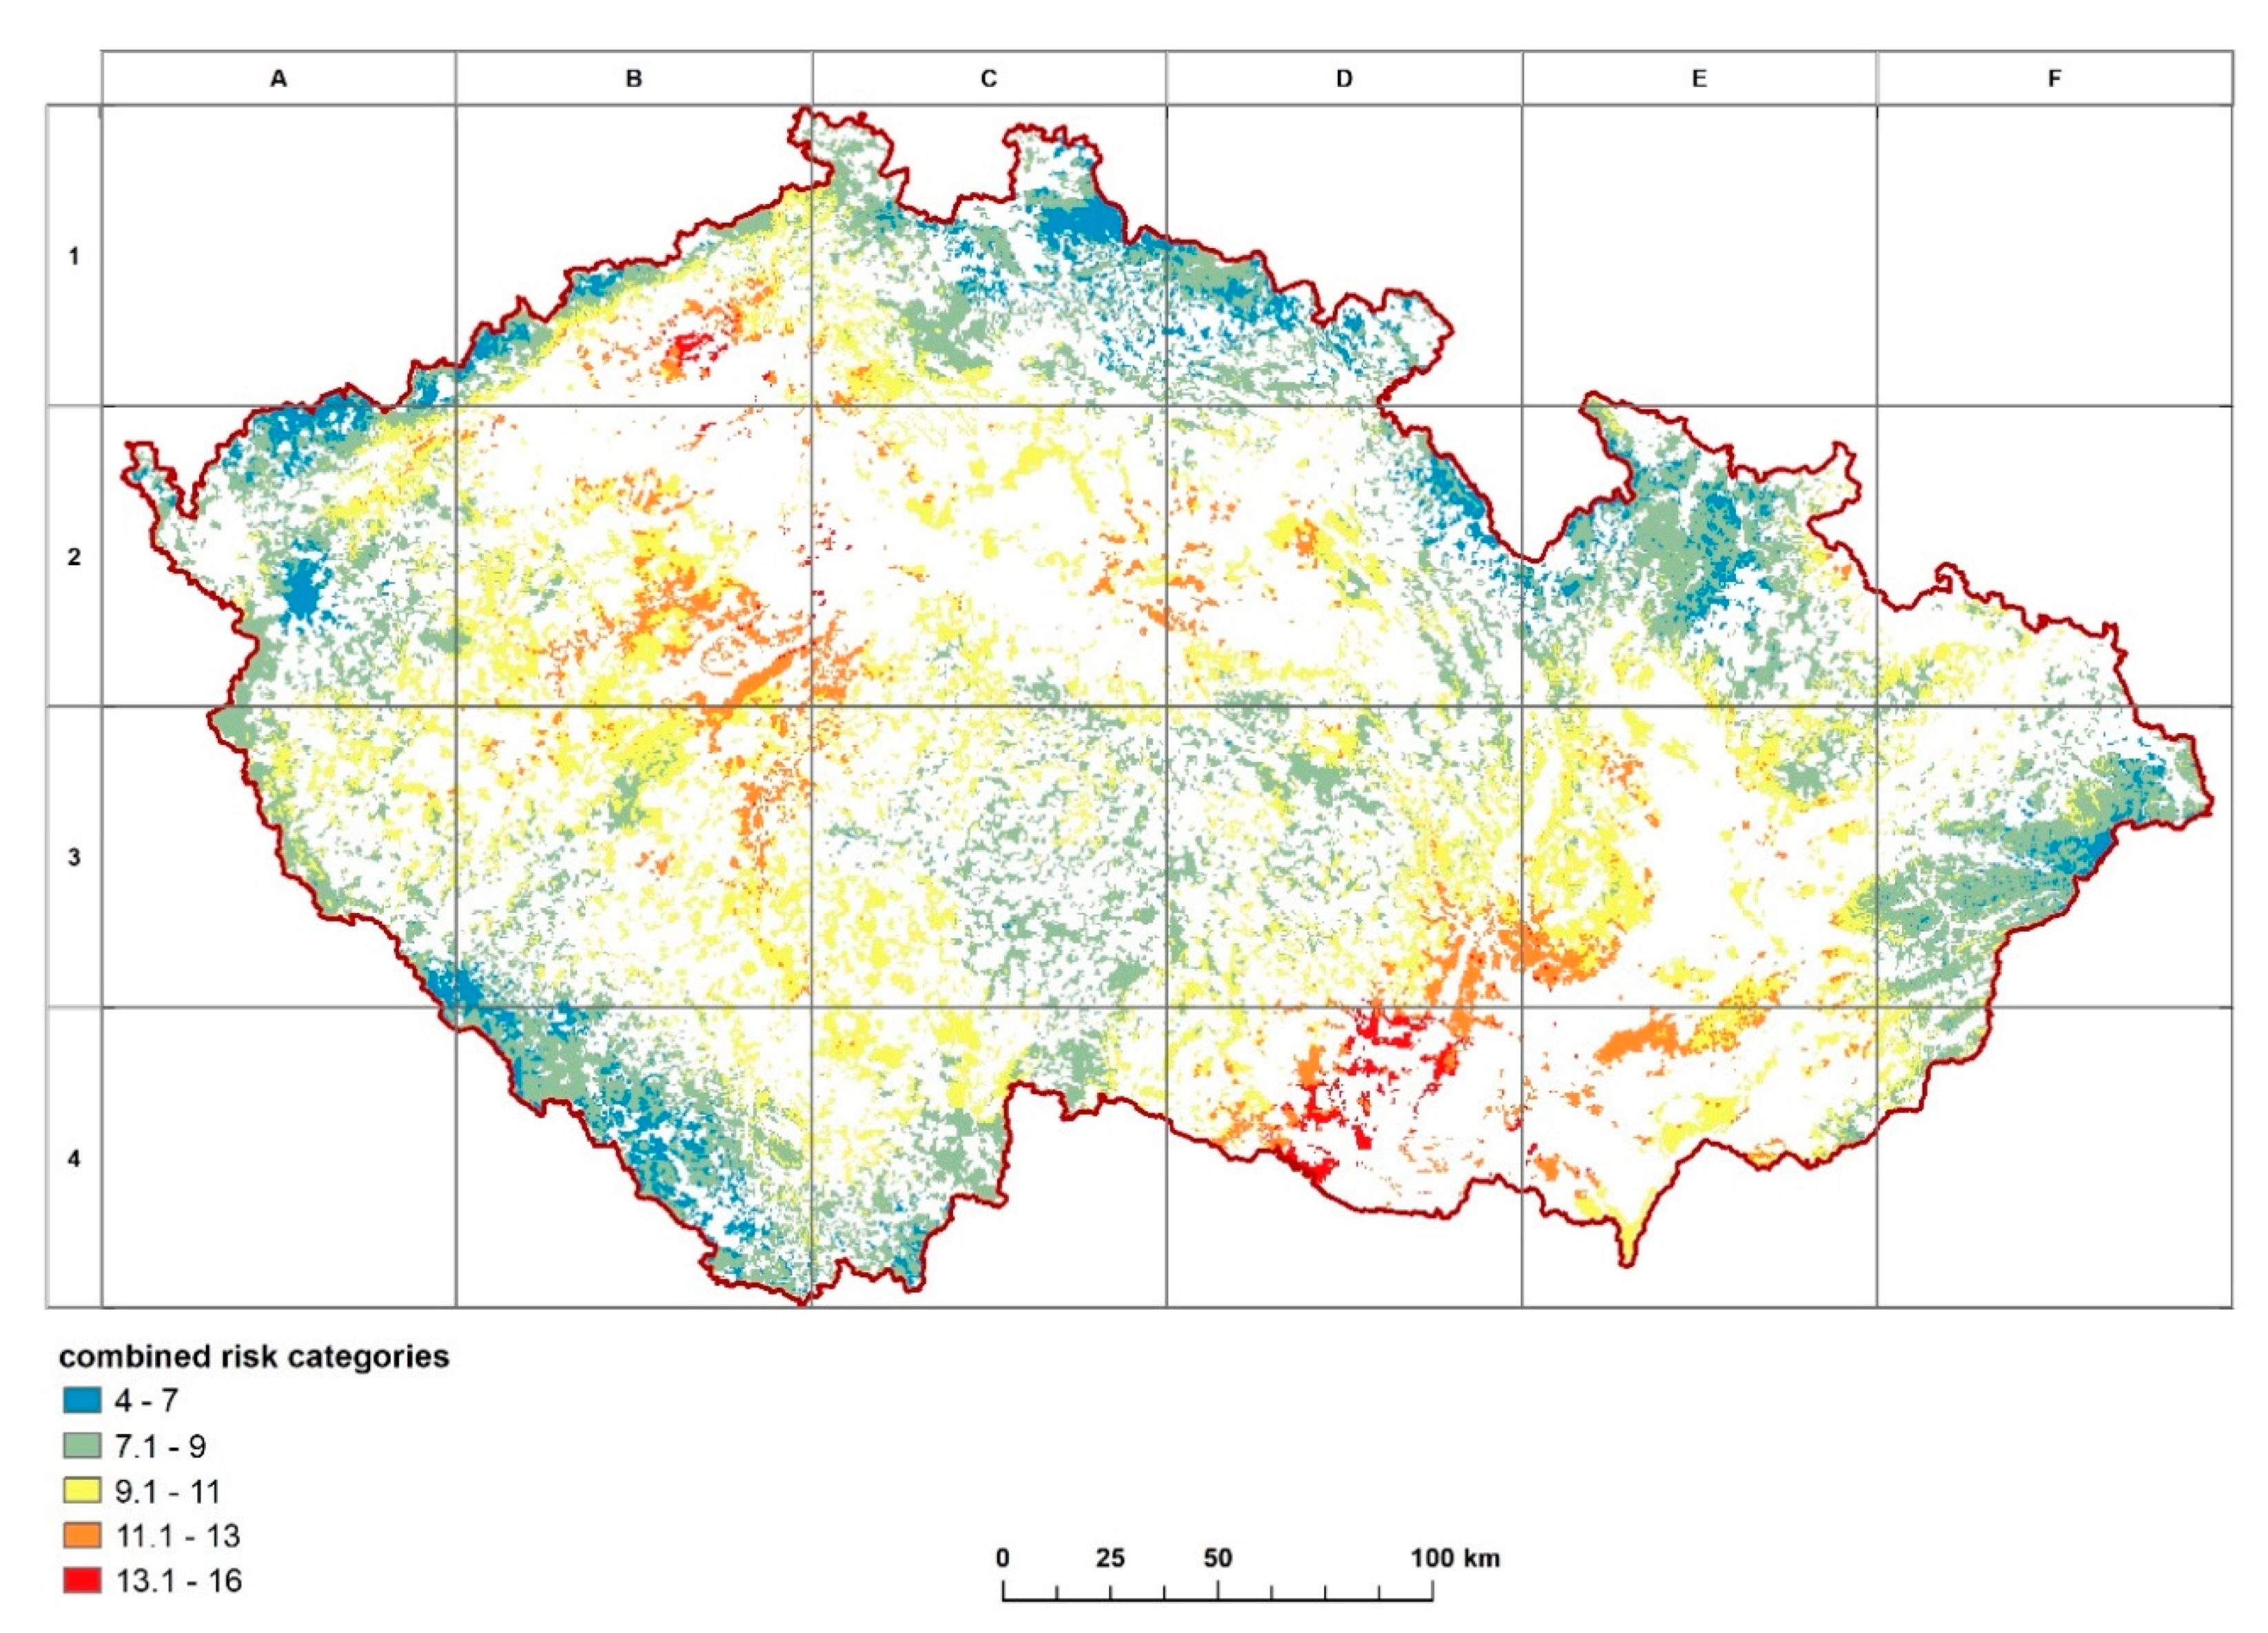
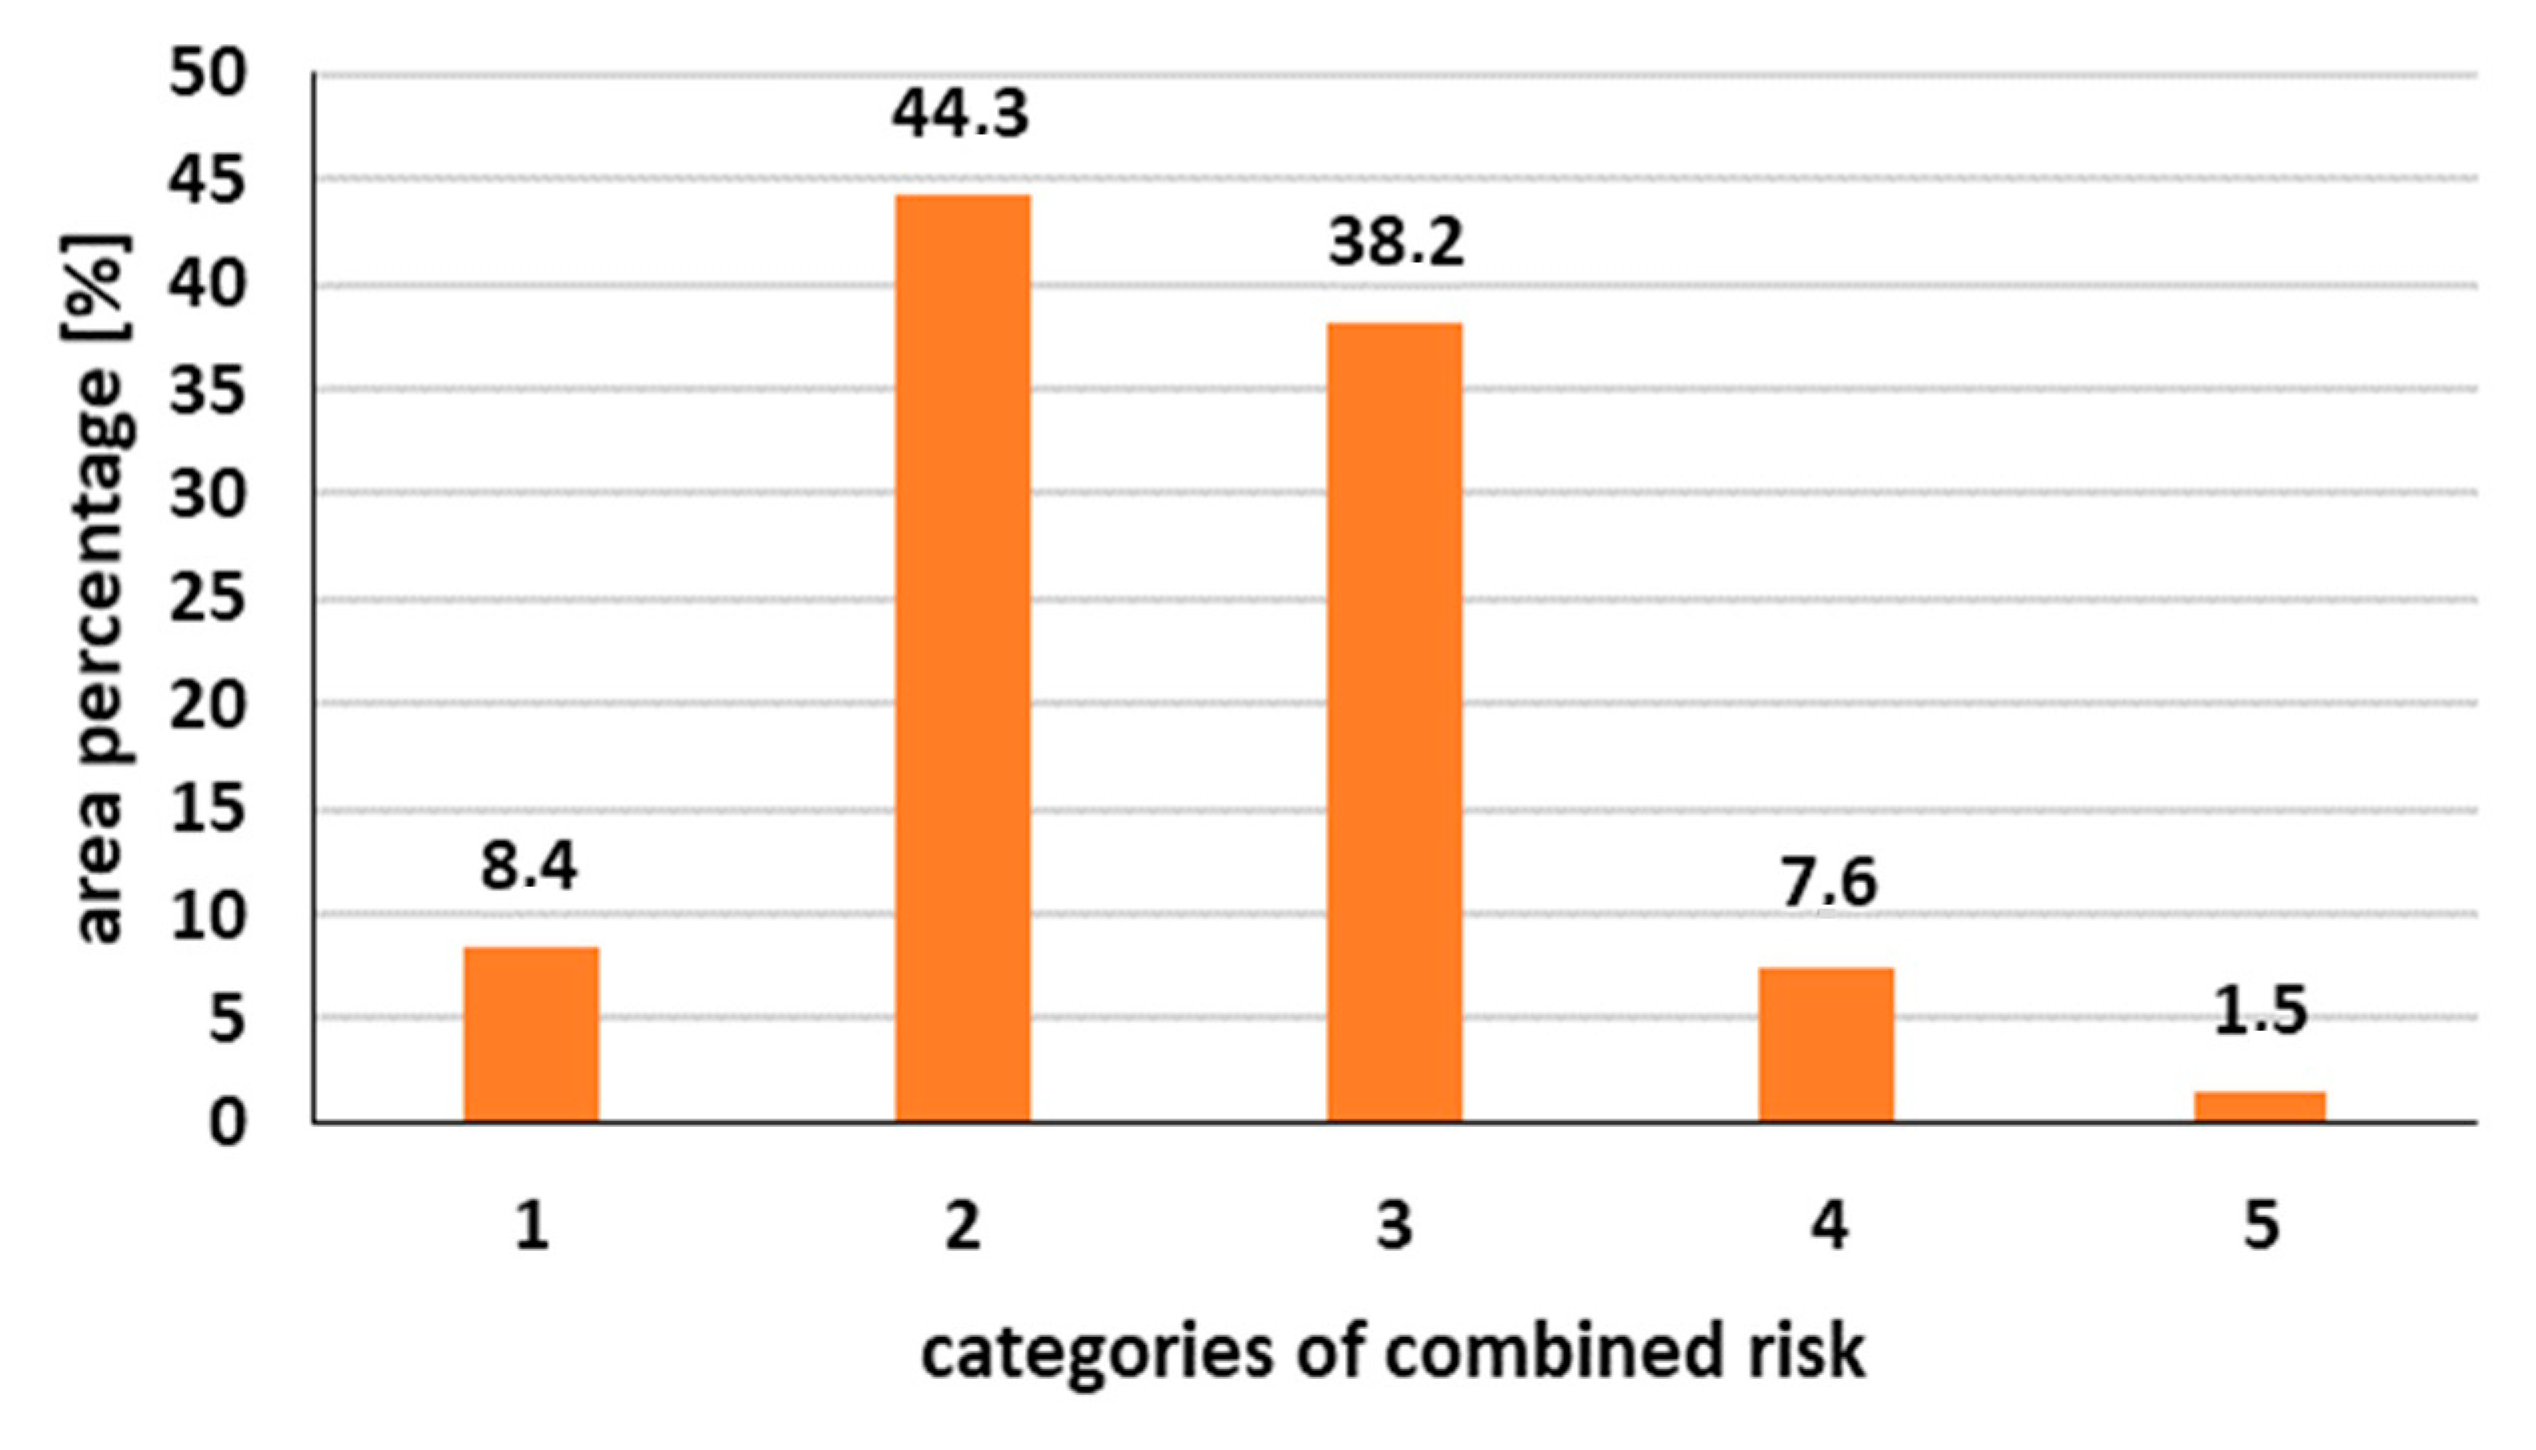
The combined risk of the abiotic stressors is shown in the map in Figure 7 and Table 10. The majority of the case study area in terms of combined risk falls into categories 2 (slight risk) and 3 (moderate risk) (approximately 82%) (Figure 8). It might be concluded that about 10% of the area (categories 4 and 5, i.e., high to very high risk) require special attention in terms of landscape adjustments, more detailed in situ measurement, or adaptive forest management to prevent ecological and economical losses and damage.
4. Discussion
Ref. [50] provided evidence of a direct link between a climate-induced increase in forest diseases and pests, and increased tree mortality. According to [17,51,52], higher temperatures also shorten the development cycles of disease and pest organisms. Many studies have found that increasing temperatures can be attributed to climate change. In their review, [53] identified six key principles for enhancing the adaptive capacity of European temperate forests in a changing climate. Climate change causes various extreme weather events, floods, and droughts, thus leading to a reduction in water quality and availability, frequent heat waves, etc. High temperature combined with severe drought and strong wind creates suitable conditions for the starting and fast spread of wildfires. Burning biomass then releases increased greenhouse gases, e.g., CO2. Ref. [54] quantified the greenhouse gas emissions from forest fires in the European Slovak Paradise National Park, in which fire destroyed an area of 80 ha in the year 2000.
Severe and repeated droughts are currently considered one of the main factors contributing to forest dieback in Central Europe. Under Central European climatic conditions, tree species do not have sufficiently efficient defense mechanisms or strategies to survive severe drought periods without a negative impact on their physiological processes and growth. This is evidenced by the drought events in 2000, 2003, 2012, and 2018 [22,28], which had a major impact on the forest ecosystems of Central Europe. In humid temperate conditions, intense periods of drought should not be considered isolated extreme events, but events that can occur with increasing frequency in the near future [55].
Natural reserves in Central Europe, such as the Low Tatras National Park in Slovakia and the Sumava National Park in Czechia, were damaged by wind and bark beetle outbreaks, which had a major influence on the health of the forest vegetation at the end of the 20th and beginning of the 21st century.
In November 2004, forest with an area of 12,000 ha in the Tatra National Park, Slovakia, was seriously damaged by northern wind gusts exceeding 200 km h−1. In July 2005, a wildfire broke out in a wind-damaged area of 220 ha [56]. The results of [57] showed that, in addition to economic losses, the fire caused significant environmental changes to the structure and properties of humic acid. However, [58] claimed that forest regeneration on sites cleared of windthrow is less intensive than in those forest ecosystems which were subjected to direct human impact, i.e., clear cuttings.
Sufficient evidence exists that individual threats, such as drought, hot weather, and extreme winds, represent a serious danger, not only for forest ecosystems, but for all natural and anthropogenic ecosystems. When these influences occur at the same time or when a given area is affected by more of them in a short time, their negative effect is considerably stronger. Although a complex analysis of forest damage was not the goal of this paper, various data on real detrimental impacts on forests provide a large amount of evidence that the health of forests largely reflects the zoning derived in the current study. Monitoring of agents that cause damage to forests (e.g., recorded damage to stands by wind; recorded damage to stands by drought; volume of spruce wood infested by bark beetles) in the Czech Republic has been undertaken by several institutions using various methods (Forestry and Game Management Research Institute [59], the Ministry of Agriculture of the Czech Republic [60], the Forest Management Institute [61]). Based on this monitoring, we can conclude that the spatial expression of combined risk in Figure 7 generally corresponds to the actual occurrence of agents causing forest damage. This is particularly true of sector D4, which was strongly affected by severe drought and an infestation of bark beetles in 1 ha of spruce stands; the area was classified as an area with significant deterioration in health status between 2016 and 2019. From this perspective, we can conclude that Figure 7 represents the potential combined risk of forest damage due to climate effects. The real impact of these risks on the forests will only be revealed in combination with actual data on stand structure, pests, and various diseases. This idea thus indicates a direction for future research i.e., validation of the findings of the current study via comparison of the “potential climate-driven combined risk” with the “real effect” of the risks on the forests.
A complex analysis of forest damage is a challenging research issue that has been addressed by a number of authors [62,63,64]. These previous surveys of forest damage can be significantly enhanced by a comprehensive analysis of multiple abiotic hazards which, combined with analysis of other relevant stressors, might help to identify crucial causes of forest damage.
Spatial expression of the different levels of combined risk might help optimize management and thus increase forest resilience. Theoretically, when the riskiest areas are combined with appropriate forest management, it is possible to avoid detrimental impacts on the forest landscape.
5. Conclusions
Using [14] we identified and employed key climatic elements that pose a threat to forests, namely drought, high temperature, and strong wind. When these elements are combined it is possible to evaluate the resulting level of combined risk. The developed methodological road map enables an application of the method for various conditions. We applied the method to a case study, in which we also suggested possible indicators for each element. The elements under investigation not only represent the current risks—their effect is expected to strengthen in the future due to climate change.
Although complex analysis of forest damage was not the goal of our paper, various data on real detrimental impacts on forests provide a large amount of evidence that the health of forests largely reflects the zoning derived in the current study. Biological evidence of detrimental impact is also affected by other stressors, both abiotic (such as thick and dense snow cover, winter windstorms, and heavy frosts) and biotic (e.g., the wide distribution of pests, gnawing of trees by animals), which are beyond the scope of our paper.
The potential climate-driven combined risk of forest damage might help to address the question of how information about multiple hazards in forest ecosystems can be incorporated into management decisions. Figure 7 represents one of the crucial conceptual tools to achieve a stable and resilient landscape structure. To be effective, forest management research and practice requires explicit articulation of their objectives, which should be interpreted and translated into real actions. Our results provide a useful tool for all stakeholders, particularly communities, municipalities, and government who are responsible for effective landscape planning and management. To do so, these stakeholders demand high quality data and analyses that can support their decision making. Based on our method it is possible to set threshold values that, when exceeded, trigger landscape adjustments or more detailed in situ measurements, or indicate a need of specific management.
In addition to the conceptual dimension, it is also necessary to address the issue of the real effect of abiotic threats on forest ecosystems. Follow-up research should thus focus on validation of the combined risk map using: (i) identification of the most vulnerable segments from A1 to F4, (ii) selection of appropriate data on the real occurrence of forest damage [59,60,61], and (iii) validation of the potential climate-driven combined risk.
Author Contributions
Conceptualization, H.S.; methodology, H.S.; software, F.C.; validation, T.S.; formal analysis, P.F.; resources, P.F.; writing—original draft preparation, P.F. and H.S.; writing—review and editing, T.S.; All authors have read and agreed to the published version of the manuscript.
Funding
This research was funded by the Ministry of Agriculture of the Czech Republic (National Agency of Agricultural Research Ministry of Agriculture of the Czech Republic) project No. QK1710197 Optimization of methods for the assessment of vulnerability to wind erosion and proposals of protective measures in intensively exploited agricultural countryside.
Conflicts of Interest
The authors declare no conflict of interest. The funders had no role in the design of the study; in the collection, analyses, or interpretation of data; in the writing of the manuscript, or in the decision to publish the results.
References
- Mezei, P.; Jakuš, R.; Pennerstorfer, J.; Havašová, M.; Škvarenina, J.; Ferenčík, J.; Slivinský, J.; Bičárová, S.; Bilčík, D.; Blaženec, M.; et al. Storms, temperature maxima and the Eurasian spruce bark beetle Ips typographus—An infernal trio in Norway spruce forests of the Central European High Tatra Mountains. Agric. For. Meteorol. 2017, 242, 85–95. [Google Scholar] [CrossRef]
- Andreassen, K.; Solberg, S.; Tveito, O.A.; Lystad, S.L. Regional differences in climatic responses of Norway spruce (Picea abies L. Karst) growth in Norway. For. Ecol. Manag. 2006, 222, 211–221. [Google Scholar] [CrossRef]
- Bonan, G.B. Forests and Climate Change: Forcings, Feedbacks, and the Climate Benefits of Forests. Science 2008, 320, 1444–1449. [Google Scholar] [CrossRef] [PubMed] [Green Version]
- Sidor, C.G.; Bosela, M.; Büntgen, U.; Vlad, R. Mixed effects of climate variation on the Scots pine forests: Age and species mixture matter. Dendrochronologia 2018, 52, 48–56. [Google Scholar] [CrossRef]
- Chuchma, F.; Středová, H.; Středa, T. Bioindication of climate development on the basis of long-term phenological observation. In Proceedings of the International PhD Students Conference (MendelNet 2016), Brno, Czech Republic, 9–10 November 2016; Mendel University in Brno: Brno, Czech Republic, 2016; pp. 380–383. [Google Scholar]
- Pourghasemi, H.R.; Gayen, A.; Edalat, M.; Zarafshar, M.; Tiefenbacher, J.P. Is multi-hazard mapping effective in assessing natural hazards and integrated watershed management? Geosci. Front. 2020, 11, 1203–1217. [Google Scholar] [CrossRef]
- United Nations Office for Disaster Risk Reduction. Sendai Framework for Disaster Risk Reduction 2015–2030; United Nations Office for Disaster Risk Reduction: Geneva, Switzerland, 2015. [Google Scholar]
- European Council. Internal Security Strategy for the European Union—Towards a European Security Model; Publications Office of the European Union: Luxembourg, 2010. [Google Scholar]
- General Assembly Resolution A/RES/70/1. Transforming Our World, the 2030 Agenda for Sustainable Development. Available online: https://www.un.org/ga/search/view_doc.asp?symbol=A/RES/70/1&Lang=E (accessed on 22 September 2020).
- United Nations Framework Convention on Climate Change (UNFCCC). Decision 1/CP.21: Adoption of the Paris Agreement. Available online: https://unfccc.int/files/essential_background/convention/application/pdf/english_paris_agreement.pdf (accessed on 22 September 2020).
- North Atlantic Treaty Organization. Active Engagement, Modern Defence, Strategic Concept for the Defence and Security of the Members of the North Atlantic Treaty Organisation Adopted by Heads of State and Government in Lisbon; NATO Public Diplomacy Division: Brussels, Belgium, 2010. [Google Scholar]
- Aktualizace Koncepce Environmentální Bezpečnosti, a to na Období 2016–2020 s Výhledem do Roku 2030 [in Czech]. Available online: https://www.dataplan.info/img_upload/7bdb1584e3b8a53d337518d988763f8d/koncepce-2015.pdf (accessed on 22 September 2020).
- Security Strategy of the Czech Republic 2015. Available online: http://www.army.cz/images/id_8001_9000/8503/Security_Strategy_2015.pdf (accessed on 22 September 2020).
- MOI (Ministry of the Interior of the Czech Republic) Threat Analysis for the Czech Republic (2015). Database of Strategies. Portal of Strategic Documents in the Czech Republic. Available online: https://www.databaze-strategie.cz/cz/mv/strategie/aanlyza-hrozeb-pro-ceskou-republiku-2015 (accessed on 16 September 2020).
- Teskey, R.; Wertin, T.; Bauweraerts, I.; Ameye, M.; McGuire, M.A.; Steppe, K. Responses of tree species to heat waves and extreme heat events. Plant Cell Environ. 2014, 38, 1699–1712. [Google Scholar] [CrossRef]
- Středa, T.; Litschmann, T.; Středová, H. Relationship between tree bark surface temperature and selected meteorological elements. Contrib. Geophys. Geod. 2015, 45, 299–311. [Google Scholar] [CrossRef] [Green Version]
- Středa, T.; Středová, H.; Rožnovský, J. Orchards microclimatic specifics. In Bioclimate: Source and Limit of Social Development. Nitra, Slovak Republic; Slovak Agricultural University: Nitra, Slovak, 2011; pp. 132–133. [Google Scholar]
- Seidl, R.; Thom, D.; Kautz, M.; Martin-Benito, D.; Peltoniemi, M.; Vacchiano, G.; Wild, J.; Ascoli, D.; Petr, M.; Honkaniemi, J.; et al. Forest disturbances under climate change. Nat. Clim. Chang. 2017, 7, 395–402. [Google Scholar] [CrossRef] [Green Version]
- Škvarenina, J.; Tomlain, J.; Hrvo, J.; Škvareninová, J. Occurrence of Dry and Wet Periods in Altitudinal Vegetation Stages of West Carpathians in Slovakia: Time-Series Analysis 1951–2005. In Bioclimatology and Natural Hazards; Střelcová, K., Ed.; Springer: Dordrecht, The Netherlands, 2009; pp. 97–106. [Google Scholar] [CrossRef]
- Schuldt, B.; Buras, A.; Arend, M.; Vitasse, Y.; Beierkuhnlein, C.; Damm, A.; Gharun, M.; Grams Thorsten, E.E.; Hauck, M.; Hajek, P.; et al. A first assessment of the impact of the extreme 2018 summer drought on Central European forests. Basic Appl. Ecol. 2020, 45, 86–103. [Google Scholar] [CrossRef]
- Rajczak, J.; Pall, P.; Schär, C. Projections of extreme precipitation events in regional climate simulations for Europe and the Alpine Region. J. Geophys. Res.-Atmos. 2013, 118, 3610–3626. [Google Scholar] [CrossRef]
- Vido, J.; Střelcová, K.; Nalevanková, P.; Leštianska, A.; Kandrík, R.; Pástorová, A.; Škvarenina, J.; Tadesse, T. Identifying the relationships of climate and physiological responses of a beech forest using the Standardised Precipitation Index: A case study for Slovakia. J. Hydrol. Hydromech. 2016, 64, 246–251. [Google Scholar] [CrossRef] [Green Version]
- Šustek, Z.; Vido, J.; Škvareninová, J.; Škvarenina, J.; Šurda, P. Drought impact on ground beetle assemblages (Coleoptera, Carabidae) in Norway spruce forests with different management after windstorm damage–a case study from Tatra Mts. (Slovakia). J. Hydrol. Hydromech. 2017, 65, 333–342. [Google Scholar] [CrossRef] [Green Version]
- Bartík, M.; Sitko, R.; Oreňák, M.; Slovik, J.; Škvarenina, J. Snow accumulation and ablation in disturbed mountain spruce forest in West Tatra Mts. Biologia 2014, 69, 1492–1501. [Google Scholar] [CrossRef]
- Bartík, M.; Holko, L.; Jančo, M.; Škvarenina, J.; Danko, M.; Kostka, Z. Influence of mountain spruce forest dieback on snow accumulation and melt. J. Hydrol. Hydromech. 2019, 67, 59–69. [Google Scholar] [CrossRef] [Green Version]
- Dorman, M.; Svoray, T.; Perevolotsky, A. Homogenization in forest performance across an environmental gradient—The interplay between rainfall and topographic aspect. For. Ecol. Manag. 2013, 310, 256–266. [Google Scholar] [CrossRef]
- Allen, C.D.; Breshears, D.D.; McDowell, N.G. On underestimation of global vulnerability to tree mortality and forest die-off from hotter drought in the Anthropocene. Ecosphere 2015, 6, 1–55. [Google Scholar] [CrossRef]
- Sidor, C.G.; Camarero, J.J.; Popa, I.; Badea, O.; Apostol, E.N.; Vlad, R. Forest vulnerability to extreme climatic events in Romanian Scots pine forests. Sci. Total Environ. 2019, 678, 721–727. [Google Scholar] [CrossRef]
- Schelhaas, M.J.; Nabuurs, G.J.; Schuck, A. Natural disturbances in the European forests in the 19th and 20th centuries. Glob. Chang. Biol. 2003, 9, 1620–1633. [Google Scholar] [CrossRef]
- Seidl, R.; Schelhaas, M.J.; Lexer, M.J. Unraveling the drivers of intensifying forest disturbance regimes in Europe. Glob. Chang. Biol. 2011, 17, 2842–2852. [Google Scholar] [CrossRef]
- Gregow, H.; Laaksonen, A.; Alper, M.E. Increasing large scale windstorm damage in Western, Central and Northern European forests, 1951–2010. Sci. Rep. 2017, 7, 46397. [Google Scholar] [CrossRef] [Green Version]
- Zubizarreta-Gerendiain, A.; Pellikka, P.; Garcia-Gonzalo, J.; Ikonen, V.P.; Peltola, H. Factors affecting wind and snow damage of individual trees in a small management unit in Finland: Assessment based on inventoried damage and mechanistic modelling. Silva Fenn. 2012, 46, 181–196. [Google Scholar] [CrossRef] [Green Version]
- Mitchell, S.J. Wind as a natural disturbance agent in forests: A synthesis. Forestry 2013, 86, 147–157. [Google Scholar] [CrossRef] [Green Version]
- Peltola, H.; Kellomäki, S.; Väisänen, H.; Ikonen, V.P. A mechanistic model for assessing the risk of wind and snow damage to single trees and stands of Scots pine, Norway spruce, and birch. Can. J. For. Res. 1999, 29, 647–661. [Google Scholar] [CrossRef]
- Nykänen, M.L.; Peltola, H.; Quine, C.; Kellomäki, S.; Broadgate, M. Factors affecting snow damage of trees with particular reference to European conditions. Silva Fenn. 1997, 31, 193–213. [Google Scholar] [CrossRef] [Green Version]
- Valinger, E.; Fridman, J. Factors affecting the probability of windthrow at stand level as a result of Gudrun winter storm in southern Sweden. For. Ecol. Manag. 2011, 262, 398–403. [Google Scholar] [CrossRef]
- Lohmander, P.; Helles, F. Windthrow probability as a function of stand characteristics and shelter. Scand. J. For. Res. 1987, 2, 227–238. [Google Scholar] [CrossRef]
- Suvanto, S.; Nöjd, P.; Henttonen, H.M.; Beuker, E.; Mäkinen, H. Geographical patterns in the radial growth response of Norway spruce provenances to climatic variation. Agric. For. Meteorol. 2016, 222, 10–20. [Google Scholar] [CrossRef] [Green Version]
- Schindler, S.; Livoreil, B.; Pinto, I.S.; Araujo, R.M.; Zulka, K.P.; Pullin, A.S.; Santamaria, L.; Kropik, M.; Fernández-Méndez, P.; Wrbka, T. The network biodiversity knowledge in practice: Insights from three trial assessments. Biodivers. Conserv. 2016, 25, 1301–1318. [Google Scholar] [CrossRef] [Green Version]
- Nicoll, B.C.; Gardiner, B.A.; Rayner, B.; Peace, A.J. Anchorage of coniferous trees in relation to species, soil type, and rooting depth. Can. J. For. Res. 2006, 36, 1871–1883. [Google Scholar] [CrossRef]
- Brázdil, R.; Stucki, P.; Szabó, P.; Řezníčková, L.; Dolák, L.; Dobrovolný, P.; Tolasz, R.; Kotyza, O.; Chromá, K.; Suchánková, S. Windstorms and forest disturbances in the Czech Lands: 1801–2015. Agric. For. Meteorol. 2018, 250, 47–63. [Google Scholar] [CrossRef]
- Squintu, A.A.; van der Schrier, G.; Štěpánek, P.; Zahradníček, P.; Tank, A.K. Comparison of homogenization methods for daily temperature series against an observation-based benchmark dataset. Theor. Appl. Climatol. 2020, 140, 285–301. [Google Scholar] [CrossRef] [Green Version]
- Štěpánek, P.; Zahradníček, P.; Huth, R. Interpolation techniques used for data quality control and calculation of technical series: An example of Central European daily time series. Idöjárás 2011, 115, 87–98. [Google Scholar]
- Štěpánek, P.; Zahradníček, P.; Farda, A. Experiences with data quality control and homogenization of daily records of various meteorological elements in the Czech Republic in the period 1961–2010. Idöjárás 2013, 117, 123–141. [Google Scholar]
- Kohut, M. Water Balance of the Agricultural Landscape. Ph.D. Thesis, Mendel University in Brno, Brno, Czech Republic, 2007. [Google Scholar]
- Kohut, M.; Roznovsky, J.; Chuchma, F. The long-term soil moisture reserve variability in the Czech Republic based on the AVISO model. In Proceedings of the Sustainable Development and Bioclimate: Reviewed Conference, Bratislava, Slovak, 5–8 October 2009; Slovak Academy of Sciences: Bratislava, Slovak, 2009; pp. 160–161. [Google Scholar]
- Kohut, M.; Vitoslavsky, J. Agrometeorological computer and information system—The possibility of its use. In Agro-Meteorological Forecasts and Models, Velke Bilovice, Czech Republic; Czech Bioclimatological Society: Praha, Czech Republic, 1999; pp. 53–61. [Google Scholar]
- Tolasz, R. Atlas Podnebí Česka: Climate Atlas of Czechia; Český Hydrometeorologický Ústav, Univerzita Palackého v Olomouci: Olomouc, Czech Republic, 2007. [Google Scholar]
- MAE (Ministry of Agriculture of the Czech Republic) Forestry: Species Composition of Forest. Available online: http://eagri.cz/public/web/en/mze/forestry/species-composition-of-forests/ (accessed on 26 August 2020).
- Sturrock, R.N.; Frankel, S.; Brown, A.V.; Hennon, P.; Kliejunas, J.T.; Lewis, K.J.; Worrall, J.J.; Woods, A.J. Climate change and forest diseases. Plant Pathol. 2011, 60, 133–149. [Google Scholar] [CrossRef]
- Hlásny, T.; Turčáni, M. Insect Pests as Climate Change Driven Disturbances in Forest Ecosystems. In Bioclimatology and Natural Hazards; Střelcová, K., Ed.; Springer: Dordrecht, The Netherlands, 2009; pp. 165–177. [Google Scholar] [CrossRef]
- Jönsson, A.M.; Harding, S.; Krokene, P.; Lange, H.; Lindelöw, Å.; Økland, B.; Ravn, H.P.; Schroeder, L.M. Modelling the potential impact of global warming on Ips typographus voltinism and reproductive diapause. Clim. Chang. 2011, 109, 695–718. [Google Scholar] [CrossRef]
- Brang, P.; Spathelf, P.; Larsen, J.B.; Bauhus, J.; Boncčìna, A.; Chauvin, C.; Drössler, L.; García-Güemes, C.; Heiri, C.; Kerr, G.; et al. Suitability of close-to-nature silviculture for adapting temperature European forest to climate change. Forestry 2014, 87, 492–503. [Google Scholar] [CrossRef] [Green Version]
- Korísteková, K.; Vido, J.; Vida, T.; Vyskot, I.; Mikloš, M.; Minďáš, J.; Škvarenina, J. Evaluating the amount of potential greenhouse gas emissions from forest fires in the area of the Slovak Paradise National Park. Biologia 2020, 75, 885–898. [Google Scholar] [CrossRef]
- Střelcová, K.; Kurjak, D.; Leštianska, A.; Kovalčíková, D.; Ditmarová, Ľ.; Škvarenina, J.; Ahmed, Y.A.R. Differences in transpiration of Norway spruce drought stressed trees and trees well supplied with water. Biologia 2013, 68, 1118–1122. [Google Scholar] [CrossRef]
- Fleischer, P.; Koreň, M.; Škvarenina, J.; Kunca, V. Risk Assessment of the Tatra Mountains Forest. In Bioclimatology and Natural Hazards; Springer: Dordrecht, The Netherlands, 2009; pp. 145–154. [Google Scholar] [CrossRef]
- Barančíková, G.; Jerzykiewicz, M.; Gömöryová, E.; Tobiašová, E.; Litavec, T. Changes in forest soil organic matter quality affected by windstorm and wildfire. J. Soils Sediments 2018, 18, 2738–2747. [Google Scholar] [CrossRef]
- Suchockas, V.; Pliura, A.; Labokas, J.; Lygis, V.; Dobrowolska, D.; Jankauskiene, J.; Verbylaite, R. Evaluation of early stage regeneration of forest communities following natural and human-caused disturbances in the transitional zone between temperate and hemiboreal forests. Balt. For. 2018, 24, 131–147. [Google Scholar]
- Knížek, M.; Liška, J. Occurrence of forest damaging agents in 2019 and forecast for 2020. Zprav. Ochr. Lesa 2020, 1–76. (In Czech) [Google Scholar]
- Zpráva o Stavu Lesa a Lesního Hospodářství České Republiky v Roce 2019 [In Czech]. Available online: http://eagri.cz/public/web/file/658587/Zprava_o_stavu_lesa_2019.pdf (accessed on 26 August 2020).
- The Forest Management Institute. Available online: http://geoportal.uhul.cz/mapy/mapyzsl.html (accessed on 22 September 2020).
- Touhami, I.; Chirino, E.; Aouinti, H.; El Khorchani, A.; Elaieb, M.T.; Khaldi, A.; Nasr, Z. Decline and dieback of cork oak (Quercus suber L.) forests in the Mediterranean basin: A case study of Kroumirie, Northwest Tunisia. J. For. Res. 2020, 31, 1461–1477. [Google Scholar] [CrossRef]
- Bennett, A.C.; McDowell, N.G.; Allen, C.D.; Anderson-Teixeira, K.J. Larger trees suffer most during drought in forests worldwide. Nat. Plants 2015, 1, 15139. [Google Scholar] [CrossRef]
- Banfield-Zanin, J.A.; Leather, S.R. Reproduction of an arboreal aphid pest, Elatobium abietinum, is altered under drought stress. J. Appl. Entomol. 2015, 139, 302–313. [Google Scholar] [CrossRef]
Figure 1.
Area of interest.

Figure 2.
Species composition of forests in the Czech Republic; data source: Forest Management Institute.
Figure 2.
Species composition of forests in the Czech Republic; data source: Forest Management Institute.

Figure 3.
Categories of high temperature (HT) risk based on long-term annual number of tropical days (TDs).
Figure 3.
Categories of high temperature (HT) risk based on long-term annual number of tropical days (TDs).

Figure 4.
Categories of drought (D) risk based on long-term annual water balance (WB).

Figure 5.
Categories of wind gust (WG) risk based on long-term annual occurrence of wind speeds above 10 m s−1 (WS10).
Figure 5.
Categories of wind gust (WG) risk based on long-term annual occurrence of wind speeds above 10 m s−1 (WS10).

Figure 6.
Percentage/area of categories of the case study area. HT = high temperature; D = drought risk; WG = wind gust.
Figure 6.
Percentage/area of categories of the case study area. HT = high temperature; D = drought risk; WG = wind gust.


Figure 7.
Spatial expression of combined risk.

Figure 8.
Categories of combined risk.


Table 1.
Individual abiotic threats and their indicators.
| Abiotic Threat | Indicator | ||
|---|---|---|---|
| High temperature | HT | long-term annual number of tropical days | TD |
| Drought | D | long-term annual water balance | WB |
| Wind gust | WG | long-term annual occurrence of wind speed above 10 m s−1 (% of time) | WS10 |
Table 2.
Frequency of the threat.
| Occurrence of the Threat | F |
|---|---|
| Up to half a year | 10 |
| 40 to 90 years | 5 |
| 1000 or more months | 1 |
Table 3.
Consequence on people coefficient.
| Death Cases | Endangered People | CP1; CP1 |
|---|---|---|
| 1–4 | 1–20 | 1 |
| 51–100 | 500–1000 | 5 |
| more than 1000 | more than 1,000,000 | 10 |
Table 4.
Consequence on the environment coefficient according to the level of environmental damage.
| Affected Area | CEn |
|---|---|
| Water stream (up to 2 km) | 1–2 |
| Water reservoirs beyond waterworks (up to 1 ha) | |
| Non-specific natural ecosystem (up to 1 ha) | |
| Protected hydrologic areas | 3–5 |
| Water stream (up to 5 km) | |
| Water reservoirs beyond waterworks (above 1 ha) | |
| Non-specific natural ecosystem (up to 3 ha) | |
| Nature reserves, NATURA 2000 areas (up to 0.5 ha) | 6–8 |
| Non-specific natural ecosystem (up to 100 ha) | |
| Protected hydrologic areas and waterworks | |
| Water stream (up to 10 km) | |
| Nature reserves, NATURA 2000 areas (above 0.5 ha) | 9–10 |
| Non-specific natural ecosystem (above 100 ha) | |
| Protected hydrologic areas and waterworks | |
| Water stream (above 10 km) |
Table 5.
Consequence on the economy coefficient.
| Direct Economic Losses Including the Cost of Emergency and First Response | CEc |
|---|---|
| up to 4,000,000 EUR | 1 |
| 4,000,000,000 to 20,000,000,000 EUR | 5 |
| more than 40,000,000,000 EUR | 10 |
Table 6.
Social consequences coefficient.
| People Affected by Restrictions | Duration of the Restrictions | Level of Restrictions | CS1; CS2; CS3 |
|---|---|---|---|
| up to 1000 | several h (12) | without significant restriction | 1 |
| 50,000 to 125,000 | several weeks | public services and basic commodities failure, blackout | 5 |
| more than 5,000,000 | more than 25 years | complete destabilization of the state | 10 |
Table 7.
Estimation of level of risk for each threat; data source [14].
Table 7.
Estimation of level of risk for each threat; data source [14].
| Threat | F | CP1 | CP2 | CEn | CEc | CS1 | CS2 | CS3 | C | R |
|---|---|---|---|---|---|---|---|---|---|---|
| D | 7 | 2 | 6 | 10 | 5 | 9 | 6 | 4 | 5.9 | 41 |
| HT | 7 | 5 | 7 | 6 | 5 | 7 | 4 | 3 | 5.5 | 39 |
| WG | 8 | 2 | 4 | 8 | 4 | 5 | 4 | 4 | 4.5 | 36 |
Table 8.
Overview of threat categories, their weights, and range of relevant indicators.
| Categories of D, HT, WG | Weight of HT Categories | Range of TD (Number of Days) | Weight of D Categories | Range of WB (mm) | Weight of WG Categories | Range of WS10 (% of Time) |
|---|---|---|---|---|---|---|
| 1 | 1.083 | 0.00 | 1.139 | ≤−150 | 1.000 | ≤3 |
| 2 | 2.167 | <5 | 2.278 | (150, 0⟩ | 2.000 | (3, 6⟩ |
| 3 | 3.250 | ⟨5, 150⟩ | 3.417 | (0, 150⟩ | 3.000 | (6, 9⟩ |
| 4 | 4.333 | (150, 300⟩ | 4.556 | (150, 300⟩ | 4.000 | (9, 12⟩ |
| 5 | 5.417 | >300 | 5.694 | >300 | 5.000 | >12 |
Table 9.
Matrix of degrees of combined risk for D, HT, and WG based on their weight categories.
| Weight of WG | ||||||||
|---|---|---|---|---|---|---|---|---|
| 1.000 | 2.000 | 3.000 | 4.000 | 5.000 | ||||
| Weight of HT | 1.083 | 3.222 | 4.222 | 5.222 | 6.222 | 7.222 | 1.139 | Weight of D |
| 2.167 | 5.445 | 6.445 | 7.445 | 8.445 | 9.445 | 2.278 | ||
| 3.250 | 7.667 | 8.667 | 9.667 | 10.667 | 11.667 | 3.417 | ||
| 4.333 | 9.889 | 10.889 | 11.889 | 12.889 | 13.889 | 4.556 | ||
| 5.417 | 12.111 | 13.111 | 14.111 | 15.111 | 16.111 | 5.694 | ||
Table 10.
Characterization of categories of combined risk in terms of their degree of combined risk (based on Table 9).
Table 10.
Characterization of categories of combined risk in terms of their degree of combined risk (based on Table 9).
| Categories of Combined Risk | Degree of Combined Risk |
|---|---|
| 1–low risk | 4–7 |
| 2–slight risk | 7.1–9 |
| 3–moderate risk | 9.1–11 |
| 4–high risk | 11.1–13 |
| 5–very high risk | 13.1–16 |
Publisher’s Note: MDPI stays neutral with regard to jurisdictional claims in published maps and institutional affiliations. |
© 2020 by the authors. Licensee MDPI, Basel, Switzerland. This article is an open access article distributed under the terms and conditions of the Creative Commons Attribution (CC BY) license (http://creativecommons.org/licenses/by/4.0/).
Share and Cite
MDPI and ACS Style
Středová, H.; Fukalová, P.; Chuchma, F.; Středa, T. A Complex Method for Estimation of Multiple Abiotic Hazards in Forest Ecosystems. Water 2020, 12, 2872. https://doi.org/10.3390/w12102872
AMA Style
Středová H, Fukalová P, Chuchma F, Středa T. A Complex Method for Estimation of Multiple Abiotic Hazards in Forest Ecosystems. Water. 2020; 12(10):2872. https://doi.org/10.3390/w12102872
Chicago/Turabian StyleStředová, Hana, Petra Fukalová, Filip Chuchma, and Tomáš Středa. 2020. "A Complex Method for Estimation of Multiple Abiotic Hazards in Forest Ecosystems" Water 12, no. 10: 2872. https://doi.org/10.3390/w12102872
Note that from the first issue of 2016, this journal uses article numbers instead of page numbers. See further details here.