1. Introduction
Agriculture in Sub-Saharan Africa (SSA) is the main source of livelihood for the majority of people according to Jalloh et al. [
1]. It is highly dependent on rainfall, thus vulnerable to climatic variability [
2,
3]. The major droughts of the 1970s and 1980s, which affected the Sub-Saharan regions of Africa [
4,
5,
6] had serious repercussions on agricultural production, leading to major famines [
7,
8]. In the face of this situation, several countries have undertaken the construction of numerous small dams or surface water reservoirs (SWRs) to secure agricultural production and reduce the effects of climate change on human activities [
9,
10,
11]. These structures ensure water availability for part of the year by storing temporary runoff and rainwater [
12,
13,
14]. They mainly promote the development of supplemental irrigation, off-season irrigation, and livestock [
15,
16]. Unfortunately, these structures are often poorly maintained and faced with overexploitation and the high evaporation of resources, which often contributes to their early drying up [
17]. These problems have negative consequences for the activities that depend on such structures.
Infiltration from SWRs is often not insignificant [
18,
19]. Although it is a loss of surface water resources, it contributes to the recharge of underlying aquifers [
20] that could be exploited in conjunction with surface water for irrigation [
21,
22]. In some countries, such as India and Tunisia, SWRs are commonly used for artificial groundwater recharge [
23,
24,
25]. In SSA, infiltration water under SWRs is often ignored in the calculations of water balance [
26], as this component is difficult to estimate or measure [
27] or even considered as negligible because of the perception that sediments deposited in the reservoirs would make them impervious [
28]. However, many of these SWRs likely have significant seepage losses [
27], and it is important to understand and quantify these losses.
To assess the focused recharge (water infiltration through SWRs), various methods exist in the literature. These include methods based on monitoring groundwater fluctuations [
29], on the use of environmental tracers [
30,
31], hydrological modeling [
21,
32,
33,
34] and water balance [
24,
31,
35,
36]. Of all these methods, the water balance method remains the simplest to quantify focused recharge. However, its conventional application implies that the discharge of the SWRs is exclusively due to evaporation and infiltration, thus neglecting water withdrawals which, in the context of surface water reservoirs for irrigation, account for more than 40% of their discharge [
37,
38].
These characterization studies can be expensive and some countries in the Sub-Saharan region do not have sufficient financial means to carry out detailed investigations. Based on this observation, the objective of the present study is to highlight and quantify groundwater recharge induced by SWRs in semi-arid regions, based on “simple” and inexpensive approaches and also to determine whether the recharged groundwater has potential for supplemental irrigation Thus, a regional approach based on the water balance method proposed by Thornthwaite [
39] was applied to estimate natural recharge with climatic parameters and soil water stock. A more local approach that highlights and quantifies the water interactions between SWRs and the underlying groundwater was undertaken. To this end, the water balance method for the evaluation of focused recharge was adapted to consider the main components of the water balance scale of SWRs for irrigation. Finally, the use of groundwater for irrigation will be studied through the hydrodynamic parameters of the aquifers. This approach has been applied to two watersheds basins with SWRs for irrigation in Burkina Faso, respectively Kierma and Mogtedo.
2. Study Sites
2.1. Geographic and Climatic Context
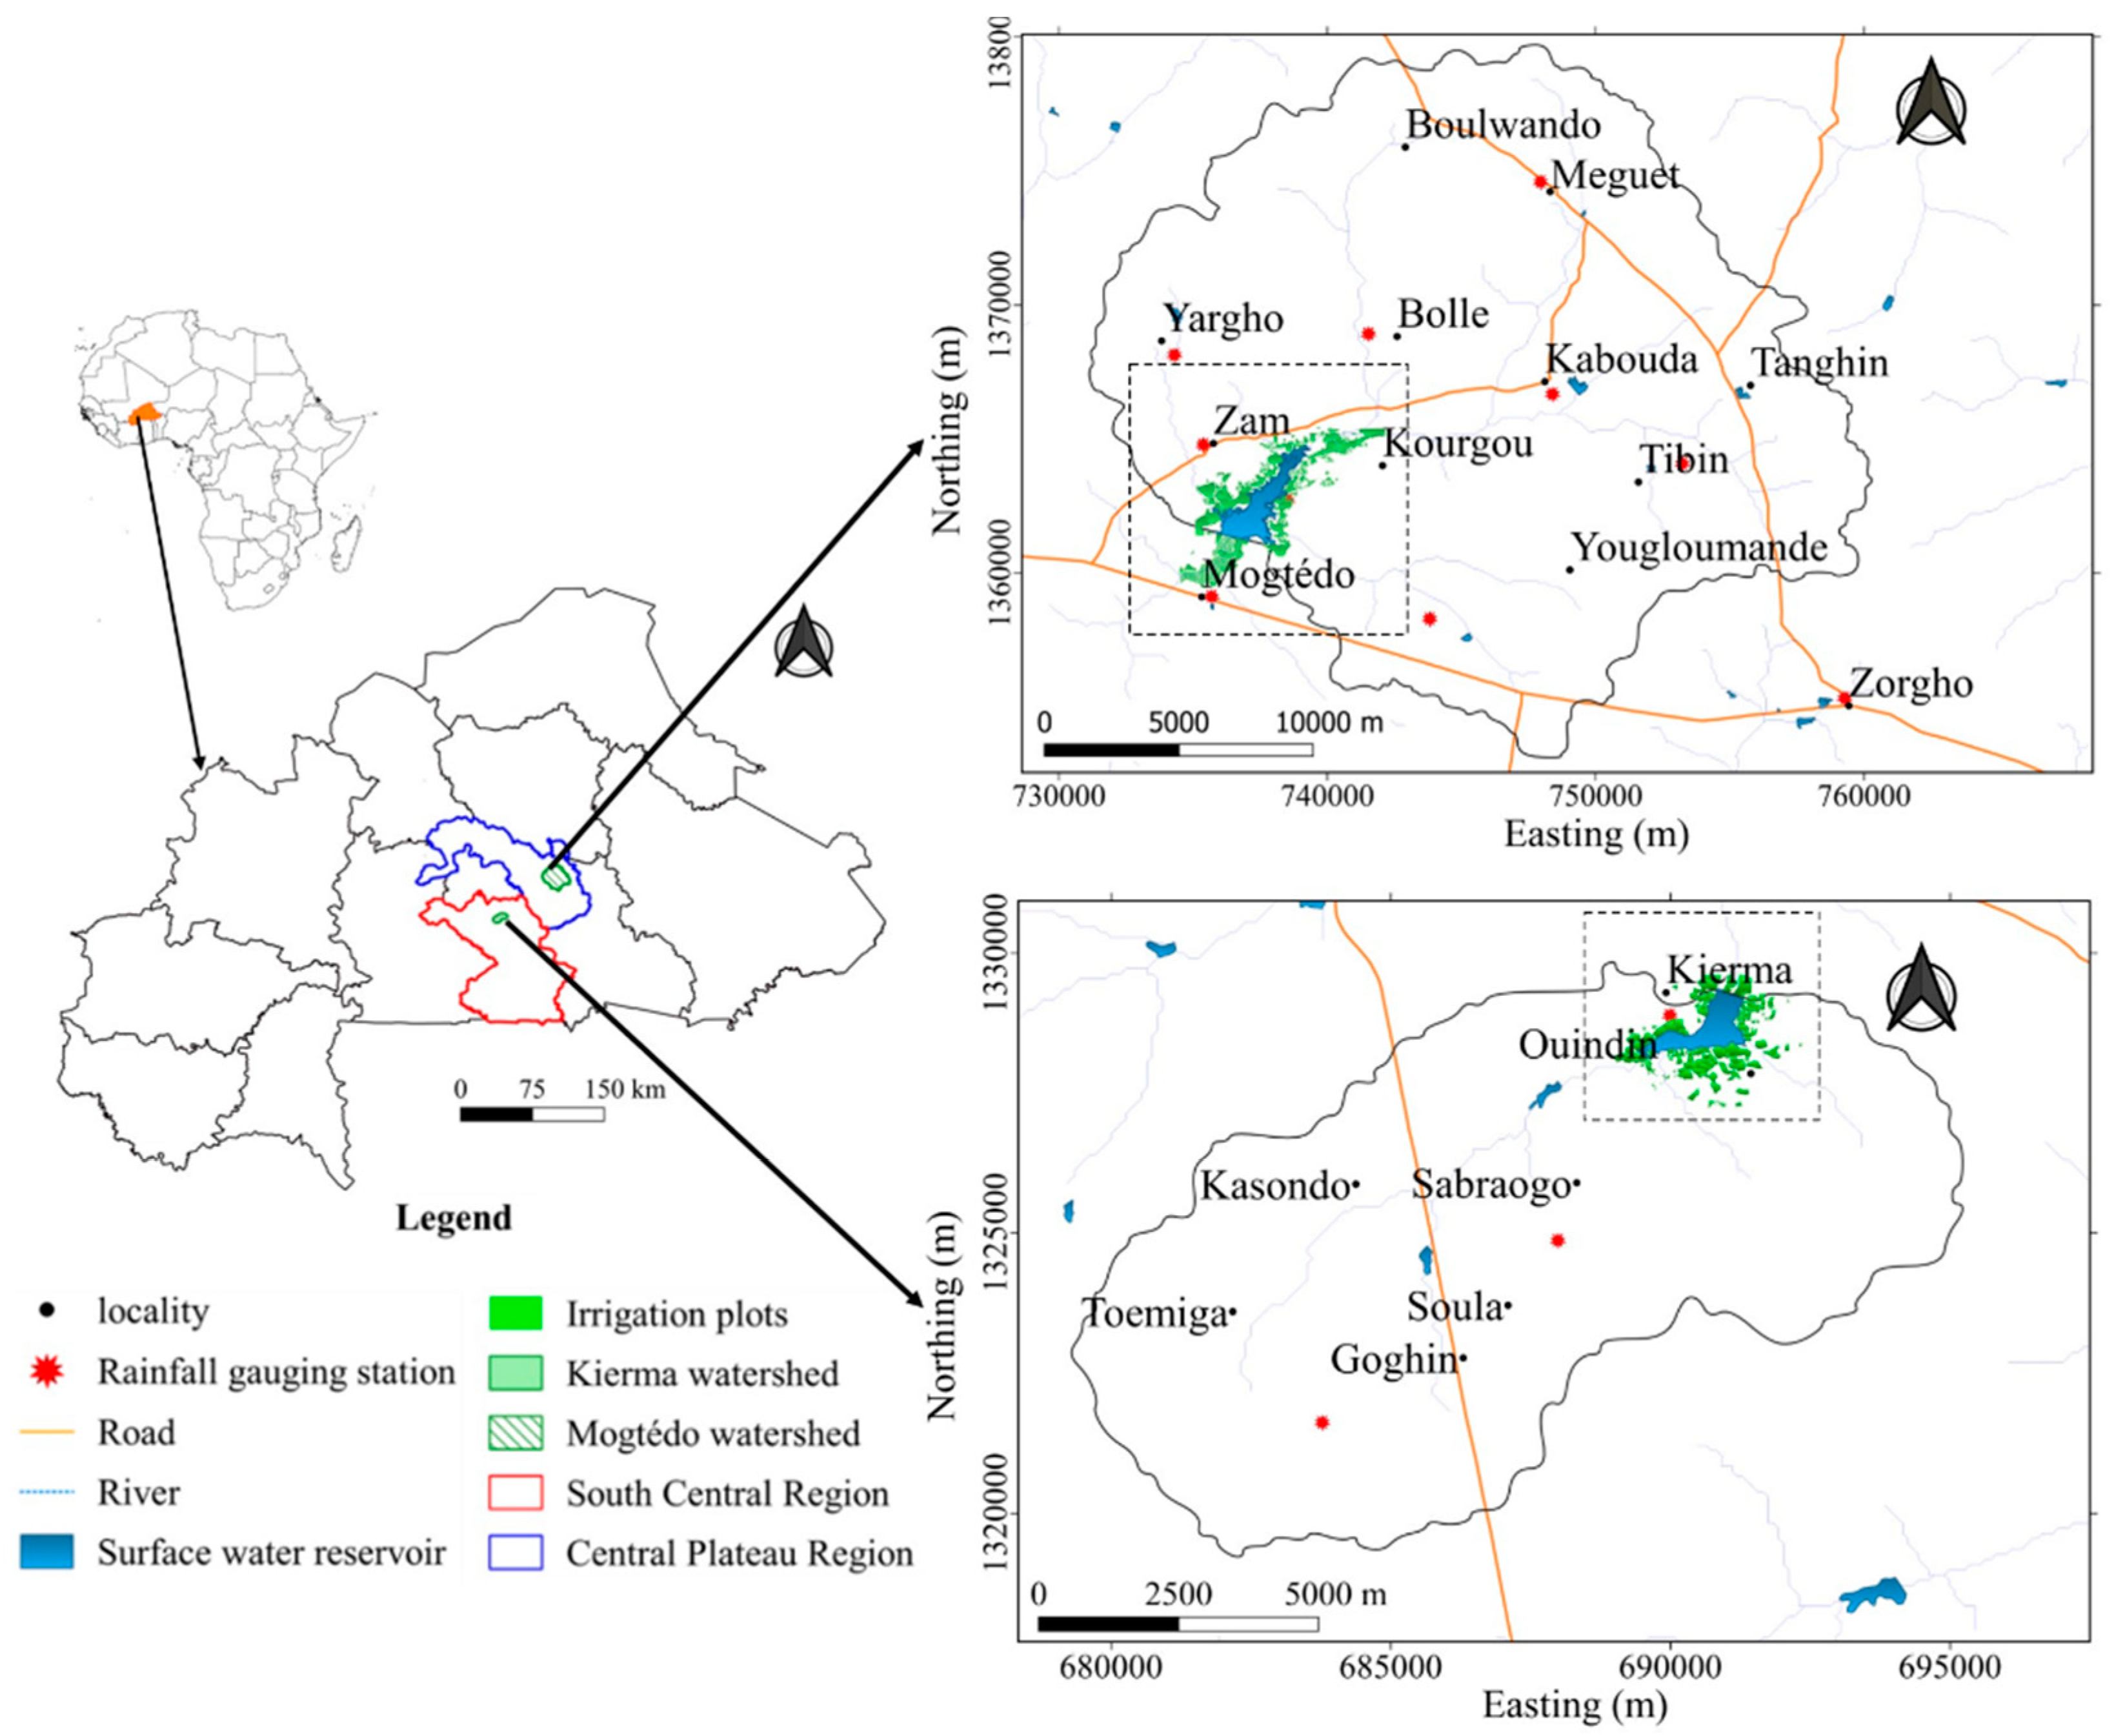
The Kierma and Mogtédo dams were built on tributaries of the Nakambé River (
Figure 1). They are among the 1800 small dams [
40] in Burkina Faso. The Kierma dam is located in the Bazèga Province about 45 km from Ouagadougou in the south-central part of the country. It drains a watershed area of 100 km
2 and had an estimated maximum storage capacity of 916,000 m
3 in 2012 [
37]. The Mogtédo dam is located 85 km from Ouagadougou in the Ganzourgou Province in the central-eastern part of the country. It drains a watershed area of 500 km
2 [
41] and had a maximum storage capacity estimated at 7,190,000 m
3 in 2012 [
38].
The climate in both sites is North Sudanese with a rainy season (June–September) and a dry season (October–May). The average annual rainfall is estimated at 850 mm in Kierma and 750 mm in Mogtédo. Average daily temperatures vary between 25 and 33 °C with potential annual evapotranspiration around 2000 mm in the two basins.
The relief is relatively flat in both watersheds. It is characterized by the presence of a few hills, outcrops of granitic rock, and ferruginous crust. Both basins are crossed by hydrographic networks composed of temporary streams that feed their water reservoirs.
The Kierma and Mogtédo SWRs are the key drivers of the socio-economic development of the local populations. They are mainly exploited during the dry season for rice and vegetable production and also for animal husbandry. According to investigations conducted by Guyon et al. [
42], the irrigated areas are increasing every year on these two sites. In 2015, Guyon et al. [
42] estimated nearly 223 ha of irrigated plots in Mogtédo and 80 ha in Kierma.
2.2. Geological and Hydrogeological Context
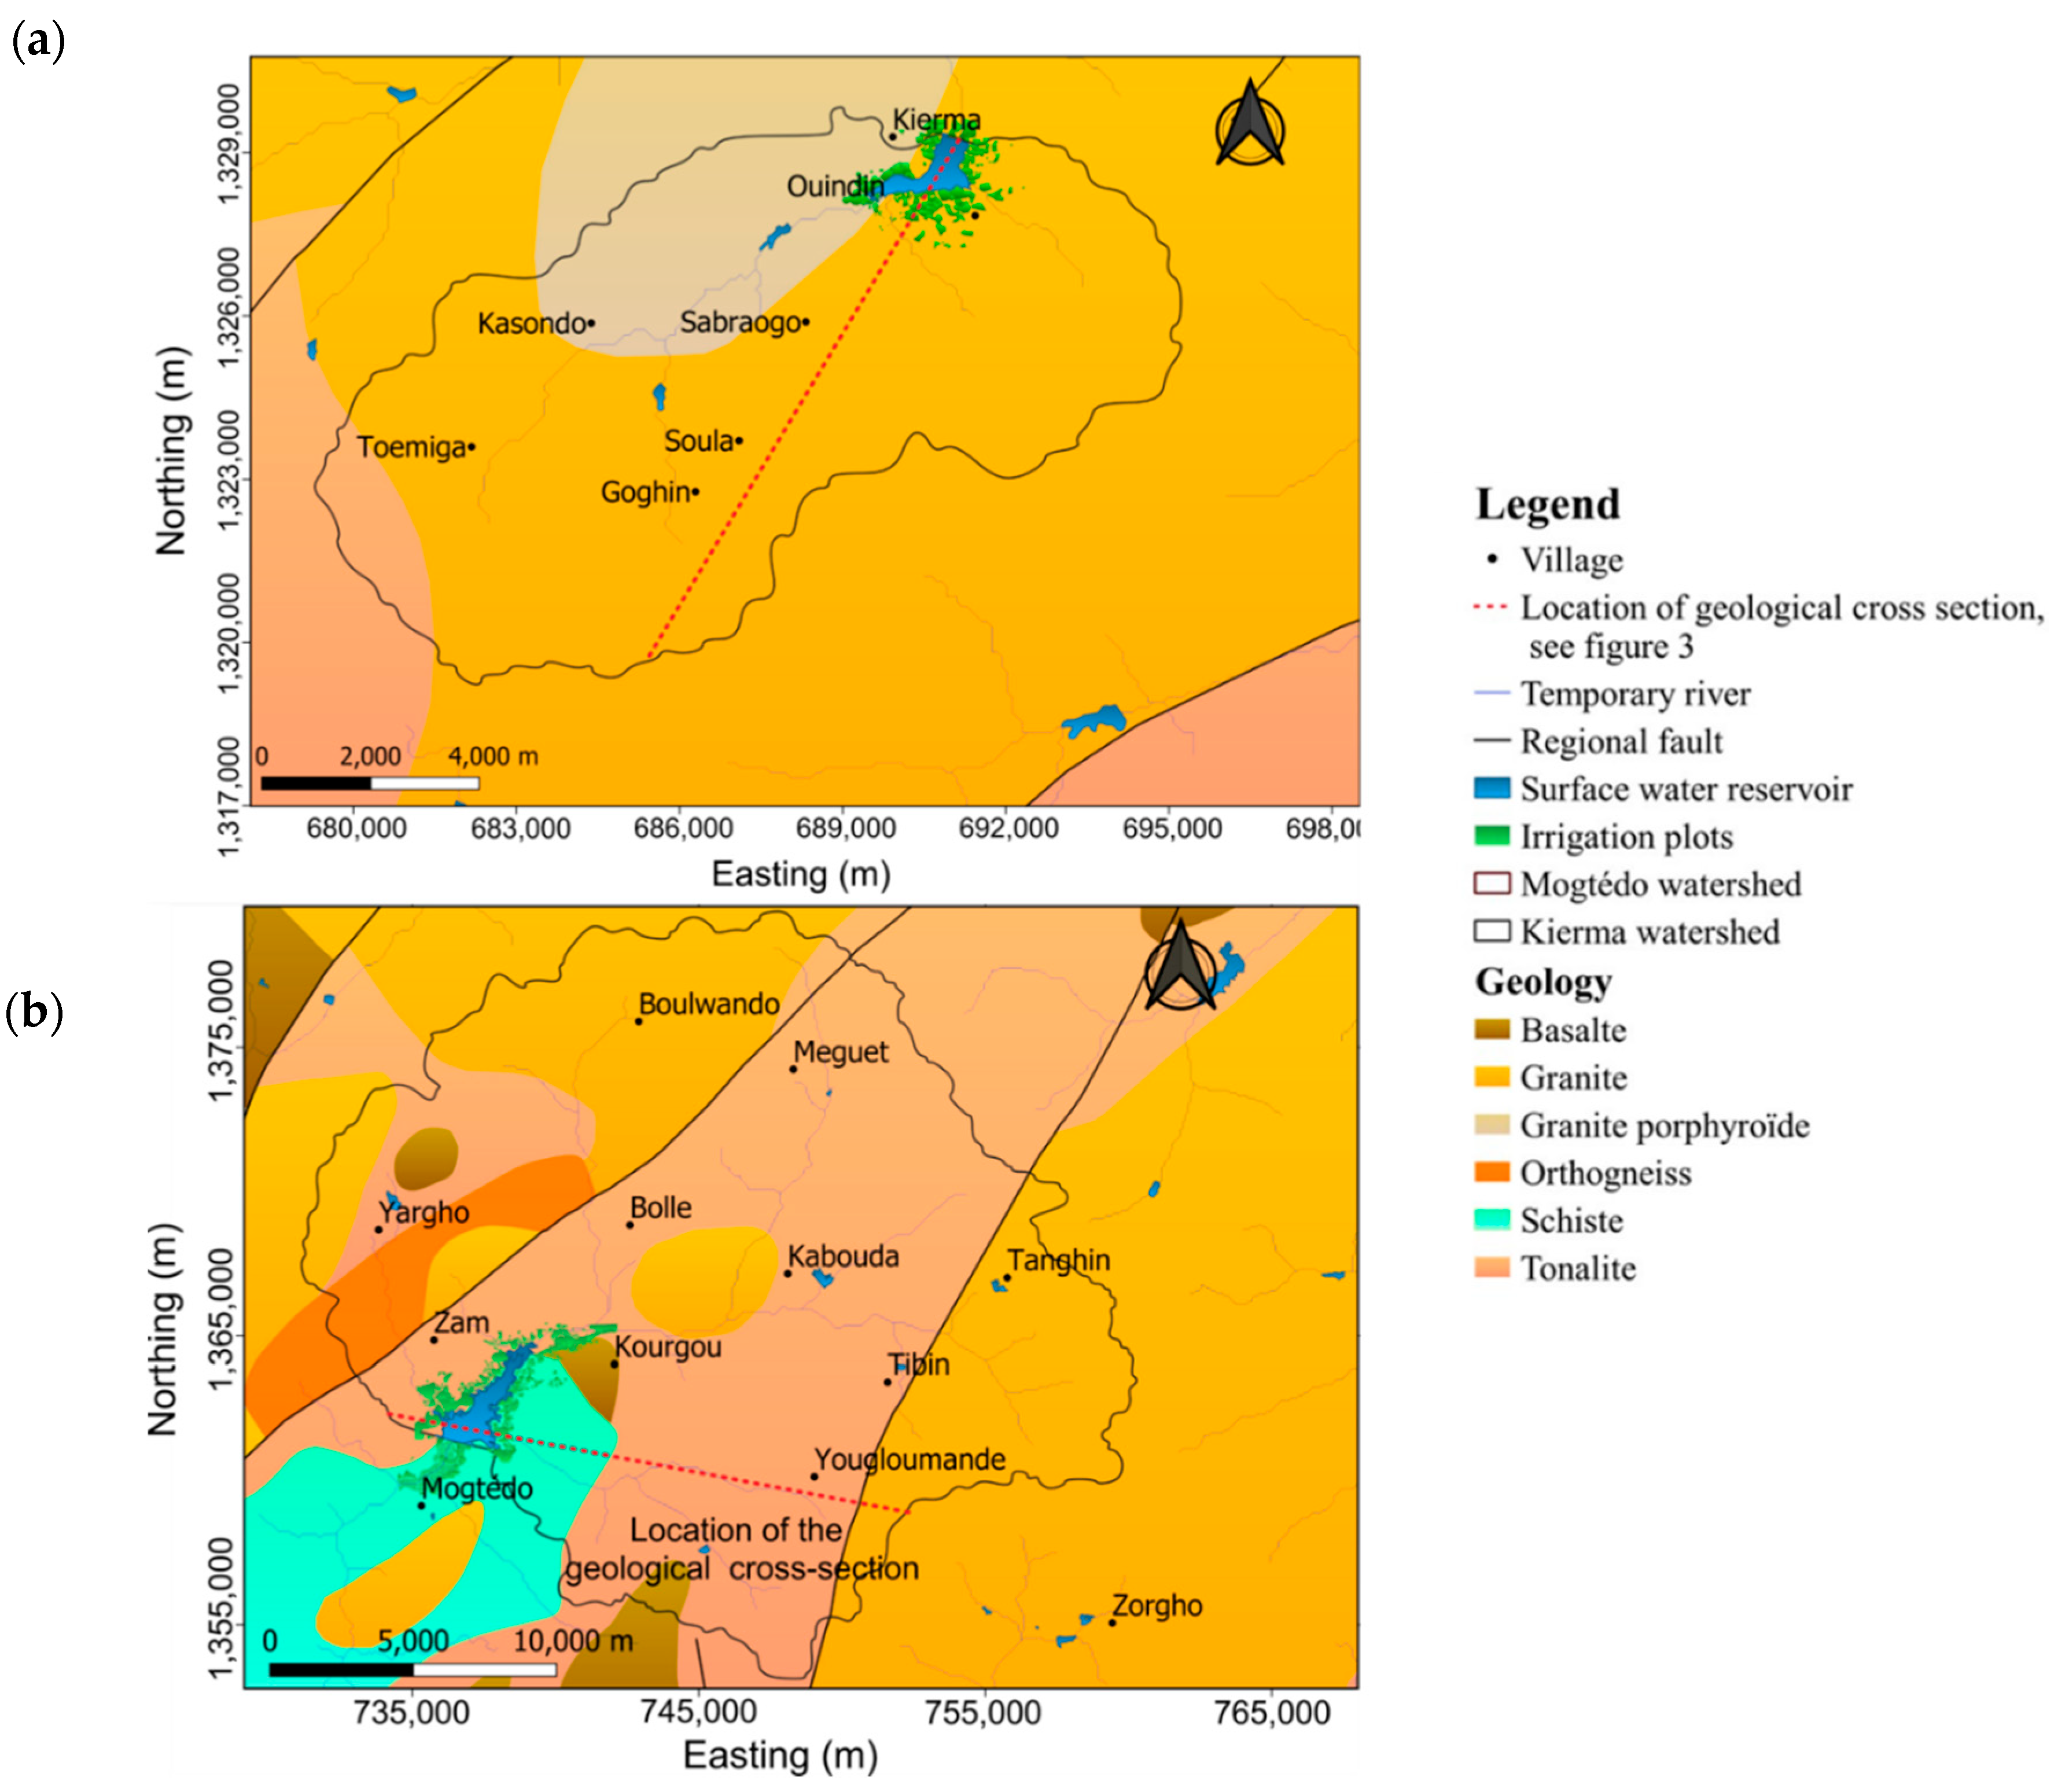
The bedrock at both sites consists of Paleoproterozoic crystalline and crystallophyllitic formations [
43,
44,
45] composed of granitoids of plutonic origin, sometimes in the form of gneiss, metavolcanites, and metasediments [
46] (
Figure 2). The analysis of borehole lithological data shows that the bedrock of the Kierma Basin is composed of almost 80% biotite granite and migmatites. The water impoundment is largely based on these formations, but also more locally on biotite porphyroidal granite and tonalite. The bedrock of the Mogtédo Basin consists of variable geological formations with a clear predominance of granite and granitic gneiss. However, the water reservoir is underlain by formations of the volcano-sedimentary belt consisting of shale and basalt.
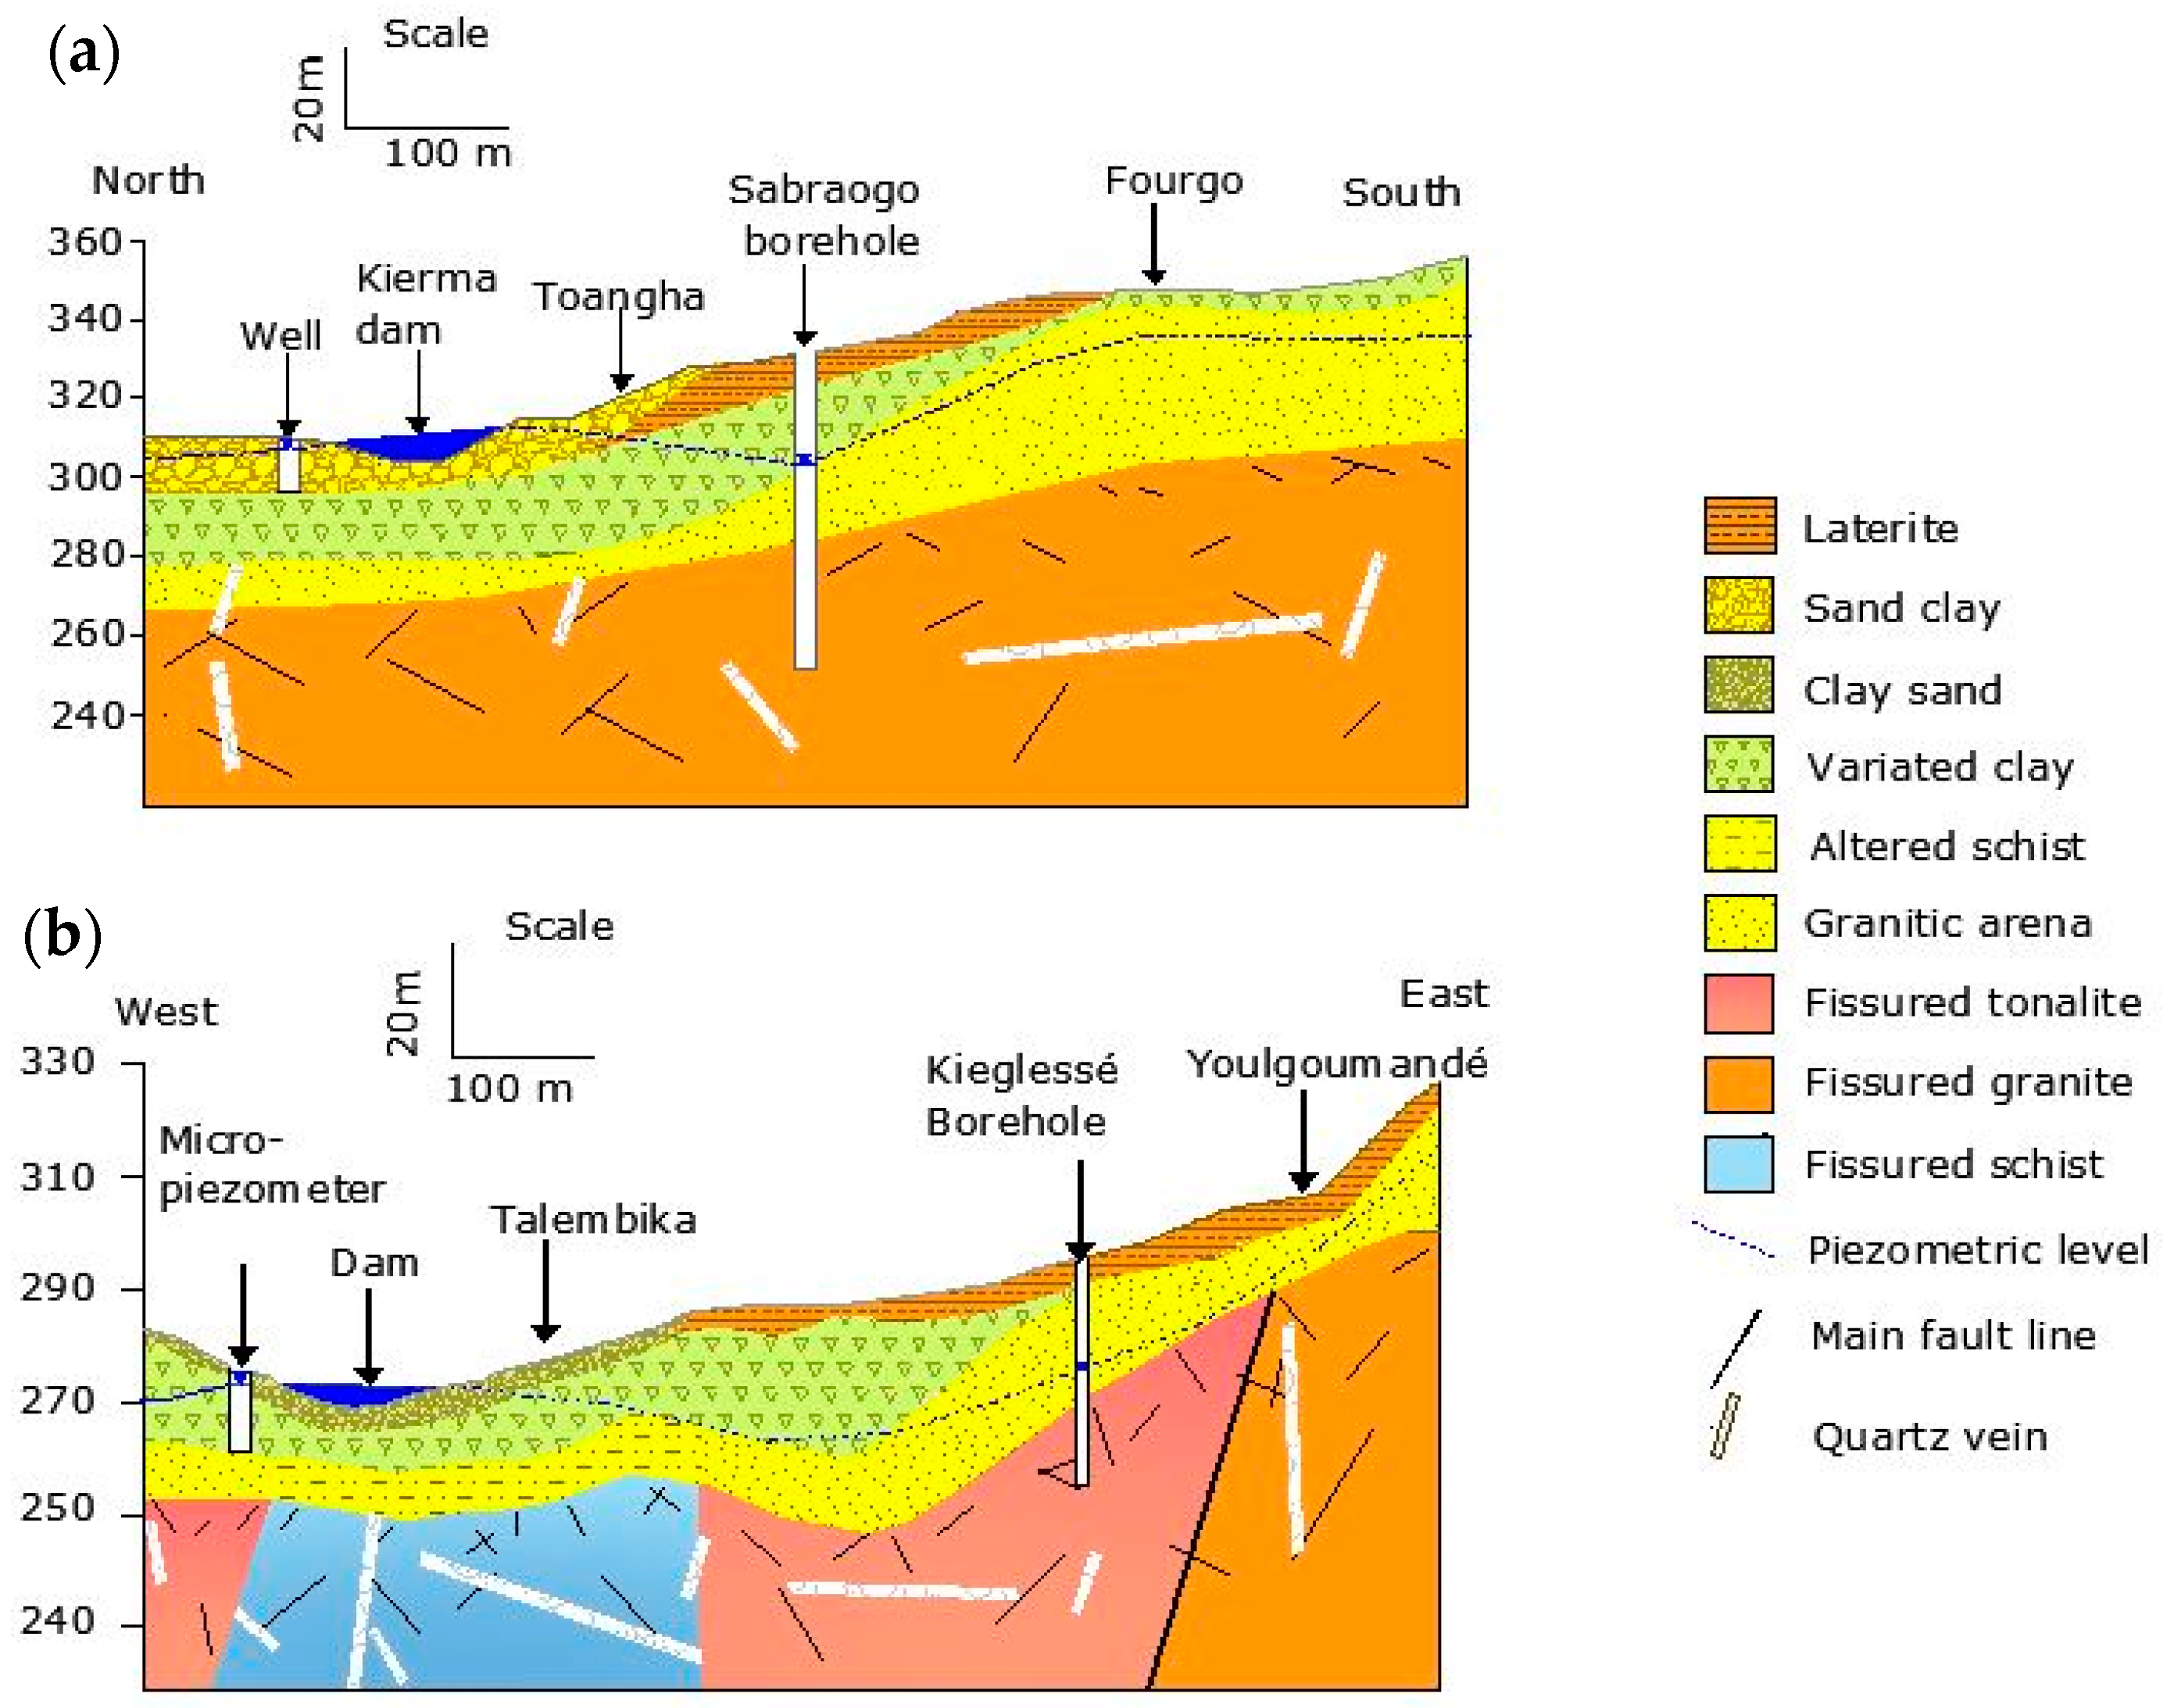
Overall, the geological formations also contain pegmatite and quartz veins and are affected by large NE–SW, NW–SE and N–S oriented fractures [
47]. They are covered by a thick alteration that can reach a depth of 40 m at Kierma (
Figure 3a) and 30 m at Mogtédo (
Figure 3b). This weathered zone is sandy-clayey at the Kierma Reservoir, resulting from the weathering of the quartz granite. They are clayey at Mogtédo, generated from the alteration of schists.
In both basins, shallow groundwater tables are found in shallow altered formations (alteration and alluvial deposits) and deeper bodies in fractures/cracks in bedrock formations [
44,
48,
49]. These two aquifers are hydraulically connected in some areas.
3. Simplified Conceptual Model of the Hydrological Functioning of Kierma and Mogtédo Watersheds
The lack of basic understanding of the hydrological systems of SWRs watersheds constitutes a critical problem for water resources management in Sub-Saharan Africa [
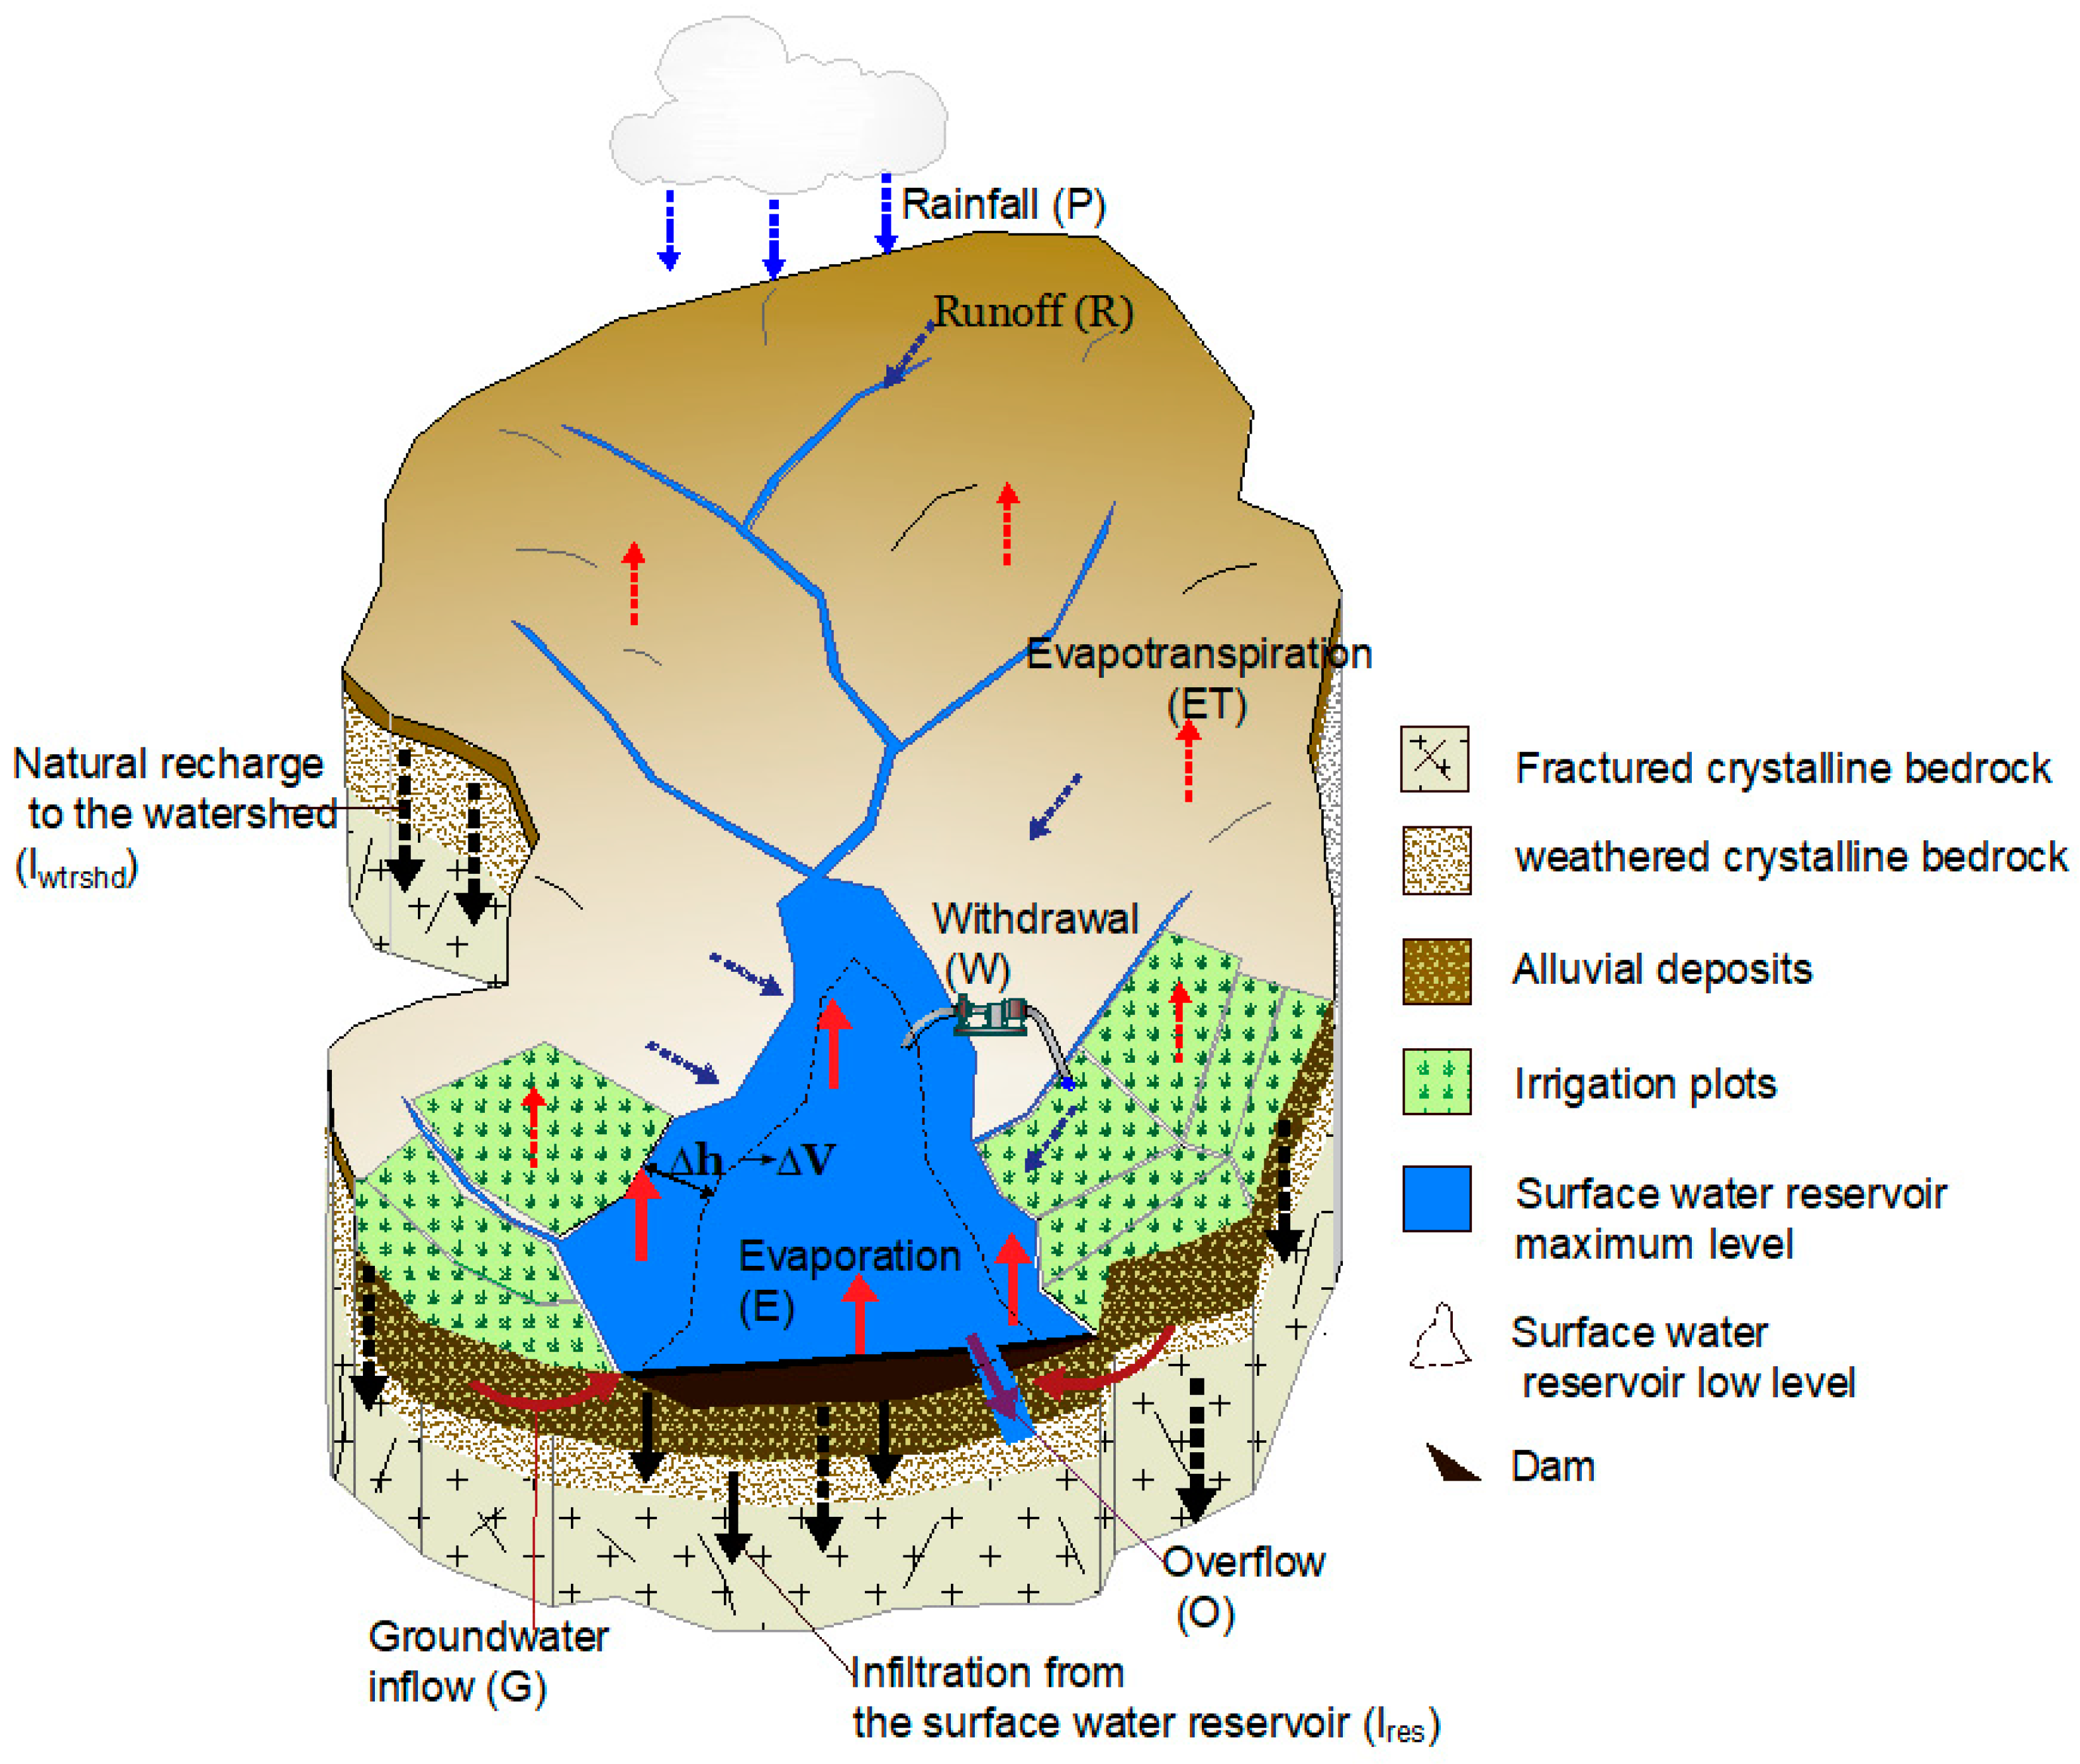
50]. For the present study, a simplified conceptual model (
Figure 4) is developed based on a single scheme where the watershed is assumed to correspond to the hydrogeological catchment area. The watershed includes a SWR for agricultural use such as those of Kierma and Mogtédo. Water inputs to the watershed come mainly from rainwater (P) over 4 months in the year (June to September). Part of this water is taken up by evapotranspiration (ET). The other part (I
Wtrshd) infiltrates directly into the watershed soil under the effect of gravity and the matrix potential gradient [
51]. This part can also run off (R) towards the SWR where water is stored at most up to the height of the spillway and the surplus is discharged (O) into the downstream watercourse. Groundwater may also be discharged to the SWR by exfiltration (G). Water from the SWR is withdrawn (W) by the population for irrigation and livestock farming. The SWR is subjected to potentially high evaporation (E). Part of the water in the reservoir is infiltrated (I
Res) by the effect of the pounding of the SWR bodies which contributes to replenishing water reserves in either soil or subsoil.
Water input into the SWR by the return of irrigation water is negligible because in the majority of cases, the agricultural plots are located downstream of the dams and farmers are required to respect a 100 m buffer of servitude in the case of the exploitation of the banks.
To better consider the various processes that occur in the watershed, a two-scale water balance equation is therefore proposed:
At the global watershed scale:
At the SWR scale:
where
: watershed surface area (L
2);
: SWR surface area (L
2); P: total rainfall (L T
−1); ET: actual evapotranspiration (L T
−1); R: runoff (L T
−1);
: infiltration in the watershed area (L T
−1); E: evaporation from the SWR (L T
−1); G: groundwater exfiltration from the aquifer to the SWR (L T
−1); O: Overflow out of the SWR (L T
−1); I
Res: infiltration from the SWR to the aquifer (L T
−1); W: water withdrawal from the SWR (L T
−1); ∆S: stock changes in the basin (L T
−1); ∆h: water level change in the SWR (L T
−1).
Quantification of groundwater recharge at the watershed scale will take into account natural recharge associated with meteorological precipitation and focused recharge induced by SWRs.
4. Estimation of the Natural Recharge
The natural recharge (I
Wtrshd) was estimated for the two watersheds to have a base for comparison of focused recharge values at the SWR scale and an estimate of aquifer potential at the watershed scale. The estimate is daily using the water balance method proposed by Thornthwaite [
39] and derived from the water balance at the global watershed scale. To make the recharge values comparable with those of the SWRs, the terms of Equation (1) were related to the watershed areas. The balance equation then becomes:
For given day i, the principle of calculating infiltration can be summarized as follows, according to Dassargues [
52]:
with
: daily rainfall (mm);
: soil water storage capacity of the previous day (mm);
: daily actual evapotranspiration (mm);
: maximum soil water storage capacity (mm);
: daily runoff (mm).
Evapotranspiration (ET) was calculated using the Penman-Monteith method as recommended by FAO [
53] and adapted to arid and semi-arid regions [
54]. The rainfall data are averages calculated by the Thiessen polygon method from the different rainfall stations (
Figure 1) present in or near the watershed areas. These data were collected from 2012 to 2019 by the Irrigation Development Support Project (PADI) of the Ministry of Agriculture of Burkina Faso. The other climatic parameters (temperature, wind speed, vapour pressure, etc.) necessary for the calculation of evapotranspiration are those of the Ouagadougou Airport station provided by the National Meteorological Agency of Burkina Faso (ANAM).
The maximum soil water storage capacity (S
max) was calculated based on soil types present in the watershed. It is estimated at 140 mm in Kierma and 150 mm in Mogtédo (
Tables S1 and S2 in Supplementary Materials). The calculation of daily infiltration by the Thornthwaite method starts in April. This is the hottest month, at the end of the dry season when the soil water storage capacity is assumed to be zero. The hydrological year then runs from April of the previous year to March of the year under consideration.
Runoff (R) is assumed to correspond to 10% of the rainfall for the Kierma site and 15% for the Mogtédo site, taking into account the vegetation cover of the two watersheds [
55,
56,
57]. It is also assumed that there are no constraining layers in watersheds that maximum soil water storage capacity does not vary over time.
Table 1 shows the annual averages for each balance term over the entire period 2012 to 2019.
Table 1 shows that evapotranspiration is the most important component of the watershed water balance in Kierma and Mogtédo.
The average annual recharge is estimated at 82 mm, i.e., 9% of the rainfall for the Kierma watershed and 48 mm, i.e., 6% of the rainfall for the Mogtédo watershed.
S
max values vary between 60 mm and 220 mm in Kierma and between 60 mm and 300 mm in Mogtédo. Given the uncertainties linked to this parameter, an analysis of his influence on the natural recharge results was carried out. Natural recharge was calculated for S
max values of 100 and 200 mm for both watersheds. The results of these calculations show that the natural recharge values vary widely with a difference of 100 mm between a S
max of 100 and 200 mm in both watersheds. Thus, for an error of 10 mm on the value of the S
max, an error of about 10 mm on the value of the natural recharge could be made (
Table S3 in Supplementary Materials).
These results are in the same ranges as those found by Döll and Kiedler [
58] for the semi-arid regions of Africa (20–100 mm/year) by modeling on a global scale. The natural recharge estimated at Kierma during the hydrological years: 2012–2013, 2015–2016, and 2018–2019 are also in agreement with those obtained by Cuthbert et al. [
59] in the Ouagadougou area by the piezometric fluctuations method (100–350 mm/year). Natural recharge occurs only during the rainy season and infiltrated water is drained by faults/fractures and soils. The mobilization of this groundwater therefore requires significant resources. Irrigation water reservoirs could contribute to the recharge of groundwater and especially the shallow groundwater tables.
5. Evidencing Surface Water Reservoir—Groundwater Interactions
5.1. Data Acquisition and Field Investigations
The data used in this study were collected in the framework of investigations carried out between 2016 and 2018 on the evaluation of SWR-groundwater interactions. These data were supplemented by those collected between 2012 and 2015 by the PADI. They focused on the establishment of a water balance at the scale of the SWRs of Mogtédo and Kierma.
Between 2012 and 2015 [
37,
38,
42] sites, rain gauges (
Figure 1 and
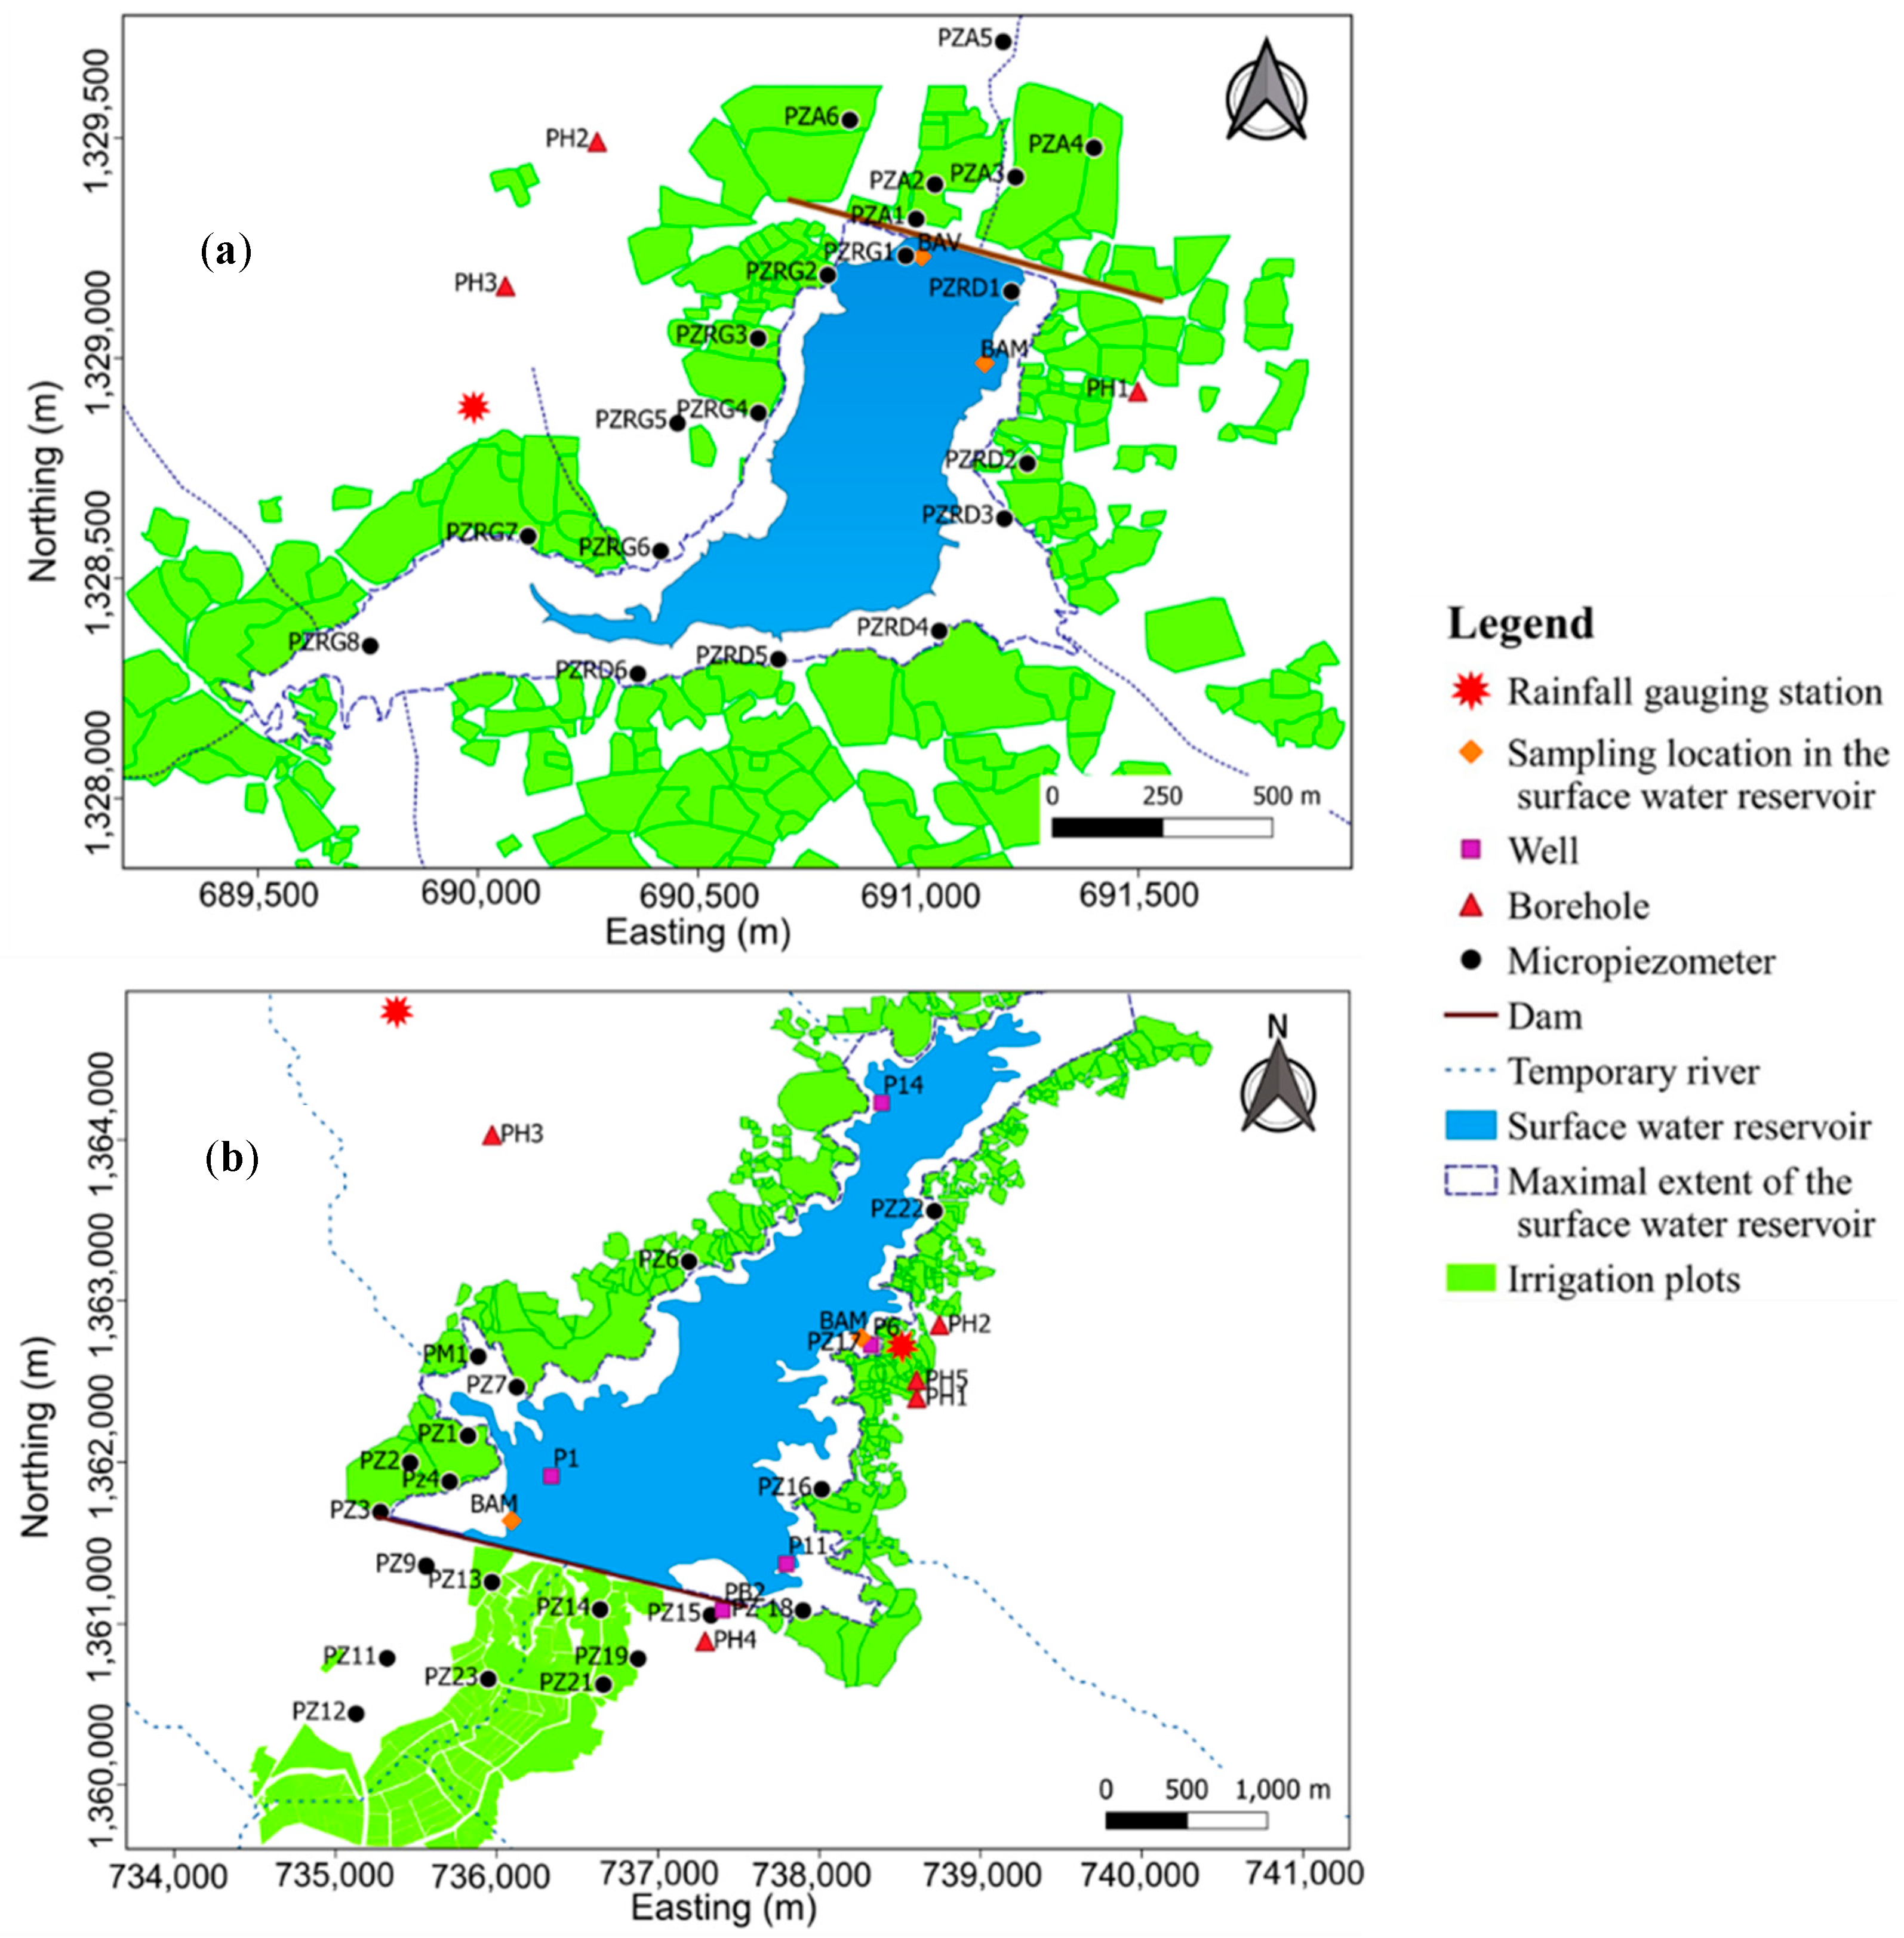
Figure 5) and class A evaporation pans were used to record rainfall and evaporation at Kierma and Mogtédo. Pressure recorders and a water-level gauge made it possible to measure the SWR levels. Topographical and bathymetric work and GPS tracking of the water surfaces made it possible to establish the height-volume and height-surface curves of the two SWRs. Surveys on the volumes withdrawn for irrigation and livestock were also carried out. Between 2016 and 2018 [
60,
61,
62], groundwater and SWRs monitoring networks were installed at both sites (
Figure 5). In Mogtédo, the network installed in March 2016 comprises 29 micropiezometers and a stage gauge. In Kierma, the network installed in March 2017 comprises 20 micropiezometers and a stage gauge. The micropiezometers were made with a hand auger with a diameter of 100 mm and a depth between 2 and 10 m. They are located along the upstream and downstream banks of the dams. The levels of the SWR and piezometry were measured monthly from March 2016 to September 2018 in Mogtédo and from March 2017 to September 2019 in Kierma. The characteristics of the micropiezometers are provided in
Tables S4 and S5 in Supplementary Materials.
Water samples were also collected from groundwater (wells, micropiezometers, and boreholes) and SWRs for physico-chemical analyses. In Mogtédo, 34 water samples were collected during the dry season in March 2016 and 29 water samples during the rainy season in August 2016. In Kierma, 24 water samples were collected during the dry season in March 2017 and 18 water samples during the rainy season in September 2019. The water samples were analyzed at the Hydrogeology Laboratory of the University of Liège in Belgium (Results of this analysis are provided in
Tables S6 and S7 in Supplementary Materials). The titrimetric method (TM) was used for Ca
2+ determination, the capillary ion analysis (CIA) for K
+, Mg
2+, Na
+, Cl
−, NO
3−, and SO
42−. HCO
3− was determined by calculation from pH and complete Alkalimetric Title (CAT) using the Rodier formula [
63].
5.2. Analysis Of Water Level Variations
5.2.1. Spatial and Temporal Variations in Water Levels
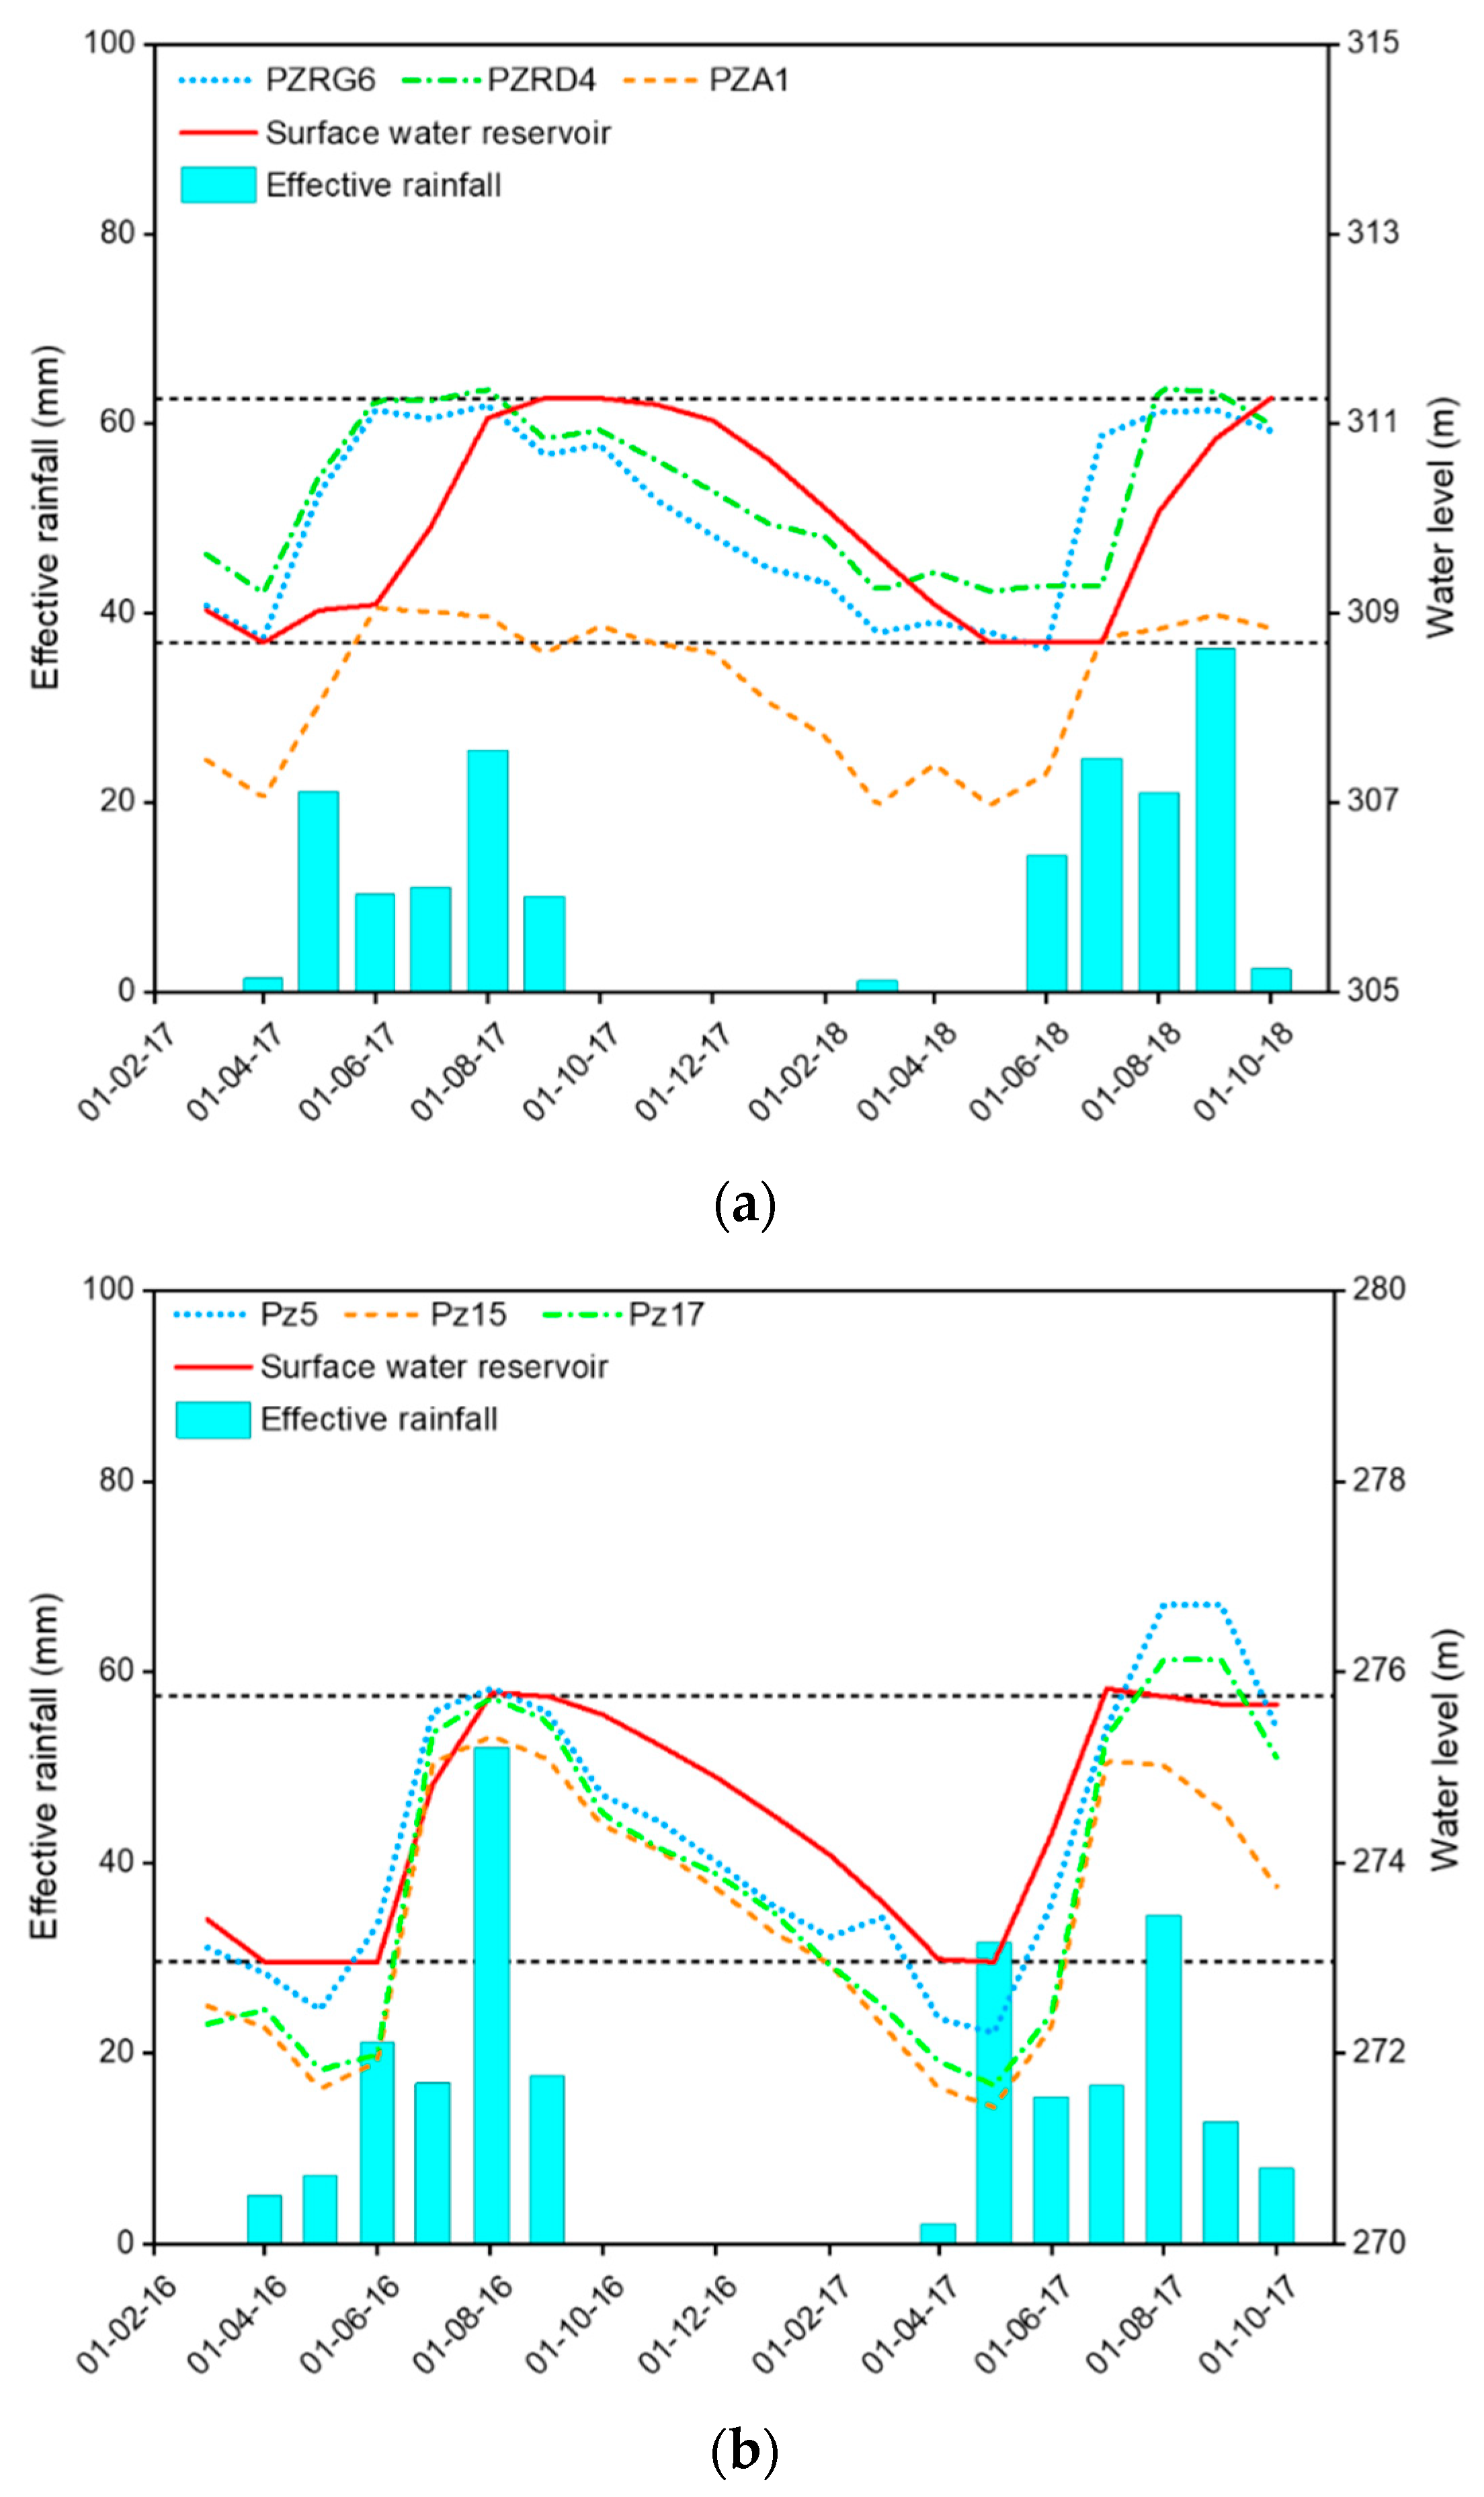
The interactions between SWRs and groundwater were examined based on the analysis of the piezometric and SWR levels (
Figure 6a,b). The piezometric levels presented refer to micropiezometers near the SWRs, for which continuous series of data are available for at least one year.
In Kierma, piezometric levels start to increase directly at the beginning of the rainy season. This indicates the fact that the shallow groundwater table responds quickly to natural recharge. During the same period, the SWR takes a long time to fill up and does not reach its maximum level until August (the wettest month of the year). This indicates that runoff that contributes to filling the SWR begins with some delay, after the soil is completely saturated, coinciding with the period when the shallow groundwater table also reaches its maximum level. During both dry and rainy seasons, the level of the SWR is higher than the shallow groundwater table downgradient of the dam (PzA1). This indicates a possible focused recharge from the SWR to the shallow groundwater table. However, upgradient of the dam, the level of the SWR is higher than the groundwater level (PzRG6 and PzRD4) during the dry season indicating that the SWR contributes to recharging the shallow groundwater during a large part of the dry season when it is sufficiently filled. However, the gradient is reversed during the rainy season, from the shallow groundwater to the SWR meaning that the SWR is possibly being supplied by exfiltrating groundwater during that period.
In Mogtédo, the water level dynamics are different from those observed in Kierma. From the beginning of the rainy season, the piezometric (Pz5, Pz15, and Pz17) and the SWR levels rise synchronously with the effective rainfall. This reflects the fact that the soils of Mogtédo being more clayey, they become saturated more quickly with water, favouring faster runoff towards the SWR. During the dry season, the SWR level remains higher than the shallow groundwater table. As for Kierma, this indicates a focused recharge of groundwater by the SWR. During the rainy season, the situation is temporarily reversed, with the groundwater levels slightly higher than the surface water level in the reservoir.
5.2.2. Analysis of Piezometric Maps
Piezometric maps were drawn with all the piezometric data, on the one hand, in the dry season and, on the other hand, in the rainy season.
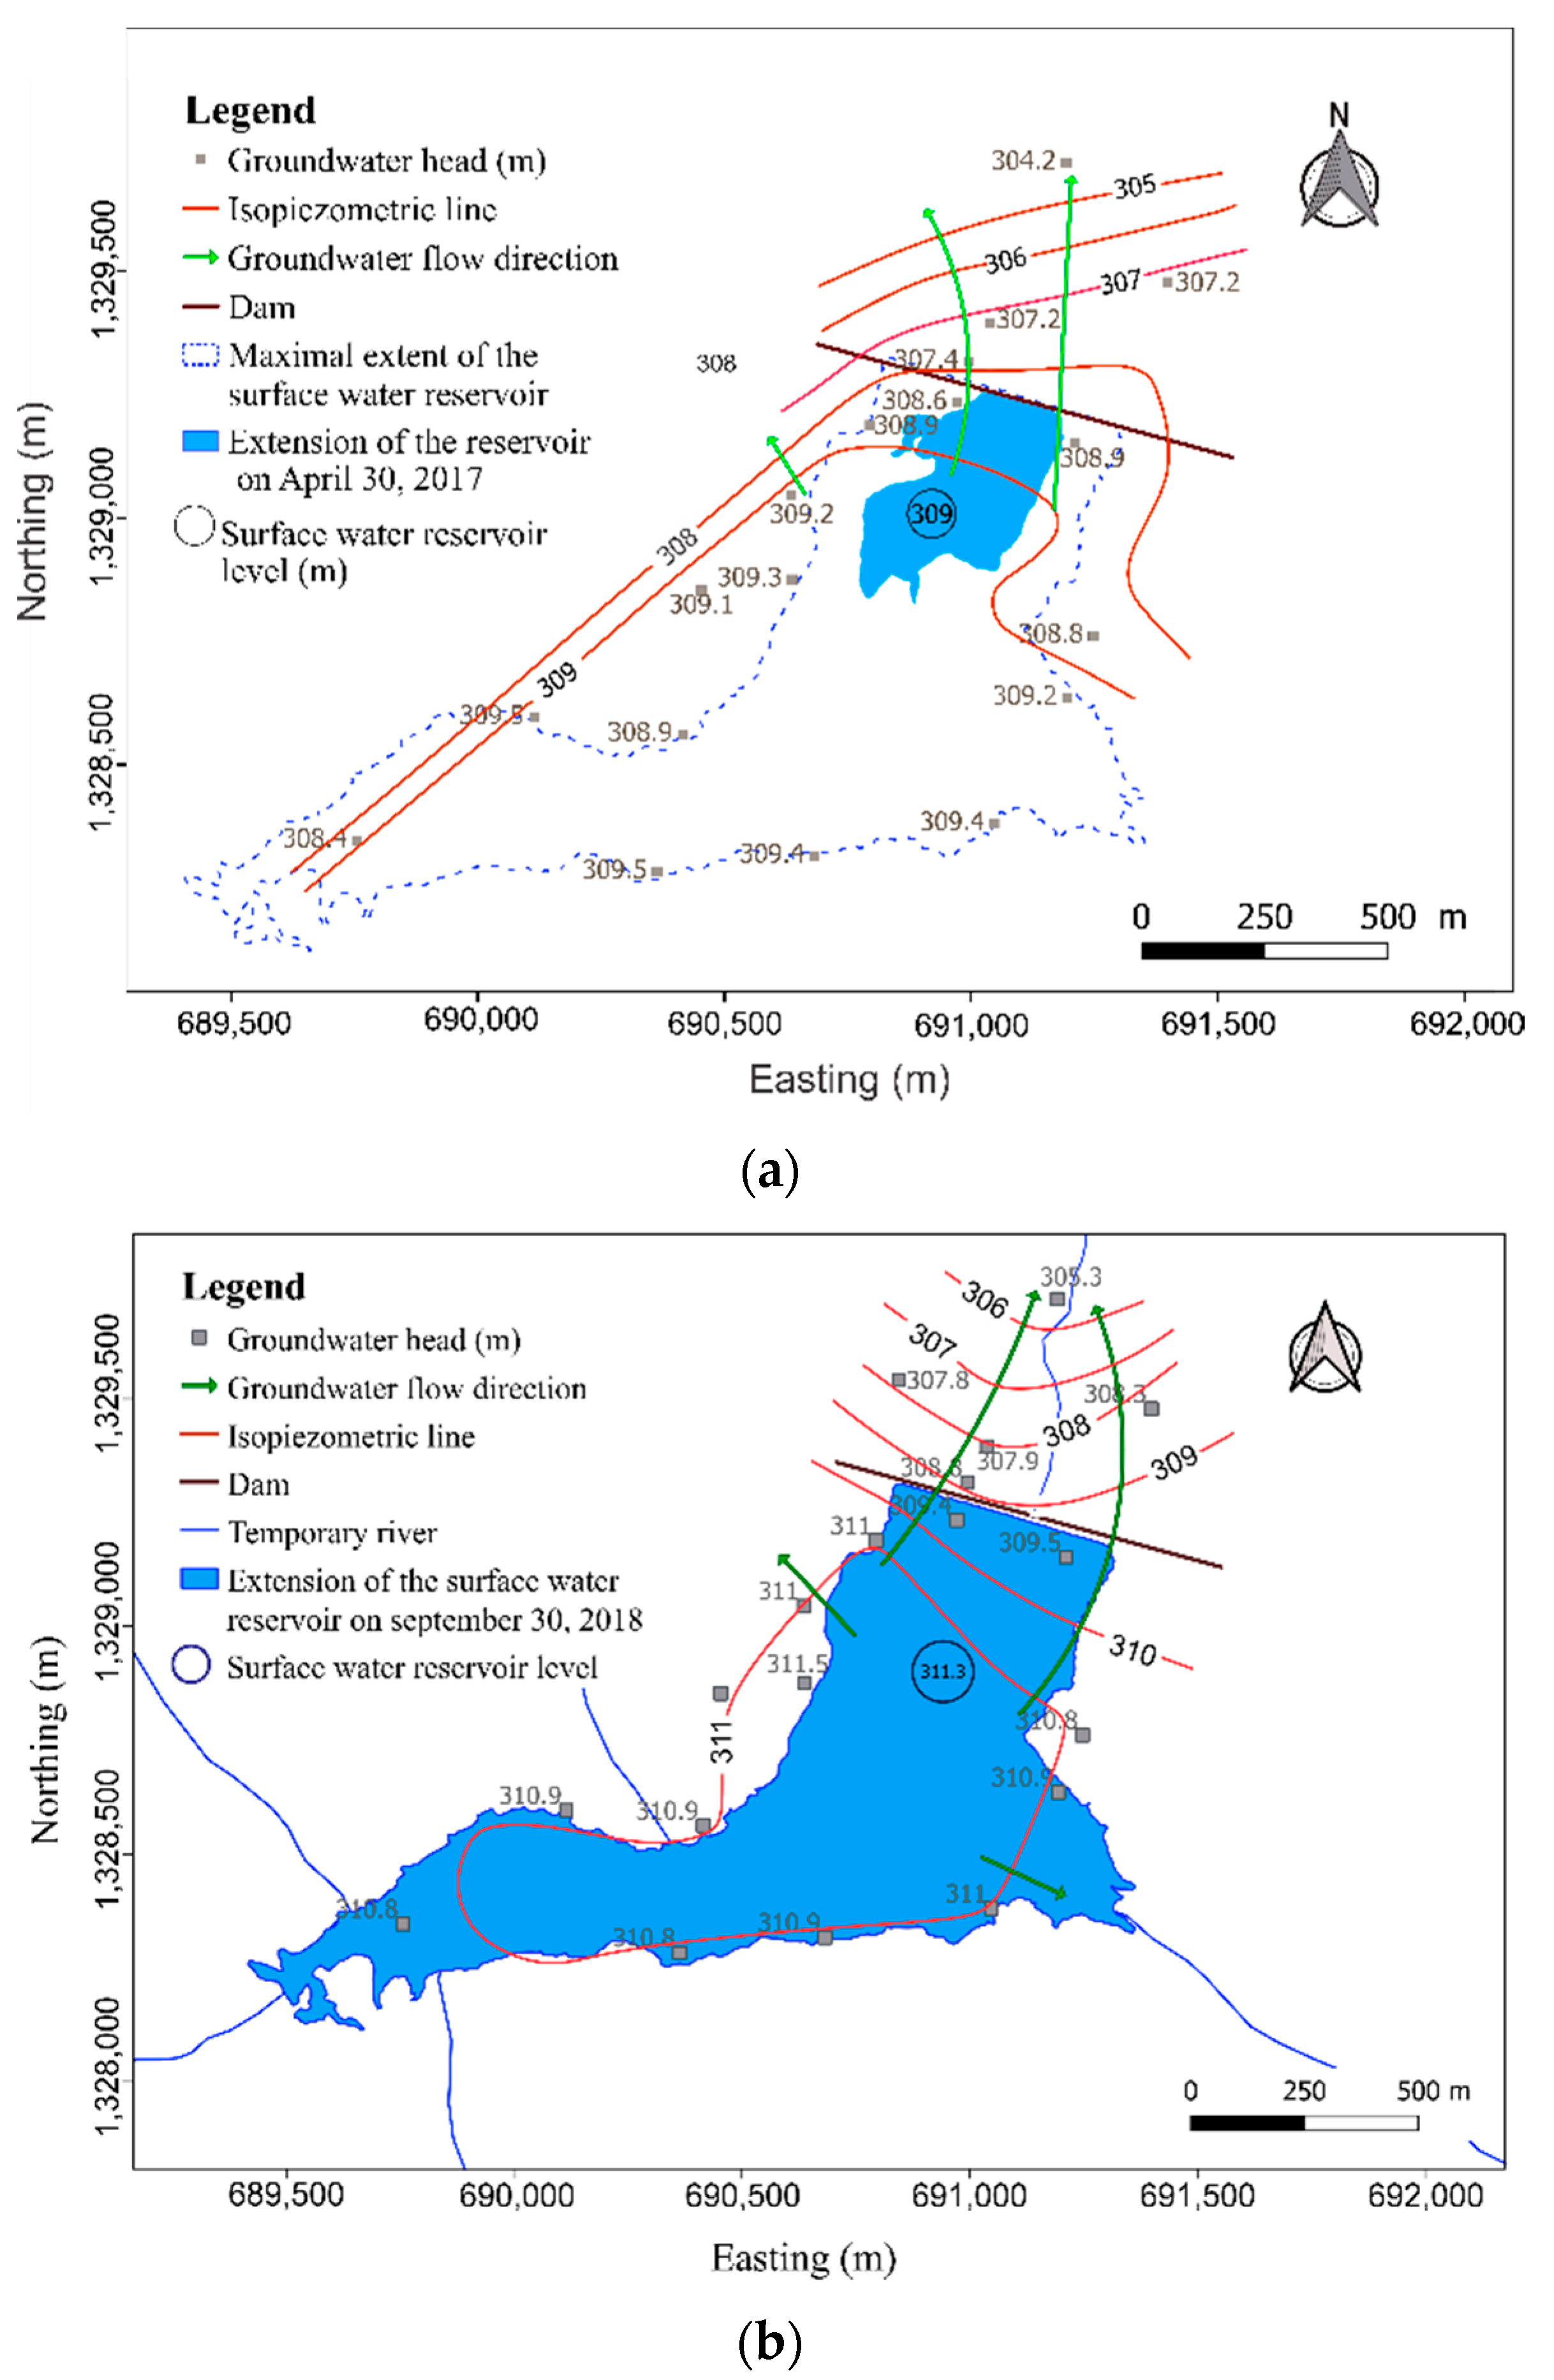
In Kierma, the piezometric map (
Figure 7a,b) indicates that upgradient from the dam, a certain equilibrium is established between the SWR and the shallow groundwater table. Regardless of the season, the streamlines show a diverging flow from the SWR to the shallow groundwater table (
Figure 7a,b). As the level of the SWR is higher than the shallow groundwater table, it indicates again a focused groundwater recharge.
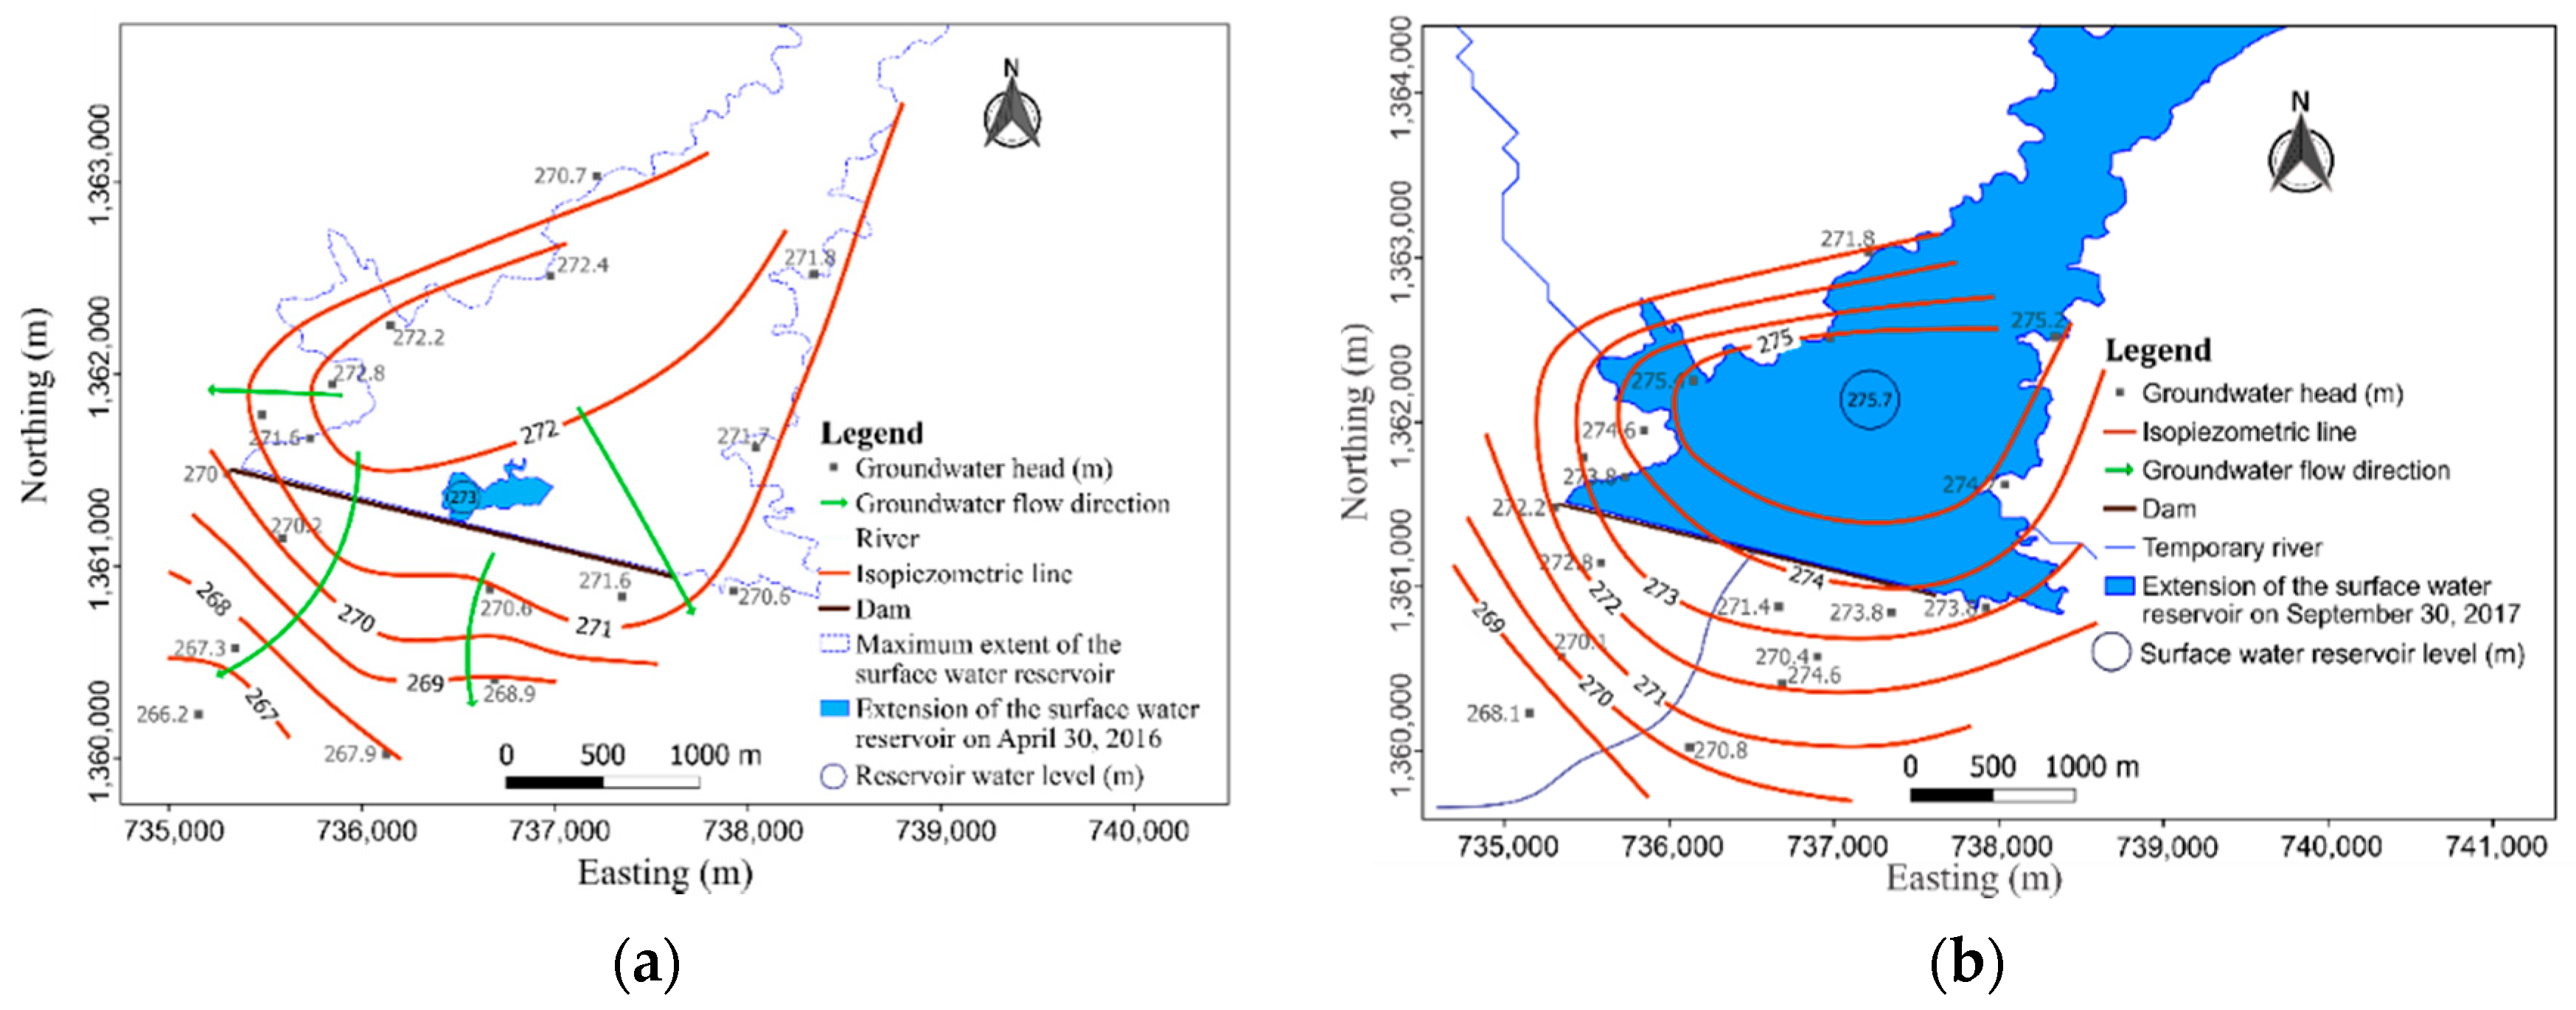
In Mogtédo, during the dry season, the piezometric map (
Figure 8a) shows diverging streamlines in groundwater around the SWR. As the water level of the reservoir is higher than the shallow groundwater table, this indicates a focused groundwater recharge in Mogtédo as well. During the rainy season (
Figure 8b), the upgradient part of the shallow groundwater table is almost in equilibrium with the SWR. The shallow groundwater table is drained mainly towards the downstream part of the dam.
These results are consistent with those found by Haas [
64] at the Sanga site in Burkina Faso, where the author found that the shallow groundwater table is high towards the upstream of the dam and slowly deepens downstream. The SWR therefore clearly recharges the shallow groundwater.
5.3. Contribution of Hydrochemistry
According to Winter et al., Brodie et al. and Oyarzún et al. [
65,
66,
67], the chemical composition of water can also provide valuable information on the interactions between groundwater and surface water, especially those of SWRs. These interactions were investigated in the present study through the graphic representation of the Piper diagram and investigations on cation exchange processes.
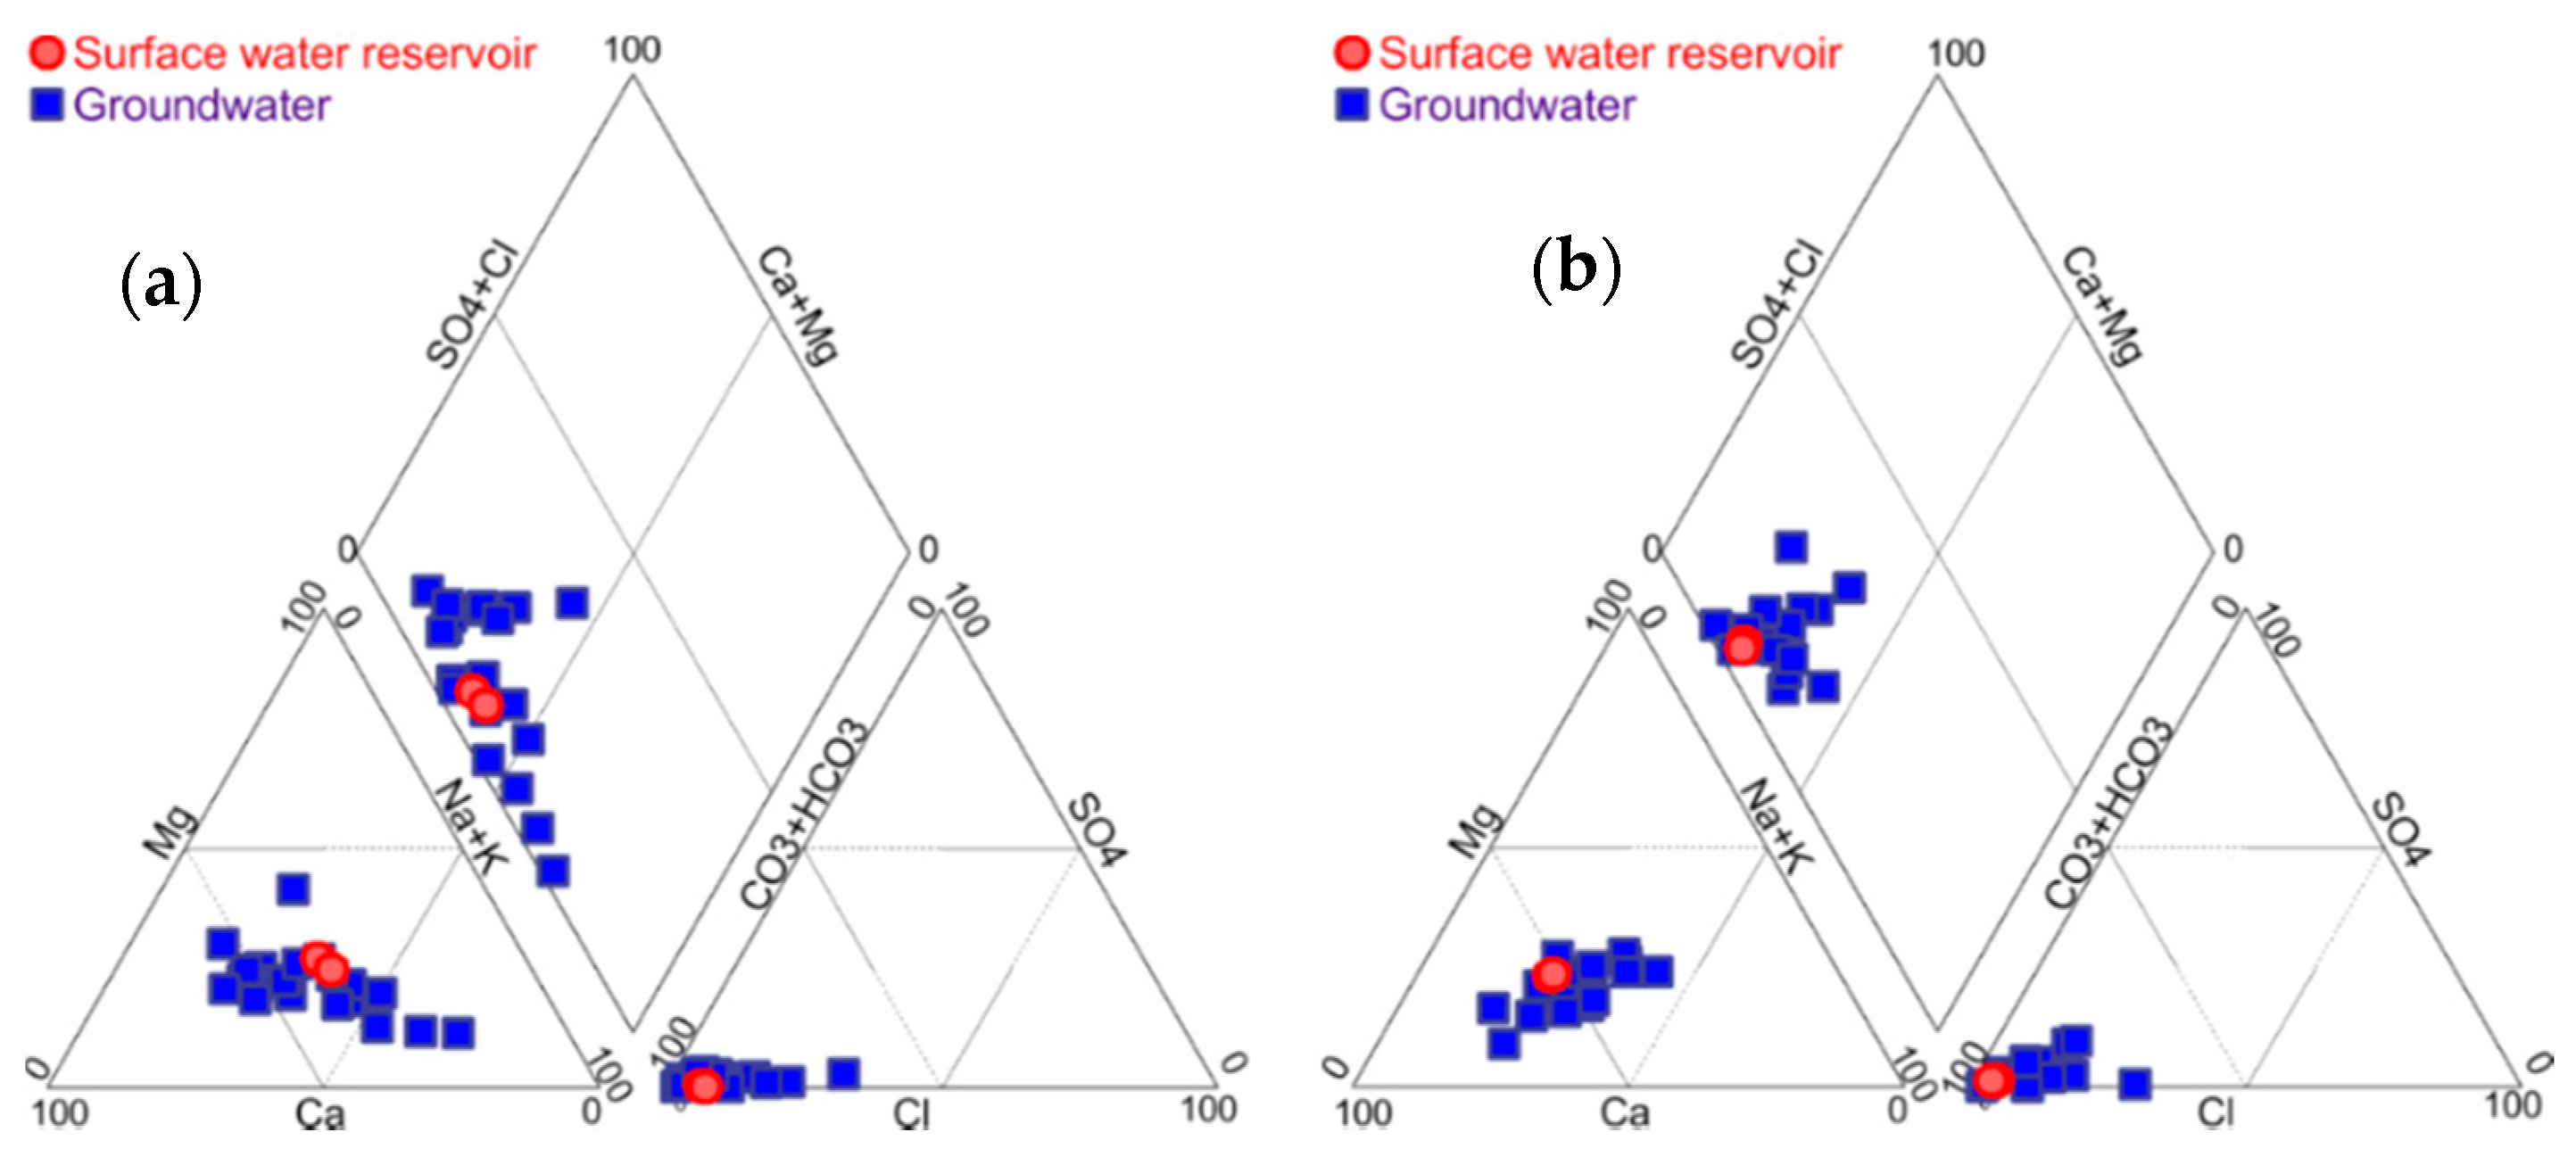
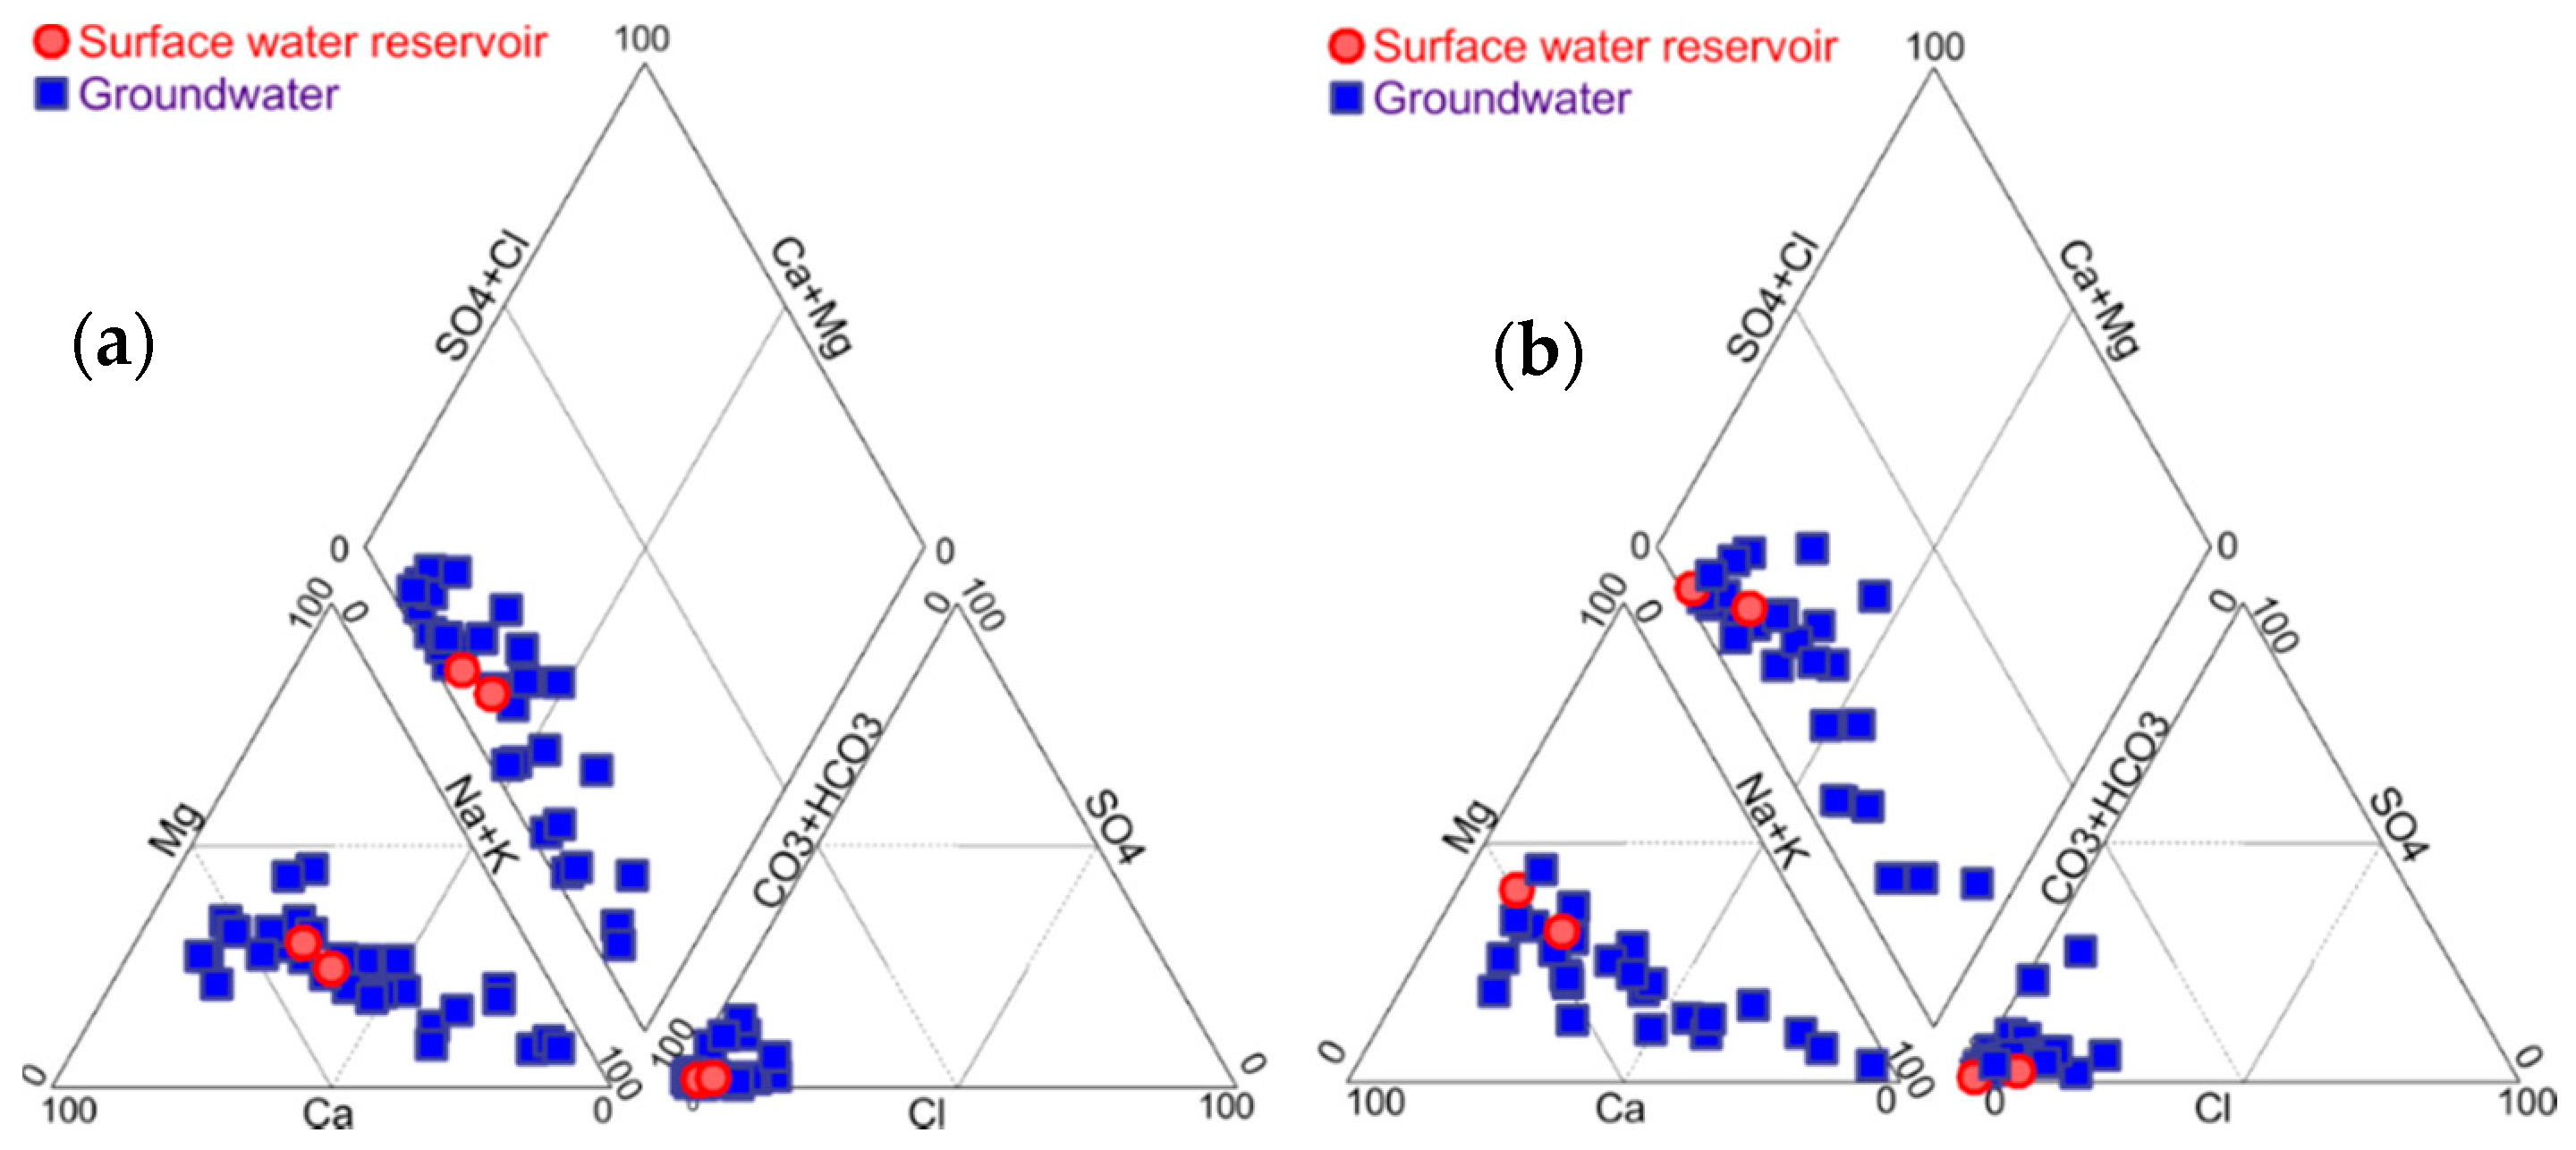
The Piper diagram [
68] represents the hydrochemical facies (relative compositions) for all the samples, in the dry and rainy seasons, respectively for the SWR and groundwater of Kierma (
Figure 9) and Mogtédo (
Figure 10).
The Piper diagrams show that Ca
2+ and HCO
3− are the dominant ions for the SWRs and most groundwater samples in Kierma and Mogtédo regardless of the season. SWR and groundwater are therefore hydrochemically similar and connected, and they have the same origin which is rainwater in the watersheds [
69]. This confirms the interaction between SWR and groundwater. In Kierma, Ca
2+ and HCO
3− are dominant in most groundwater samples in all seasons. Only a few samples show a composition evolving towards the dominance of Na
+ ions during the dry season. In Mogtédo, groundwater shows a stronger variation from a composition dominated by Ca
2+ and Mg
2+ to a composition dominated by Na
+ and K
+ [
70].
The evolution of chemical facies from calcium bicarbonate (Ca-HCO
3) to sodium bicarbonate (Na-HCO
3), especially during the dry season in Kierma and all seasons in Mogtédo, indicates enrichment in Na+ ions by cationic exchanges. These exchanges are characterized by fixation of Ca
2+ and a release of Na
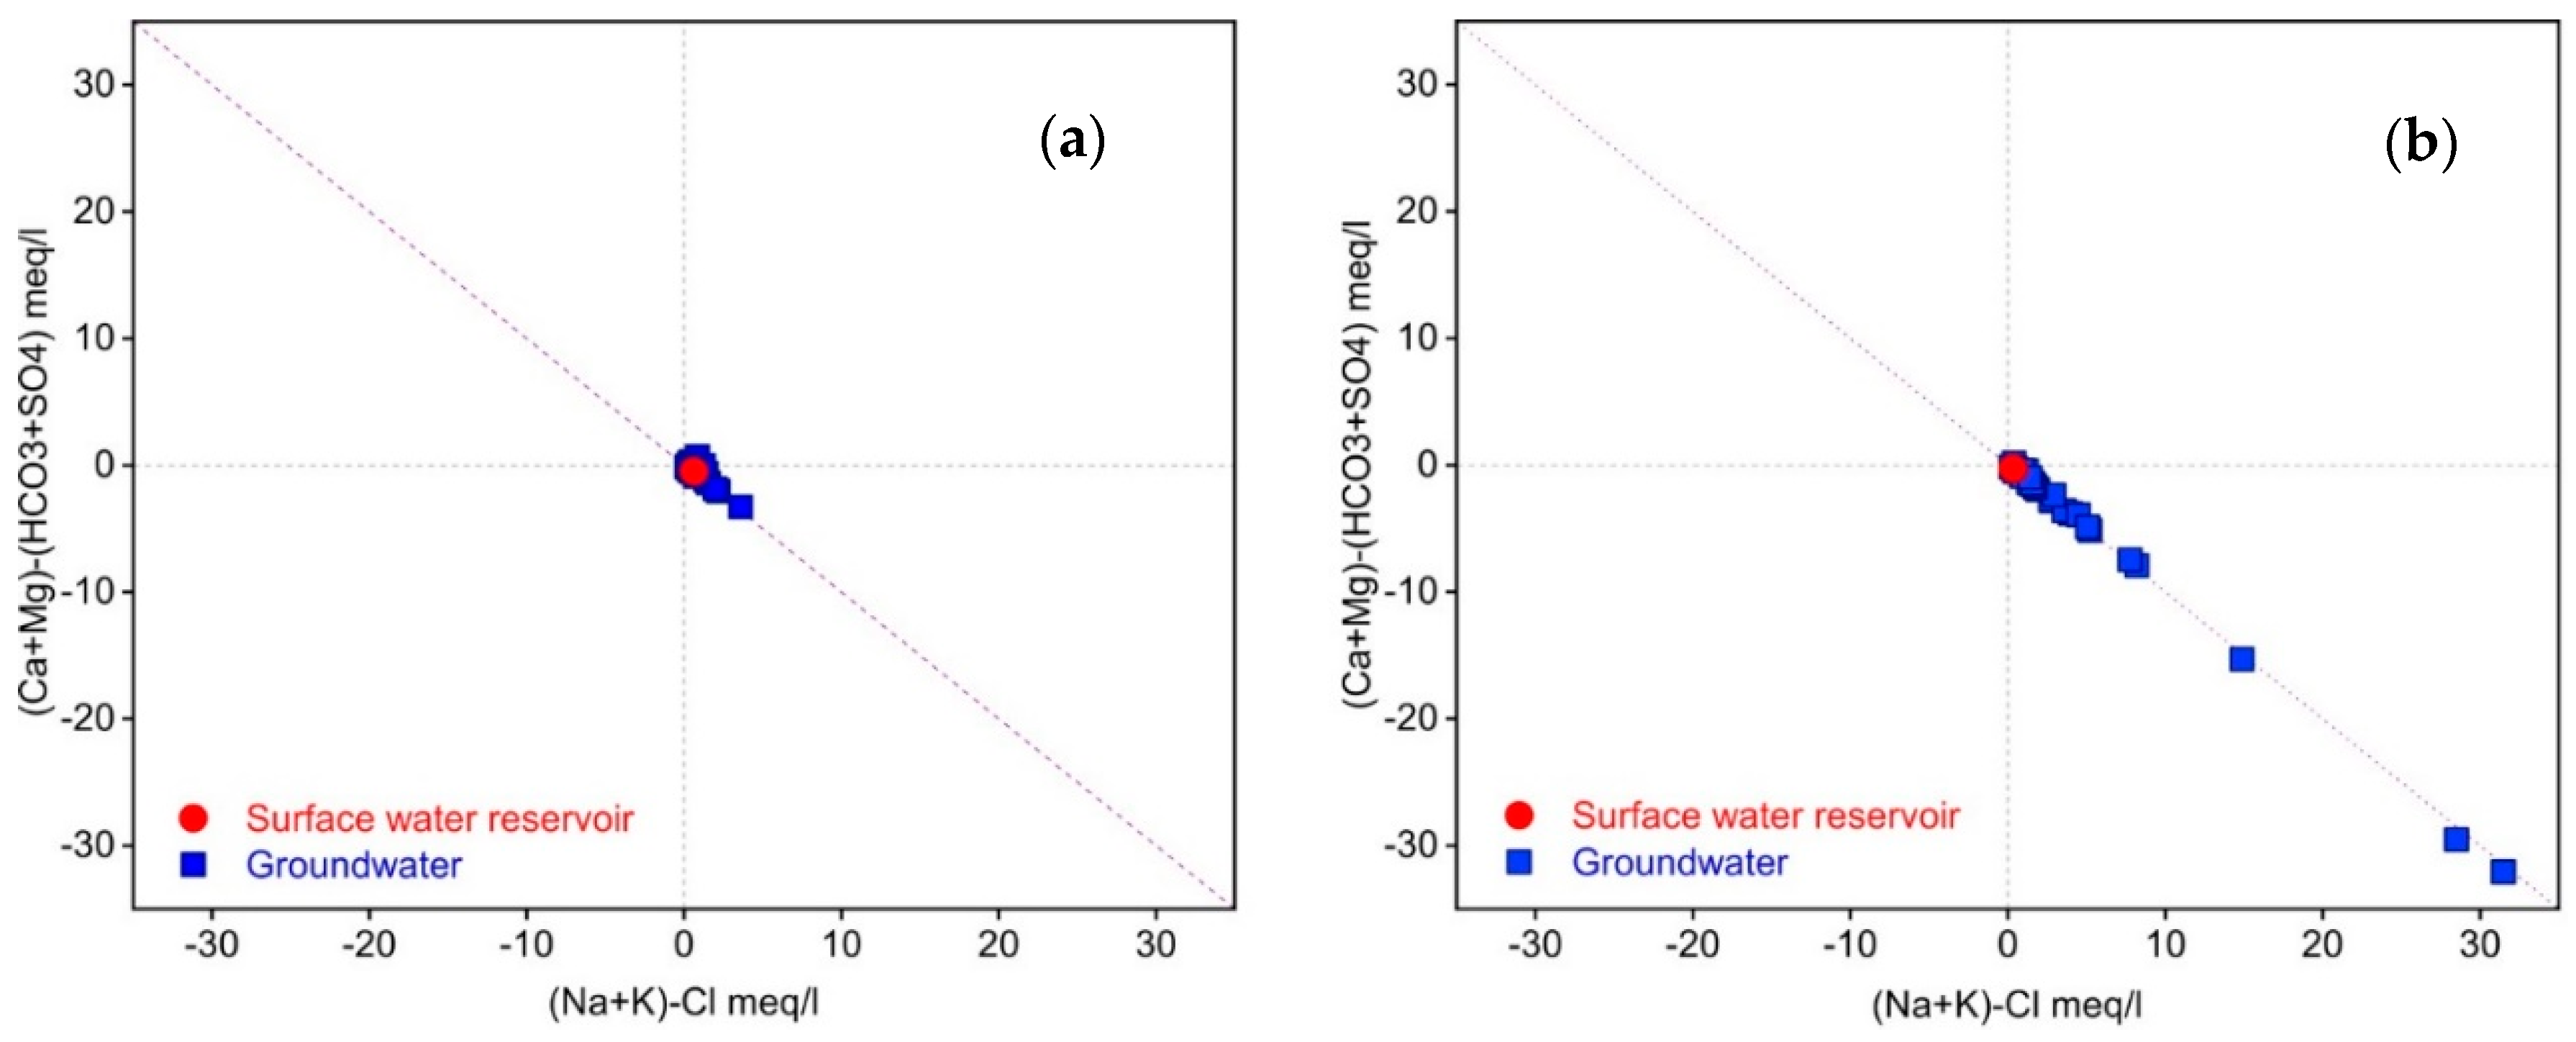
+ when the water circulates in contact with clay minerals present in the sediments lining the bottom of SWR and the underlying weathering mantle. These phenomena, which mainly characterize the water of Mogtédo, can be confirmed by plotting (Ca + Mg)–(HCO
3 + SO
4) as a function of (Na + K)–Cl [
71,
72] represented in
Figure 11. In the absence of cationic exchange, the samples should remain near the point that reflects the composition of the SWR (red dot). This is relatively the case for Kierma where the groundwater samples deviate only by 3meq/L from the composition of SWR. In Mogtédo, the deviation is as high as 30 meq/L, which confirms that cationic exchange processes are stronger because the sediments in which groundwater circulates are more clayey.
These results show not only that there are strong interactions between the SWR and groundwater, but also and above all that there is a transfer of water from the SWRs to groundwater. These two systems are an integral part of a surface–soil–subsurface continuum [
73]. In the context of the early drying up of surface water, it becomes more than necessary to quantify the SWR-groundwater exchanges for integrated and sustainable management of water resources in the Kierma and Mogtédo watersheds.
6. Evaluation of the Focused Recharge by a Water Balance Approach at the scale of the Surface Water Reservoir
To quantify the focused recharge induced by irrigation SWRs, several methods based on water balance have been described in the literature: environmental tracer method [
31] modeling [
74] and the classical water balance method [
75,
76]. In the latter approach, the volume of percolated water is assumed to be the difference between the storage capacity of the SWR and the volume of water lost directly through evaporation. This approach is often applied to SWRs for irrigation and domestic use without taking into account the withdrawals that can sometimes represent more than 40% of the SWR discharge during non-rainy months [
26,
37,
77]. This leads to an overestimation of the amount of infiltrated water. It is possible to estimate a more reliable order of magnitude of the focused recharge by taking these withdrawals into account. The recharge equation from the balance sheet method for SWRs for irrigation can then be written as in Equation (5):
This Equation (5) is deduced from the Equation (2). The terms are defined in
Section 3.
As seen in
Section 5, the SWRs of Kierma and Mogtédo are drained by groundwater. It is therefore assumed that the exfiltration of groundwater (G = 0) into theses SWRs is negligible. Precipitation, runoff, and spills only occur during the rainy season (4 months). During this period, the level of SWRs is very dynamic with almost continuous inflows. This makes inflow and storage difference difficult to calculate. Thus, the water balance method will be applied for the dry season, but also for each day of the rainy season when there was no precipitation, runoff, and spillage (P = 0, R = 0, and O = 0). These terms are therefore removed from equation 2 and the other terms are divided by the SWRs surface (A
Res). The focused recharge will be calculated for the periods when the SWRs did not dry up.
6.1. Assessment of the Components of Balance Necessary for Estimating the Focused Recharge of Surface Water Reservoirs (SWRS)
The daily variation of levels in SWRs (∆h) is the difference between the maximum and minimum water levels over 24 h.
: water level of the day T1 (mm) and : water level of day T2 (mm)
Figure 12a,b shows the variations in levels in SWRs in Kierma and Mogtédo, respectively. In general, the SWRs fill up during the rainy season (June–September) and they are gradually emptied from October to dry up in March-April, except for 2013–2014, when the SWR in Kierma did not completely dry up.
Daily evaporation (E) from the SWRs was estimated using evaporation pans installed in their vicinity [
78] using a pan coefficient [
79] to convert evaporation from the pan to evaporation from the water of SWRs [
80,
81]. Evaporation from SWRs occurs mainly during the dry season when it is at its maximum. In Kierma, the daily evaporation rate varies from 1 to 7.5 mm/day during the dry season and from 0 to 7 mm/day during the rainy season. In Mogtédo, the daily evaporation rate varies from 1 to 9 mm/day during the dry season, and 0.2 to 8 mm/day during the rainy season.
The two SWRs are used mainly for irrigation during the dry season but also for watering animals and, to a less extent, for domestic use. These different water withdrawals were determined using measuring devices and field surveys carried out by the PADI. In Kierma, withdrawals from the SWR can reach 12 mm/day during the dry season and are negligible during the rainy season. In Mogtédo, they can reach 20 mm/day during the dry season and are also negligible during the rainy season.
6.2. Analysis of Uncertainties
Uncertainties in water balance terms can arise from measurement errors, approximations in calculation methods, and errors in some parameters used to calculate the different terms of the water balance equation [
82,
83,
84]. The estimation of these errors provides information on the reliability and accuracy of the water balance [
85].
In this study, the errors associated with the measurements of evaporation, water levels in surface water reservoirs, and water withdrawals are summarized in
Table 2. Overall, the uncertainty associated with estimating infiltration is estimated as in Equations (7) and (8):
where
and
are respectively the absolute error (mm) and relative error (%) associated with each term,
)
6.3. Estimation of Focused Recharge
Daily focused recharge estimations in Kierma and Mogtédo are presented in
Figure 12a,b as a function of the evolution of SWR levels. The focused recharge varies from day to day.
The negative graphical values reflect errors associated with the estimations of evaporation and water withdrawals rather than any contribution from the shallow groundwater to the SWR, as most of the negative values occur in the dry season. These negative recharge values are higher in Kierma. Indeed, in Kierma, the estimations of withdrawals were based on surveys only, whereas in Mogtédo, a device for measuring water flows to the irrigated plots was also used in addition to the field surveys. A better estimation of water withdrawals and evaporation would make the results more reliable and makes it possible to minimize negative values as shown by Bouteffeha et al. [
88].
Nevertheless, disregarding negative values and those deviating from the global average, the potential daily focused recharge is estimated on average at 5 ± 2 mm in Kierma and 4 ± 2 mm in Mogtédo. Average values were also estimated for the dry season and the rainy season at respectively 5 ± 2 mm and 6 ± 3 mm in Kierma and 4 ± 2 mm both in Mogtédo. This indicates that there is not much disparity in values of focused recharge according to the season. While comparing the two sites, focused recharge seems to be more important in Kierma than in Mogtédo. This can be explained by the geological context and the nature of the sediments of the SWRs which are more clayey at Mogtédo.
The results are consistent with those obtained in SWRs built for artificial recharge [
25,
89] which, according to the review of Habets et al. [
19] are higher than 5 mm/day. These results are much lower than those obtained by Bouteffeha et al. [
88], i.e., 8 mm/day in the SWRs used for irrigation in Tunisia. This can be explained by the geological difference of the studied SWRs, the hill SWRs in Tunisia are based on the Plio-Quaternary formations essentially made up of sand, whereas those of Kierma and Mogtédo are located on formations of the granitic basement. On the other hand, the daily focused recharges are more or less comparable to those obtained by Fowe et al.[
18] in the SWR of Boura (0–4 mm/day) in Burkina Faso which is located in the same geological and climatic context as the Kierma surface water reservoir.
All these results clearly show the existence of a focused recharge induced by SWRs used for irrigation towards the underlying shallow groundwater. The majority of these SWRs are active for at least 9 months in the year. Thus, the annual volume of focused recharge that occurs on the surface water reservoir area, can be estimated on average at 650,000 ± 260,000 m
3 in Kierma and 2,856,000 ± 1,310,000 m
3 in Mogtédo. Furthermore, the annual volume of natural recharge (see
Section 4) that occurs on the watershed area can be estimated on average at 8,200,000 m
3 in Kierma and 24,000,000 m
3 in Mogtédo. When comparing these results, the focused recharge represents 8% of the total recharge in Kierma and 12% in Mogtédo. Focused recharge is therefore not negligible at the scale of the watersheds and it enables to store a significant volume of water that would have been lost by a runoff if the SWRs did not exist. The shallow groundwater in the vicinity of the SWRs could be exploited for complementary irrigation for integrated management of the watershed water resources.
As the focused recharge estimation has been successfully carried out for the Kierma and Mogtédo surface water reservoirs, the method could also be used for all the surface water reservoirs operated for irrigated agriculture located mainly in the basement area.
7. Groundwater Exploitation for Irrigation
The overall results show that both SWRs used for irrigation contribute significantly to the recharge of shallow groundwater. The exploitation of this alternative water resource requires good knowledge of the hydrodynamic characteristics of the shallow aquifers where they are located. To this aim, 17 slug tests were carried out on micropiezometers in both Kierma and Mogtédo. The location of the tested structures is provided in
Tables S4 and S5 of Supplementary Materials. These tests were interpreted based on the theory of Bouwer and Rice [
90] thanks to the AQTESOLV software [
91].
In Kierma, the values of hydraulic conductivity range between 0.01 m/day and 2 m/day. In Mogtédo, the hydraulic conductivity values are lower, ranging between 1 × 10
−4 m/day and 0.2 m/day. The statistics of hydraulic conductivity values are provided in
Table 3.
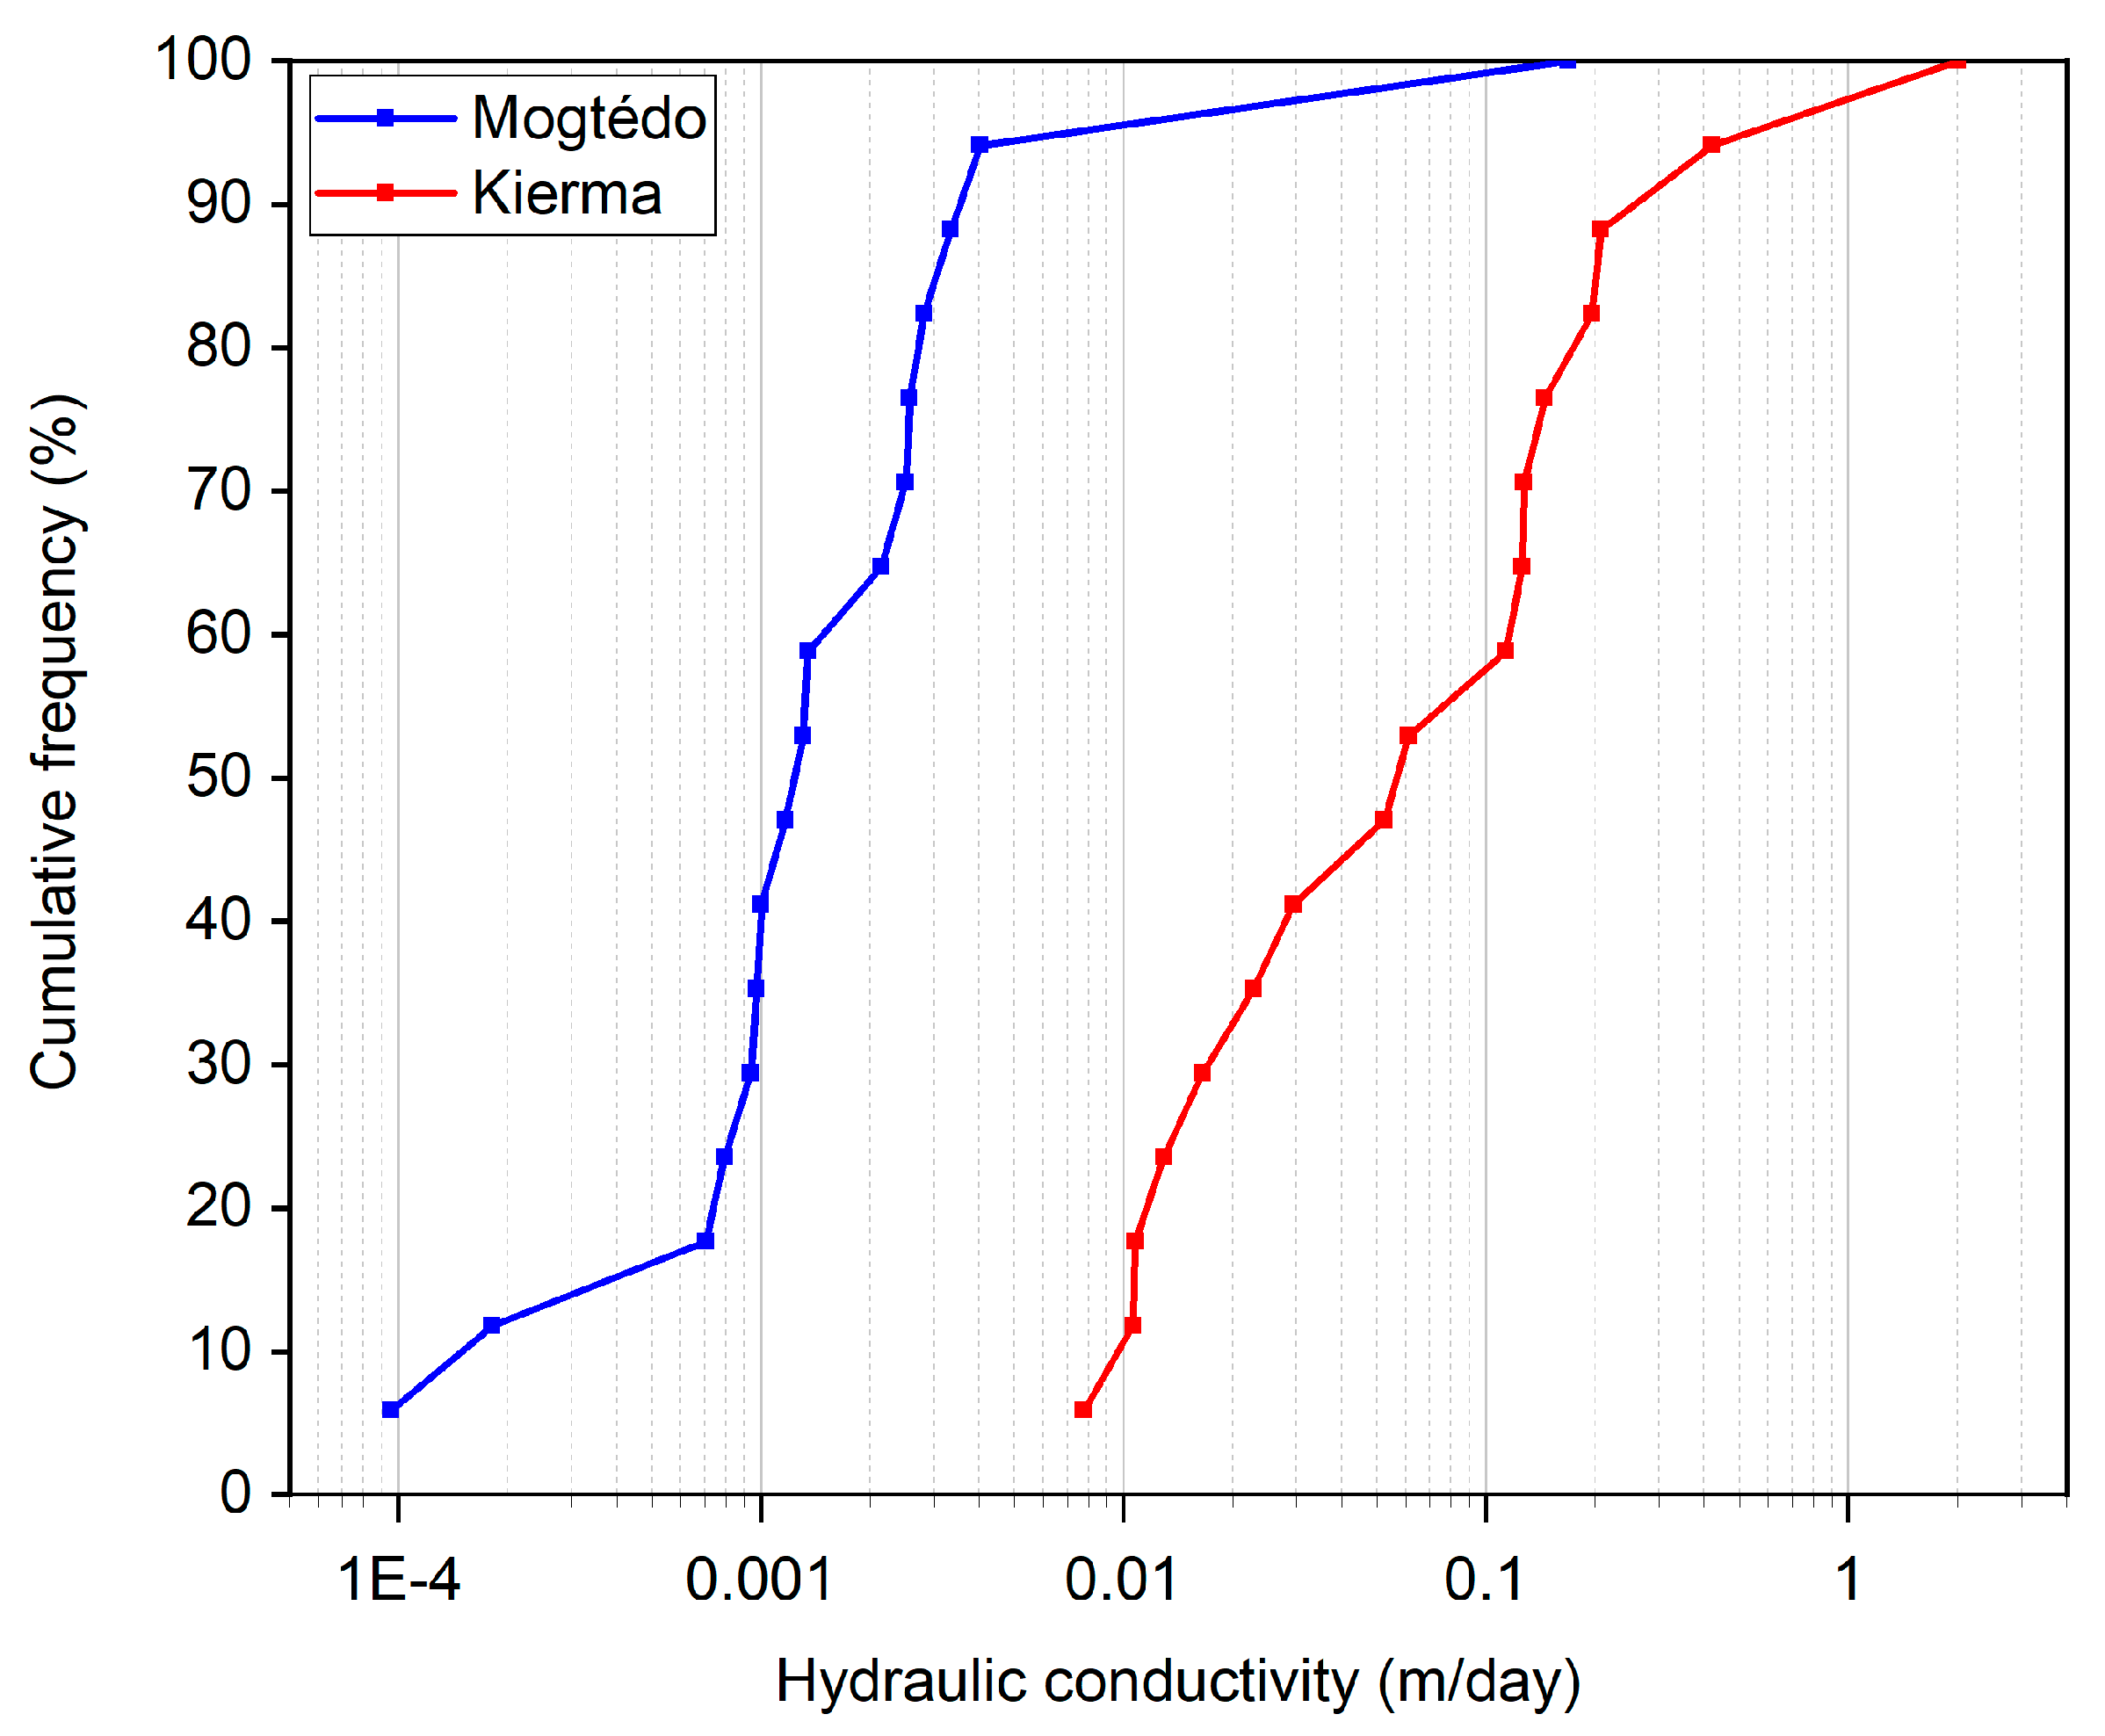
The graphical representation of the different hydraulic conductivity values (
Figure 13) shows that 82% of the values of hydraulic conductivity vary between 1 × 10
−3 m/day and 0.03 m/day in Kierma and, 70% of the values of hydraulic conductivity vary between 9 × 10
−4 m/day and 9 × 10
−3 m/day in Mogtédo. They also indicate that the range of hydraulic conductivity values is one to two orders of magnitude higher in Kierma compared to Mogtedo.
These values of hydraulic conductivity are characteristic of the sandy–clayey materials in Kierma and clayey–sandy materials in Mogtédo. With regard to the magnitude of the values of the hydraulic conductivity, these aquifers are rather poor and semi-permeable according to the classification of Bear [
92]. However, even if these aquifers could be considered as aquitards, in basement areas where water resources are scarce, they can be exploited through large-diameter wells [
93].
In the following, an estimation of the irrigation potential is made assuming the construction of wells partially penetrating in unconfined aquifer. The well has a diameter of 2 m and a depth of 10 m. Most large-diameter wells are usually constructed considering such a configuration [
94,
95].
In this case, the Darcy formula modified by Schoeller [
96] is used to estimate the yield in the well:
where:
Q: yield of the well (m3/day); K: hydraulic conductivity (m/day); h’: height of water in partially penetrating well when pumping (m); H’: height of water in the before pumping (m); r: radius of the well (m); ∆: drawdown of the piezometric level of the unconfined aquifer (m); R: radius of the borrowing perimeter, the limit of the well call zone (m).
Table 4 shows the average well yield for the corresponding hydraulic conductivities. These potential flow rates vary between 0.5 and 120 m
3/day at Kierma and between 0 and 10 m
3/day at Mogtédo. Thus, the shallow groundwater of Kierma is more easily exploitable than those of Mogtédo. The daily water requirements of crops (
Tables S8 and S9 in Supplementary Materials) compared to these pumping rates show that a well with a median yield can be used to irrigate 1000 m
2 in Kierma and 15 m
2 in Mogtédo.
These yields are not different from those estimated by [
97] in the village of Bidi in northern Burkina Faso (less than 1 m
3/h) for hand-dug wells used for domestic purposes.
The exploitation of the shallow groundwater in Kierma and Mogtédo is, therefore, possible and could save some crops in case of early drying up of SWR.
8. Conclusions
In semi-arid countries, surface water reservoirs (SWRs) are the most available resources especially for crop irrigation during the dry season but also for complementary irrigation during the rainy season. However, the sustainable development of irrigated agriculture is threatened by their early drying up. In this context, the main objective here was to propose a methodology based on cost-effective characterization methods aiming at assessing SWRs-shallow groundwater exchanges. It also aimed to quantify focused recharge of the shallow aquifers near and under SWRs, as an alternative to the problem of water shortages in irrigated agriculture. In contrast to the approaches developed for the assessment of focused recharge so far, this method integrates the identification of the recharge using hydrochemical and hydrodynamic methods and then quantifies it using field measurements, thus making it more confident. It can be reproducible at any irrigation SWR located in semi-arid zones for a more reasonable estimation of the targeted recharge.
The approach was applied to the SWRs of Kierma and Mogtédo in Burkina Faso. The results highlighted theSWRs shallow groundwater exchanges through the analysis of piezometric records and hydrochemical data. They confirm that there is a very significant groundwater recharge in the vicinity of the SWRs and also fairly significant potential for complementary irrigation programs.
At the watershed scale, the focused recharge is significant and plays a role in groundwater recharge. It is estimated on average at 650,000 ± 260,000 m3/year in Kierma and at 2,856,000 ± 1,310,000 m3/year in Mogtédo comparing to the natural recharge which is estimated on average at 8,200,000 m3 in Kierma and 24,000,000 m3 in Mogtédo. However, the estimated infiltrated volumes constitute maximum volumes that can be mobilized but not those that can be easily exploited because of the nature of the shallow aquifers and the possible drainage by the aquifers of underlying fractures.
The results also show that the values of hydraulic conductivity vary between 0.01 and 2 m/day and in Kierma and between 1 × 10⁻⁴ and 0.2 m/day in Mogtédo. Such hydraulic conductivity values could allow average yield, per hand-dug well, between 0.5 and 120 m3/day in Kierma and between 0 and 10 m3/day in Mogtédo. This yield can permit for a well to irrigate a surface area between 100 and 22,300 m2/day in Kierma and between 0 and 1800 m2/day in Mogtédo. The shallow groundwater yields area significantly higher in Kierma than Mogtédo and this can be explained by the difference in geological conditions in these watersheds. Thus, shallow aquifers in the vicinity of SWRs located on granitic substratum have more potential than those located on volcano-sedimentary belt (schists and basalts) substratum.
Nevertheless, the integrated hydrological modeling at the scale of the studied watersheds would allow confirming the results obtained and to propose scenarios for pumping in the shallow groundwater tables. Similarly, the construction of large-diameter wells in shallow aquifers and the realization of pumping tests could also make it possible to conclude that these shallow groundwater tables can be exploited sustainably for agricultural purposes. As the method was successfully applied to two watersheds which are located in two different geologic and climatic contexts, it will therefore be possible to evaluate in future studies the potential of shallow groundwater on the scale of Burkina Faso from the database of surface water reservoirs and the geological map.
Supplementary Materials
The following are available online at
https://www.mdpi.com/2073-4441/12/10/2880/s1, Table S1: Maximum available water content according to the type of soil within Kierma Watershed; Table S2: Maximum available water content according to the type of soil within Mogtédo Watershed; Table S3: Sensitivity analysis of maximum water storage capacity on natural recharge calculations; Table S4: Description of the investigations performed at Kierma; Table S5: Description of the investigations performed at Mogtédo; Table S6: Physico-chemical measurement and results for groundwater and reservoir water sample in Kierma watershed; Table S7: Physico-chemical measurement and results for groundwater and reservoir water sample in Mogtédo watershed; Table S8: Crop water requirements in Kierma; Table S9: Crop water requirements in Mogtédo.
Author Contributions
Conceptualization, A.B., S.B. and P.O.; methodology, A.B., S.B. and P.O.; formal analysis, A.B., S.B., I.O. and P.O.; investigation, A.B., E.H. and F.G.; resources, A.Z., S.B. and P.O.; data curation, E.H., F.G. and A.B.; writing—original draft preparation, A.B.; writing—review and editing, S.B., P.O., and I.O.; supervision, S.B. and P.O.; project administration, A.Z., S.B. and P.O.; funding acquisition, A.Z., P.O., S.B. and E.H. All authors have read and agreed to the published version of the manuscript.
Funding
This research was funded by Wallonie-Bruxelles International (WBI) from Belgium and the Ministry in charge of Agriculture from Burkina Faso.
Acknowledgments
The authors are grateful to the “Direction Générale des Ressources en Eau (DGRE)” and “Direction Générale de l’Agriculture et de Aménagements Hydrauliques (DGAHDI)” in Burkina Faso for supplying data and materials for field works. We also acknowledge Sauret Serge, Farid Traoré for correcting this paper and for the helpful discussions we had. We also thank Caroline Sprumont, Pierre Briest, Arnaud Grommet, Mahamadi Zoundi, and Valentin Nikiema for helping us for field investigations and to Joël Otten for the analysis of chemical elements performed on water samples at the University of Liège. Thanks to Philbert Nshimiyimana for proofreading the English version of the paper.
Conflicts of Interest
The authors declare no conflict of interest.
References
- Jalloh, A.; Faye, M.D.; Roy-Macauley, H.; Sérémé, P.; Zougmoré, R.; Thomas, T.S.; Nelson, G.C. Aperçu. In L’agriculture Ouest-Africaine et le Changement Climatique; Jalloh, A., Nelson, G.C., Thomas, T.S., Zougmoré, R., Roy-Macauley, H., Eds.; International Food Policy Research Institute: Washington, DC, USA, 2017; pp. 1–36. ISBN 978-0-89629-871-2. [Google Scholar]
- Schmidhuber, J.; Tubiello, F.N. Food security under climate change. Proc. Natl. Acad. Sci. USA 2007, 6, 10–13. [Google Scholar] [CrossRef] [Green Version]
- Gizaw, M.S.; Gan, T.Y. Impact of climate change and El Niño episodes on droughts in sub-Saharan Africa. Clim. Dyn. 2017, 49, 665–682. [Google Scholar] [CrossRef]
- Descroix, L.; Genthon, P.; Peugeot, C.; Mahé, G.; Abdou, M.; Vandervaere, J.-P.; Mamadou, I.; Tanimoun, B.; Amadou, I.; Galle, S. Paradoxes et contrastes en Afrique de l’Ouest: Impacts climatiques et anthropiques sur les écoulements. Géologues 2015, 187, 47–52. [Google Scholar]
- Serdeczny, O.; Adams, S.; Baarsch, F.; Coumou, D.; Robinson, A.; Hare, W.; Schaeffer, M.; Perrette, M.; Reinhardt, J. Climate change impacts in Sub-Saharan Africa: From physical changes to their social repercussions. Reg. Environ. Chang. 2017, 17, 1585–1600. [Google Scholar] [CrossRef]
- Zougmoré, F.; Damiba, L.; D’Haen, S.; Dayamba, S.D. État Des Lieux Des Connaissances Scientifiques Sur Les Changements Climatiques Pour Les Secteurs Des Ressources En Eau, De L’Agriculture Et De La Zone Côtière; Climate Analytics: Berlin, Germany, 2019. [Google Scholar]
- Mérino, M. Insécurité alimentaire en Afrique subsaharienne. Fond. Pour la Rech. Strat. 2009, 212, 1–9. [Google Scholar]
- Diarra, A.; Barbier, B.; Yacouba, H. Adaptation de l’agriculture sahélienne aux changements climatiques: Une approche par la modélisation stochastique. Sci. Chang. Planétaires/Sécheresse 2013, 24, 57–63. [Google Scholar]
- Morris, J.; Barron, J. Agricultural Water Management Technology Expansion and Impact on Crop Yields in Northern Burkina Faso (1980-2010): A Review. CGIAR Chall. Progr. Water Food 2014, 10, 44. [Google Scholar]
- Mul, M.; Obuobie, E.; Appoh, R.; Kankam-Yeboah, K.; Bekoe-Obeng, E.; Amisigo, B.; Logah, F.Y.; Ghansah, B.; McCartney, M. Water Resources Assessment of the Volta River Basin; International Water Management Institute: Colombo, Sri Lanka, 2015. [Google Scholar]
- Woodhouse, P.; Veldwisch, G.J.; Venot, J.P.; Brockington, D.; Komakech, H.; Manjichi, Â. African farmer-led irrigation development: Re-framing agricultural policy and investment? J. Peasant Stud. 2017, 44, 213–233. [Google Scholar] [CrossRef]
- Venot, J.P.; de Fraiture, C.; Acheampong, E.N. Revisiting Dominant Notions: A Review of Costs, Performance and Institutions of Small Reservoirs in Sub-Saharan Africa; International Water Management Institute: Colombo, Sri Lanka, 2012. [Google Scholar]
- Ayantunde, A.A.; Cofie, O.; Barron, J. Multiple uses of small reservoirs in crop-livestock agro-ecosystems of Volta basin: Implications for livestock management. Agric. Water Manag. 2018, 204, 81–90. [Google Scholar] [CrossRef]
- Nikkels, M.J.; van Oel, P.R.; Meinke, H.; Hellegers, P.J.G.J. Challenges in assessing the regional feasibility of local water storage. Water Int. 2019, 44, 854–870. [Google Scholar] [CrossRef] [Green Version]
- Marlet, S.; Sanogo, S.; Keita, M. Evaluation Finale du ”Projet de Réduction de la Vulnérabilité des Petits Barrages aux Changements Climatiques (PRVPB-CC)”; Appraisal Report: Ouagadougou, Burkina Faso, 2017. [Google Scholar]
- Ogilvie, A.; Riaux, J.; Massuel, S.; Mulligan, M.; Belaud, G.; Le Goulven, P.; Calvez, R. Socio-hydrological drivers of agricultural water use in small reservoirs. Agric. Water Manag. 2019, 218, 17–29. [Google Scholar] [CrossRef]
- Acheampong, E.N.; Ozor, N.; Sekyi-annan, E. Development of small dams and their impact on livelihoods: Cases from northern Ghana. Afr. J. Agric. Res. 2014, 9, 1867–1877. [Google Scholar] [CrossRef]
- Fowe, T.; Karambiri, H.; Paturel, J.E.; Poussin, J.C.; Cecchi, P. Water balance of small reservoirs in the volta basin: A case study of boura reservoir in burkina faso. Agric. Water Manag. 2015, 152, 99–109. [Google Scholar] [CrossRef]
- Habets, F.; Molenat, J.; Carluer, N.; Douez, O.; Leenhardt, D. Cumulative impact of small reservoirs: A review of estimations and methods. EGU Gen. Assem. Conf. Abstr. 2018, 20, 14758. [Google Scholar]
- Lacombe, G. Evolution et Usages de la Ressource en eau Dans un Bassin Versant Amenage Semi-aride. Ph.D. Thesis, Montpellier 2 University, Montpellier, France, 24 October 2007. [Google Scholar]
- Singh, A.; Panda, S.N.; Saxena, C.K.; Verma, C.L.; Uzokwe, V.N.E.; Krause, P.; Gupta, S.K. Optimization modeling for conjunctive use planning of surface water and groundwater for irrigation. J. Irrig. Drain. Eng. 2016, 142, 04015060. [Google Scholar] [CrossRef]
- Singh, D.; Flook, S.; Pandey, S.; Erasmus, D.; Foster, L.; Phillipson, K.; Smallacombe, J.; Khor, J.; Lowry, S. Improved characterisation of unmetered stock and domestic groundwater use in the Surat and Southern Bowen basins of the Great Artesian Basin (Australia). Hydrogeol. J. 2020, 28, 413–426. [Google Scholar] [CrossRef]
- Ammar, S.B.; Jeribi, L.; Favreau, G.; Zouari, K.; Leduc, C.; Oi, M.; M’barek, J.; Beji, R. Évolution de la recharge de la nappe phréatique de la plaine de Kairouan (Tunisie centrale) déduite de l’analyse géochimique. Sécheresse 2019, 20, 087–095. [Google Scholar] [CrossRef] [Green Version]
- Biswas, H.; Sena, D.R.; Kumar, G.; Lakaria, B.L.; Raizada, A.; Kumar, S.; Mishra, P.K. Effect of water storage structures on groundwater recharge in India. Groundw. Sustain. Dev. 2017, 4, 49–56. [Google Scholar] [CrossRef]
- Kumar, S.; Bhadra, B.K.; Paliwal, R. Evaluating the impact of artificial groundwater recharge structures using geo-spatial techniques in the hard-rock terrain of Rajasthan, India. Environ. Earth Sci. 2017, 76, 613. [Google Scholar] [CrossRef]
- Song, J.H.; Kang, M.S.; Song, I.; Jun, S.M. Water balance in irrigation reservoirs considering flood control and irrigation efficiency variation. J. Irrig. Drain. Eng. 2016, 142, 04016003. [Google Scholar] [CrossRef]
- Andreini, M.; Schuetz, T.; Senzanje, A.; Andah, W.; Cecchi, P.; Bolee, E.; De Giesen, V.; Kemp-benedikt, E.; Liebe, J. CPWF Project Number 46 Report: Small Multi-Purpose Reservoir Ensemble Planning; Program on Water and Food Project Report Series: Montpellier, France, 2009. [Google Scholar]
- Yiasoumi, B. Leaking Farm Dams. In NSW Dep. Prim. Ind.; NSW Department of Primary Industries: New South Wales, Australian, 2004; p. 6. [Google Scholar]
- Abdalla, O.A.E.; Al-Rawahi, A.S. Groundwater recharge dams in arid areas as tools for aquifer replenishment and mitigating seawater intrusion: Example of AlKhod, Oman. Environ. Earth Sci. 2013, 69, 1951–1962. [Google Scholar] [CrossRef]
- Kuroda, K.; Hayashi, T.; Do, A.T.; Canh, V.D.; Nga, T.T.V.; Funabiki, A.; Takizawa, S. Recharge des eaux souterraines dans des régions suburbaines de Hanoï, Vietnam: Effet de la diminution des niveaux des masses d’eaux de surface et des changements d’occupation du sol. Hydrogeol. J. 2017, 25, 727–742. [Google Scholar] [CrossRef]
- Sharda, V.N.; Kurothe, R.S.; Sena, D.R.; Pande, V.C.; Tiwari, S.P. Estimation of groundwater recharge from water storage structures in a semi-arid climate of India. J. Hydrol. 2006, 329, 224–243. [Google Scholar] [CrossRef]
- Ali, S.; Ghosh, N.C. Integrated modelling of potential recharge in small recharge ponds. Arab. J. Geosci. 2019, 12. [Google Scholar] [CrossRef]
- Jasrotia, A.S.; Kumar, R.; Taloor, A.K.; Saraf, A.K. Artificial recharge to groundwater using geospatial and groundwater modelling techniques in North Western Himalaya, India. Arab. J. Geosci. 2019, 12. [Google Scholar] [CrossRef]
- Mohammadzadeh-Habili, J.; Khalili, D. Assessment of Artificial Recharge Dams and Improvement of Their Groundwater-Recharge Capacity. J. Hydrol. Eng. 2020, 25. [Google Scholar] [CrossRef]
- Boisson, A.; Baïsset, M.; Alazard, M.; Perrin, J.; Villesseche, D.; Dewandel, B.; Kloppmann, W.; Chandra, S.; Picot-Colbeaux, G.; Sarah, S.; et al. Comparison of surface and groundwater balance approaches in the evaluation of managed aquifer recharge structures: Case of a percolation tank in a crystalline aquifer in India. J. Hydrol. 2014, 519, 1620–1633. [Google Scholar] [CrossRef]
- Parimalarenganayaki, S.; Elango, L. Assessment of effect of recharge from a check dam as a method of Managed Aquifer Recharge by hydrogeological investigations. Environ. Earth Sci. 2015, 73, 5349–5361. [Google Scholar] [CrossRef]
- Guyon, F.; Hallot, E.; DE Thysebaert, D.; Diarra, B.G.; Roamba, J.; Zangré, A. Résultat du bilan hydrologique de la retenue d’eau d’irrigation de Kierma. In Proceedings of the Atelier de Capitalisation des Résultats et Acquis du PADI, Ouagadougou, Burkina Faso, 14–15 November 2016. [Google Scholar]
- Guyon, F.; Hallot, E.; DE Thysebaert, D.; Diarra, B.G.; Roamba, J.; Zangré, A. Résultat du bilan hydrologique de la retenue d’eau d’irrigation de Mogtédo. In Proceedings of the Atelier de Capitalisation des Résultats et Acquis du PADI, Ouagadougou, Burkina Faso, 14–15 November 2016; p. 9. [Google Scholar]
- Thornthwaite, C.W. An approach toward a rational classification of climate. Geograph. Rev. 1948, 38, 55–94. [Google Scholar] [CrossRef]
- Cecchi, P.; Forkuor, G.; Cofie, O.; Lalanne, F.; Poussin, J.C.; Jamin, J.Y. Small reservoirs, landscape changes and water quality in sub-Saharan West Africa. Water 2020, 12, 1967. [Google Scholar] [CrossRef]
- Padonou, M.M.N.; Sarr, M.P. Contribution de la Télédétection et du Système d’information Géographique (SIG) a l’amélioration de la gestion des eaux de surface dans un bassin versant: Cas du barrage de Mogtedo au Burkina Faso. In Proceedings of the Journées d’Animation Scientifique (JAS09) de l’AUF Alger, Algers, Algeria, 8–11 November 2009; pp. 1–7. [Google Scholar]
- Guyon, F.; Hallot, E.; DE Thysebaert, D.; Diarra, B.G.; Roamba, J.; Zangré, B.V.A. Pratiques d’irrigation autour des retenues de Kierma, Mogtedo et Wedbila. In Proceedings of the Atelier de capitalisation des résultats et Acquis du PADI, Ouagadougou, Burkina Faso, 14–15 November 2016. [Google Scholar]
- Hottin, G.; Ouedraogo, O. Notice explicative de la carte Géologique à 1/1000000 de la République de Haute Volta. BRGM 1975. [Google Scholar]
- Koussoubé, Y.; Upton, K.; O Dochartaigh, B.; Bellwood-Howard, I.; Zeggan, A. Africa Groundwater Atlas; UPGro: Ghana, African, 2016; pp. 1–4. [Google Scholar]
- Savadogo, N. Géologie et Hydrogéologie du Socle Cristallin de Haute-Volta: Étude régionale du Bassin Versant de la Sissili. Ph.D. Thesis, Université Scientifique et Médicale de Grenoble, Grenoble, France, 1984. [Google Scholar]
- BUMIGEB. BUMIGEB Données Hydrogéologiques des Dégrés Carrés de Ouagadougou et de Pô; BUMIGEB: Ouagadougou, Burkina Faso, 2018. [Google Scholar]
- Yaméogo, D. Hydrogéologie des Formations Fissurées de la Partie sud du Plateau Mossi entre le Nazino et le Nakambe (région de Kombissiri-Manga) Burkina Faso. Ph.D. Thesis, Université Scientifique et Médicale de Grenoble, Grenoble, France, 1988. [Google Scholar]
- Abdou Babaye, M.S. Evaluation des Ressources en eau Souterraine dans le Bassin du Dargol (Liptako-Niger). Ph.D. Thesis, Université de Liège, Liège, Belgique, 20 December 2012. [Google Scholar]
- Pieyns, S.A.; Ouedraogo, F.N.; Kagambega, Z.; Kabore, E. Amélioration de la Connaissance et de la Gestion des eaux au Burkina Faso-Rapport Evaluation des Ressources en Eau et des Demandes Sectorielles et Bilan Besoins-Ressources; Rapport: Burkina Faso, 2017. [Google Scholar]
- Chung, I.M.; Sophocleous, M.A.; Mitiku, D.B.; Kim, N.W. Estimating groundwater recharge in the humid and semi-arid African regions: Review. Geosci. J. 2016, 20, 731–744. [Google Scholar] [CrossRef]
- Philip, J.R. Theory of Infiltration. Adv. Water Resour. 1969, 5, 215–296. [Google Scholar]
- Dassargues, A. Hydrogeology: Groundwater Science and Engineering; CRC Press: Cleveland, OH, USA, 2018; ISBN 0429894406. [Google Scholar]
- Allen, R.G.; Pereira, L.S.; Smith, M.; Raes, D.; Wright, J.L. FAO-56 Dual Crop Coefficient Method for Estimating Evaporation from Soil and Application Extensions. J. Irrig. Drain. Eng. 2005, 131, 2–13. [Google Scholar] [CrossRef] [Green Version]
- Dieng, N.M. Etude de la Relation Eaux de Surface-eaux Souterraines dans un Contexte de Changements Climatiques Dans la zone sud du Bassin du Saloum (Sénégal). Ph.D. Thesis, Université de Liège, Liège, Belgique, 24 October 2017. [Google Scholar]
- Cecchi, P. Les Petits Barrages au Burkina Faso: Un vecteur du changement social et de mutations des réalités rurales. Pre Forum Mond. L’eau 2006, 12, 1–12. [Google Scholar]
- Mahé, G.; Diello, P.; Paturel, J.; Barbier, B.; Dezetter, A.; Dieulin, C.; Rouché, N. Baisse des pluies et augmentation des écoulements au Sahel: Impact climatique et anthropique sur les écoulements du Nakambe au Burkina Faso. Sécheresse 2010, 21, 330–332. [Google Scholar]
- Kohonen, T. Matlab Implementations and Aplications of Self-organizing Map; Unigrafia Oy: Helsinki, Finland, 2014; ISBN 9789526036786. [Google Scholar]
- Döll, P.; Kiedler, K. Global-scale modeling of groundwater recharge. Hydrol. Earth Syst. Sci. 2008, 12, 863–885. [Google Scholar] [CrossRef] [Green Version]
- Cuthbert, M.O.; Taylor, R.G.; Favreau, G.; Todd, M.C.; Shamsudduha, M.; Villholth, K.G.; MacDonald, A.M.; Scanlon, B.R.; Kotchoni, D.O.V.; Vouillamoz, J.-M.; et al. Observed controls on resilience of groundwater to climate variability in sub-Saharan Africa. Nature 2019, 572, 230–234. [Google Scholar] [CrossRef]
- Orban, P.; Derouane, J.; Compaore, N.F.; Bambara, A.; Briers, P.; Brouyère, S. Renforcement des Capacités de la Direction Générale des Aménagements et du Développement de l’Irrigation et des Directions Régionales de l’Agriculture et de l’Hydraulique des Cascades, des Hauts bassins et du Plateau Central à Concevoir et à Mettre en œuv; Wallonie Bruxelles International: Bruxelles, Belgium, 2016. [Google Scholar]
- Orban, P.; Derouane, J.; Compaoré, N.F.; Bambara, A.; Briers, P.; Sprumont, C.; Mahamadi, Z.; Zangre, A.; Brouyère, S. Renforcement des capacités de la Direction Générale des Aménagements et du Développement de l’Irrigation et des Directions Régionales de l’Agriculture et de l’Hydraulique des Cascades, des Hauts bassins et du Plateau Central à Concevoir et à Mettre en œuv; Wallonie Bruxelles International: Bruxelles, Belgium, 2017. [Google Scholar]
- Orban, P.; Bambara, A.; Grommet, A.; Zoundi, M.; Derouane, J.; Zangré, A.; Brouyère, S. Renforcement des capacités de la Direction Générale des Aménagements et du Développement de l’Irrigation et des Directions Régionales de l’Agriculture et de l’Hydraulique des Cascades, des Hauts bassins et du Plateau Central à Concevoir et à Mettre en œuv; Wallonie Bruxelles International: Bruxelles, Belgium, 2018. [Google Scholar]
- Rodier, J.; Legube, B. L’Analyse De L’Eau Contrôle Et Interprétation; Dunod: Paris, France, 2009; pp. 1–1600. [Google Scholar]
- Haas, S. De Hydrogeology and Siting of Micro-dams Around Léo, Burkina Faso; Mission Report: Burkina Faso, 2010. [Google Scholar]
- Winter, T.C.; Harvey, J.W.; Franke, O.L.; Alley, W.M. Ground Water and Surface Water—A single Resource—U.S. Geological Survey Circular 1139. USGS Publ. 1998, Circular 1, 79. [Google Scholar]
- Brodie, R.S.; Sundaram, B.; Tottenham, R.; Hostetler, S. An overview of tools for assessing groundwater-surface water connectivity. Bur. Rural Sci. 2007, 131. [Google Scholar]
- Oyarzún, R.; Zambra, S.; Maturana, H.; Oyarzún, J.; Aguirre, E.; Kretschmer, N. Chemical and isotopic assessment of surface water–shallow groundwater interaction in the arid Grande river basin, North-Central Chile. Hydrol. Sci. J. 2016, 61, 2193–2204. [Google Scholar] [CrossRef] [Green Version]
- Piper, A.M. A graphic procedure in the geochemical interpretation of water-analyses. Eos, Trans. Am. Geophys. Union 1944, 25, 914–928. [Google Scholar] [CrossRef]
- Baskaran, S.; Ransley, T.; Brodie, R.S.; Baker, P. Investigating groundwater-river interactions using environmental tracers. Aust. J. Earth Sci. 2009, 56, 13–19. [Google Scholar] [CrossRef]
- Sprumont, C. Caractérisation des conditions hydrogéologiques au voisinage de petites retenues d’eau d’irrigation (Mogtédo, Burkina Faso). Master’s Thesis, Université de Liège, Liège, Belgium, 2016. [Google Scholar]
- Abid, K.; Trabelsi, R.; Zouari, K.; Abidi, B. Caractérisation hydrogéochimique de la nappe du continental intercalaire (sud tunisien). Hydrol. Sci. 2009, 54, 16. [Google Scholar] [CrossRef] [Green Version]
- Gning, A.A.; Orban, P.; Gesels, J.; Ngom, F.D.; Dassargues, A.; Malou, R.; Brouyère, S. Factors controlling the evolution of groundwater dynamics and chemistry in the Senegal River Delta. J. Hydrol. Reg. Stud. 2017, 10, 133–144. [Google Scholar] [CrossRef]
- Lewandowski, J.; Meinikmann, K.; Krause, S. Groundwater—Surface Water Interactions. Groundwater—Surface Water Interactions. Water 2020, 296, 15–18. [Google Scholar]
- Oblinger, J.A.; Moysey, S.M.J.; Ravindrinath, R.; Guha, C. A pragmatic method for estimating seepage losses for small reservoirs with application in rural India. J. Hydrol. 2010, 385, 230–237. [Google Scholar] [CrossRef]
- Boisson, A.; Villesseche, D.; Baisset, M.; Perrin, J.; Viossanges, M.; Kloppmann, W.; Chandra, S.; Dewandel, B.; Picot-Colbeaux, G.; Rangarajan, R.; et al. Questioning the impact and sustainability of percolation tanks as aquifer recharge structures in semi-arid crystalline context. Environ. Earth Sci. 2015, 73, 7711–7721. [Google Scholar] [CrossRef]
- Parimalarenganayaki, S.; Elango, L. Quantification of groundwater recharge and river bed clogging by daily water level measurements in a check dam. Arab. J. Geosci. 2018, 11. [Google Scholar] [CrossRef]
- Chabi, A. Assessment of Water Balance in the Ilauko Reservoir of the Ouémé at Savè Catchment (Benin, West Africa). Hydrology 2019, 7, 15. [Google Scholar] [CrossRef] [Green Version]
- Guyon, F.; Hallot, E.; De Thysebaert, D.; Galley, D.B.; Joel, R.; Zangre, A. Estimation des bilans Hydrologiques des Retenues d’ eau d’irrigation—Méthodologie; Rapport PADI: Burkina Faso, 2016. [Google Scholar]
- Pouyaud, B. Contribution à L’évaluation de L’évaporation de Nappes d’eau Libre en Climat Tropical sec; ORSTOM: Paris, France, 1986; ISBN 2709908255. [Google Scholar]
- Althoff, D.; Rodrigues, L.N.; Silva, D.D. da Evaluating evaporation methods for estimating small reservoir water surface evaporation in the Brazilian savannah. Water 2019, 11, 1942. [Google Scholar] [CrossRef] [Green Version]
- Zhao, G.; Gao, H. Estimating reservoir evaporation losses for the United States: Fusing remote sensing and modeling approaches. Remote Sens. Environ. 2019, 226, 109–124. [Google Scholar] [CrossRef] [Green Version]
- Winter, T.C. Uncertainties in Estimating the Water Balance of Lakes. JAWRA J. Am. Water Resour. Assoc. 1981, 17, 82–115. [Google Scholar] [CrossRef]
- Sacks, L.; Swancar, A.; Lee, T.M. Estimating Ground-Water Exchange with Lakes Using Water-Budget and Chemical Mass-Balance Approaches for Ten Lakes in Ridge Areas of Polk and Highlands Counties, Florida. Water-Resour. Investig. Rep. 1998, 98, 4133. [Google Scholar] [CrossRef] [Green Version]
- Trask, J.C.; Fogg, G.E.; Puente, C.E. Resolving hydrologic water balances through a novel error analysis approach, with application to the Tahoe basin. J. Hydrol. 2017, 546, 326–340. [Google Scholar] [CrossRef]
- Lee, T.M.; Swancar, A. Influence of Evaporation, Ground Water, and Uncertainty in the Hydrologic Budget of Lake Lucerne, a Seepage Lake in Polk County, Florida; U.S. Geol. Surv. Water-supply; US Government Printing Office: Washington, DC, USA, 1996; p. 61. [Google Scholar]
- Motz, L.H.; Sousa, G.D.; Annable, M.D. Water budget and vertical conductance for Lowry (Sand Hill) lake in north-central Florida, USA. J. Hydrol. 2001, 250, 134–148. [Google Scholar] [CrossRef]
- Herschy, R.W. The Magnitude of Errors at Flow Measurement Stations; Water Resources Board: Colombo, Sri Lanka, 1971. [Google Scholar]
- Bouteffeha, M.; Dages, C.; Bouhlila, R.; Molenat, J. A water balance approach for quantifying subsurface exchange fluxes and associated errors in hill reservoirs in semiarid regions. Hydrol. Process. 2015, 29, 1861–1872. [Google Scholar] [CrossRef]
- Dahlke, H.E.; LaHue, G.T.; Mautner, M.R.L.; Murphy, N.P.; Patterson, N.K.; Waterhouse, H.; Yang, F.; Foglia, L. Managed Aquifer Recharge as a Tool to Enhance Sustainable Groundwater Management in California: Examples From Field and Modeling Studies. In Advances in Chemical Pollution, Environmental Management and Protection; Elsevier: Amsterdam, The Netherlands, 2018; Volume 3, pp. 215–275. ISBN 9780128142998. [Google Scholar]
- Bouwer, H.; Rice, R.C. A slug test for determining hydraulic conductivity of unconfined aquifers with completely or partially penetrating wells. Water Resour. Res. 1976, 12, 423–428. [Google Scholar] [CrossRef] [Green Version]
- Duffield, G.M. AQTESOLV for Windows Version 4.5 User’s Guide; HydroSOLVE: Reston, VA, USA, 2007; pp. 1–530. [Google Scholar]
- Bear, J. Dynamics of Fluids in Porous Media; Eisevier: New York, NY, USA, 1972; pp. 1–783. [Google Scholar]
- Fussi, F.F.; Fumagalli, L.; Fava, F.; Di Mauro, B.; Kane, C.H.; Niang, M.; Wade, S.; Hamidou, B.; Colombo, R.; Bonomi, T. Classifying zones of suitability for manual drilling using textural and hydraulic parameters of shallow aquifers: A case study in northwestern Senegal. Hydrogeol. J. 2017, 25, 2263–2279. [Google Scholar] [CrossRef] [PubMed] [Green Version]
- Gowing, J.; Walker, D.; Parkin, G.; Forsythe, N.; Haile, A.T.; Ayenew, D.A. Can shallow groundwater sustain small-scale irrigated agriculture in sub-Saharan Africa? Evidence from N-W Ethiopia. Groundw. Sustain. Dev. 2020, 10, 100290. [Google Scholar] [CrossRef]
- Barker, J.A.; Herbert, R. Nomograms for the analysis of recovery tests on large-diameter wells. Q. J. Eng. Geol. 1989, 22, 151–158. [Google Scholar] [CrossRef]
- Schoeller, H. Zone et rayon d’appel, dÉbits spÉcifiques des forages et puits. calcul des constantes des couches aquifères et de la longueur du front d’emprunt. Int. Assoc. Sci. Hydrol. Bull. 1956, 1, 24–41. [Google Scholar] [CrossRef]
- Koussoubé, Y. Hydrogéologie en milieu de socle cristallin du Burkina Faso. Cas du bassin versant du bas-fond de Bidi (province du Yatenga). Univ. Cheikh Anta Diop Dakar 1996, 1, 263. [Google Scholar]
Figure 1.
Details of the location of surface water reservoirs (SWRs) in the study areas. The dashed rectangles indicate the investigated sites around the Mogtédo and Kierma dams.
Figure 1.
Details of the location of surface water reservoirs (SWRs) in the study areas. The dashed rectangles indicate the investigated sites around the Mogtédo and Kierma dams.
Figure 2.
Geological maps of Kierma (
a) and Mogtédo (
b) [
46].
Figure 2.
Geological maps of Kierma (
a) and Mogtédo (
b) [
46].
Figure 3.
Geological cross-sections of Kierma (a) and Mogtédo (b).
Figure 3.
Geological cross-sections of Kierma (a) and Mogtédo (b).
Figure 4.
Conceptual model of the hydrological functioning of a Sahelian watershed near a SWR.
Figure 4.
Conceptual model of the hydrological functioning of a Sahelian watershed near a SWR.
Figure 5.
Location of micropiezometers (Pz), rainfall gauging station, and sample sites within Kierma (a) and Mogtédo (b) watersheds.
Figure 5.
Location of micropiezometers (Pz), rainfall gauging station, and sample sites within Kierma (a) and Mogtédo (b) watersheds.
Figure 6.
Times series data of effective rainfall and water levels in the Kierma (a) and Mogtédo (b) surface water reservoir (SWR) and the shallow aquifer. The two horizontal lines in the graphs correspond respectively to the maximum level and the bottom of the surface water reservoir.
Figure 6.
Times series data of effective rainfall and water levels in the Kierma (a) and Mogtédo (b) surface water reservoir (SWR) and the shallow aquifer. The two horizontal lines in the graphs correspond respectively to the maximum level and the bottom of the surface water reservoir.
Figure 7.
Piezometric map for dry (a) and rainy (b) seasons within Kierma watershed based on measurements from 20 micropiezometers and SWR level.
Figure 7.
Piezometric map for dry (a) and rainy (b) seasons within Kierma watershed based on measurements from 20 micropiezometers and SWR level.
Figure 8.
Piezometric map for dry (a) and rainy (b) seasons within Mogtédo watershed based on measurements from 20 micropiezometers and surface water reservoir (SWR) level.
Figure 8.
Piezometric map for dry (a) and rainy (b) seasons within Mogtédo watershed based on measurements from 20 micropiezometers and surface water reservoir (SWR) level.
Figure 9.
Chemical composition of the surface water reservoir in the dry (a) and rainy (b) seasons within Kierma watershed.
Figure 9.
Chemical composition of the surface water reservoir in the dry (a) and rainy (b) seasons within Kierma watershed.
Figure 10.
Chemical composition of SWR in the dry (a) and rainy (b) seasons within Mogtédo watershed.
Figure 10.
Chemical composition of SWR in the dry (a) and rainy (b) seasons within Mogtédo watershed.
Figure 11.
(Ca + Mg)–(HCO3 + SO4) vs. (Na + K)–Cl for Kierma (a) and Mogtédo (b).
Figure 11.
(Ca + Mg)–(HCO3 + SO4) vs. (Na + K)–Cl for Kierma (a) and Mogtédo (b).
Figure 12.
Daily focused recharge according to the evolution of the surface water reservoir (SWR) level of Kierma (a) and Mogtédo (b).
Figure 12.
Daily focused recharge according to the evolution of the surface water reservoir (SWR) level of Kierma (a) and Mogtédo (b).
Figure 13.
Cumulative frequency of hydraulic conductivity of the shallow aquifer of the Mogtédo and Kierma watershed.
Figure 13.
Cumulative frequency of hydraulic conductivity of the shallow aquifer of the Mogtédo and Kierma watershed.
Table 1.
Terms of the water balance in the Kierma and Mogtédo watersheds.
Table 1.
Terms of the water balance in the Kierma and Mogtédo watersheds.
| Site | Date | P (mm) | R (mm) | ET (mm) | Smax (mm) | IWtrshd (mm) | IWtrshd/P (%) |
|---|
| Kierma | 2012–2013 | 1013 | 101 | 710 | 140 | 202 | 20 |
| 2013–2014 | 814 | 81 | 720 | 12 | 2 |
| 2014–2015 | 851 | 85 | 749 | 17 | 2 |
| 2015–2016 | 925 | 92 | 688 | 145 | 16 |
| 2016–2017 | 810 | 81 | 657 | 71 | 9 |
| 2017–2018 | 820 | 87 | 734 | 0 | 0 |
| 2018–2019 | 851 | 81 | 641 | 129 | 15 |
| Mogtédo | 2012–2013 | 902 | 121 | 675 | 150 | 107 | 12 |
| 2013–2014 | 611 | 67 | 544 | 0 | 0 |
| 2014–2015 | 794 | 99 | 686 | 9 | 1 |
| 2015–2016 | 886 | 116 | 682 | 87 | 10 |
| 2016–2017 | 805 | 103 | 680 | 22 | 3 |
| 2017–2018 | 833 | 121 | 712 | 0 | 0 |
| 2018–2019 | 819 | 92 | 618 | 109 | 13 |
Table 2.
Uncertainties for the different components of water balance.
Table 2.
Uncertainties for the different components of water balance.
| Term | Errors Sources | Estimated Maximum Absolute Errors (%) | Source of Data |
|---|
| Evaporation | Measurement
influence of local conditions | 10 | [82,86] |
| Water withdrawals | Estimations | 35 | [18] |
| Water level | Measurement | 5 | [82,87] |
Table 3.
Descriptive statistics of hydraulic conductivities in m/day.
Table 3.
Descriptive statistics of hydraulic conductivities in m/day.
| Site | Minimum | 1st Quartile | Median | 3rd Quartile | Mean | Standard Deviation | Maximum |
|---|
| Kierma | 0.01 | 0.02 | 0.1 | 0.2 | 0.2 | 0.5 | 2 |
| Mogtédo | 1 × 10⁻⁴ | 9 × 10⁻⁴ | 1 × 10⁻³ | 3 × 10⁻³ | 0.01 | 0.04 | 0.2 |
Table 4.
Estimation of hand-dug well yield, crops water requirements and irrigable surface area.
Table 4.
Estimation of hand-dug well yield, crops water requirements and irrigable surface area.
| | Parameters | Minimum | Q1 | Median | Q3 | Mean | Maximum |
|---|
| Kierma | K (m/day) | 0.01 | 0.02 | 0.1 | 0.2 | 0.2 | 2 |
| Q (m3/day) | 0.6 | 1 | 6 | 12 | 12 | 120 |
| Crops water requirements (m3/ha/day) | 54 |
| | Irrigable area (m2/day) | 100 | 200 | 1000 | 2200 | 2200 | 22,300 |
| Mogtédo | K (m/day) | 1 × 10⁻⁴ | 9 × 10⁻⁴ | 1 × 10⁻³ | 3 × 10⁻³ | 0.01 | 0.2 |
| Q (m3/day) | 0 | 0.1 | 0.1 | 0.2 | 1 | 10 |
| Crops water requirements (m3/ha/day) | 56 |
| | Irrigable area (m2/day) | 0 | 15 | 15 | 25 | 120 | 1800 |
| Publisher’s Note: MDPI stays neutral with regard to jurisdictional claims in published maps and institutional affiliations. |
© 2020 by the authors. Licensee MDPI, Basel, Switzerland. This article is an open access article distributed under the terms and conditions of the Creative Commons Attribution (CC BY) license (http://creativecommons.org/licenses/by/4.0/).

 ,
, 


