Climate Change Risk Evaluation of Tsunami Hazards in the Eastern Mediterranean Sea


1
Civil Engineering Department, Sirnak University, 73000 Sirnak, Turkey
2
Civil Engineering Department, Middle East Technical University, 06800 Ankara, Turkey
3
Georgia Institute of Technology, School of Civil and Environmental Engineering, Atlanta, GA 30332, USA
4
Design and Simulation Technologies Inc., DSTECH, Canton, MI 48187, USA
*
Author to whom correspondence should be addressed.
Water 2020, 12(10), 2881; https://doi.org/10.3390/w12102881
Submission received: 8 September 2020
/
Revised: 5 October 2020
/
Accepted: 14 October 2020
/
Published: 16 October 2020
(This article belongs to the Special Issue Computational Methods in Water Resources)
Abstract
:Climate change impacts on social and economic assets and activities are expected to be devastating. What is as important as the analysis of climate change triggered events is the analysis of a combination of climate change related events and other natural hazards not related to climate change. Given this observation, the purpose of this study is to present a coastal risk analysis for potential earthquake triggered tsunamis (ETTs) coupled with the sea level rise (SLR) in the Eastern Mediterranean Sea. For this purpose, extensive stochastic analysis of ETTs, which are not related to climate change, are conducted considering the effects of climate change related SLR projections for this century. For the combined analysis, economic and social risks are evaluated for two regions in the Eastern Mediterranean Coastline, namely the Fethiye City Center at the Turkish Coastline and the Cairo Agricultural Area near Egypt. It is observed that ignoring SLR will hinder realistic evaluation of ETT risks in the region. Moreover, spatial evaluations of economic and social risks are necessary since topography and proximity to the earthquake zones affect inundation levels due to ETTs in the presence of SLR.
1. Introduction
Tsunamis are rare but catastrophic events which may have long or short-term return periods and may cause significant damage especially when they occur due to deep sea high intensity earthquakes [1]. ETTs have resulted in mass casualty and economic destruction for the exposed countries throughout the history and also within the recent years [2]. Therefore, reliable tsunami risk assessment (TRA) studies are vital for the affected regions to take effective mitigation measures and adaptation strategies. Researchers have proposed various risk assessment approaches for TRA, in the past decade [3]. The two approaches that are used in the literature may be identified as: (i) the scenario-based deterministic approach and (ii) the probabilistic approach. In the scenario-based approach, the hazard and risk of credible worst-case scenario(s) are evaluated based on a few critical cases [3,4]. For the probabilistic approach of TRA, the most commonly used alternative is the stochastic generation of ETTs based on historical earthquakes, followed by wave propagation analysis which is followed by hazard and risk analysis of the outcome at the coastline [5,6,7,8,9,10]. Independent of ETTs, global warming, which is a long term event, is expected to result in an accelerated increase in SLR [11,12]. This may lead to higher risk of inundation of low-lying coastal areas [13]. Consequently, damages due to coastal floods are expected to increase significantly during the 21st century and beyond, as sea level rises, making socio-economic damages in coastal regions more prevalent [14]. Various studies have been conducted in the last two decades to evaluate, understand and develop management strategies and adaptation measures for risks due to SLR. Nicholls et al. [15] studied the risk of flooding within the coastal flood plain due to SLR. They concluded that SLR without adaptation measures will cause significant flooding impacts at coastal zones in southern Mediterranean that are found to be particularly vulnerable to SLR. Purvis et al. [16] carried out risk assessment of future coastal flooding to estimate the monetary loss at the UK coast in Somerset considering a given uncertainty over possible SLR. Hauer et al. [17] estimated the number of people at risk of inundation due to SLR accounting for the ongoing population growth. The starting point of these risk assessment studies is the estimation of SLR over decades, which is studied extensively in the literature [18,19,20,21,22,23,24]. These studies employ well established and robust methods, outcomes of which support similar observations. According to these studies, the expected global SLR will be inevitable over the century. More recently, similar estimates are also provided for spatial variation of SLR over various regions of World’s oceans [25]. Along this line of work, SLR estimates (0.00–0.4518 m) for the Mediterranean Sea is also reported in [26].
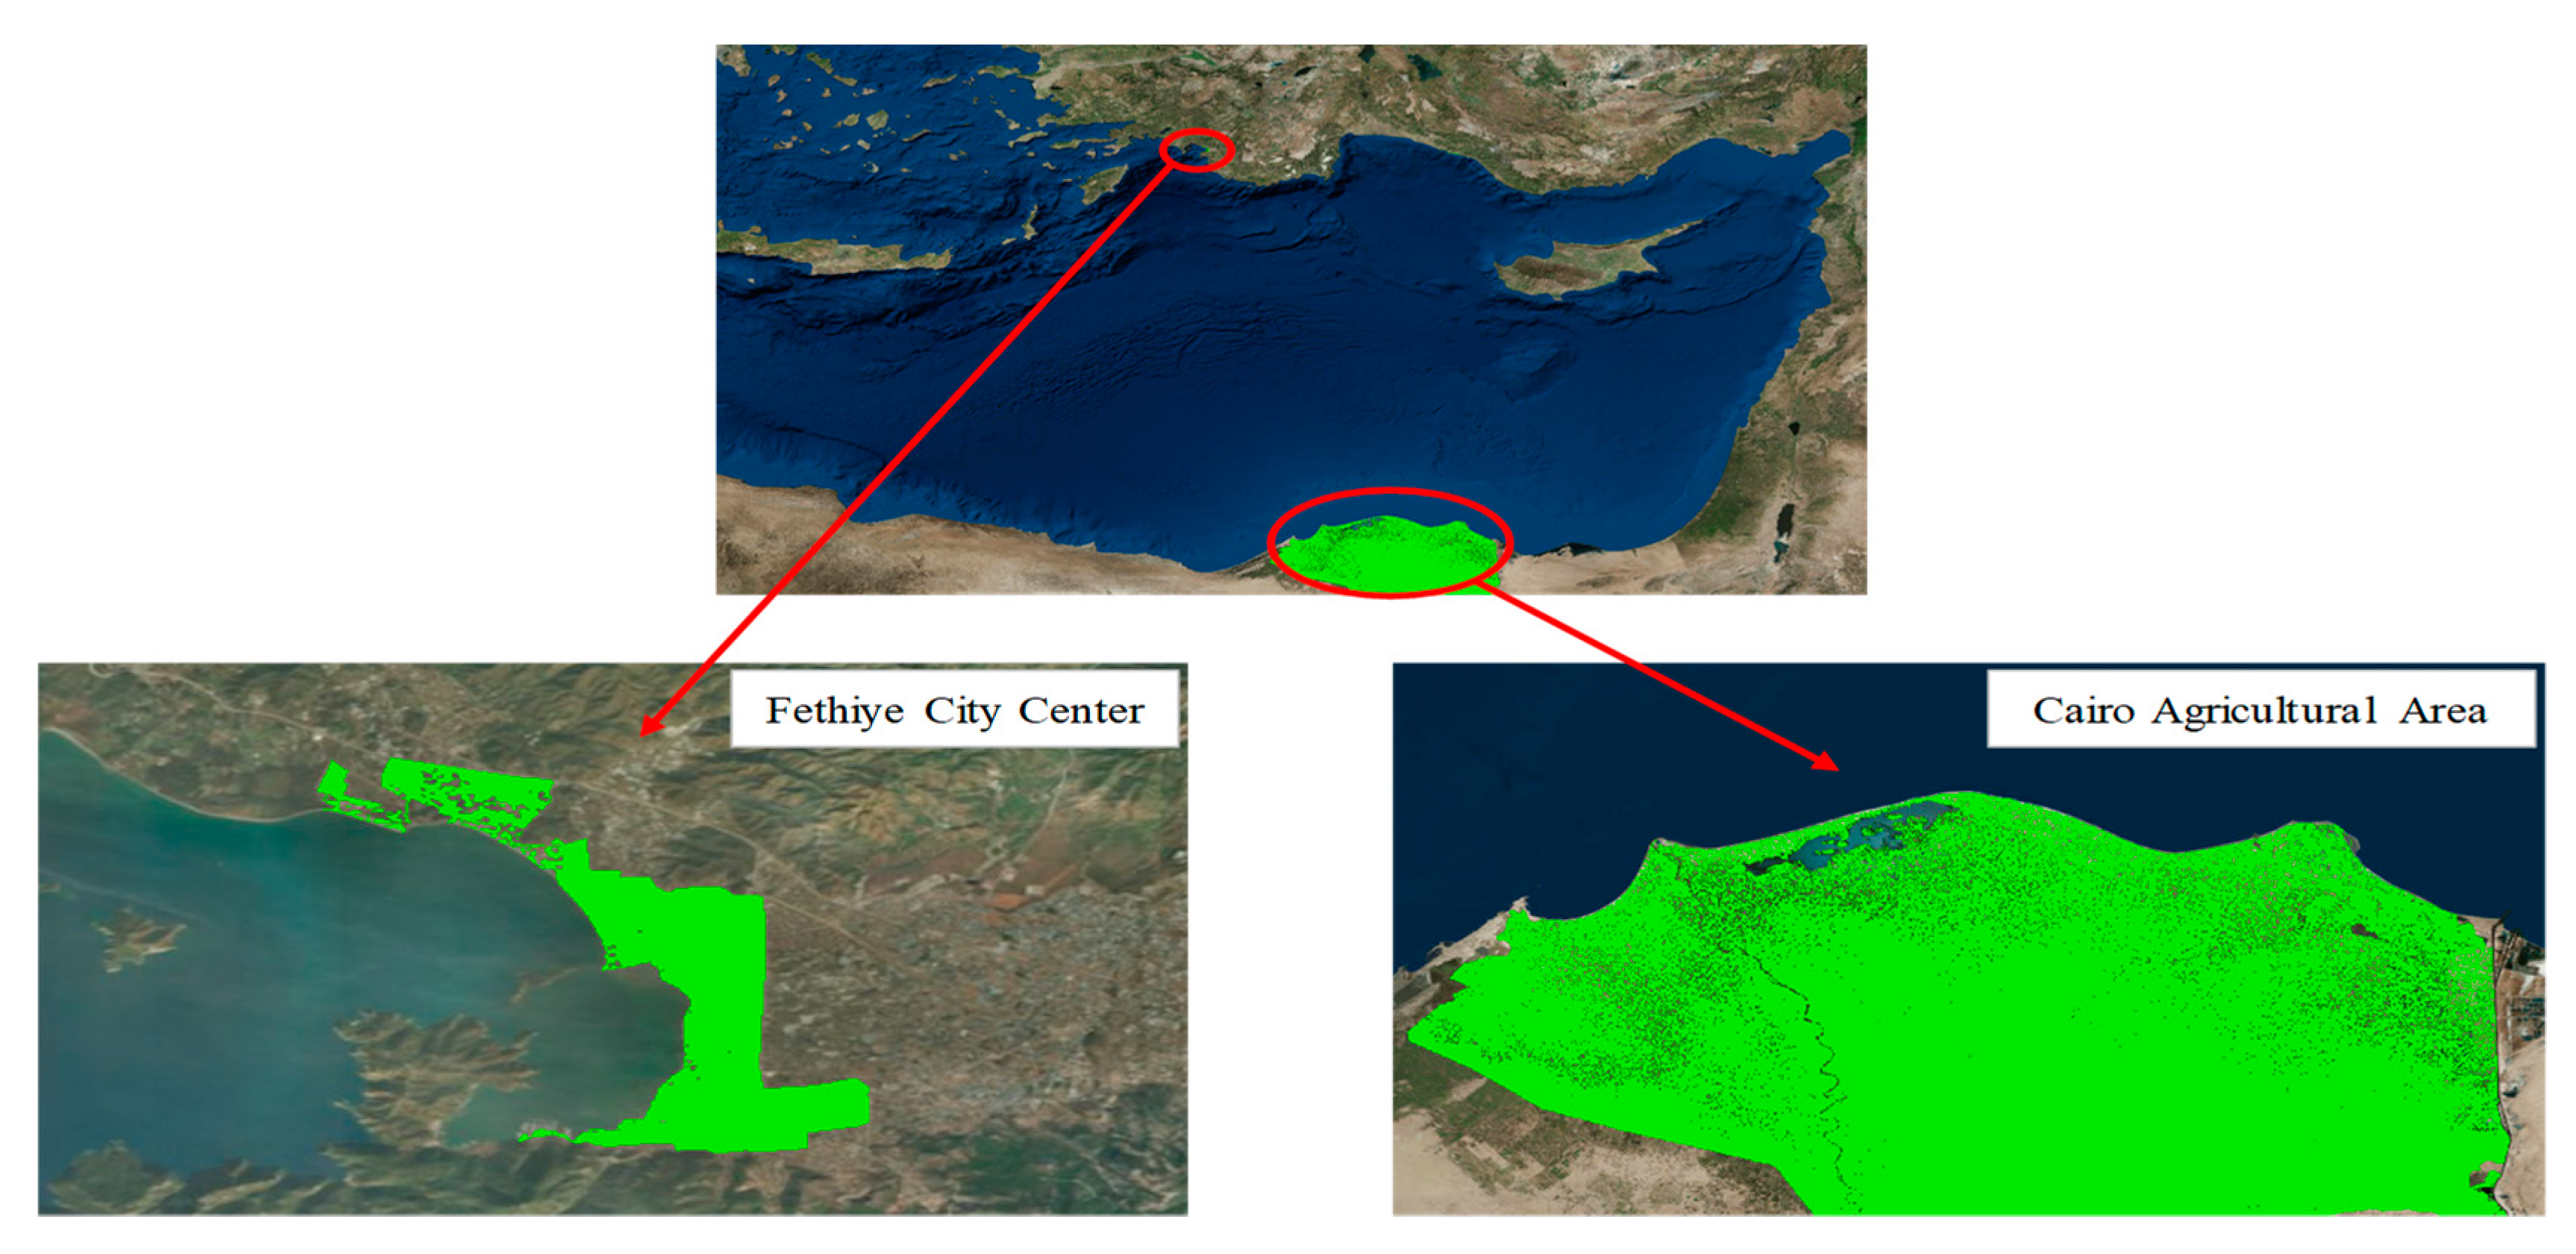
The hazard and risk analysis of ETTs should also be investigated in combination with other ocean or sea-based events like climate change-related SLR which have similar long return periods. One should also recognize that due to SLR, depth to sea surface also changes and this affects the wave generation and propagation of the ETT waves towards the shore. Simultaneous evaluation of SLR and ETTs is rare in the literature. Dall’Osso et al. [27] performed a Probabilistic Tsunami hazard Assessment (PTHA) for Sidney, Australia. Method for Splitting Tsunamis (MOST) model generated by NOAA was used to simulate 36 ETTs with different annual probabilities and SLR conditions. They concluded that tsunami hazard is dramatically increased due to higher SLR conditions. Li et al. [28] conducted a study on the rate of change of tsunami hazard by means of SLR for Macau, China. Probabilistic tsunami inundation maps were developed under different SLR conditions as, current, 0.5 m rise by 2060, and 1.0 m rise by 2100. The research revealed that SLR can cause a significant increase in the frequency of tsunami inundations which will be doubled and tripled for 2060 and 2100, respectively. Nagai et al. [29] worked on a tsunami risk hazard on the number of affected people living in Tokyo Bay, Japan. The results obtained from the study showed that up to 1.0 m SLR will not significantly affect the current living conditions for the residential areas around Tokyo bay. However, SLR affected ETTs can be hazardous for the inhabitants in the future, according to the research. To the best of our knowledge, social and economic risks due to ETTs have not been evaluated in the literature considering the combined effects of SLR. Since ETTs will be experienced in the presence of climate change triggered SLR in the future, it is useful and necessary to evaluate the combined coastal risks especially for low lying regions. The goal of this study is to develop a methodology to estimate the aggregate risk due to ETTs in the presence of SLR and Fethiye City Center, which is one of the most popular touristic destinations on the Turkish Mediterranean Coastline, and the Cairo Agricultural Area, known as the hearth of agricultural activities and located in the coastal areas of Egypt, which are selected as case study sites to demonstrate the proposed approach (Figure 1).
ETT simulations are conducted using NAMI-DANCE software [30]. To include potential SLR effects, the bathymetry of Mediterranean Sea is updated for each future simulation year (i.e., 2020, 2040, 2060, 2080 and 2100) based on SLR estimates and ETT risks are calculated using the updated bathymetries. Results of the simulations show that the contribution of the SLR related to climate change to ETTs depends on the coastal topography and increased risk levels are expected when both events are simultaneously considered in risk analysis.
2. Methodology
The approach used in this study falls under the category of probabilistic approaches since a large number of random earthquakes based on historical records in the region are generated using the Monte Carlo (MC) method. Through MC simulations, inundation level versus exceedance probability curves are formed using the wave propagation analysis for the Eastern Mediterranean as demonstrated in [24,31]. At this step, it should be noted that the waves generated by all random earthquakes are included in the risk assessment study disregarding the magnitudes of randomly generated earthquakes. Thus, low magnitude earthquakes that generate small amplitude waves together with high magnitude events that generate tsunami waves are collectively modeled in estimating the exceedance probabilities of inundations at the coast. Next, social and economic consequences/damages (i.e., social damage is evaluated in terms of number of people that will be affected and economic damage is evaluated in terms of monetary loss that will occur in the selected region) corresponding to various inundation levels are estimated and exceedance probability versus damage relations are obtained. Finally, social and economic risks are calculated by simultaneously evaluating the occurrence probabilities and associated damages. This procedure is carried out for a set of selected future simulation years which are associated with different SLR levels in the Eastern Mediterranean Sea. This approach provides a realistic temporal and spatial representation of ETTs in the region.
The general framework of the study is shown in Figure 2. The study is composed of two parts, namely (i) SLR predictions using dynamic system model with spatial SLR analysis capability (S-DSM), and (ii) TRA of ETTs in the presence of SLR analysis through MC simulations. Details of each part are explained in the following sections.
2.1. SLR Predictions Using S-DSM
Aral and Chang [26] modeled spatial variation of SLR due to climate change at Atlantic and Mediterranean coastline using the principal dynamic system methodology described in [18]. The outcome of that study included the observed data and model predictions of SLR for the Indian, Pacific, and Atlantic Oceans and the Mediterranean Sea. The rate of change of sea level and sea surface temperature (SST) in the Mediterranean Sea is projected within a 90% confidence interval from the 2000 to 2100 (Figure 3).
2.2. Risk Assessment Analysis of ETTs Through MC Simulations
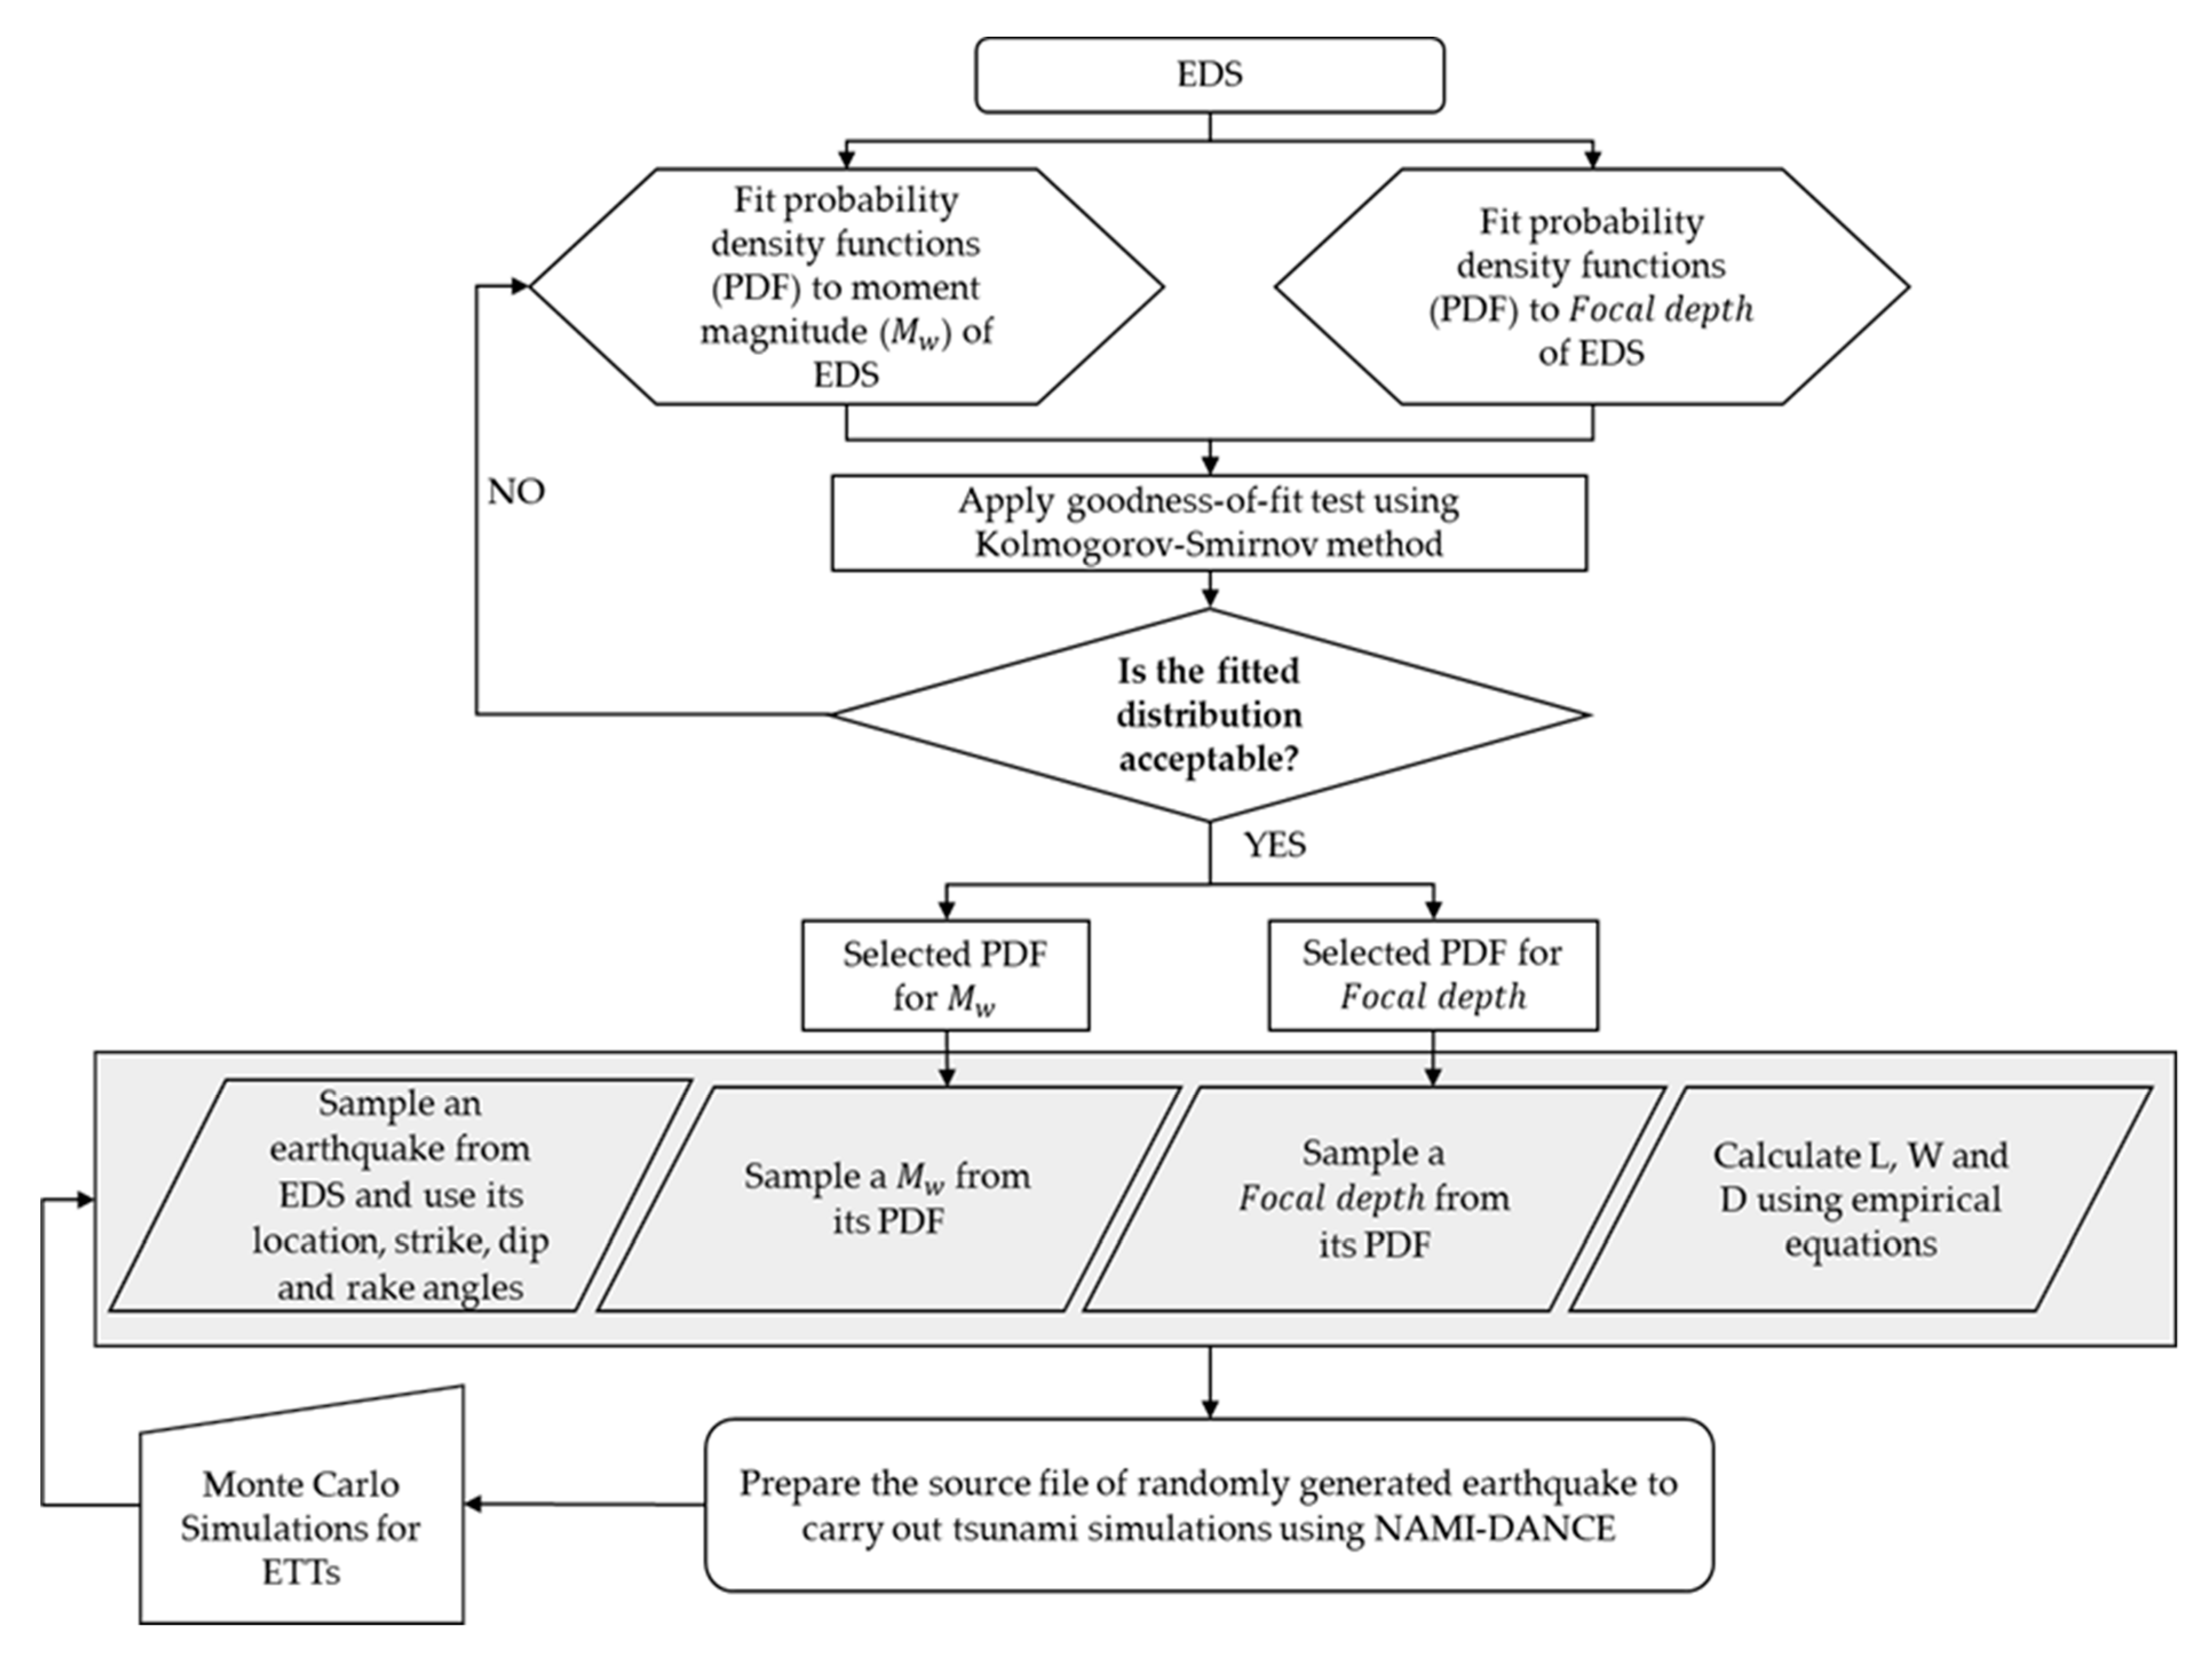
The earthquake catalogue compiled by EU funded project TRANSFER (Tsunami Risk and Strategies for the European Region) [32] is used to generate the Earthquake Data Set (EDS) for this study. EDS is composed of 523 historical earthquakes that originated in the Eastern Mediterranean Sea during the 1900–2013 period [24]. These historical earthquakes are used to generate the probability density functions (PDFs) that are used in the MC simulations. Thus, 1000 MC simulations are conducted in this study as it is suggested by [33] that this number of simulations will provide a reliable economic and social risk estimate for the region. The MC simulation framework used in this study is given in Figure 4.
As mentioned earlier, the first EDS is compiled from the TRANSFER project [32]. Moment magnitude () and are defined as the independent parameters of the earthquake source and PDFs are assigned to and using historical earthquakes of the EDS. Based on Kolmogorov–Smirnov goodness-of-fit tests, normal and gamma distributions are selected for and , respectively. Randomly-generated earthquake sources are constructed by sampling from EDS and using its location, strike, dip and rake angles. and of the earthquake source are sampled from their PDFs and the rest of the source parameters (i.e., fault length (), fault width (), and displacement () are calculated using empirical equations provided by Hanks and Kanamori [34] and Wells and Coppersmith [35]. The empirical equations used in this study are [34]:
where is the seismic moment, is the shear modulus of the crust, is the fault length, is the fault width, and is the displacement.
Wells and Coppersmith [35] proposed the following equations to calculate and for the all-slip-type regression analysis. The equations are:
2.3. ETT Simulations
To carry out ETT simulations, the bathymetry of the Eastern Mediterranean Sea having 405 × 405 m grid size is generated using GEBCO centenary edition [36]. Then the bathymetry is updated using the SLR predictions for 2020, 2040, 2060, 2080, and 2100 (Table 1).
ETT wave heights are determined using NAMI-DANCE software. The model uses the finite difference method and the shallow water equations bounded by the sea surface and the bottom topography to carry out the generation and propagation of ETT waves. Shallow water equations precisely describe the ETT wave propagation with long wave assumption. The equations consist of the combination of continuity and momentum equations without considering Coriolis, frictional, or viscous forces.
A thousand MC simulations are conducted to obtain inundation levels due to ETTs at Fethiye City Center and the Cairo Agricultural Area for each of the future years given in Table 1. Since the grid size of the bathymetry is prohibitively coarse to obtain inundation levels at the selected locations, gauges are digitized at 50-meter water depth to record non-breaking ETT wave height. Then Green’s law [37] is used to carry recorded ETT wave height to the coast. Løvholt et al. [38,39] used a similar method to carry ETT waves from 50-meter water depth to 0.5-meter water depth at the coast and they concluded that reliable results were obtained according to their investigations. In this study, following a similar approach, ETT wave height at 1 m water depth (i.e., coastline) is estimated using Green’s law [36,37]:
where and are the ETT wave heights at 50 m and 1 m water depths, respectively and and are 50 m and 1 m water depths, respectively. In order to calculate inundation levels at Fethiye City Center and the Cairo Agricultural Area, the ETT wave height at the coastline is assumed to inundate all the connected land below this altitude at the coast and the inundation level is assumed to be equal to the ETT wave height at the coastline. Wave impact analysis is not considered in this study.
2.4. Economic and Population Growth Rate Projections
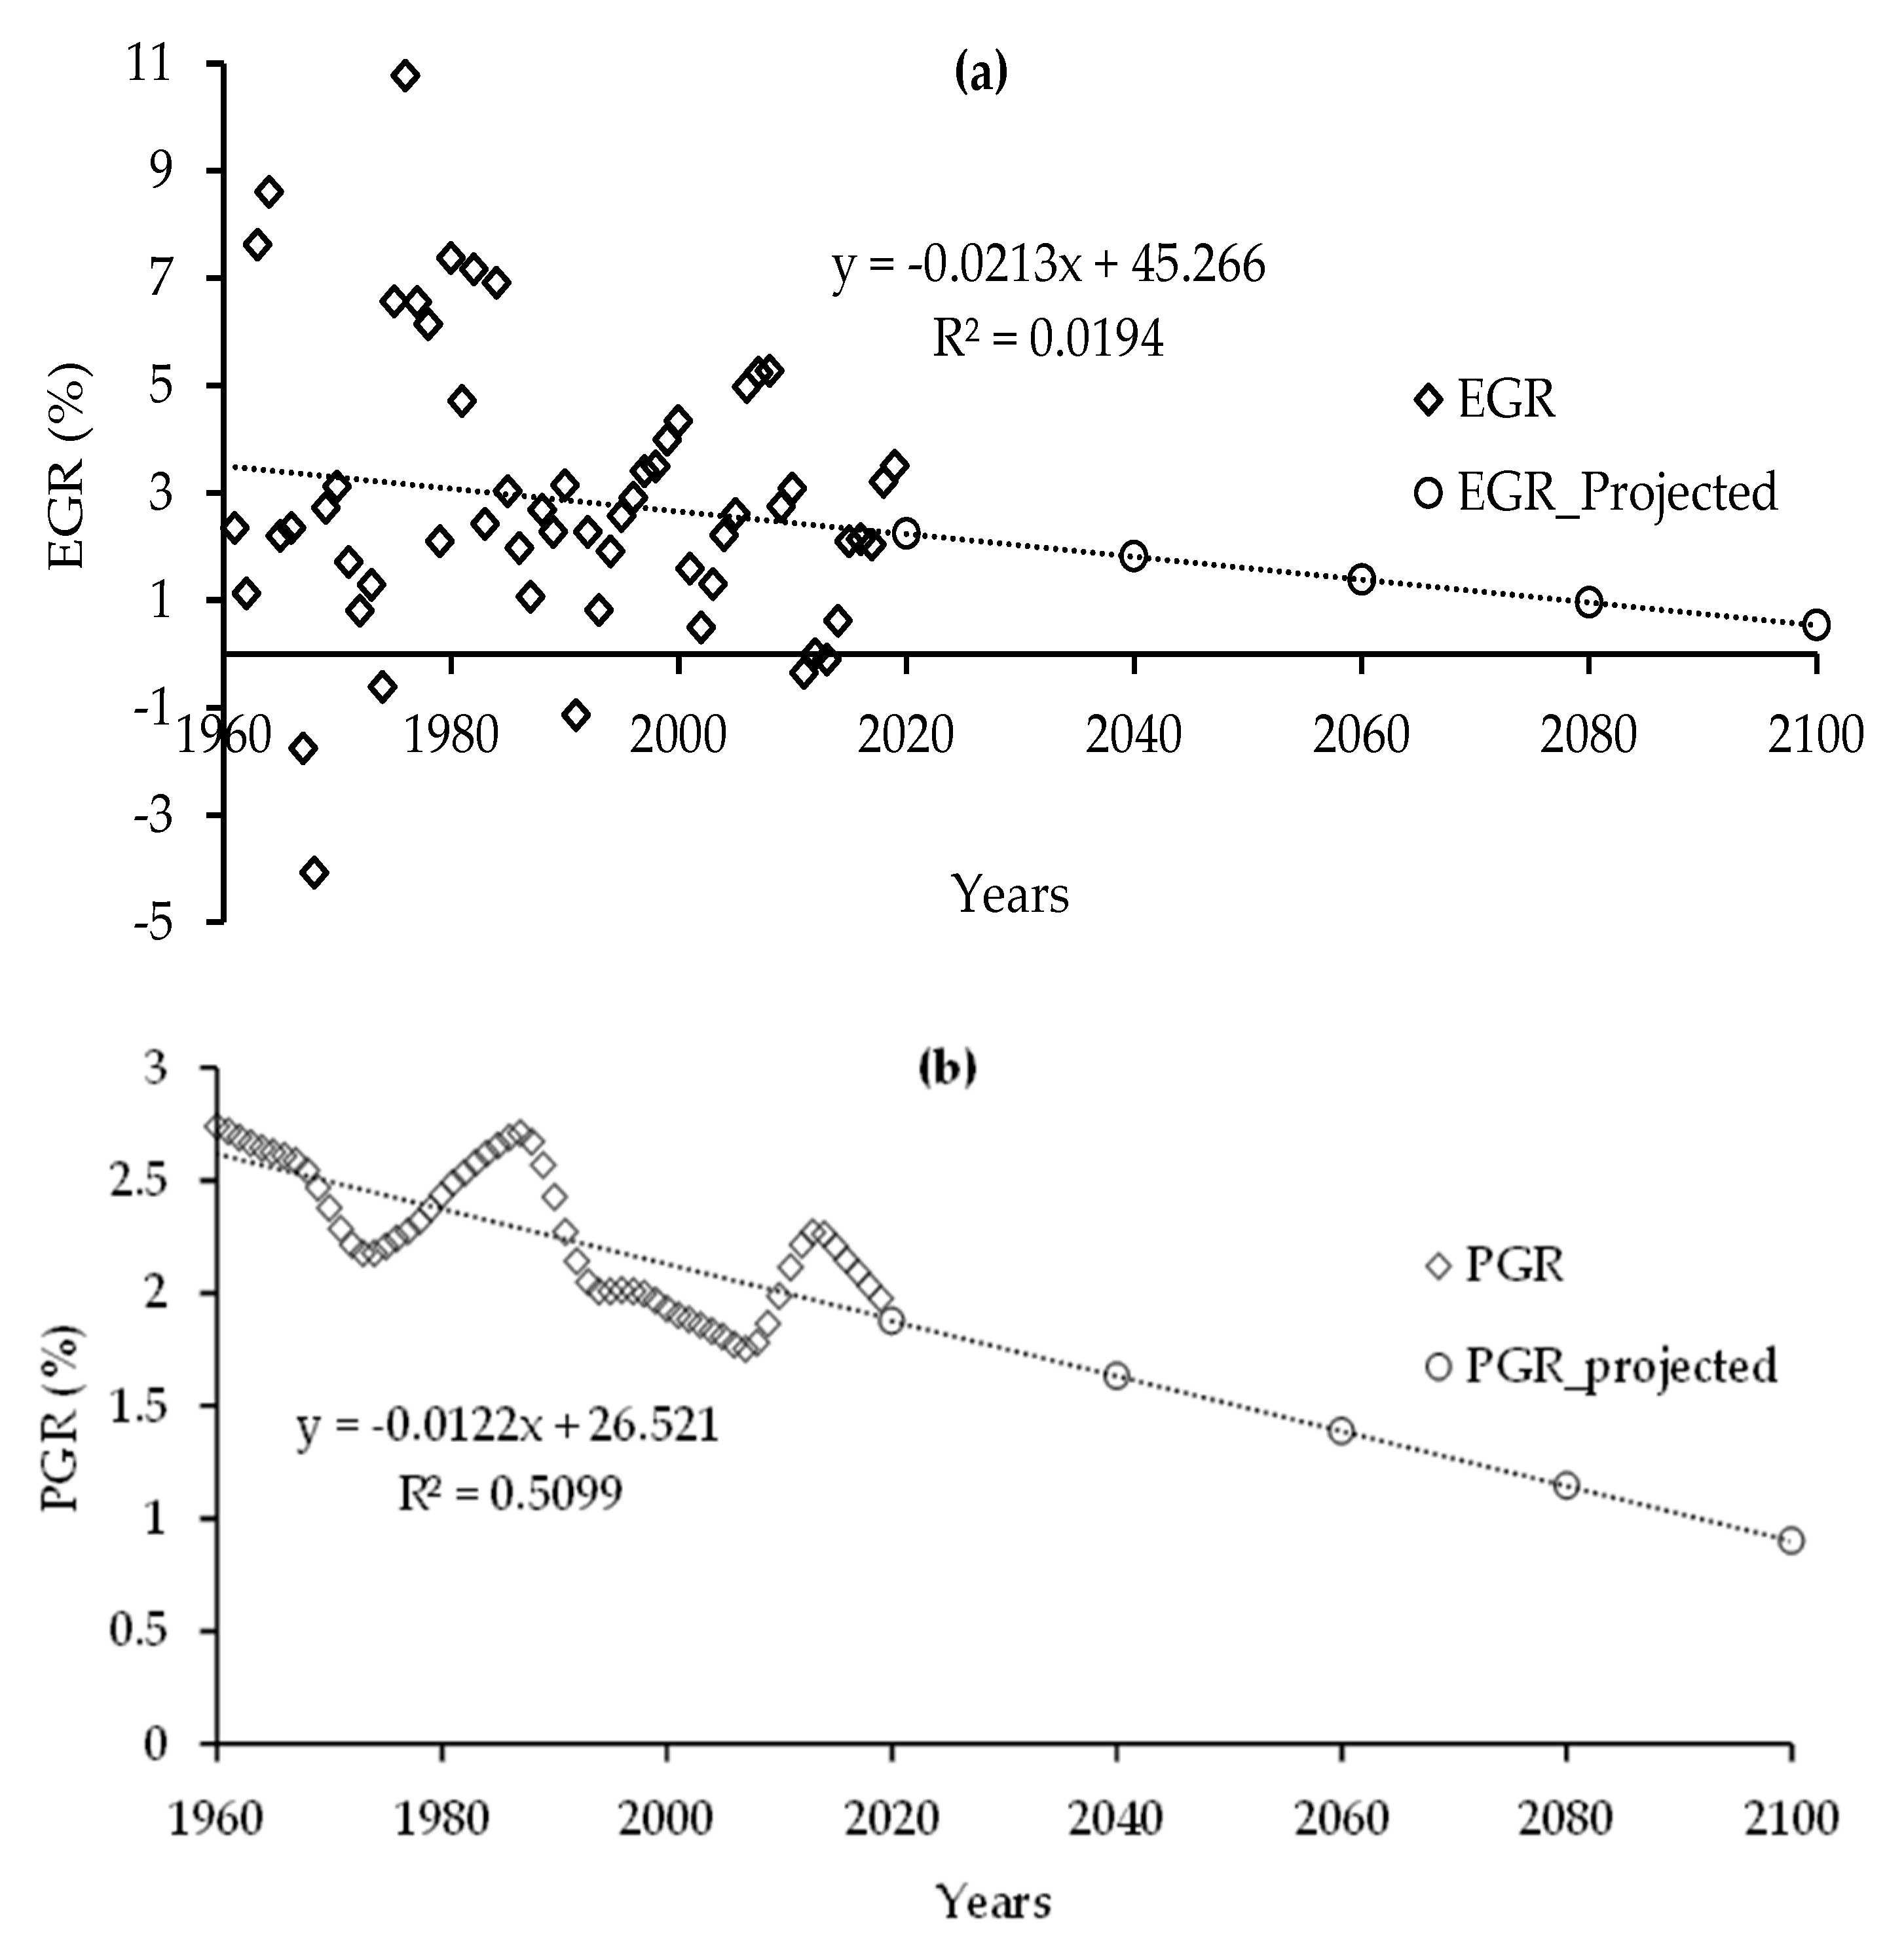
In this study, cumulative risks (i.e., ETTs in the presence of SLR) are calculated till 2100. The number of people affected and monetary loss experienced due to inundation caused by ETTs are used as consequences of social and economic risks, respectively. In order to realistically estimate changes in the population and monetary values at the selected case study sites, annual gross domestic product (GDP) growth rate, which is used as the indicator of annual economic growth rate (EGR), and annual population growth rate (PGR) values are compiled from World Bank, [40,41] and projections for future years for Egypt and Turkey are obtained using regression analysis. Compiled annual EGR and PGR data from World Bank [40,41] and their projections for Egypt and Turkey are shown in Figure 5a,b and Figure 6a,b, respectively. Both EGR and PGR oscillate through the years, however Figure 5 and Figure 6 show that the values are not constant. Thus, although the correlation coefficients are small, fitted regression lines demonstrate the trends in EGR and PGR, and thus they are used in this study.
2.5. Economic Risk Assessment
Economic risk is calculated using economic damage () and its corresponding occurrence probabilities which are calculated through MC simulations. Economic damage () is a function of the inundated area and type of land use, and here, it is estimated using the approach developed by Huizinga et al. [40]. In this study, we estimated cumulative economic risk due to SLR and ETTs for years and . To consider the SLR effect, first the bathymetry of the study area is updated for each future year, then 1000 ETT simulations are reconstructed with the updated bathymetry. For the year and for inundation level , the economic damage () is estimated using the following equation (modified from [24]):
where is the index for the year and , is the index for inundation level and (between 0 and 6 m, 0.25 intervals are used), is the economic damage () for inundation level and for year , is the maximum damage value () for the existing land-use at country level at year and is the inundated area for inundation level and for year , is the depth-damage function obtained from Huizinga et al. [42] that specifies what ratio of the maximum damage occurs for inundation level . It should be noted here that maximum damage values in 2010 prices for residential and agricultural areas of Turkey and Egypt are obtained from Huizinga et al. [42] and are projected to future years using EGRs.
For each year, the 1000 MC database is used to conduct wave propagation for the updated bathymetry to determine the PDFs of inundation levels. Then, Equation (6) is used to calculate the associated economic damage for each inundation level. These are used to construct exceedance probability-economic damage curves for each of the future simulation year, . Finally, economic risk at year is calculated by integrating the area under exceedance probability–economic damage curve of that year (modified from [43]):
where is the probability of the interval between two exceedance probabilities and for year , is the mean of the projected economic damages corresponding to these two exceedance probabilities for year , .
2.6. Social Risk Assessment
A similar approach with that of the economic risk assessment is used to calculate social damage for each future year. Although very complex methodologies have been proposed in the literature to evaluate ETT risks [44] a simpler approach to estimate social risk is implemented here. In this study, injuries due to inundation are taken as the consequence of the social risk. The minimum inundation level which will cause injuries is taken as 0.5 (m) in this study based on a literature review [45,46,47]. In calculating the social risk, we assumed that population is uniformly distributed throughout the inundated area. The total number of people located within the area where wave height reaches 0.5 m or higher is taken as the consequence of the social risk.
Social damage for year t and inundation level , is calculated as follows:
where is the projected number of people for year found in the inundated areas corresponding to the inundation level , is the vulnerability coefficient. The projected total number of people () found in the inundated areas of selected regions for inundation level is calculated using the projected PGR, population density of the country, and the inundated area as follows:
where is the population growth rate of the country where the selected region is located for year , is the population density of the selected region at 2018 obtained from CIA [48] and is the inundated area for inundation level and year .
In order to estimate the social risk, vulnerability of people is also taken into consideration. Commonly used vulnerability indicators, i.e., gross domestic product (GDP) per capita (in $), literacy rate, and age class, are compiled from various sources [40,48,49] and used in this study. In addition to these three vulnerability indicators, tsunami awareness, is identified as an important vulnerability factor in the literature. Thus, is also included into the social risk calculations as one of the vulnerability indicator [24,31]. The vulnerability coefficient, is calculated by taking the inverse of the average of normalized vulnerability indicators (with 2018 values) given in Table 2. The details of the calculations can be found in [24,31].
The social risk is calculated for year by integrating the area under the exceedance probability versus number of injured people curve of that year:
where is the inundation level, is the social risk for year t, is the probability of the interval between two exceedance probabilities and for year , and is the mean social damage corresponding to these two exceedance probabilities for year . For inundation levels at the coast below 0.5 m, social risk assumed to be 0.
3. Results and Discussions
In this study, potential economic and social risks due to ETTs are progressively analyzed over the century with and without considering the climate change induced SLR for Fethiye City Center and the Cairo Agricultural Area. Future economic and social risks presented in this section demonstrate changes in the consequences (i.e., number of people that will be affected and monetary loss that will occur at the selected region for social and economic consequences, respectively) due to ETTs in the presence of SLR together with the projected changes in EGR and PGR. We believe that although local dynamics are ignored (for example country level PGR and EGR values are used) due to very large temporal and spatial domains considered in this study, relative changes in social and economic ETT risks in the presence of SLR are reasonably predicted.
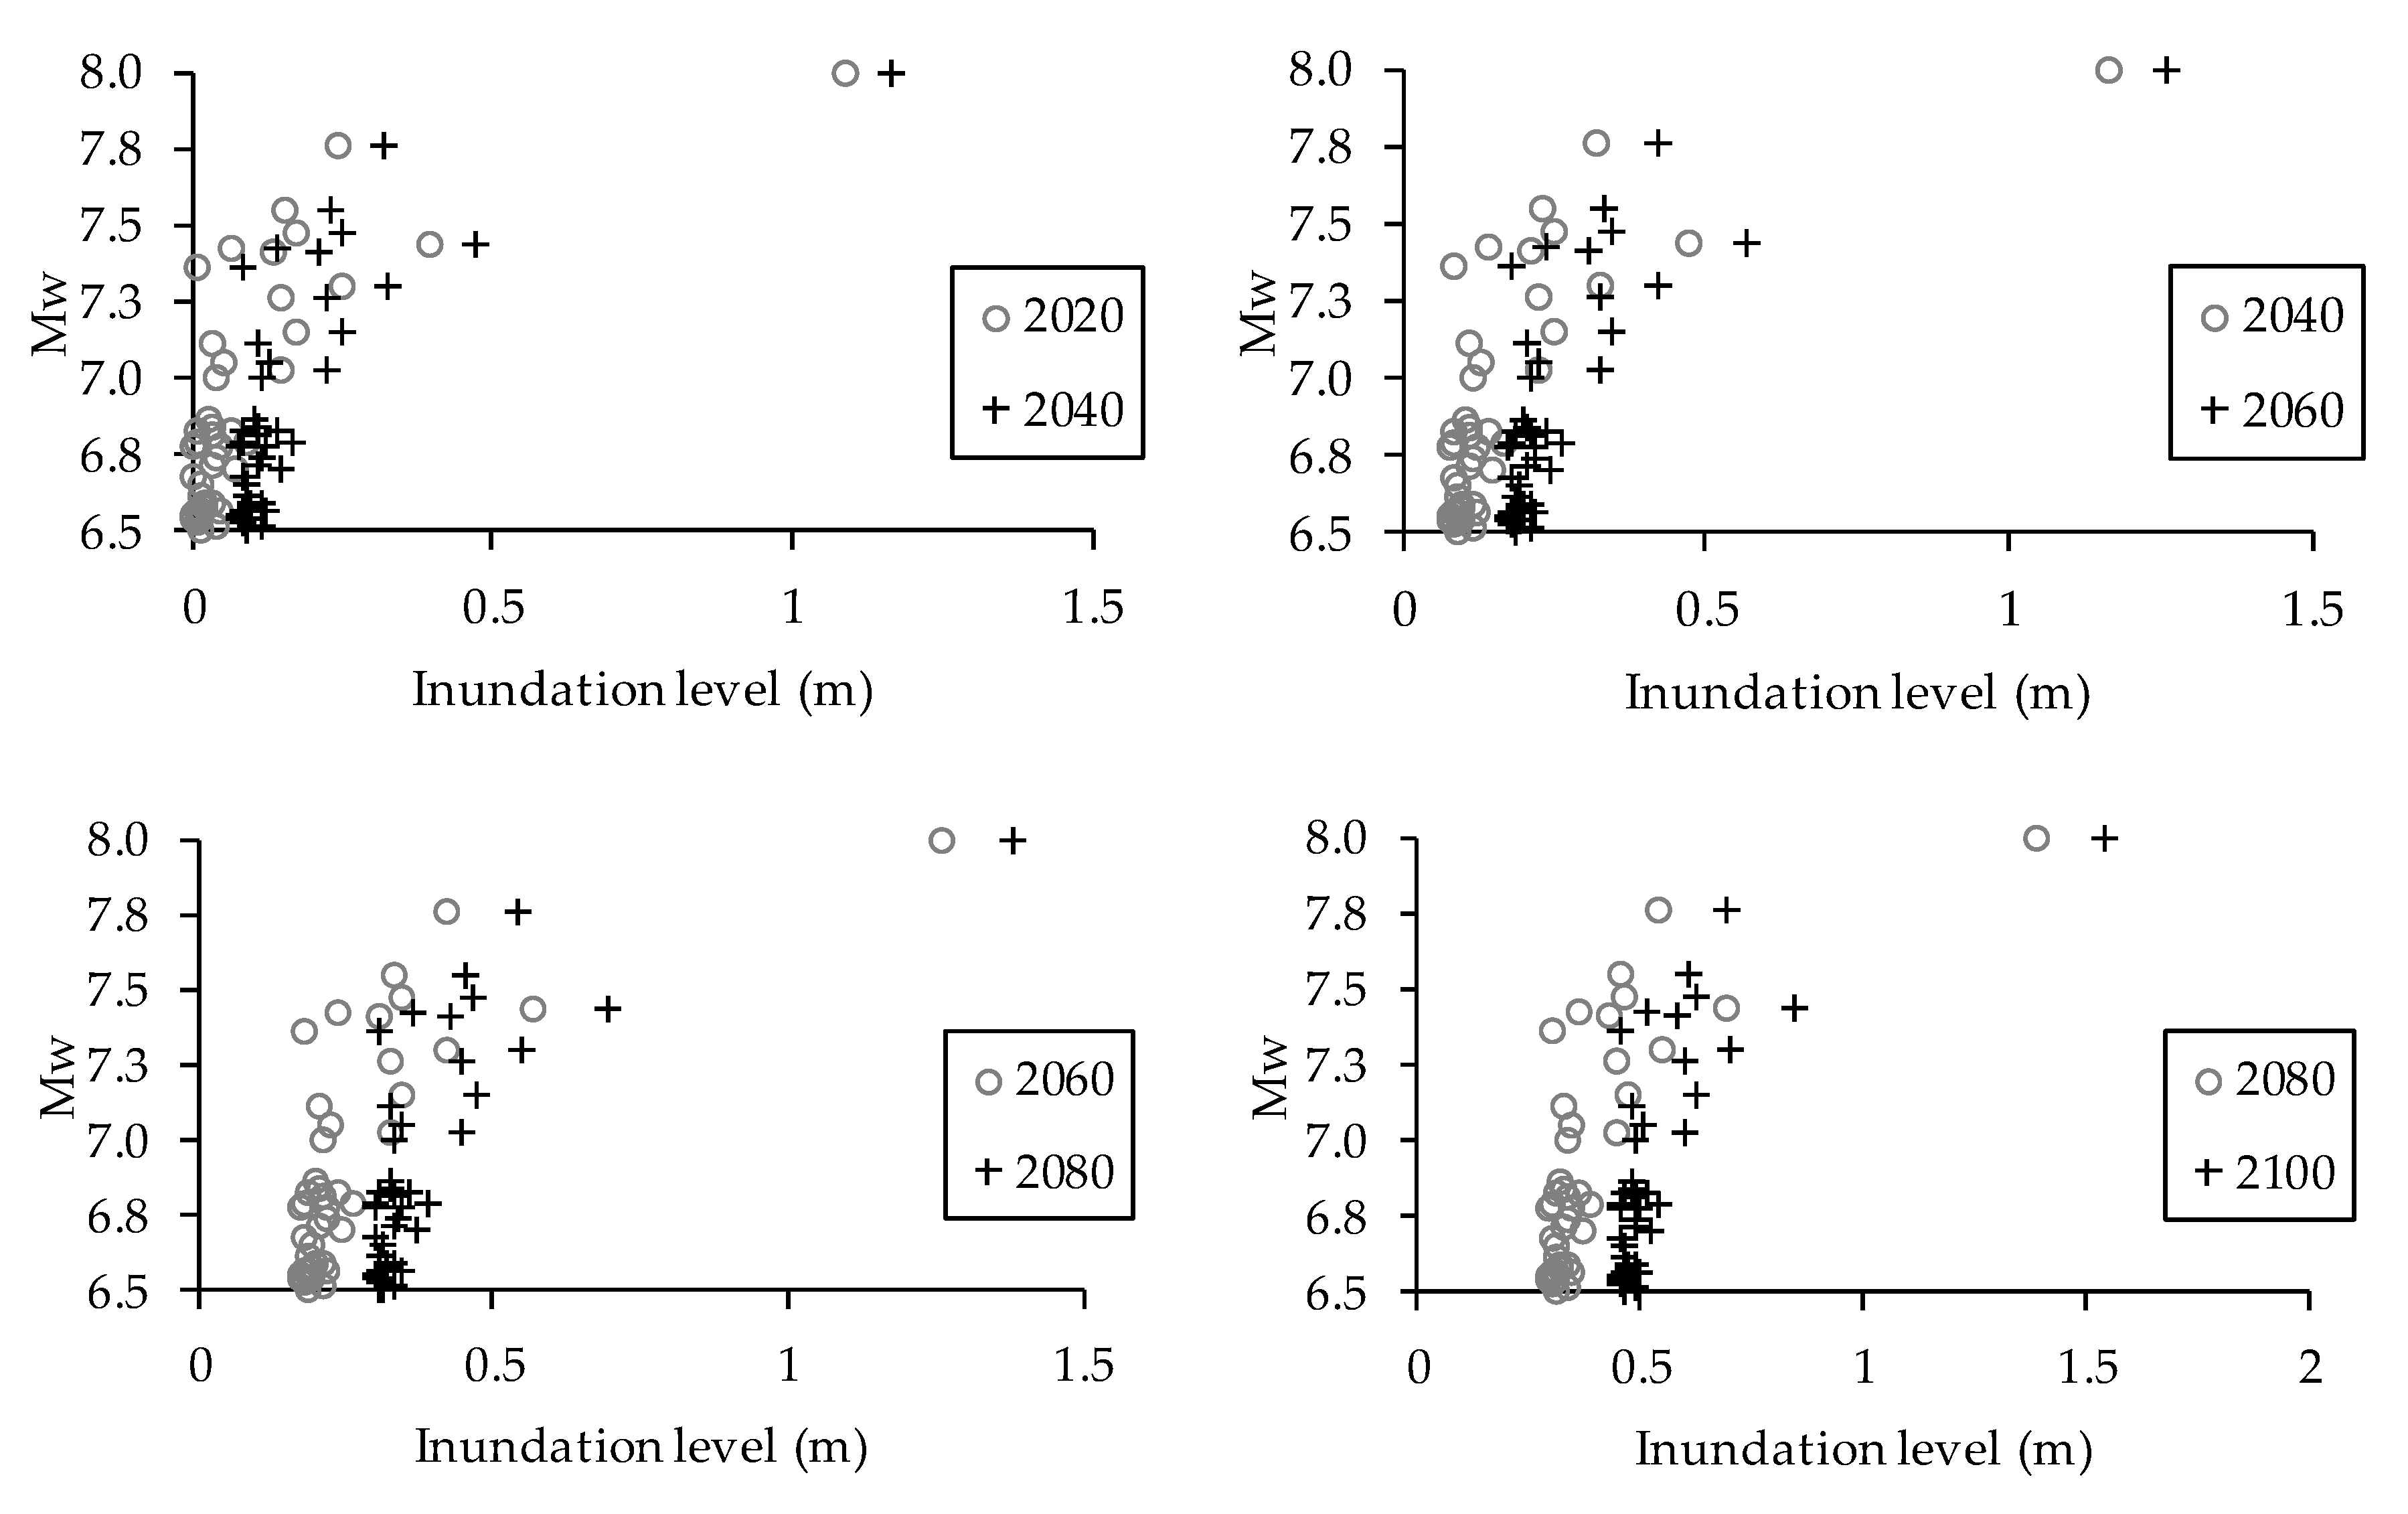
Comparison of inundation levels generated through MC simulations as a function of for Fethiye City Center and the Cairo Agricultural area with the previous time period are given in Figure 7 and Figure 8, respectively. Since the inundation levels obtained from earthquakes with are negligibly small, they are not shown in Figure 7 and Figure 8. It can be observed from the simulation results that inundation levels increase due to SLR both at Fethiye and Cairo.
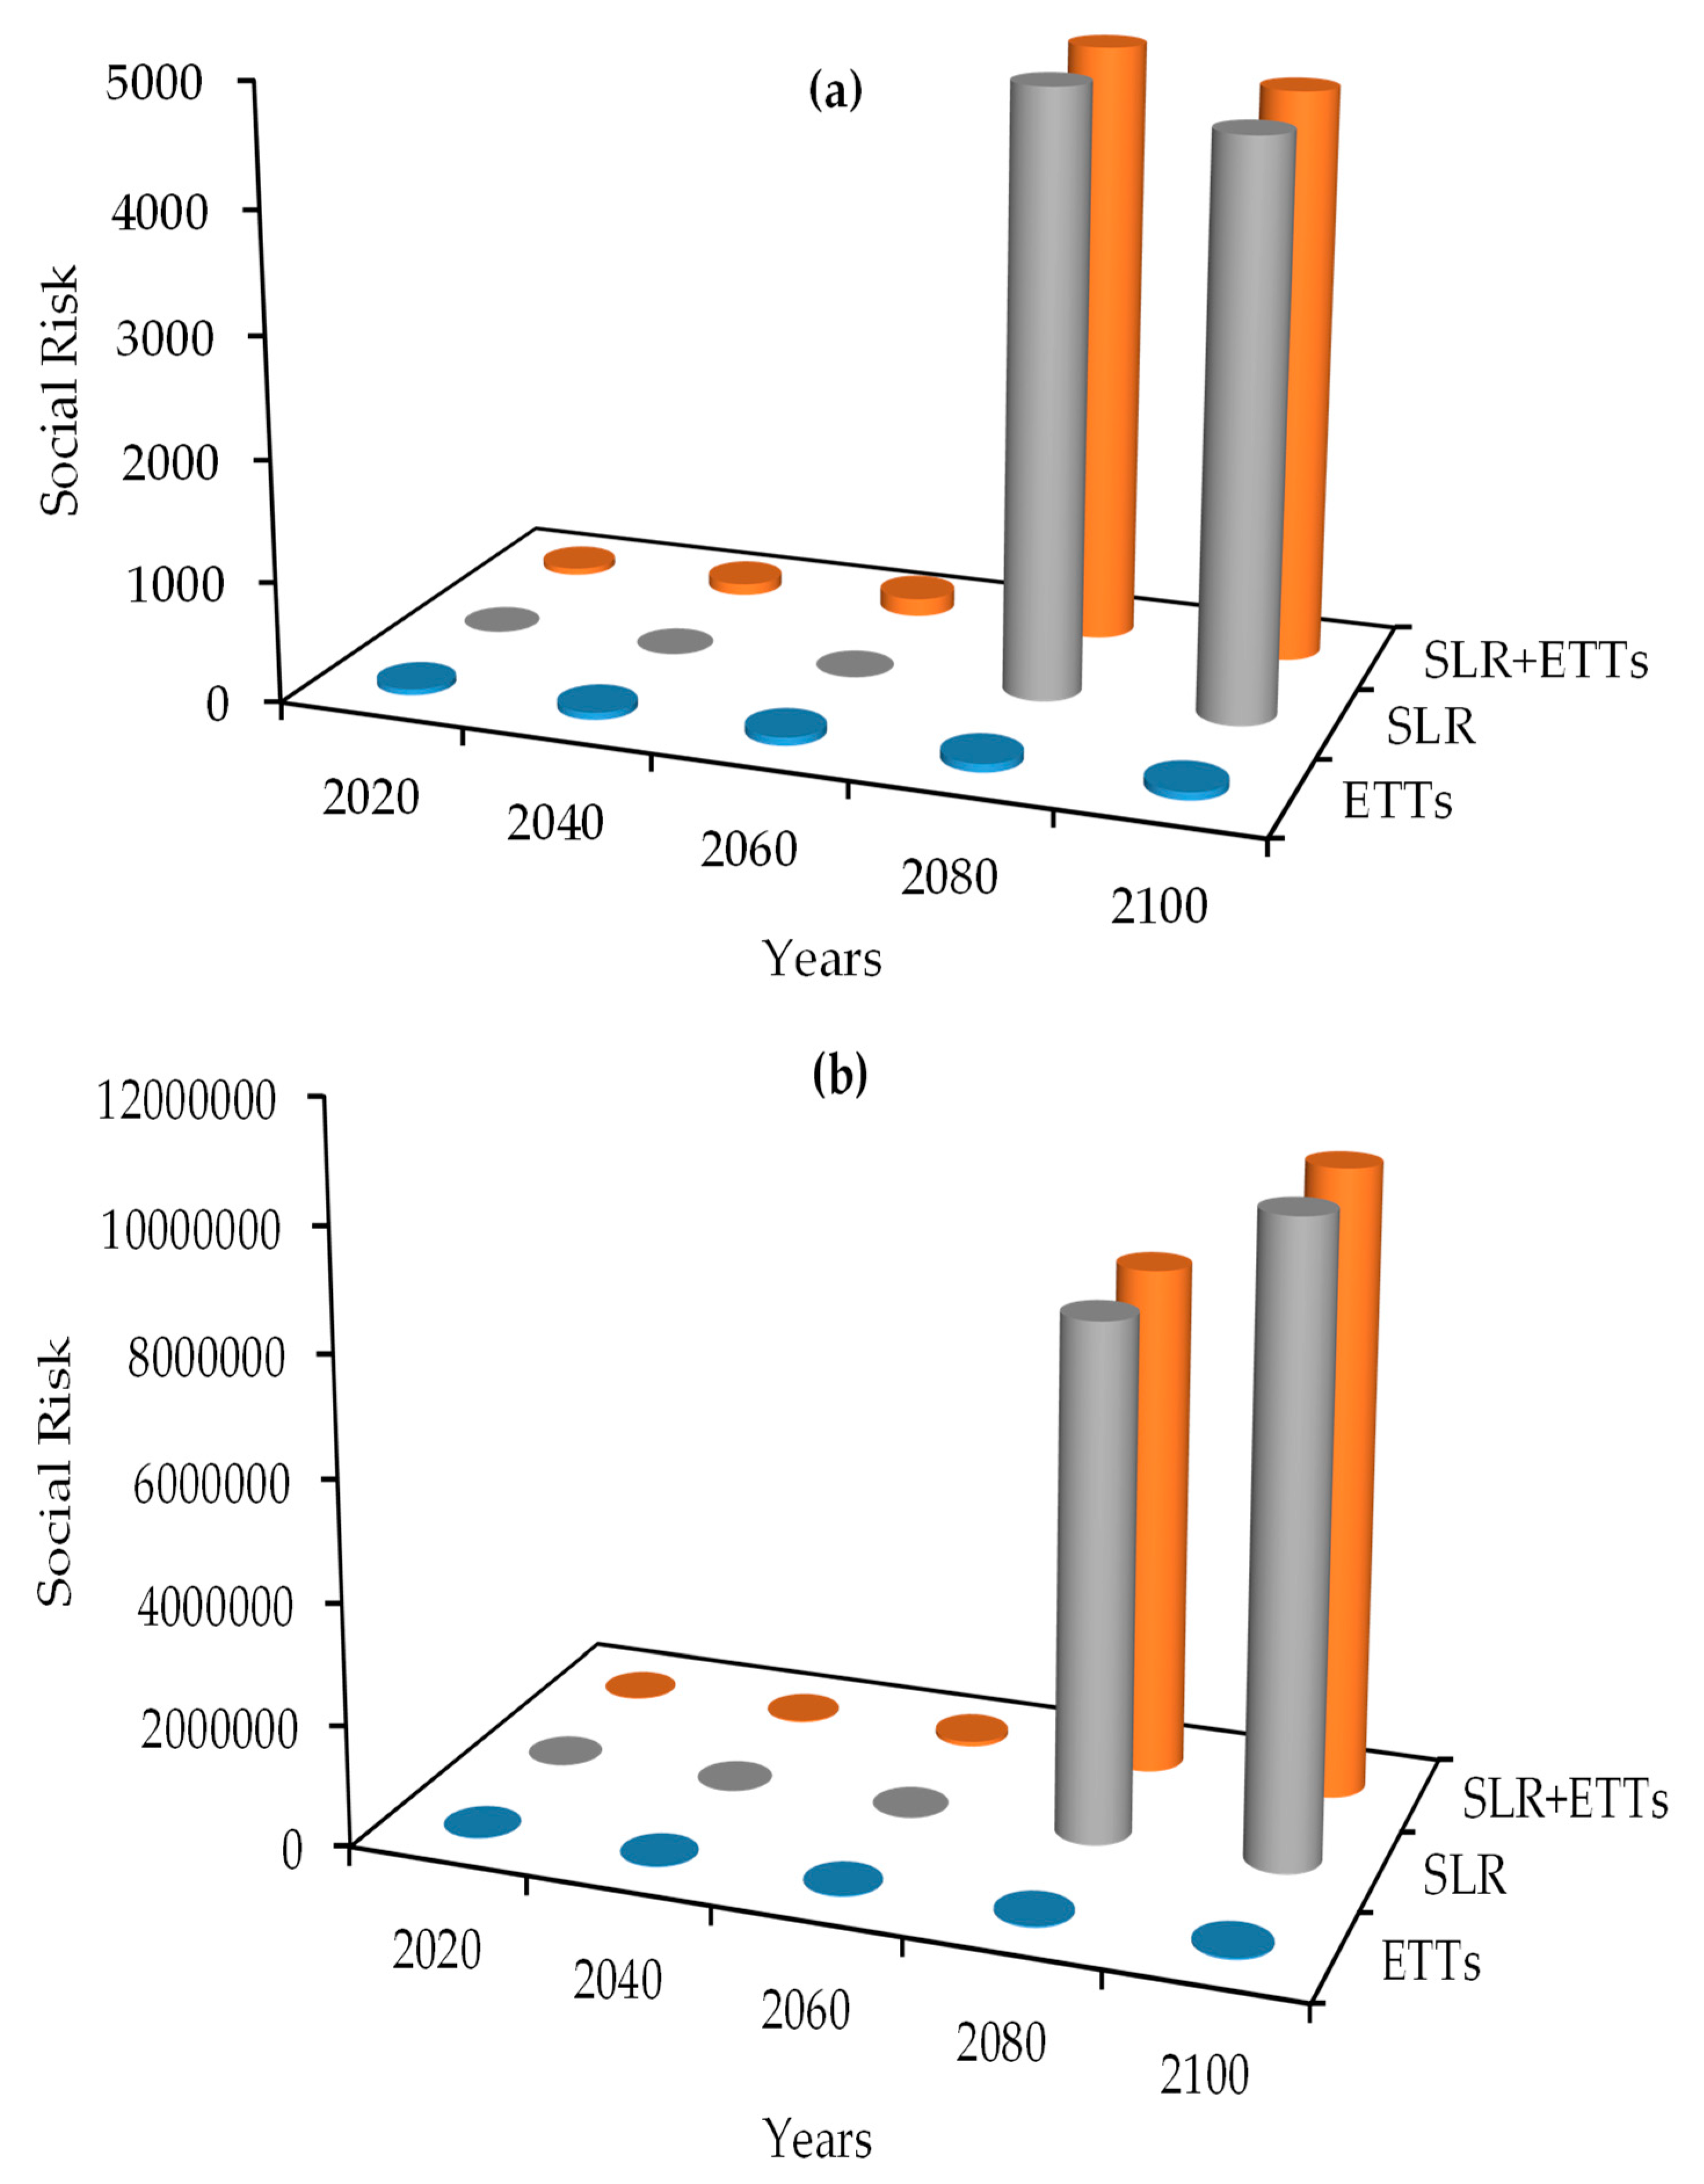
TRA for ETTs, SLR, and ETTs+SLR are performed and the results for Fethiye City Center and the Cairo Agricultural Area are shown in Figure 9 and Figure 10, respectively. In Figure 9a,b, changes in economic risk only for ETTs, demonstrated by blue cylinders, represent the impact of EGR on economic risk. Similarly, in Figure 10a,b, change in social risk only for ETTs – demonstrated by blue cylinders – represent the impact of PGR on social risk. Economic risks increase for all future years for both selected regions as shown in Figure 9a,b, respectively. Predicted change in sea level which reaches half a meter by 2100 (Table 1) has significantly affected economic risk level for both Fethiye City Center and the Cairo Agricultural Area. It should be emphasized that economic risks due to SLR demonstrate the effect of increased inundations at Fethiye and Cairo together with increased maximum damage values estimated using EGRs. Consideration of ETTs and SLR events together leads to a high level of economic risks for both regions and, as can be seen in Figure 9a,b, the increase in economic risk is mainly due to SLR at both regions, although ETTs effects also increase this risk further.
Social risks due to ETTs and SLR increase for all future years for Fethiye City Center and the Cairo Agricultural Area are shown in Figure 10a,b, respectively. A minor oscillation in social risk for Fethiye City Center can be observed due to a decrease in the projected PGR for 2080 and 2100, as shown in Figure 10a.
A comparison of economic risks at Fethiye due to SLR and ETTs+SLR is given in Table 3 and Table 4, respectively. For Fethiye, the social risks due to SLR and ETTs+SLR are given in Table 5 and Table 6, respectively.
From the results given in Table 3, Table 4, Table 5 and Table 6 the following observations can be made. Since 2020 is chosen as the base year, ER in 2020 is zero when only SLR is considered and in 2040, ER increases to 30.16 (i.e., almost 3000% increase) (Table 3). ER due to SLR doubles from 2040 to 2060; then increases tenfold until 2100 (first column of Table 3). Although numerically smaller ERs occur due to ETTs, the trend is very similar; ER doubles from 2040 to 2060 and increases tenfold until 2100 (first column of Table 4). Consequently, ER due to SLR+ETTs follows the same behavior while the risk is mainly governed by the SLR effect. Impact of SLR on ER for each investigated future year at Fethiye is given in the last column of Table 4. For example, in 2040, ER due to ETTs is 4.38 while it is 32.55 due to SLR+ETTs, which corresponds to an increase of over 600%. This value reaches over 1600% in 2100. To realistically evaluate ERs due to ETTs and devise necessary mitigation measures at Fethiye, the effect of SLR has to be taken into consideration.
When only SLR is considered, until 2080, the inundation level at Fethiye does not reach 50 cm (minimum water level which is assumed to cause injury); thus SR is zero (1st column of Table 5). In 2080 and 2100, inundation level exceeds 50 cm causing SR. But as can be seen from Figure 6b PGR has a negative slope and around 2080, the population is predicted to start decreasing. Thus, the SR due to SLR decreases slightly from 2080 to 2100 due to the decrease in the population. Trend of PGR causes SR at Fethiye due to ETTs to increase slightly until 2080 and decreases in the last 20 years (first and fourth columns of Table 6). When SLR is simultaneously considered with ETTs, the SR in each of the investigated future year increases considerably (i.e., 13.86–7075.04% as given in the last column of Table 6). Relative to risk levels in year 2020 the bi-decadal increase in SR at Fethiye is in the range 22.46–41.95% with ETTs only and with SLR the range is 72.72–8360.87% which again shows that the SLR is adversely affecting the SR in the region.
The economic and social risks due to SLR and ETTs+SLR for Cairo are given in Table 7 and Table 8; and Table 9 and Table 10, respectively. Comparison of Table 3 and Table 7 show that ERs due to SLR at Fethiye and Cairo show similar behavior. By 2100, ER due to SLR at Fethiye reaches around 700 while at Cairo it a little higher, reaching 900. The situation is reversed for ER due to ETTs. While ER due to ETTs reach around 25 at Cairo, it exceeds 40 at Fethiye (first columns of Table 4 and Table 8). Since ER is governed by the SLR effects, comparison of ERs due to ETTs in the presence of SLR (ETTs+SLR) show similar behavior and combined ER for Fethiye and Cairo will become around 700 and 900, respectively (second columns of Table 4 and Table 8). On the other hand, SR due to both SLR and ETTs at Cairo are much higher than those observed at Fethiye. By 2100, SR due to SLR is around 4700 at Fethiye while it reaches over ten million. Similar to ER, since SR is governed by SLR, combined social risks (ETTs+SLR) are similar to those obtained for SLR.
From the results given in Table 7, Table 8, Table 9 and Table 10 the following observations can be made. The change in ER due to SLR at Cairo is in the range 0.00–85,669.62% (last column of Table 7). This is a flat land and the risk level is mainly a function of SLR and flat topography. ER due to SLR increases less than 40% from 2040 to 2060, then increases six-fold until 2100 (first column of Table 7). Numerically smaller ERs occur due to ETTs and although the trend is very similar from 2040 to 2060, the increase until 2100 is less than twofold (first column of Table 8). Since numerical values of ERs due to SLR are much larger than those due to ETTs, ER due to SLR+ETTs is mainly governed by the SLR effect at Cairo and ETT effects are minor. Relative to risk levels in year 2020, the bi-decadal economic risk for ETTs only, at Cairo is in the range 49.07–198.45% and with SLR risk level fluctuates in the range 1219.04–10,528.60% (6th and 7th columns of Table 8, respectively). This again indicates that SLR effects on ER are larger than those of ETT effects. The other reason for minor ETT effects is the distance between the main earthquake zone and the Cairo Agricultural Center region. This distance was very small for the Fethiye region, which amplified the ETTs effects of risk. The bi-decadal ER for SLR+ETTs at Cairo fluctuates in the range of 18.57–1219.04% while for only ETTs the range is 15.85–49.07%. Topography of the site is the influencing factor at Cairo and inundated agricultural land increases significantly due to SLR.
Similar to Fethiye, for Cairo, the inundation level does not exceed 50 cm until 2080 causing no SR due to only SLR (1st column of Table 9). In 2080 and 2100, inundation level exceeds 50 cm causing SR. As shown in Figure 7b, although the PGR has a negative slope for Cairo, the population will keep on increasing till 2100 and the SR due to SLR increases as well. Again due to the PGR trend, the SR due to ETTs increases with decreasing rates (2nd and 4th columns of Table 10). Relative to risk levels in year 2020, the increase in bi-decadal SR with SLR+ETTs at Cairo is extremely high (i.e., 90.88–90496.08% as given in the 7th column of Table 10), while it is much lower for only ETTs (i.e., 41.45–199.95% as given in the 6th column of Table 10). When SLR is considered, the SR in each of the investigated future year increases considerably (i.e., 34.95–30,104.16% as given in the last column of Table 10). This outcome supports increased inundation levels due to topography effects.
4. Conclusions
Studies on climate change indicate that SLR will be experienced in the Mediterranean in the future. Thus studying effects of SLR on the consequences of natural hazards such as ETTs is important. In this study, a comprehensive analysis is conducted for the progressive risk evaluation of ETT hazards in the Eastern Mediterranean Sea in the presence of SLR. ETT simulations are conducted with NAMI-DANCE software using updated bathymetries according to predicted SLRs for future years.
Climate change related SLR and potential ETTs are analyzed simultaneously to evaluate coastal risks at Fethiye City Center and the Cairo Agricultural Area. Results show that majority of both economic and social risks occur due to SLR. Thus, for realistic estimations of risks, ETTs have to be evaluated together with SLR.
Results of the simulations show that ER due to ETTs at Fethiye and Cairo are not the same. The Fethiye region, due to its proximity to the major earthquake zone in the Eastern Mediterranean is affected more from ETTs (1676% increase in ER by 2100 relative to 2020) compared to Cairo. The increase in ER due to ETTs by 2100 at Cairo is less than 200% relative to 2020.
The interesting outcome is that as the SLR increases over the years both economic and social risks drastically increase at the Cairo site due to the flat topography of the region and relatively wider regions being inundated over the years. Although the effect of SLR at the Fethiye site is similar, it is not as pronounced.
Social risk level decreases due to SLR and SLR+ETTs for Fethiye City Center due to a decrease in PGR from 2080 to 2100. However, relative to 2020, SR due to SLR+ETTs at Fethiye and Cairo increases almost 90 and 900 fold, respectively. In conclusion, SLR effects extremely influence the economic and social risks at both sites. But this influence does not show the same trend at both sites. Topography of the region, proximity to the earthquake zones, economic growth rates, and population levels are other factors that need to be considered in this analysis, as is done in this study.
Author Contributions
Conceptualization, E.K. and M.M.A.; Methodology, C.Y., E.K., and M.M.A.; Software, C.Y.; Validation, C.Y., E.K., and M.M.A.; Formal Analysis, E.K. and M.M.A.; Investigation, C.Y., E.K., and M.M.A.; Resources, C.Y.; Data Curation, E.K. and M.M.A.; Writing—Original Draft Preparation, C.Y. and E.K.; Writing—Review & Editing, E.K. and M.M.A.; Visualization, C.Y.; Supervision, M.M.A.; Project Administration, E.K. All authors have read and agreed to the published version of the manuscript.
Funding
This research received no external funding.
Conflicts of Interest
The authors declare no conflict of interest.
References
- Fukao, Y. Tsunami earthquakes and subduction processes near deep-sea trenches. J. Geophys. Res. 1979, 84, 2303–2314. [Google Scholar] [CrossRef] [Green Version]
- World Health Organization. The Great East Japan Earthquake: A Story of a Devastating Natural Disaster, a Tale of Human Compassion; WHO Western Pacific Region Publication: Manila, Philippines, 2011; Available online: https://apps.who.int/iris/bitstream/handle/10665/207516/9789290615682_eng.pdf (accessed on 11 September 2018).
- Jelínek, R.; Krausmann, E.; González, M.; Álvarez-Gómez, J.A.; Birkmann, J.; Welle, T. Approaches for tsunami risk assessment and application to the city of Cádiz, Spain. Nat. Hazards 2012, 60, 273–293. [Google Scholar] [CrossRef] [Green Version]
- Schneider, B.; Hoffmann, G.; Reicherter, K. Scenario-based tsunami risk assessment using a static flooding approach and high-resolution digital elevation data: An example from Muscat Oman. Glob. Planet. Chang. 2016, 139, 183–194. [Google Scholar] [CrossRef]
- Nadim, F.; Glade, T. On tsunami risk assessment for the west coast of Thailand. In Proceedings of the ECI Conference on Geohazards, Lillehammer, Norway, 18–21 June 2006; Available online: http://dc.engconfintl.org/geohazards/28/ (accessed on 11 September 2018).
- Gonzalez, F.I.; Geist, E.L.; Jaffe, B.; Kanoglu, U.; Mofjeld, H.; Synolakis, C.E.; Titov, V.V.; Areas, D.; Bellomo, D.; Carlton, D.; et al. Probabilistic tsunami hazard assessment at Seaside Oregon, for near- and far-field seismic sources. J. Geophys. Rev. 2009, 114, C11023. [Google Scholar] [CrossRef] [Green Version]
- Wegsheider, S.; Post, J.; Zosseder, K.; Mück, M.; Strunz, G.; Riedlinger, T.; Muhari, A.; Anwar, H.Z. Generating tsunami risk knowledge at community level as a base for planning and implementation of risk reduction strategies. Nat. Hazards Earth Syst. Sci. 2011, 11, 249–258. [Google Scholar] [CrossRef]
- Eckert, S.; Jelinek, R.; Zeug, G.; Krausmann, E. Remote sensing-based assessment of tsunami vulnerability and risk in Alexandria, Egypt. Appl. Geogr. 2012, 32, 714–723. [Google Scholar] [CrossRef]
- Jaimes, M.A.; Reinso, E.; Ordaz, M.; Huerta, B.; Silva, R.; Mendoza, E.; Rodríguez, J.C. A new approach to probabilistic earthquake-induced tsunami risk assessment. Ocean Coast. Manag. 2016, 119, 68–75. [Google Scholar] [CrossRef]
- Okumura, N.; Jonkman, S.N.; Esteban, M.; Hofland, B.; Shibayama, T. A method for tsunami risk assessment: A case study for Kamakura, Japan. Nat. Hazards 2017, 88, 1451–1472. [Google Scholar] [CrossRef] [Green Version]
- Meehl, G.A.; Washington, W.M.; Collins, W.D.; Arblaster, J.M.; Hu, A.; Buja, L.E.; Strand, W.G.; Teng, H. How much more global warming and sea level rise? Science 2005, 307, 1769–1772. [Google Scholar] [CrossRef] [Green Version]
- Nicholls, R.J.; Cazenave, A. Sea-level rise and its impacts on coastal zones. Science 2010, 328, 1517–1520. [Google Scholar] [CrossRef]
- Galbraith, H.; Jones, R.; Park, R.; Clough, J.; Herrod-Julius, S.; Harrington, B.; Page, G. Global climate change and sea level rise: Potential losses of intertidal habitat for shorebirds. Waterbirds 2002, 25, 173–183. [Google Scholar] [CrossRef]
- Hinkel, J.; Lincke, D.; Vafeidis, A.T.; Perrette, M.; Nicholls, R.J.; Tol, R.S.J.; Marzeion, B.; Fettweis, X.; Ionescu, C.; Levermann, A. Coastal flood damage and adaptation costs under 21st century sea-level rise. Proc. Natl. Acad. Sci. USA 2014, 111, 3292–3297. [Google Scholar] [CrossRef] [PubMed] [Green Version]
- Nicholls, R.J.; Hoozemans, F.M.J.; Marchand, M. Increasing flood risk and wetland loss due to global sea-level rise: Regional and global analysis. Glob. Environ. Chang. 1999, 9, S69–S87. [Google Scholar] [CrossRef]
- Purvis, M.J.; Bates, P.D.; Hayes, C.M. A probabilistic methodology to estimate future coastal flood risk due to sea level rise. Coast. Eng. 2008, 55, 1062–1073. [Google Scholar] [CrossRef]
- Hauer, M.R.; Evans, J.M.; Mishra, D.R. Millions projected to be at risk from sea-level rise in the continental United States. Nat. Clim. Chang. 2016. [Google Scholar] [CrossRef]
- Aral, M.; Guan, J. Global sea surface temperature and sea level rise estimation with optimal historical time lag data. Water 2016, 8, 519. [Google Scholar] [CrossRef] [Green Version]
- Chang, B.; Guan, J.; Aral, M.M. Modeling spatial variations of sea level rise and corresponding inundation impacts: A case study for Florida, USA. Water Qual. Expo. Health 2014, 6, 39–51. [Google Scholar] [CrossRef]
- Chang, B.; Guan, J.; Aral, M.M. Scientific discourse: Climate change and sea-level rise. J. Hydrol. Eng. 2014, 20, A4014003. [Google Scholar] [CrossRef]
- Guan, J.; Chang, B.; Aral, M.M. A dynamic control system model for global temperature change and sea level rise in response to CO2 emissions. Clim. Res. 2013, 58, 55–66. [Google Scholar] [CrossRef]
- Douglas, B.C. Global sea level rise. J. Geophys. Res. Ocean. 1991, 96, 6981–6992. [Google Scholar] [CrossRef] [Green Version]
- Church, J.A.; White, N.J. Sea-level rise from the late 19th to the early 21st century. Surv. Geophys. 2011, 32, 585–602. [Google Scholar] [CrossRef] [Green Version]
- Yavuz, C.; Kentel, E.; Aral, M.M. Tsunami Risk Assessment: Economic, Environmental and Social Dimensions. Nat. Hazards 2020. [Google Scholar] [CrossRef]
- Church, J.A.; White, N.J. A 20th century acceleration in global sea-level rise. Geophys. Res. Lett. 2006, 33. [Google Scholar] [CrossRef]
- Aral, M.M.; Chang, B. Spatial variation of sea level rise at Atlantic and Mediterranean Coastline of Europe. Water 2017, 9, 522. [Google Scholar] [CrossRef] [Green Version]
- Dall’Osso, F.; Dominey-Howes, D.; Moore, C.; Summerhayes, S.; Withycombe, G. The exposure of Sydney (Australia) to earthquake-generated tsunamis, storms and sea level rise: A probabilistic multi-hazard approach. Sci. Rep. 2014, 4, 7401. [Google Scholar] [CrossRef] [Green Version]
- Li, L.; Switzer, A.D.; Wang, Y.; Chan, C.H.; Qiu, Q.; Weiss, R. A modest 0.5-m rise in sea level will double the tsunami hazard in Macau. Sci. Adv. 2018, 4, eaat1180. [Google Scholar] [CrossRef] [Green Version]
- Nagai, R.; Takabatake, T.; Esteban, M.; Ishii, H.; Shibayama, T. Tsunami risk hazard in Tokyo Bay: The challenge of future sea level rise. Int. J. Disaster Risk Reduct. 2020, 45, 101321. [Google Scholar] [CrossRef]
- Yalciner, A.C.; Pelinovsky, E.; Zaytsev, A.; Kurkin, A.; Ozer, C.; Karakus, H. Nami Dance Manual; Ocean Engineering Research Center, Civil Engineering Department, Middle East Technical University: Ankara, Turkey, 2006. [Google Scholar]
- Yavuz, C. Tsunami Risk Assessment and Positioning of a Tsunami Early Warning System. Ph.D. Thesis, Middle East Technical University, Ankara, Turkey, September 2018. Available online: https://tez.yok.gov.tr/UlusalTezMerkezi/tezSorguSonucYeni.jsp (accessed on 20 September 2020).
- TRANSFER Project. Available online: https://cordis.europa.eu/project/rcn/81399_en.html (accessed on 15 June 2016).
- Yavuz, C.; Kentel, E. Probabilistic Tsunami Risk Assessment using Monte Carlo Simulations. In Proceedings of the 13th International Congress on Advances in Civil Engineering, Izmir, Turkey, 12–14 September 2018. [Google Scholar]
- Hanks, T.C.; Kanamori, H. A moment-magnitude scale. J. Geophys. Res. Solid Earth 1979, 84, 2348–2350. [Google Scholar] [CrossRef]
- Wells, D.L.; Coppersmith, K.J. New empirical relationships among magnitude, rupture length, rupture width, rupture area, and surface displacement. Bull. Seismol. Soc. Am. 1994, 84, 974–1002. [Google Scholar]
- Weatherall, P.; Marks, K.M.; Jakobsson, M.; Schmitt, T.; Tani, S.; Arndt, J.E.; Wigley, R. A new digital bathymetric model of the world’s oceans. Earth Space Sci. 2015, 2, 331–345. [Google Scholar] [CrossRef]
- Synolakis, C.E. Green’s law and the evolution of solitary waves. Phys. Fluids A Fluid Dyn. 1991, 3, 490–491. [Google Scholar] [CrossRef]
- Løvholt, F.; Glimsdal, S.; Harbitz, C.B.; Zamora, N.; Nadim, F.; Peduzzi, P.; Smebye, H. Tsunami hazard and exposure on the global scale. Earth Sci. Rev. 2012, 110, 58–73. [Google Scholar] [CrossRef]
- Løvholt, F.; Glimsdal, S.; Harbitz, C.B.; Horspool, N.; Smebye, H.; De Bono, A.; Nadim, F. Global tsunami hazard and exposure due to large co-seismic slip. Int. J. Disaster Risk Reduct. 2014, 10, 406–418. [Google Scholar] [CrossRef]
- GDP Per Capita. Available online: https://data.worldbank.org/indicator/NY.GDP.PCAP.CD (accessed on 10 January 2018).
- Population Growth. Available online: https://data.worldbank.org/indicator/sp.pop.grow (accessed on 10 January 2019).
- Huizinga, J.; de Moel, H.; Szewczyk, W. Global Flood Depth-Damage Functions: Methodology and the Database with Guidelines; EUR 28552 EN; Publications Office of the European Union: Luxembourg, 2017; Available online: https://ideas.repec.org/p/ipt/iptwpa/jrc105688.html (accessed on 12 October 2017).
- Deutscher Verband für Wasserwirtschaft und Kulturbau. DVWK (Deutscher Verband für Wasserwirtschaft und Kulturbau) Okonomische Methoden von Hochwasserschutzwirkungen. In Arbeitsmaterialien zum Methodischen Vorgehen; DVWK-Mitteilungen: Bonn, Deutschland, 1985. [Google Scholar]
- Barros, J.L.; Tavares, A.O.; Santos, A.; Fonte, A. Territorial vulnerability assessment supporting risk managing coastal areas due to tsunami impact. Water 2015, 7, 4971–4998. [Google Scholar] [CrossRef] [Green Version]
- Abt, S.R.; Wittler, R.J.; Taylor, A. Predicting human instability in flood flows. In Hydraulic Engineering; American Society of Civil Engineers: New York, NY, USA, 1989; pp. 70–76. [Google Scholar]
- Endoh, K.; Takahashi, S. Numerically modeling personnel danger on a promenade breakwater due to overtopping waves. In Coastal Engineering; American Society of Civil Engineers: New York, NY, USA, 1994; pp. 1016–1029. [Google Scholar]
- Jonkman, S.N.; Penning-Rowsell, E. Human instability in flood flows. JAWRA J. Am. Water Resour. Assoc. 2008, 44, 1208–1218. [Google Scholar] [CrossRef]
- The World Fact Book. Available online: https://www.cia.gov/library/publications/the-world-factbook/geos/ly.html (accessed on 10 January 2018).
- Temel İstatistikler. Available online: http://www.tuik.gov.tr/UstMenu.do?metod=temelist (accessed on 10 January 2018).
Figure 1.
Considered areas for Fethiye City Center, Turkey and Cairo Agricultural Area, Egypt.

Figure 2.
Flowchart of the methodology.

Figure 3.
The rate of change of sea level and sea surface temperature projections in the Mediterranean Sea [26].
Figure 3.
The rate of change of sea level and sea surface temperature projections in the Mediterranean Sea [26].

Figure 4.
Flowchart for the application procedure of MC simulations [24].
Figure 4.
Flowchart for the application procedure of MC simulations [24].


Figure 7.
Comparison of the calculated inundation levels with the previous time period for Fethiye City Center, Turkey.
Figure 7.
Comparison of the calculated inundation levels with the previous time period for Fethiye City Center, Turkey.

Figure 8.
Comparison of the calculated inundation levels with the previous time for the Cairo Agricultural Area, Egypt.
Figure 8.
Comparison of the calculated inundation levels with the previous time for the Cairo Agricultural Area, Egypt.

Figure 9.
Projected economic risk values for (a) Fethiye City Center, Turkey and (b) the Cairo Agricultural Area, Egypt.
Figure 9.
Projected economic risk values for (a) Fethiye City Center, Turkey and (b) the Cairo Agricultural Area, Egypt.

Figure 10.
Projected social risk values for (a) Fethiye City Center, Turkey and (b) the Cairo Agricultural Area, Egypt.
Figure 10.
Projected social risk values for (a) Fethiye City Center, Turkey and (b) the Cairo Agricultural Area, Egypt.


Table 1.
SLRs [26].
Table 1.
SLRs [26].
| Year | SLR (m) |
|---|---|
| 2020 | 0 |
| 2040 | 0.0768 |
| 2060 | 0.1738 |
| 2080 | 0.2965 |
| 2100 | 0.4518 |
| Vulnerability Indicators | |||||
|---|---|---|---|---|---|
| Country | GDP ($) * | Literacy Rate ** | Age Class *** (<65) | N **** | |
| Egypt | 3478 | 0.74 | 0.96 | 1 | 1.91 |
| Turkey | 10,863 | 0.96 | 0.93 | 2 | 1.46 |
Table 3.
Economic Risks (ER) at Fethiye due to Sea Level Rise (SLR).
| Year | ER Due to SLR | Increase in ER (%) | Increase in ER Relative to 2020 (%) |
|---|---|---|---|
| 2020 | 0.00 * | - | - |
| 2040 | 30.16 | 2916.38 | 2916.38 |
| 2060 | 60.43 | 100.34 | 5943.06 |
| 2080 | 311.48 | 415.43 | 31,047.82 |
| 2100 | 688.20 | 120.95 | 68,719.58 |
* Economic risk at 2020 is zero since it is considered as the base year. To be able to calculate percent increases it is taken as 1.0.
Table 4.
Comparison of Economic Risks (ER) at Fethiye due to Earthquake Triggered Tsunami (ETTs) and Sea Level Rise (SLR).
Table 4.
Comparison of Economic Risks (ER) at Fethiye due to Earthquake Triggered Tsunami (ETTs) and Sea Level Rise (SLR).
| Year | ER Due to ETTs | ER Due to SLR+ETTs | Increase in ER Due to ETTs (%) | Increase in ER Due to SLR+ETTs (%) | Increase in ER Due to ETTs Relative to 2020 (%) | Increase in ER Due to SLR+ETTs Relative to 2020 (%) | Change in ER Due to SLR (%) |
|---|---|---|---|---|---|---|---|
| 2020 | 2.30 | 2.30 | - | - | - | - | 0.00 |
| 2040 | 4.38 | 32.55 | 90.74 | 1316.33 | 90.74 | 1316.33 | 642.56 |
| 2060 | 8.78 | 66.01 | 100.34 | 102.82 | 282.13 | 2772.60 | 651.74 |
| 2080 | 18.48 | 320.94 | 110.40 | 386.18 | 704.01 | 13,866.11 | 1637.06 |
| 2100 | 40.82 | 717.51 | 120.95 | 123.57 | 1676.42 | 31,123.43 | 1657.66 |
Table 5.
Social Risks (SR) at Fethiye due to Sea Level Rise (SLR).
| Year | SR Due to SLR | Increase in SR (%) | Increase in SR Relative to 2020 (%) |
|---|---|---|---|
| 2020 | 0.00 * | - | - |
| 2040 | 0.00 * | - | - |
| 2060 | 0.00 * | - | - |
| 2080 | 4947.82 | 0.00 | 0.00 |
| 2100 | 4679.99 | −5.41 | 467,898.55 |
* Social risks at 2020, 2040 and 2060 are zero. To be able to calculate percent increases it is taken as 1.0.
Table 6.
Comparison of Social Risks (SR) at Fethiye due to Earthquake Triggered Tsunami (ETTs) and Sea Level Rise (SLR).
Table 6.
Comparison of Social Risks (SR) at Fethiye due to Earthquake Triggered Tsunami (ETTs) and Sea Level Rise (SLR).
| Year | ER Due to ETTs | ER Due to SLR+ETTs | Increase in ER Due to ETTs (%) | Increase in ER Due to SLR+ETTs (%) | Increase in ER Due to ETTs Relative to 2020 (%) | Increase in ER Due to SLR+ETTs Relative to 2020 (%) | Change in ER Due to SLR (%) |
|---|---|---|---|---|---|---|---|
| 2020 | 49.17 | 55.98 | - | - | - | - | 13.86 |
| 2040 | 60.21 | 96.69 | 22.46 | 72.72 | 22.46 | 72.72 | 60.59 |
| 2060 | 67.67 | 147.89 | 12.40 | 52.96 | 37.64 | 164.20 | 118.55 |
| 2080 | 69.79 | 4991.85 | 3.13 | 3275.27 | 41.95 | 8817.40 | 7052.83 |
| 2100 | 66.01 | 4736.29 | −5.41 | −5.12 | 34.26 | 8360.87 | 7075.04 |
Table 7.
Economic risks (ER) at Cairo due to Sea Level Rise (SLR).
| Year | ER Due to SLR | Increase in ER (%) | Increase in ER Relative to 2020 (%) |
|---|---|---|---|
| 2020 | 0.00 * | - | - |
| 2040 | 105.83 | 10,483.47 | 10,483.47 |
| 2060 | 145.10 | 37.10 | 14,410.11 |
| 2080 | 740.36 | 410.24 | 73,936.05 |
| 2100 | 857.70 | 15.85 | 85,669.62 |
* Economic risk at 2020 is zero since it is considered as the base year. To be able to calculate percent increases it is taken as 1.0.
Table 8.
Comparison of Economic Risks (ER) at Cairo due to Earthquake Triggered Tsunami (ETTs) and Sea Level Rise (SLR).
Table 8.
Comparison of Economic Risks (ER) at Cairo due to Earthquake Triggered Tsunami (ETTs) and Sea Level Rise (SLR).
| Year | ER Due to ETTs | ER Due to SLR+ETTs | Increase in ER Due to ETTs (%) | Increase in ER Due to SLR+ETTs (%) | Increase in ER Due to ETTs Relative to 2020 (%) | Increase in ER Due to SLR+ETTs Relative to 2020 (%) | Change in ER Due to SLR (%) |
|---|---|---|---|---|---|---|---|
| 2020 | 8.39 | 8.39 | - | - | - | - | 0.00 |
| 2040 | 12.51 | 110.69 | 49.07 | 1219.04 | 49.07 | 1219.04 | 784.85 |
| 2060 | 17.15 | 157.81 | 37.10 | 42.58 | 104.38 | 1780.63 | 820.18 |
| 2080 | 21.62 | 752.20 | 26.05 | 376.64 | 157.62 | 88,63.91 | 3379.54 |
| 2100 | 25.04 | 891.89 | 15.85 | 18.57 | 198.45 | 10,528.60 | 3461.31 |
Table 9.
Social risks (SR) at Cairo due to Sea Level Rise (SLR).
| Year | SR Due to SLR | Increase in SR (%) | Increase in SR Relative to 2020 (%) |
|---|---|---|---|
| 2020 | 0.00 * | - | - |
| 2040 | 0.00 * | - | - |
| 2060 | 0.00 * | - | - |
| 2080 | 8,503,066.20 | 0.00 | 850,306,520.44 |
| 2100 | 10,410,082.94 | 22.43 | 1,041,008,194.43 |
* Social risks at 2020, 2040 and 2060 are zero. To be able to calculate percent increases it is taken as 1.0.
Table 10.
Comparison of Social Risks (SR) at Cairo due to Earthquake Triggered Tsunami (ETTs) and Sea Level Rise (SLR).
Table 10.
Comparison of Social Risks (SR) at Cairo due to Earthquake Triggered Tsunami (ETTs) and Sea Level Rise (SLR).
| Year | SR Due to ETTs | SR Due to SLR+ETTs | Increase in SR Due to ETTs (%) | Increase in SR Due to SLR+ETTs (%) | Increase in SR Due to ETTs Relative to 2020 (%) | Increase in SR Due to SLR+ETT Relative to 2020 (%) | Change in SR Due to SLR (%) |
|---|---|---|---|---|---|---|---|
| 2020 | 11,531 | 11,531.4 | - | - | - | - | 0.00 |
| 2040 | 16,311 | 22,011.6 | 41.45 | 90.88 | 41.45 | 90.88 | 34.95 |
| 2060 | 21,989 | 78,137.3 | 34.81 | 254.98 | 90.69 | 577.60 | 255.34 |
| 2080 | 28,252 | 8,512,665 | 28.48 | 10,794.49 | 145.00 | 73,721.46 | 30,031.35 |
| 2100 | 34,588 | 1 × 10⁷ | 22.43 | 22.72 | 199.95 | 90,496.08 | 30,104.16 |
Publisher’s Note: MDPI stays neutral with regard to jurisdictional claims in published maps and institutional affiliations. |
© 2020 by the authors. Licensee MDPI, Basel, Switzerland. This article is an open access article distributed under the terms and conditions of the Creative Commons Attribution (CC BY) license (http://creativecommons.org/licenses/by/4.0/).
Share and Cite
MDPI and ACS Style
Yavuz, C.; Kentel, E.; Aral, M.M. Climate Change Risk Evaluation of Tsunami Hazards in the Eastern Mediterranean Sea. Water 2020, 12, 2881. https://doi.org/10.3390/w12102881
AMA Style
Yavuz C, Kentel E, Aral MM. Climate Change Risk Evaluation of Tsunami Hazards in the Eastern Mediterranean Sea. Water. 2020; 12(10):2881. https://doi.org/10.3390/w12102881
Chicago/Turabian StyleYavuz, Cuneyt, Elcin Kentel, and Mustafa M. Aral. 2020. "Climate Change Risk Evaluation of Tsunami Hazards in the Eastern Mediterranean Sea" Water 12, no. 10: 2881. https://doi.org/10.3390/w12102881
Note that from the first issue of 2016, this journal uses article numbers instead of page numbers. See further details here.