Drought in the Upper Hron Region (Slovakia) between the Years 1984–2014


1
Department of Natural Environment, Faculty of Forestry, Technical University in Zvolen, 960 01 Zvolen, Slovakia
2
Oikos NGO., Environmental laboratory, Na Karasíny 247/21, 971 01 Prievidza, Slovakia
*
Author to whom correspondence should be addressed.
Water 2020, 12(10), 2887; https://doi.org/10.3390/w12102887
Submission received: 15 September 2020
/
Revised: 11 October 2020
/
Accepted: 13 October 2020
/
Published: 16 October 2020
(This article belongs to the Special Issue Impact of Natural Hazards on Forest Ecosystems and Their Surrounding Landscape under Climate Change)
Abstract
:Climate change causes an increase in the frequency and severity of weather extremes. One of the most relevant severe and damaging phenomena in Europe is drought. However, a difference in the spatial frequency of the occurrence and drought trends is evident between southern and northern Europe. Central Europe and particularly the West Carpathian region form a transitional zone, and drought patterns are complicated because of the geomorphologically complicated landscape. Since almost half of the Slovak state territory is represented by such natural landscape, it is necessary to investigate regional drought specifics. Therefore, we decided to analyze drought occurrence and trends using the SPI (Standardised Precipitation Index) and the SPEI (Standardised Precipitation Evapotranspiration Index) at available climatological stations of the Slovak Hydrometeorological Institute (SHMI) in the upper Hron region within the 1984–2014 period. We found that (1) drought incidence decreased with increasing altitude, (2) increasing air temperature increased the difference in drought trends between lowlands and mountains during the studied period, and (3) abrupt changes in time series of drought indices, that could indicate some signals of changing atmospheric circulation patterns, were not revealed. Finally, we constructed a simplified map of drought risk as an explanation resource for local decision-makers.
1. Introduction
Ongoing climate change causes an increase in weather extremes, especially droughts and floods [1,2,3,4]. There are rising trends in forest and wildfires in southern Europe [5], more frequent occurrence of extreme flood and storm situations in northwestern Europe [6], and droughts in central and South Europe [6,7]. In the context of drought [6,8,9] argue that there is an evident difference between drought trends in southern and northern Europe. While southern Europe is experiencing an increasing incidence of extreme drought episodes, the trend is the opposite in northern Europe. Following this statement, Alfieri [10] argued that, based on climate change scenarios, the difference between rainfall trends and, therefore, drought frequency between northern Europe and southern Europe will continue to grow. The primary driver of worsening drought trends and their frequency in southern Europe is rising air temperature due to climate change (and therefore evapotranspiration) [10,11,12]. Stagge et al. [6] analyzed the influence of precipitation and air temperature on the spatial patterns of drought occurrence in Europe. They found that droughts are less frequent in northern Europe due to higher rainfall, while in the south, droughts are more frequent and extreme due to higher air temperatures and less rainfall.
Although primary driving factors of drought are usually well understood and discussed on continental scales, the situation could be more complicated on a regional and sub-regional scale [13]. For instance, Vido et al. [14] reported increasing drought frequency in the Podunajská nížina valley in Slovakia between 1966 and 2013. However, Škvarenina et al. [15] found the opposite drought trend based on meteorological stations located only 60 km away. The reason for this is the complicated geomorphological structure of Slovakia, where the mountains of the western Carpathians with numerous geological depressions—the Inner Carpathian valleys—meet the Pannonian Plain in the south [16]. That creates specific climatic conditions that are invisible on the continental scale, but cause significant local differences in precipitation and air temperature regimes on a regional scale [15,16,17,18,19,20,21]. Historically, Zlatnik [22] stated significant climatic differences in Slovakia and also formulated the so-called “climatic line of Slovakia” based on biogeographical observations. The line divided the area of Slovakia into two areas (North and South). The area to the north of this line was determined as relatively wetter and colder (influence of the Baltic Sea climate) than the southern one, which is drier and warmer due to the influence of the Pannonian climate [13,17]. Nevertheless, the study of Vilček et al. [23] on the thermal continentality of Slovakia suggested that this distinction of climatic zones was more strongly related to the concentration of high mountains in northern Slovakia than to the direct influence of the sea or continental climate. Also, Zeleňáková [24] highlighted the significant effect of altitude on rainfall totals in Slovakia. That implies that altitude is a significant driver of climatic conditions in Slovakia that influence drought occurrence. That was previously implied by [13,17].
In such a heterogeneous geographical region exist relevant assumptions of climate change’s specific influence on drought evolution and occurrence. That was implied by [24] and historically [25] in the context of the spatial and temporal precipitation distribution over Slovakia.
However, more detailed research of drought trends and occurrence on the scale of the inner Carpathian basins and valleys, which are typical of almost half of Slovakia’s territory, has not yet been carried out.
Therefore, we decided to analyze drought occurrence and trends using the SPI (Standardised Precipitation Index) and the SPEI (Standardised Precipitation Evapotranspiration Index) at available climatological stations of the Slovak Hydrometeorological Institute (SHMI) in the upper Hron region that corresponds with the Upper Hron river basin (partial basin of the Hron river) within the period 1984–2014. The region is a typical representative of the inner Carpathian basins and valleys [16]. To achieve the goal, we formulated the following particular aims:
- Find out the trends of SPI and SPEI along the studied area’s altitudinal gradient.
- Detect possible abrupt changes in temporal trends of the SPI and SPEI.
- Analyze the trends of the above indices in individual months.
- Try to spatially identify drought-prone areas based on the SPI and SPEI time series’ temporal evolution.
2. Materials and Methods
2.1. Study Area
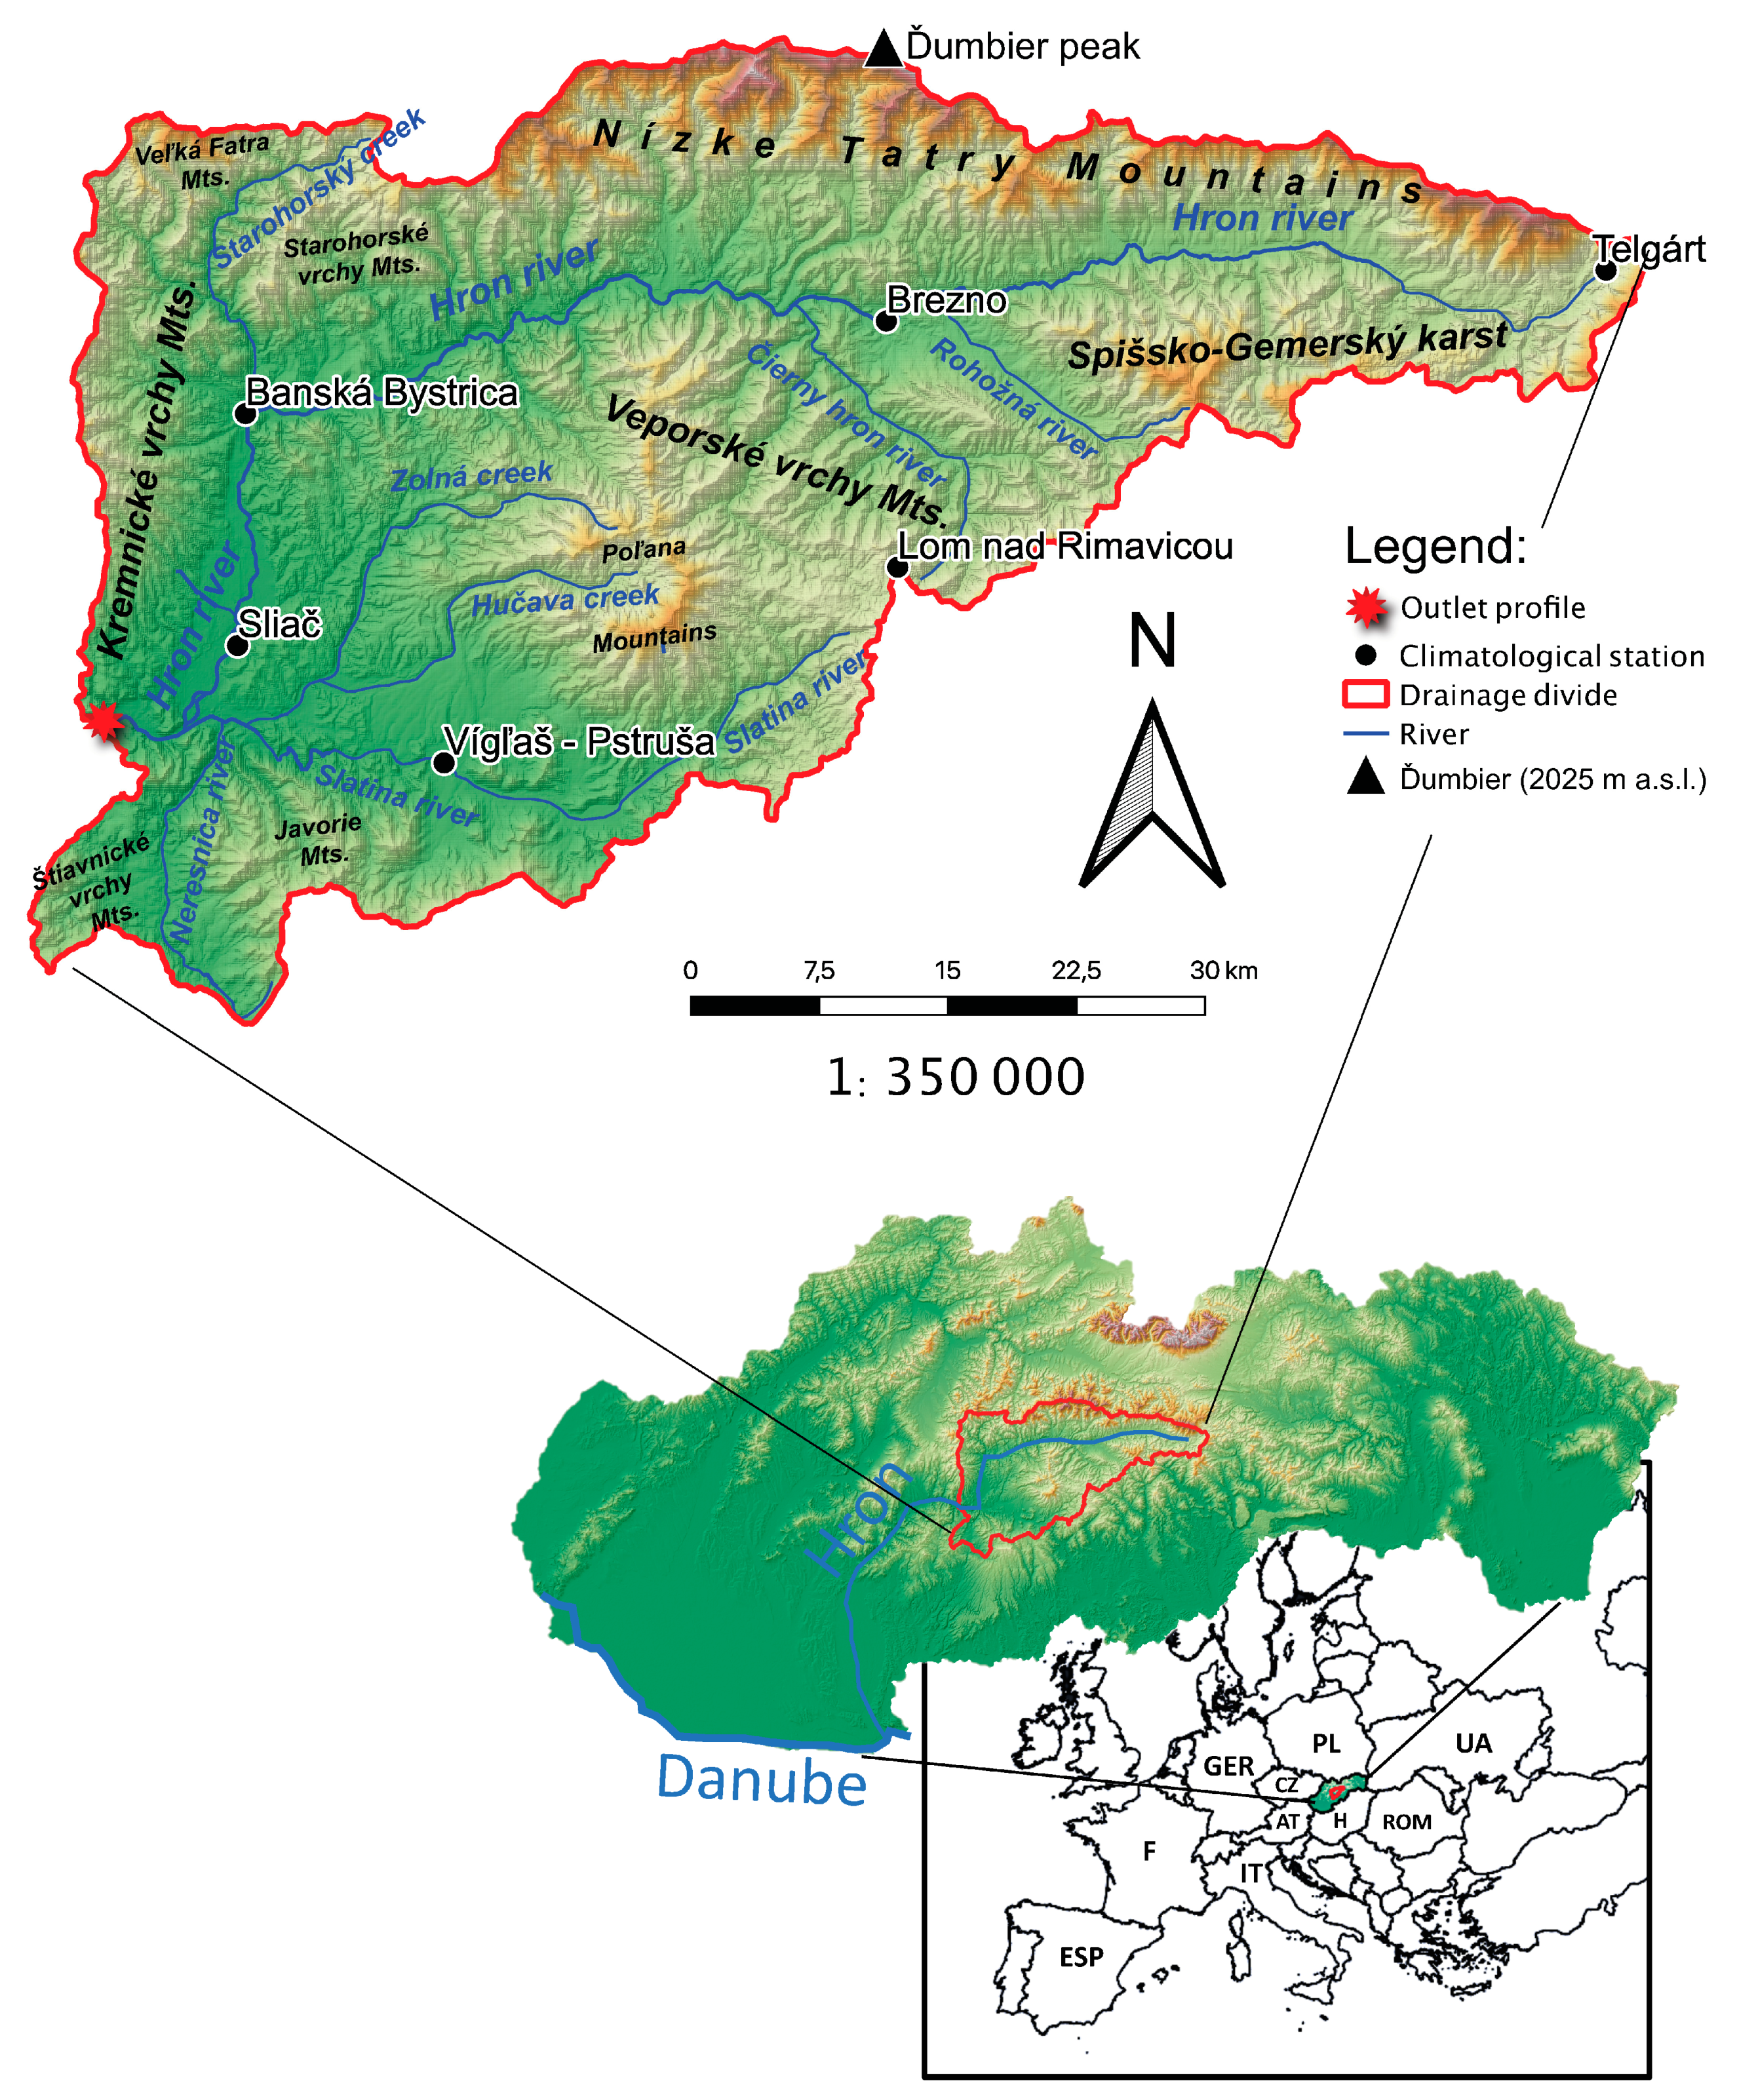
The Upper Hron region corresponds to the Upper Hron river basin located in central Slovakia. The river basin studied in the presented paper is a partial basin of the river Hron (Gravelius’ stream order “2”). The Upper Hron river source (also the source of the whole river Hron) is located beneath the Kráľová Hoľa peak in Low Tatra Mts. near the village Telgárt in the East of the basin. The altitude of the river source is 980 m a.s.l. (metres above sea level). The outlet is located on the West of the basin near Zvolen city at an altitude of 273 m a.s.l. Generally, the river basin has an East–West elongated shape. Principal tributaries of the river are the Slatina river (left tributary), Starohorský creek (right tributary), Čierny Hron river (left tributary), and Rohožná river (left tributary). Our partial basin area is 2846.9 km2, which represents 52% of the whole Hron river basin (5453 km2). The mainstream (Hron river) is 128 km long in the upper Hron river basin (river km 150–278).
The river basin is surrounded by Nízke Tatry Mts., Starohorské vrchy Mts., and Veľká Fatra Mts. to the North, Kremnické vrchy Mts. to the West, Štiavnické vrchy Mts and Javorie Mts to the South, and Veporské vrchy Mts. and Spišško-Gemerský karst Mts. to the South-East (Figure 1). In the center of the basin is a well-preserved caldera of the Neogenic stratovolcano—Poľana Mts. The highest point of the river basin is Ďumbier peak (2025 m a.s.l.) located in the North of the Nízke Tatra Mountains.
The studied partial river basin is a highly forested area. Of 2846.9 km2 of the area, 1847 km2 is forested (65%). Forests are located mainly in surrounding mountainous areas and the central part of the basin around Poľana and Veporské vrchy Mts.
2.2. Climate of the Area
The climate conditions of the studied area differ due to its terrain variability. In general, we can divide the climatic conditions into the climate of intra-Carpathian basins and valleys and the mountain climate. Further climatic characteristics were adopted from the Climate Atlas of the Slovak Republic [26] based on the reference period 1961–2010. The basin and valley climate is divided into a warm, slightly humid climate with a mild winter (Zvolenská kotlina valley—southwest of the area) and a slightly warm, humid, highland climate (high basins in the north-east of the area). The mountain areas vary between a cold mountain climate (Nízke Tatry Mountains and Veľká Fatra Mts.) to moderately cold (other mountains in the studied area). The mean annual temperature in the area ranges from −0.5 °C in the area of the highest mountains (Nízke Tatry Mountains—north of the area) to +8.5 °C in the Zvolenská kotlina valley (southwest of the area). The July (the hottest month) average temperature ranges from +8.2 °C at the highest mountain (Nízke Tatry Mountains—the north) to +18.8 °C in the Zvolenská kotlina valley (southwest of the area). The coldest month (January) mean temperature varies between −2.8 °C in the Zvolenská kotlina valley to −8.2 °C in Nízke Tatry Mountains. The highest average annual precipitation totals are recorded in the highest mountain areas of Nízke Tatry Mountains (1209 mm), and the lowest in the Zvolenská kotlina valley (southwest), with total rainfall up to 630 mm [27].
2.3. Climate Data
To achieve the goals of the study, we used climatological data, monthly mean air temperature [°C], and monthly precipitation totals [mm] from six climatological stations situated within the selected river basin of the Upper Hron river (Table 1). Our study period was 1984–2014. In Table 1 are also calculated monthly means of air temperature as well as monthly means of precipitation totals. The localization of the stations used is depicted in Figure 1. Data used in our investigation were obtained from the Slovak Hydrometeorological Institute (SHMI). According to the World Meteorological Organization’s internal and international standards, preliminary data processes (i.e., quality checking, homogenization, and preparation for the end-user) were carried out by the Slovak Hydrometeorological Institute [28]. Climatological stations are spatially well distributed within the study area and along the altitudinal gradient (range from 313 m a.s.l. to 1018 m a.s.l.).
2.4. Drought Indices
We used two widely used drought indices to achieve the goals of the paper; Standardized Precipitation Index (SPI) and Standardized Precipitation Evapotranspiration Index (SPEI). The reason was to investigate how drought patterns differ, assuming the influence only of precipitation (SPI) and the balance between precipitation and evapotranspiration (SPEI). For our purpose, we used two time scales of the indices; SPI and SPEI for one month and SPI and SPEI for twelve months. Our selection is based on a previous investigation pointing out that the one-month scale refers to short-term drought fluctuations (meteorological drought) [27,28]. In contrast, the indices for the 12-month scale are used when assessing long-term (cumulated) drought episodes with a severe impact on ecosystems and the socio-economic structure [12,29,30,31].
These indices, SPEI and SPI, for one and twelve months were therefore used to show long-term trends within the studied period.
However, for drought trend investigation in individual months within the studied period, SPI and SPEI for only one month (which are not cumulative compared to 12-month indices) were used.
2.4.1. Standardised Precipitation Index (SPI)
The Standardized Precipitation Index [32] is a drought index calculated based on the probability of the occurrence of a certain amount of precipitation in a given period. The calculation requires a long-term monthly precipitation database with 30 years or more of data. The probability distribution function is derived from the long-term record by fitting a gamma function to the data. The cumulative distribution is then transformed using equal probability to a normal distribution with a mean of zero and a standard deviation of one, so the SPI values are really in standard deviations [33]. Full mathematical descriptions of the principles and calculation of the SPI are given in [33]. Positive SPI values indicate greater than median precipitation, while negative SPI values indicate less than median precipitation. The magnitude of departure from zero represents the probability of occurrence so that decisions can be made based on this SPI value. Thus, SPI values of less than −1.0 occur 16 times in 100 years, SPI of less than −2.0 occurs two to three times in 100 years, and an SPI of less than −3.0 occurs once in approximately 200 years. The SPI can be calculated for a variety of time scales. This feature allows the SPI to monitor short-term water supplies (such as soil moisture) and longer-term water resources such as groundwater supplies or lake levels [34]. Cumulated SPI values may be therefore used to analyze drought severity. The principle of this accumulation is that if we have sequences of monthly sums of precipitation and we want to calculate the SPI values for, e.g., three-month periods (SPI for three months), then the first element of a new sequence is the sum of the first three months, the second element is formed by summing precipitation in the 2nd, 3rd, and 4th months, and the next is a sum of the 3rd, 4th, and 5th months, and so on [35]. The same logic applies for all time scales. The SPI for a specific month is then calculated from this new time series as follows:
where is the precipitation of the selected period during the year i, is the long-term mean precipitation, and is the standard deviation for the selected period [36].
2.4.2. Standardised Precipitation Evapotranspiration Index (SPEI)
The principle of the SPEI calculation is based on the standardized precipitation index (SPI) [32], which evaluates the deviations of precipitation from the long-term normal at different time scales (usually from 1 to 24 months). The SPI has long been used for drought monitoring in several countries in the world [37]. One of the SPI limitations is that it does not include the passive components of the hydrological regime (i.e., evapotranspiration). Vicente-Serrano et al. [38] used both precipitation and potential evapotranspiration (PET) to generate the SPEI values that include the deviation of the whole climatic balance (P-PET) from the normal (i.e., positive values represent a positive balance and vice versa). Following the methodology of Vicente-Serrano et al. [38], a drought episode starts (similar to SPI methodology) when a negative value of the index appears and lasts until the first positive value. However, the index must reach or exceed −1 for at least one month during the specific episode. The calculation of the potential evapotranspiration in SPEI is based on the equation of Thornthwaite [39]. Calculation of SPEI requires a time series of at least thirty years of monthly average air temperatures and monthly precipitation totals from each station.
2.5. Trend Analyses
We applied two non-parametric methods for trend analyses:
- (i)
- Mann–Kendall trend test (MK) and
- (ii)
- Cumulative sum of Rank Difference test (CRD).
The Mann–Kendall test [40] is a standard non-parametric test for trend detection [41]. However, as stated by Onyutha [42], the Mann-Kendall test is a purely statistical method, so there are no detailed insights about the specifics of the studied trends. We adopted the CRD test due to the need to detect abrupt changes in the temporal trend of the SPIs and SPEIs. This need arose because some authors implied that significantly changed patterns of atmospheric circulation occurred in the late eighties and early nineties, which influenced rain patterns over central Europe [39,40]. Therefore, we used this relatively new method to analyze whether some abrupt changes in the time series of the SPIs and SPEIs were evident.
This method combines both statistical and graphical approaches in trend analyses. A detailed description of the method and computation procedures is presented by Onyutha [42].
The combination of the CRD test with the MK test can bring deep insights into trend behaviour (i.e., cyclical anomalies and abrupt changes in trends).
In our case, we used CRD plots of the SPIs and SPEIs. Computation of the CRD was carried out using the CRD-NAIM_v.3 tool, which was downloaded together with its user manual via the link: https://sites.google.com/site/conyutha/tools-to-download (accessed on 31 July 2020).
Since the computations were based on monthly scale, CRD parameters in the tool were as follows:
- significance level set to 5%
- time scale representing a moving average of 60 (60 months = 5 years)
- the initial block set to 10
- number of Monte Carlo runs for resampling set to 1000 (default setting)
The MK test was used as a general indicator of a trend toward aridity or humidity; CRD graphical outputs were used as an additional indicator of changes in trend directions throughout the studied period. For the MK test, the significance level default was set to α = 0.05.
For trend analyses aimed at investigating trends in particular months within the studied period, only the MK test was used.
2.6. Spatial Identification of the Drought-Prone Area
To spatially identify potential drought-prone areas, we used station-based analyses of the SPI and SPEI for twelve months. The reason was to identify areas that have a higher potential to be endangered by severe droughts.
The QGIS geographical information system (release 3.12.1, Bucuresti) was used. The spatial delimitation of drought-prone areas was limited by the altitude corresponding to the climatological station’s altitude, which showed a significant trend (towards wetter conditions) of both analyzed drought indices (SPI and SPEI). This process was carried out using the Raster Calculator of the QGIS, set to delimit the area with altitudes corresponding to altitudes equal to and higher than the specific climatological station altitude (stations with a prevailing number of significant trends toward wetter conditions).
3. Results
3.1. Trends of SPI and SPEI within the Period 1984–2014
3.1.1. Trends of the SPI within the Studied Period
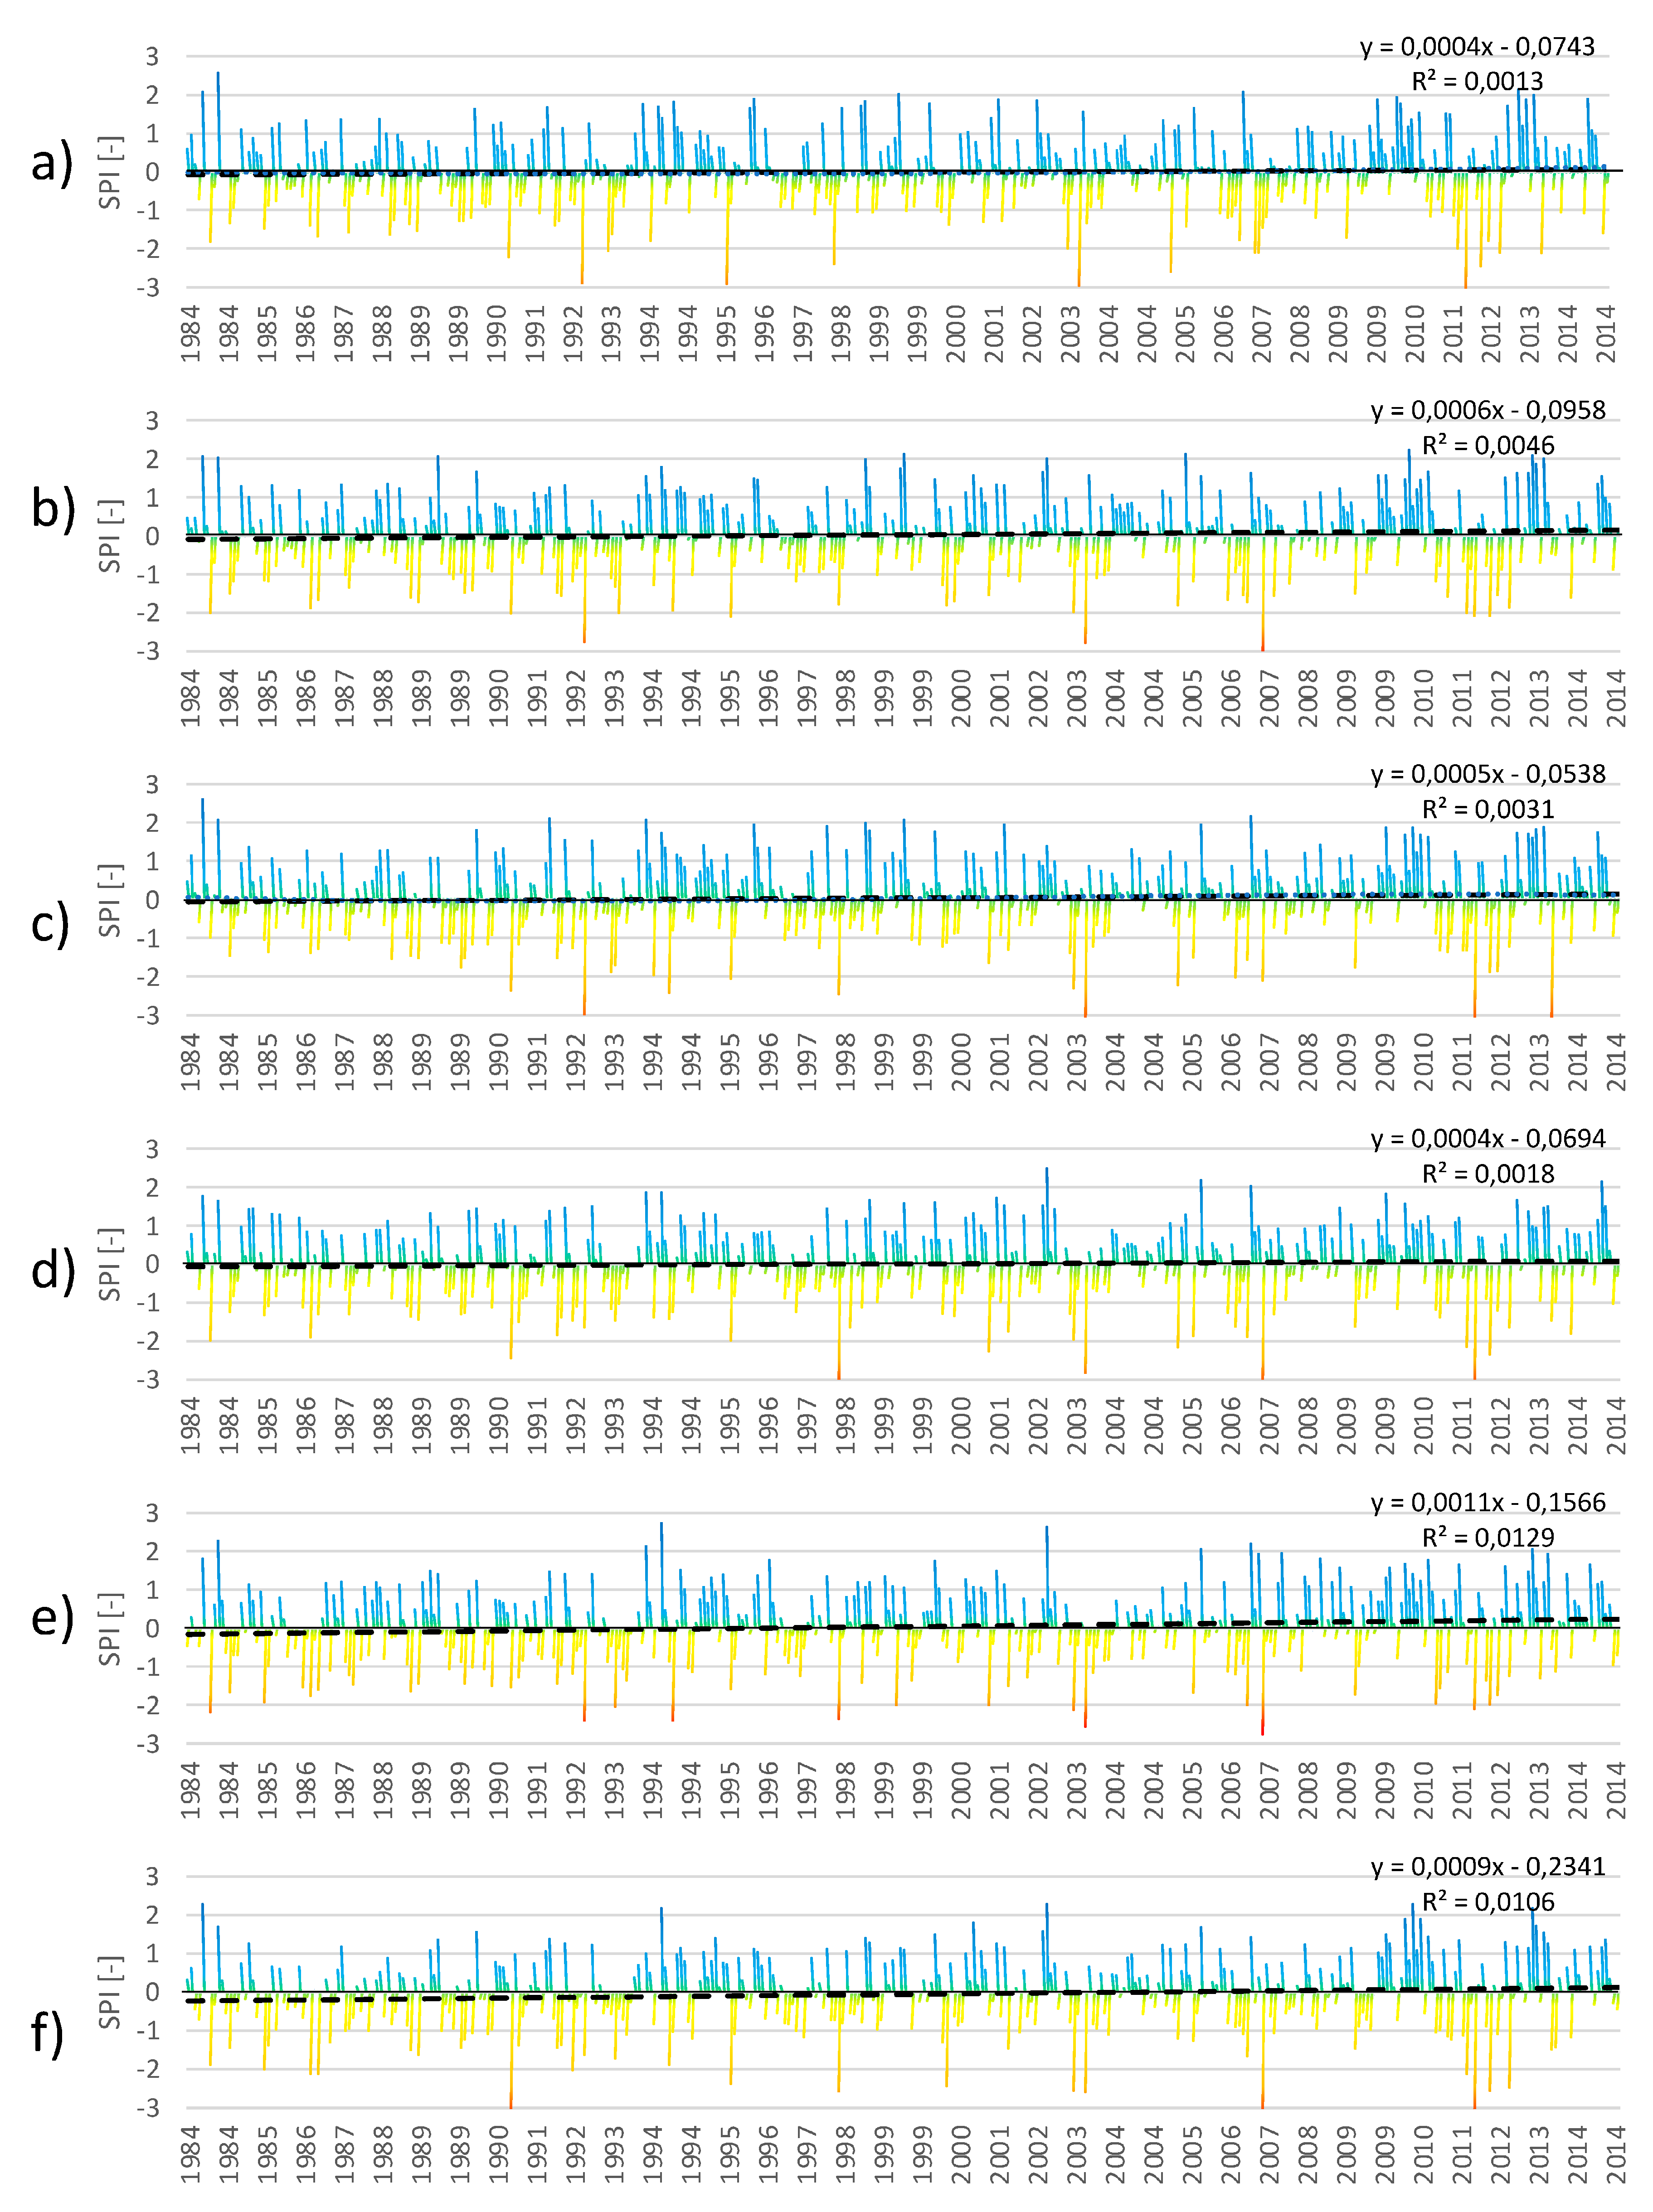
Trend analyses of the SPI for one month showed no significant and very slight trends (R2 between 0.0013 to 0.0018) toward wetter conditions for four climatological stations situated at low altitudes (Sliač, Vígľaš-Pstruša, Banská Bystrica, and Brezno) (Figure 2a–d). Exceptions were the two highest stations, which recorded a significantly increasing trend toward wetter conditions (Telgárt and Lom nad Rimavicou) (Figure 2e,f and Table 2).
However, these two trends had a slight slope (R2 = 0.0129 and 0.0106). The alternation of drought episodes with wetter (precipitation-rich) periods was relatively regular and frequent throughout the study period. However, the last five years in the time series (2009–2014) are an exception. During this period, drought episodes and wet episodes lasted relatively longer than usual. The secondary relatively wetter episode was recorded between the years 1994–1996.
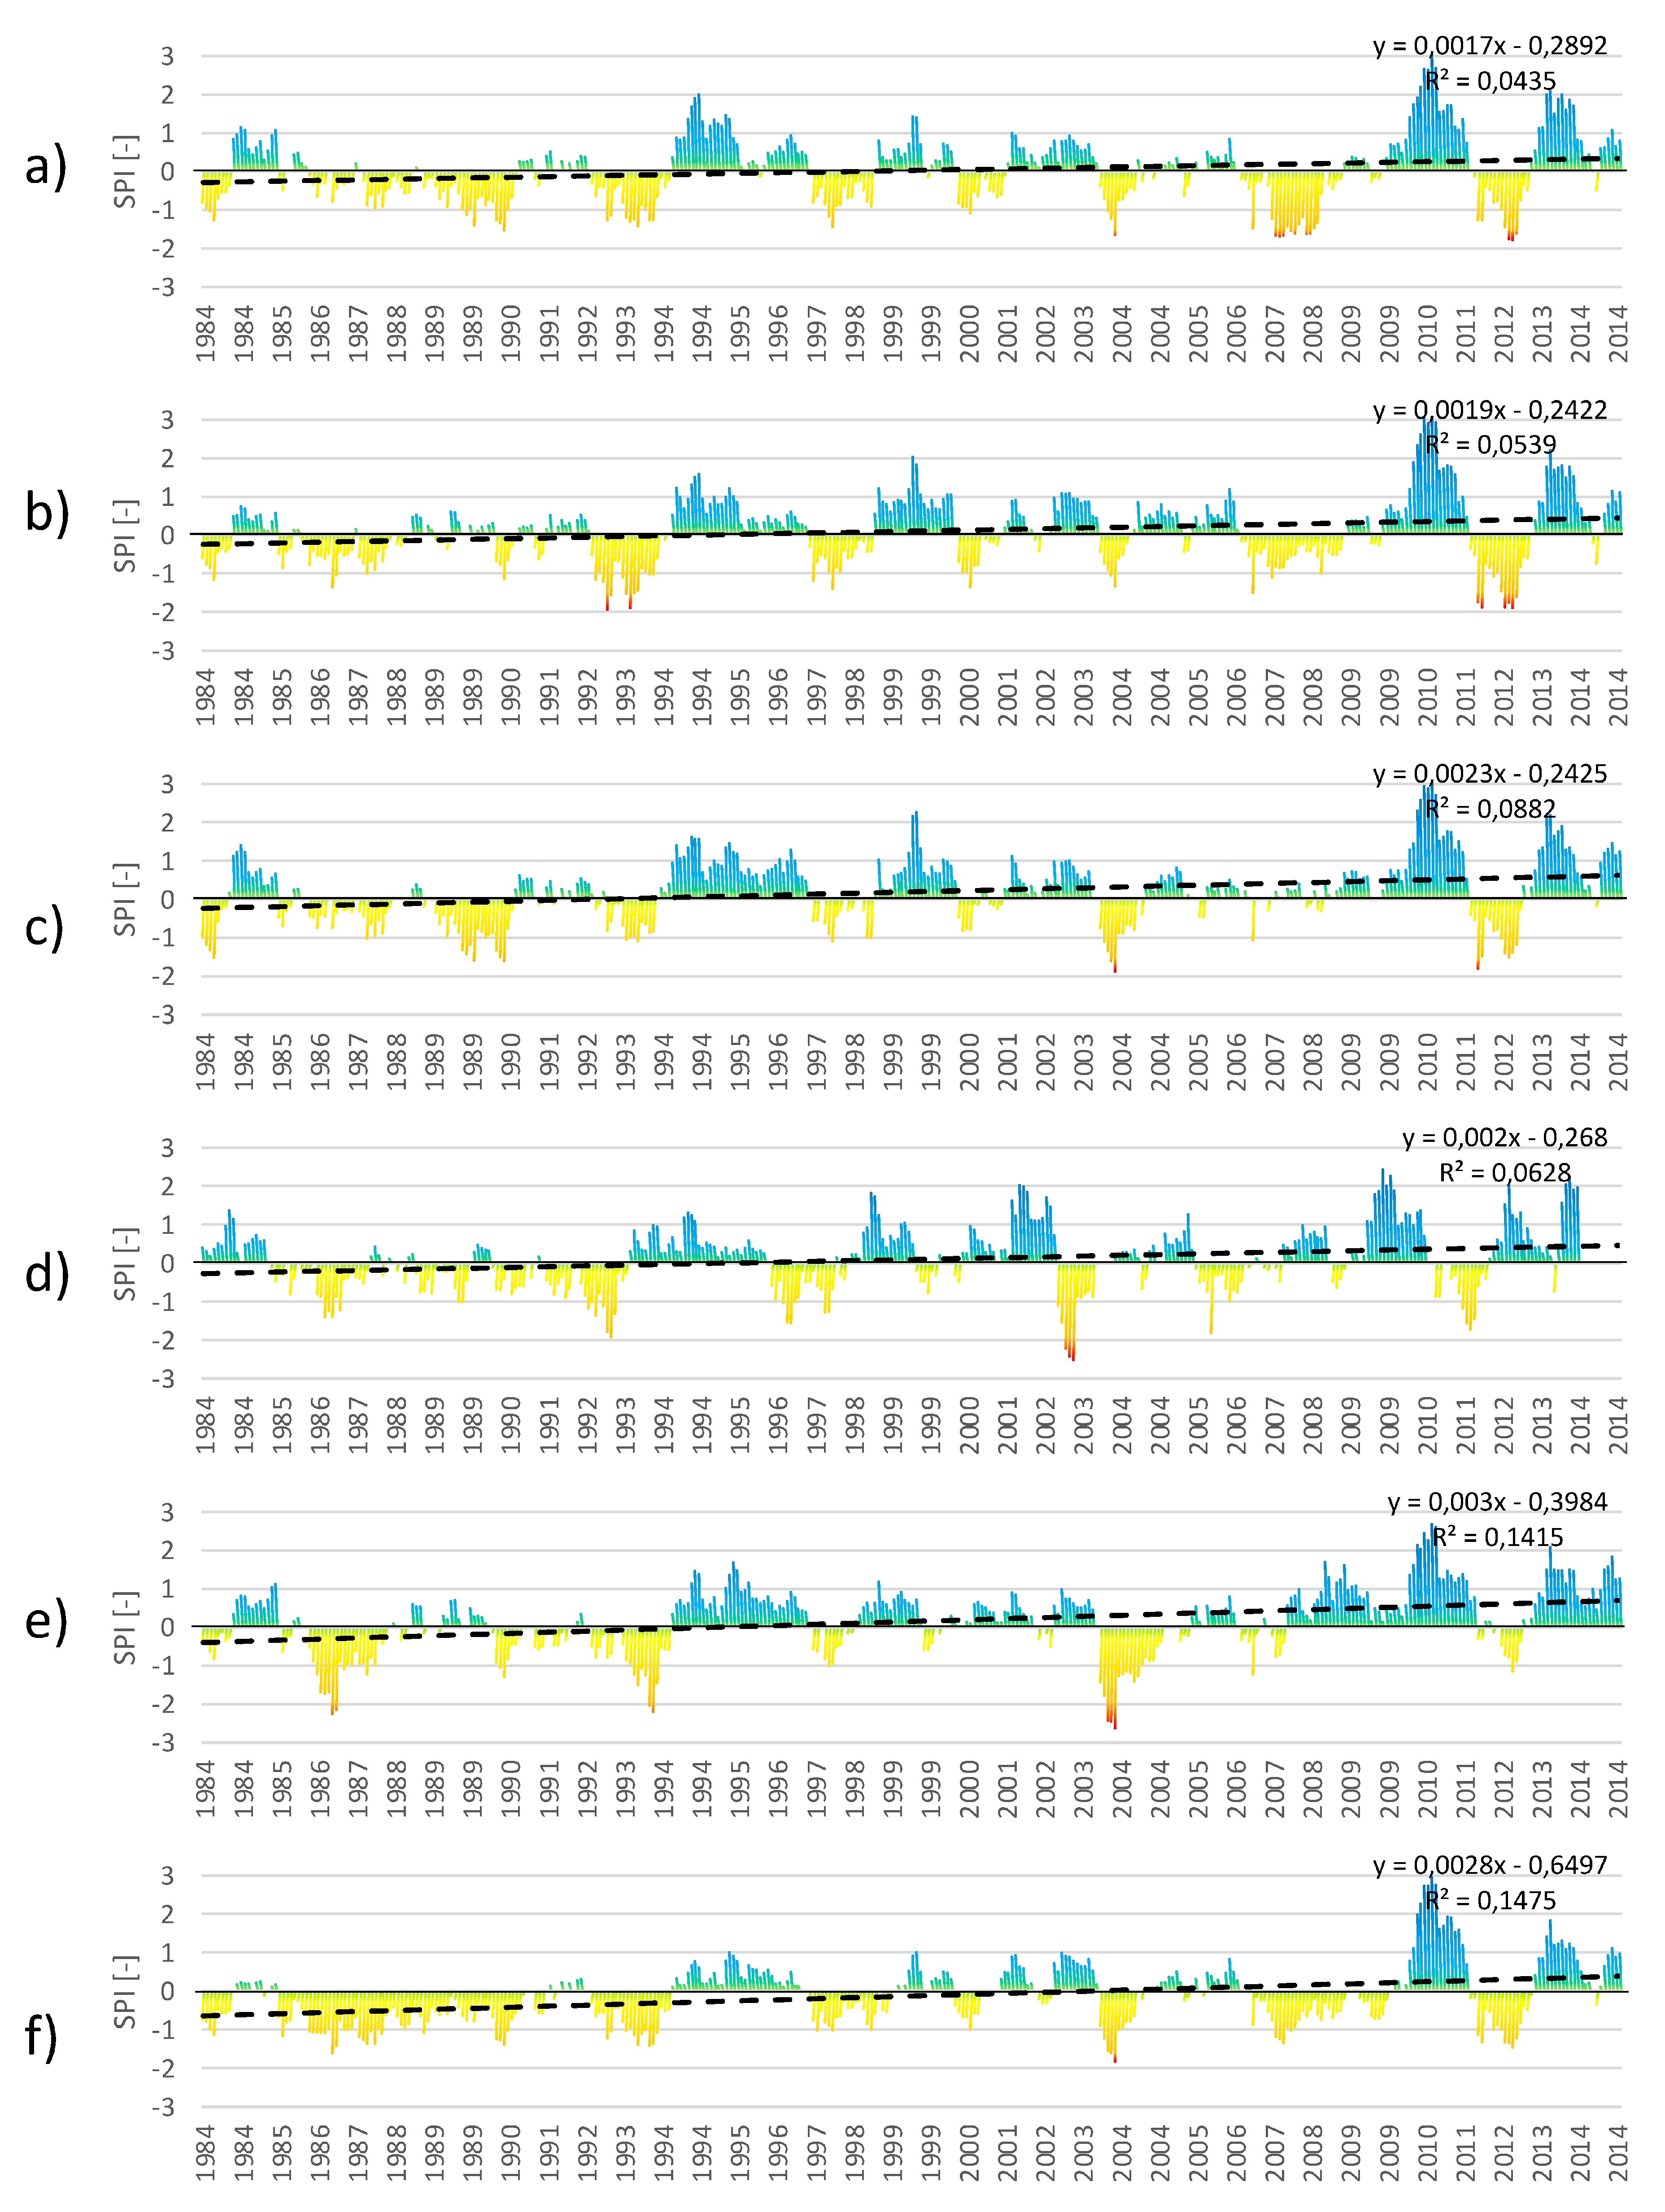
These facts are much more pronounced based on the twelve-month SPI (Figure 3). Based on the twelve-month SPI, the dry and long-lasting drought period of 1985–1993 becomes evident. This drought period is evident for all studied stations, but interestingly most pronounced for the highest station Lom nad Rimavicou situated in the southeast of the studied region.
Because the twelve-month index shows accumulated precipitation patterns, drought and wet episodes were much more pronounced. This feature has an influence on the trend slope and its significance. All stations showed a significantly rising trend towards wetter conditions when applying SPI for twelve months (Table 2 and Figure 3).
Considering altitude as a climatic driving factor (as mentioned in the introduction of the article), we see that with increasing altitude a decreased number of drought episodes during the studied period. On the other hand, it is interesting that the highest located station Lom nad Rimavicou (Figure 3f) recorded less pronounced wet episodes (maximum magnitude of the SPI for 12 months was +1) between the years 1994–2000 compared to stations located at lower altitudes (Figure 3a–e).
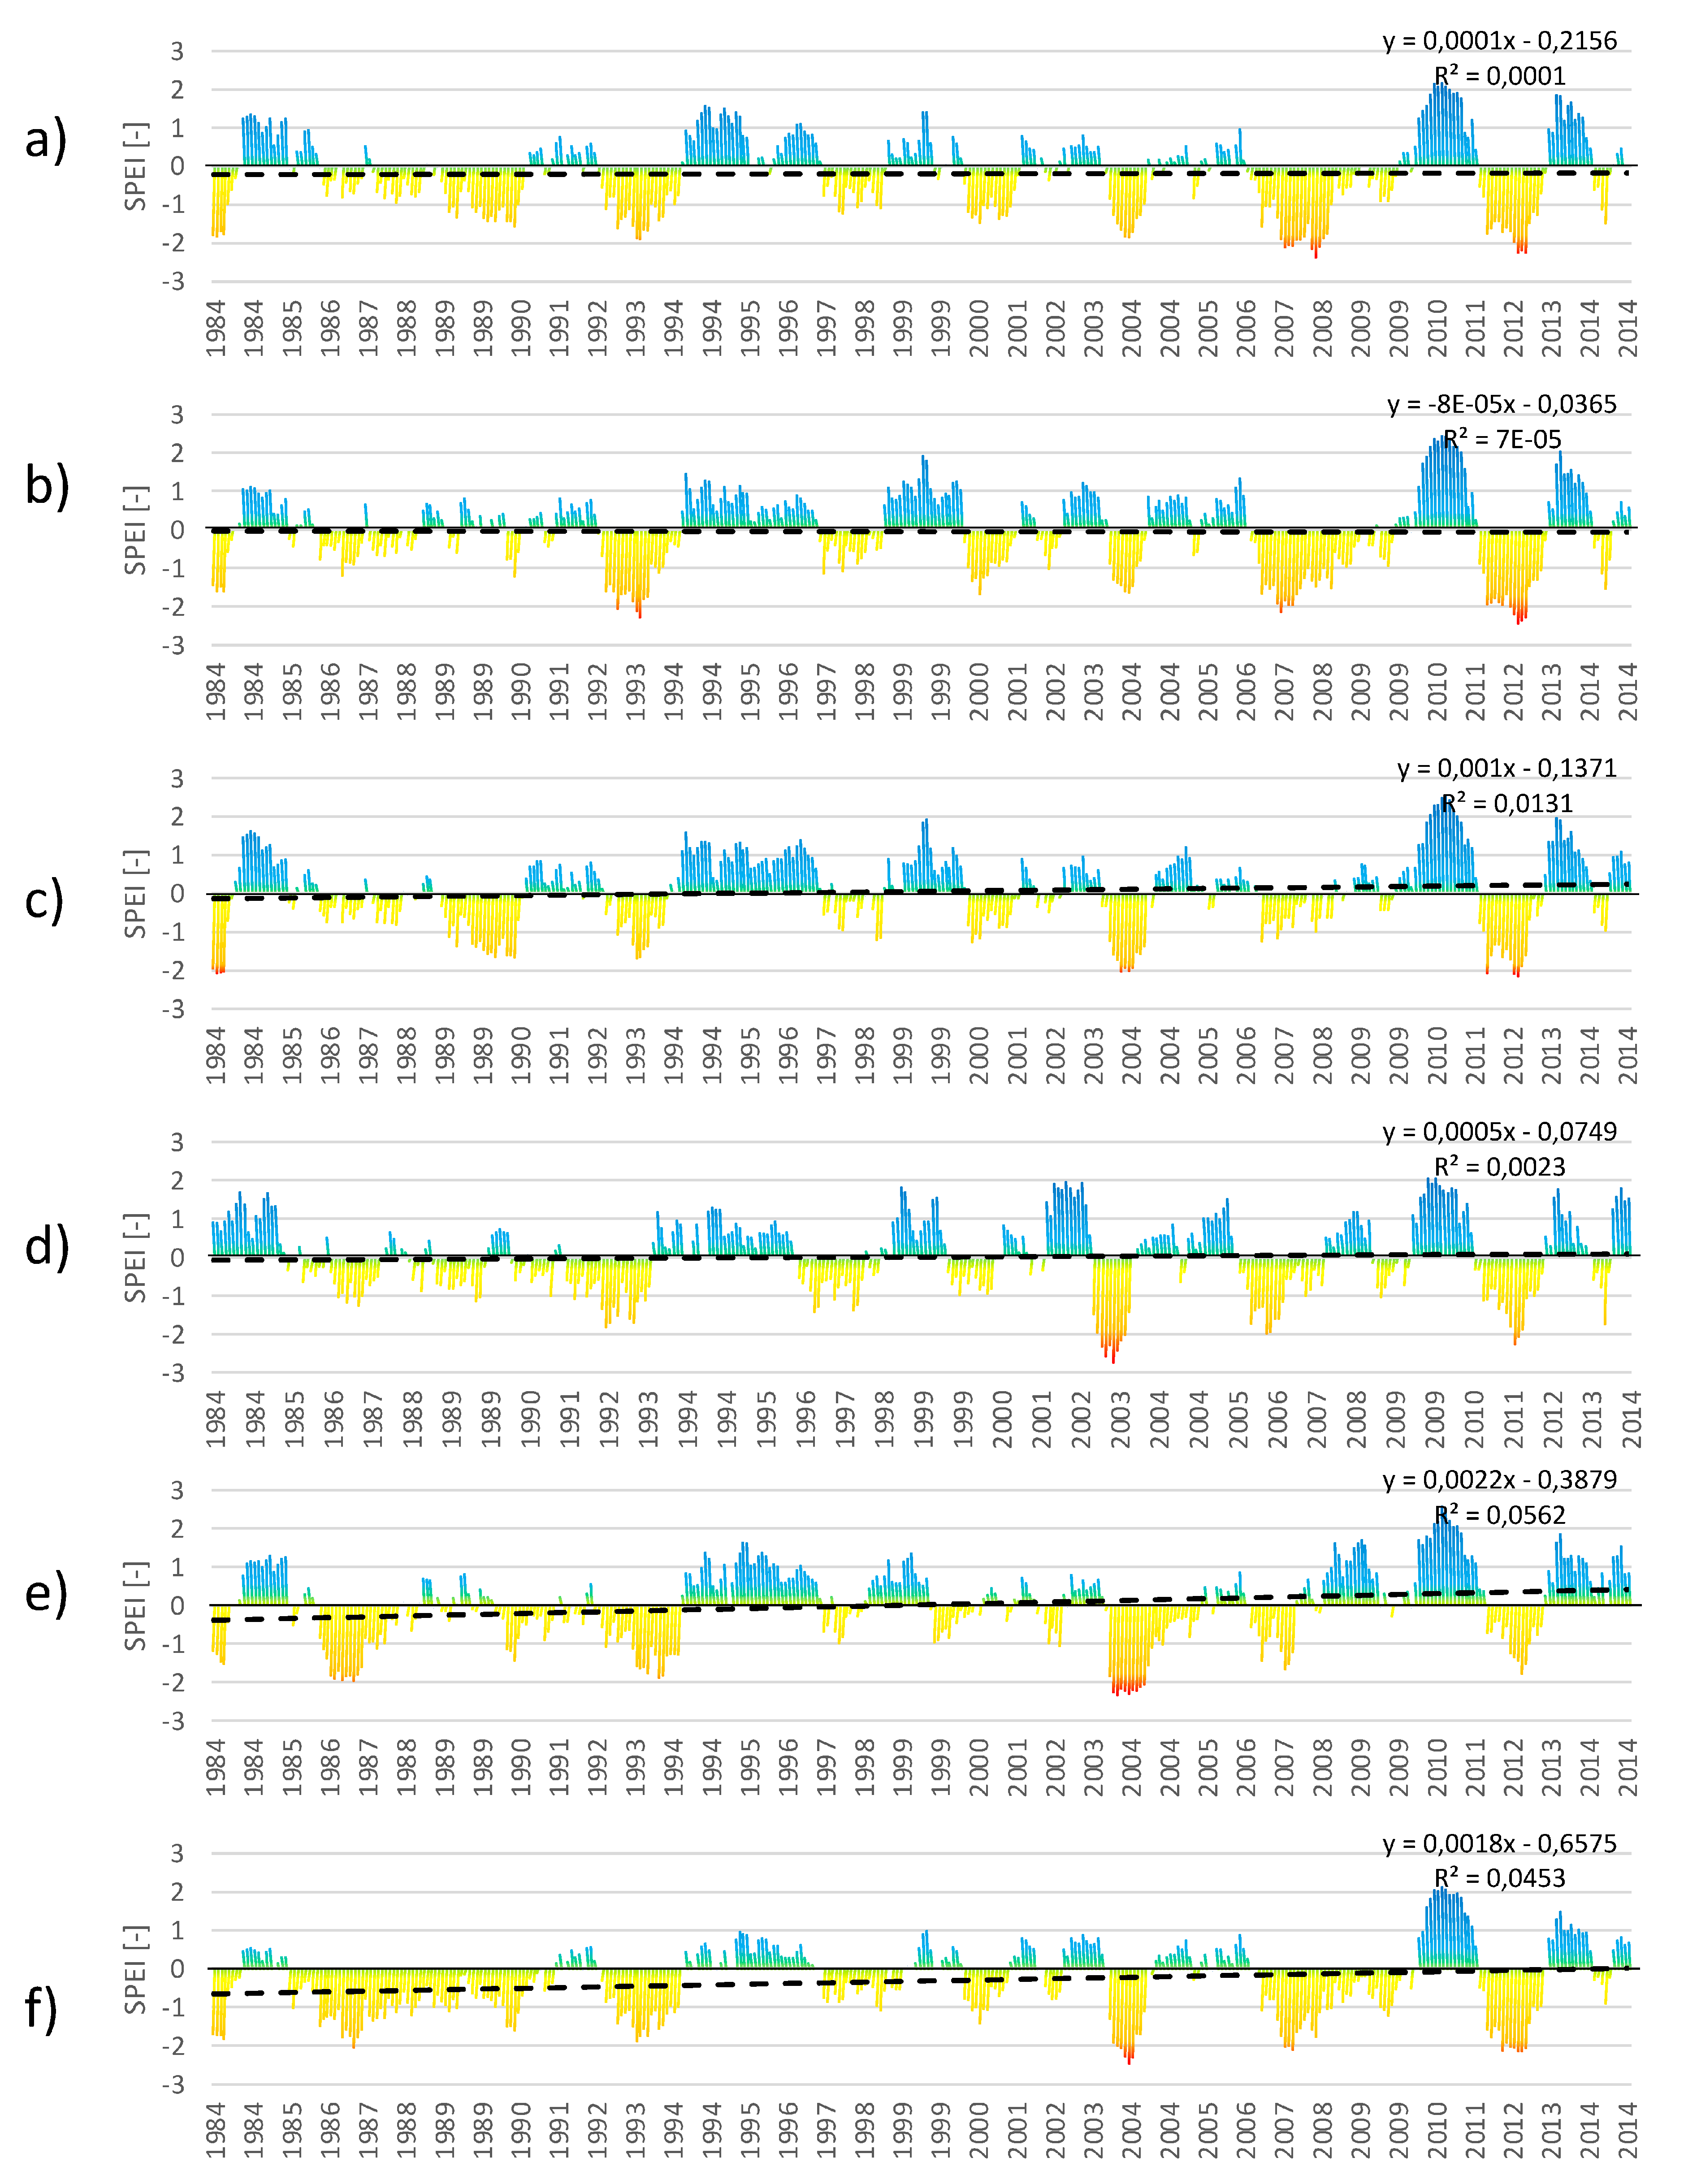
3.1.2. Trends of the SPEI within the Studied Period
Previous results have taken into account only precipitation (SPIs). However, in drought analyses, it is necessary to also take into account evapotranspiration (mainly driven by air temperature) to see the complex influence of these parameters on temporal trend evolution due to climate change involved in temperature increases. Therefore, we also analyzed the time series and linear trends of the SPEI for one and SPEI for twelve months.
It is evident that by incorporating evapotranspiration, the previously detected severe and long-lasting drought episodes in the late eighties and early nineties and drought episodes of 2003, 2007–2009, and 2011–2012 were more pronounced.
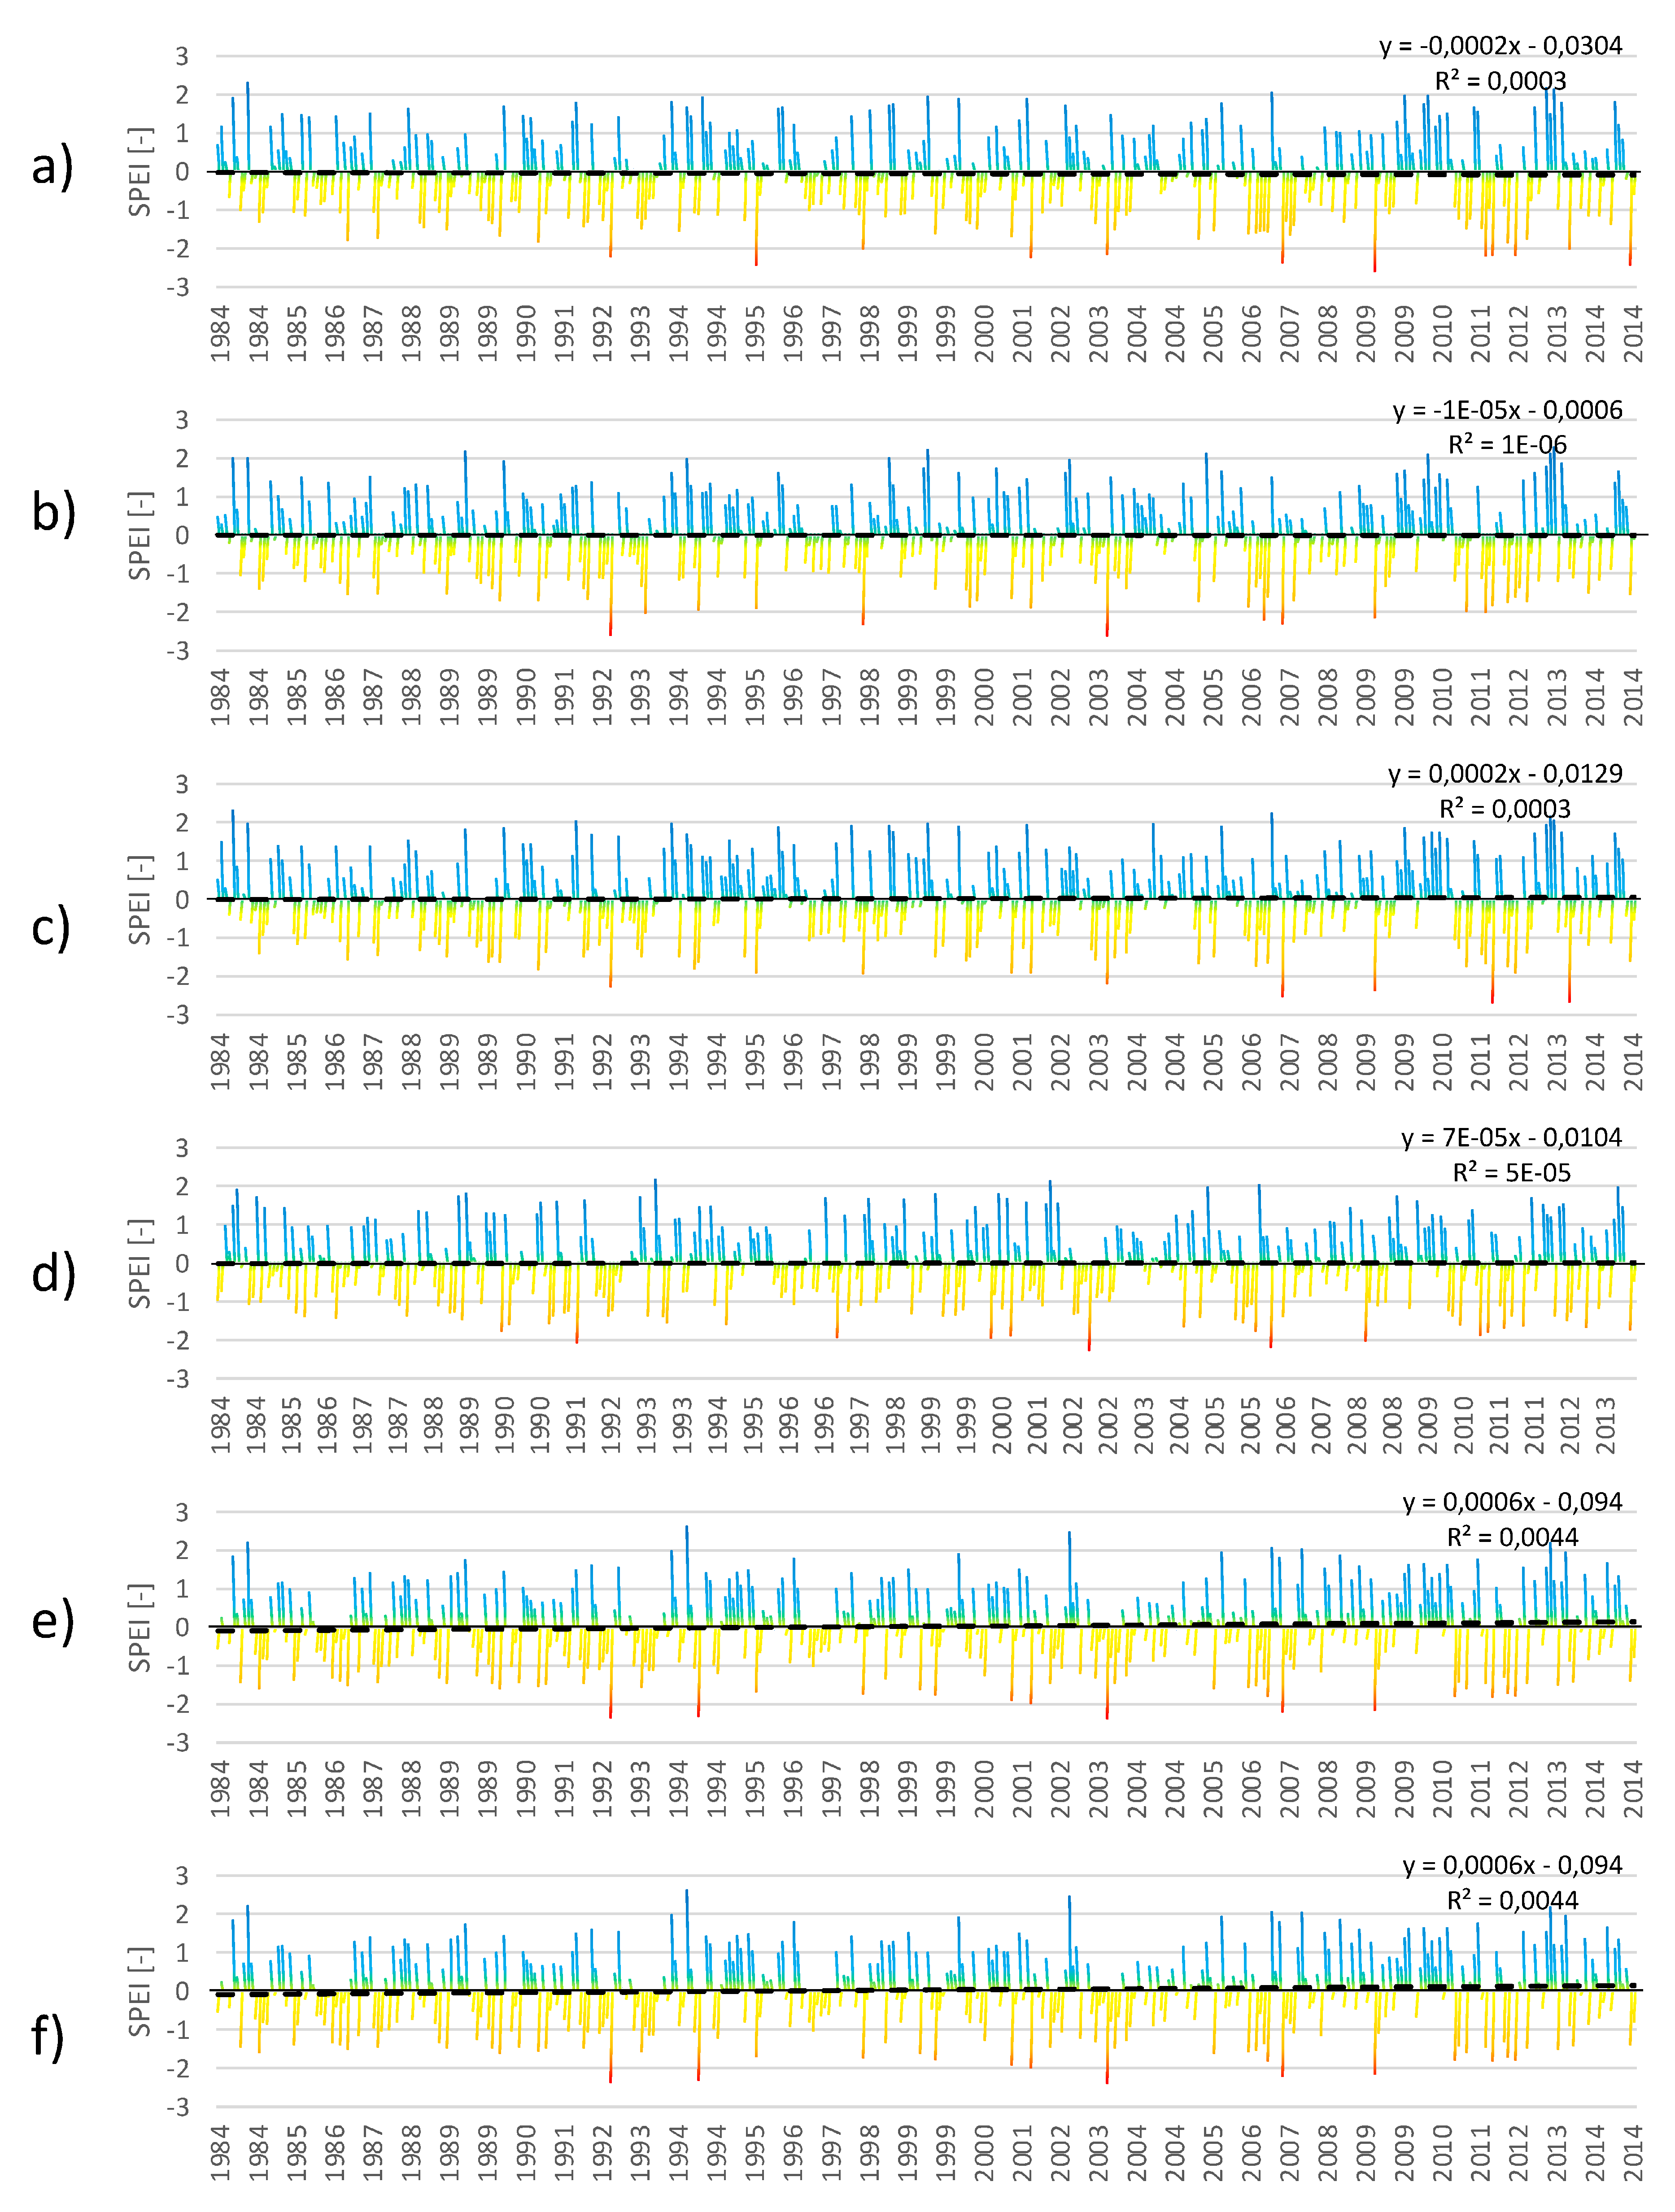
Based on trend analyses of the SPEIs for one month (Figure 4), no trends were recorded within the studied period. Slight insignificant humid trends were recorded for the highest located stations, Telgárt and Lom nad Rimavicou (both stations R2 = 0.0044) (Figure 4e,f). However, in comparison to the SPI for one month, it is evident that air temperature (evapotranspiration) influenced the flattening of all the trends (Table 2). SPEI for 12 months highlighted these trends (Figure 5). SPEI for 12 months showed a significant trend toward wetter conditions for the two highest stations, Telgárt and Lom nad Rimavicou (R2 = 0.0562 and 0.0453) (Table 2 and Figure 5e,f). Nevertheless, for the remaining stations, SPEIs for twelve months showed no trend except for Banská Bystrica (Figure 5c). However, the MK test revealed its trend as insignificant (Table 2). Thus, comparing the SPI and SPEI analysis results, we can state that evapotranspiration (driven by air temperature) has changed the temporal evolution of the drought trends (Table 2). When we compare SPI and SPEI, it is evident that the driver of the divergent drought trend evolution is a continuous rising of air temperature. However, at higher altitudes, in comparison to lower altitudes, we observe lower influence of rising temperature on evapotranspiration, and therefore, the trends of the SPI and SPEI remain unchanged at higher altitudes.
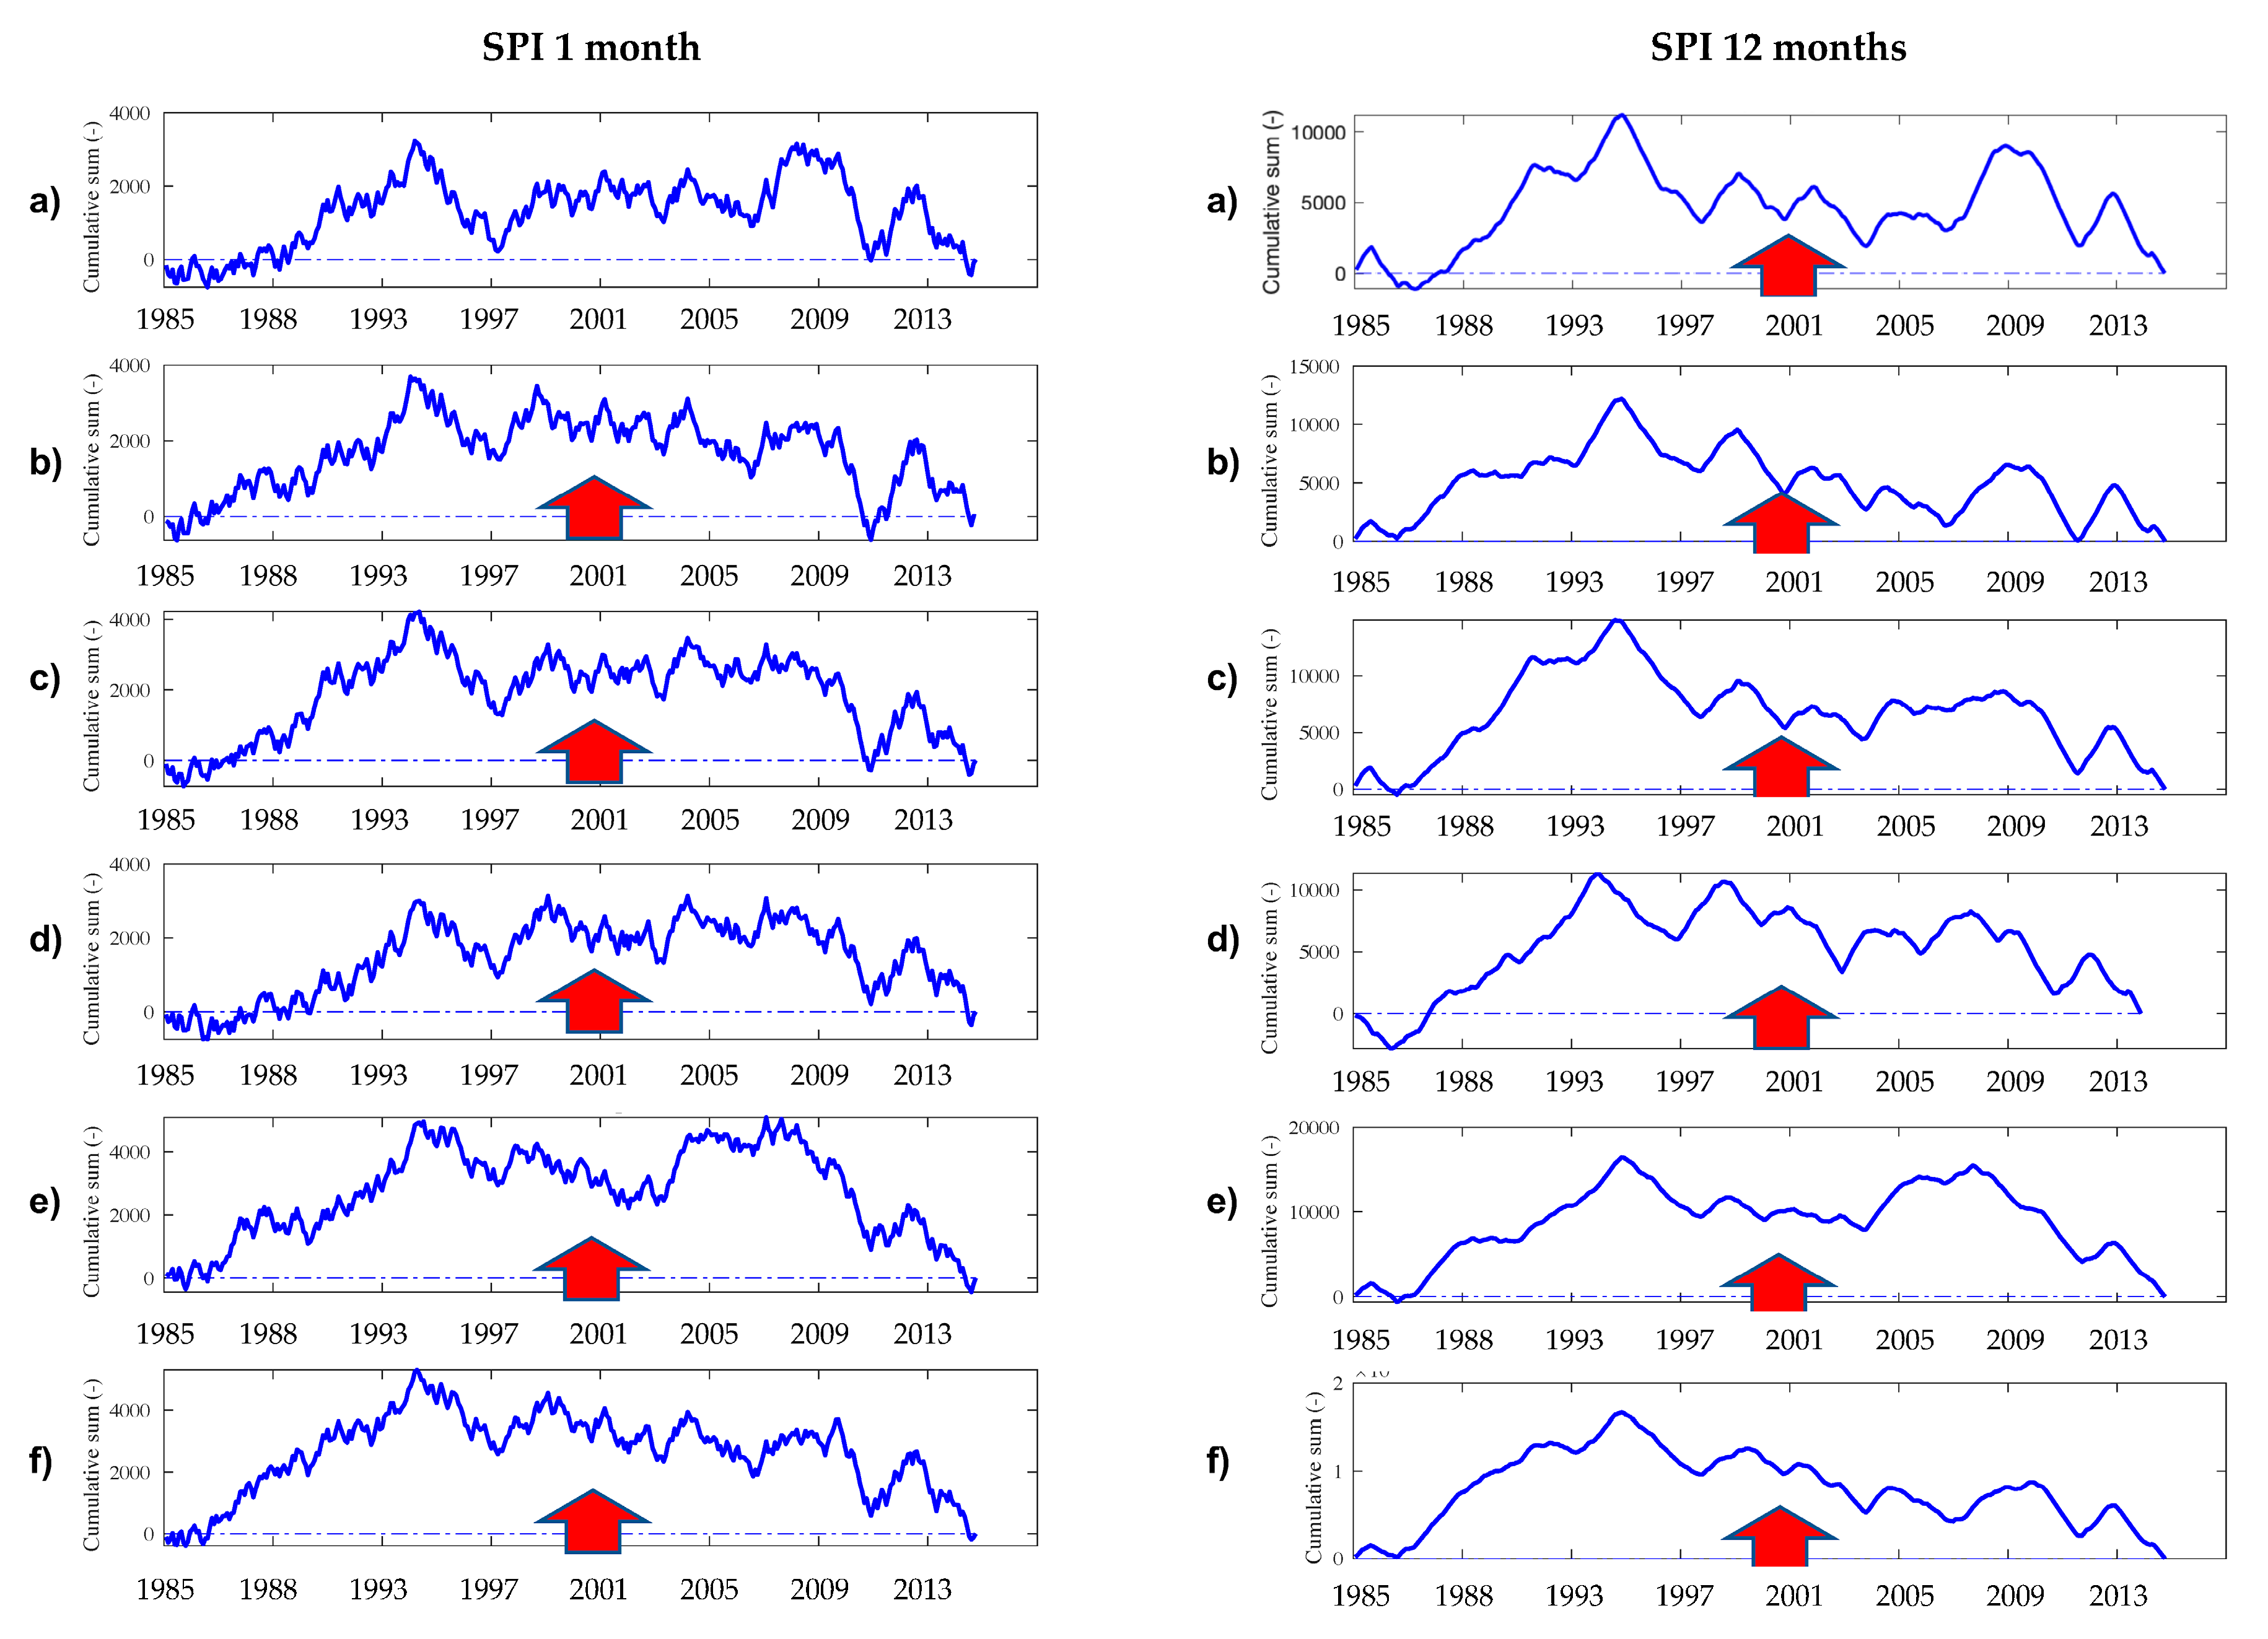
3.2. Detection of Abrupt Changes in Temporal Trends of SPI and SPEI within the Period 1984–2014
CRD plots constructed to detect abrupt changes and possible sub-trends in time series within the studied period confirmed the general trends of the SPI’s temporal evolution. No abrupt changes in general rising trends of SPI for one and twelve months were detected within the studied period (Figure 6). However, the CRD plot of SPI for one month at the lowest station Sliač (Figure 6a) implies that trend direction toward wetter conditions is almost indistinct. This result also corresponds with an insignificant MK test and low R2 (0.0003) for this station mentioned in the previous Section 3.1.2. That, however, applies only to SPI for one month. When assessing SPI for 12 months, the CRD plot for all the stations showed a positive trend direction (Figure 6 right), which implies that no abrupt change in the rain regime was observed in the studied period, and we see increasing (even though insignificant) or no changing trend in precipitation within the studied period.
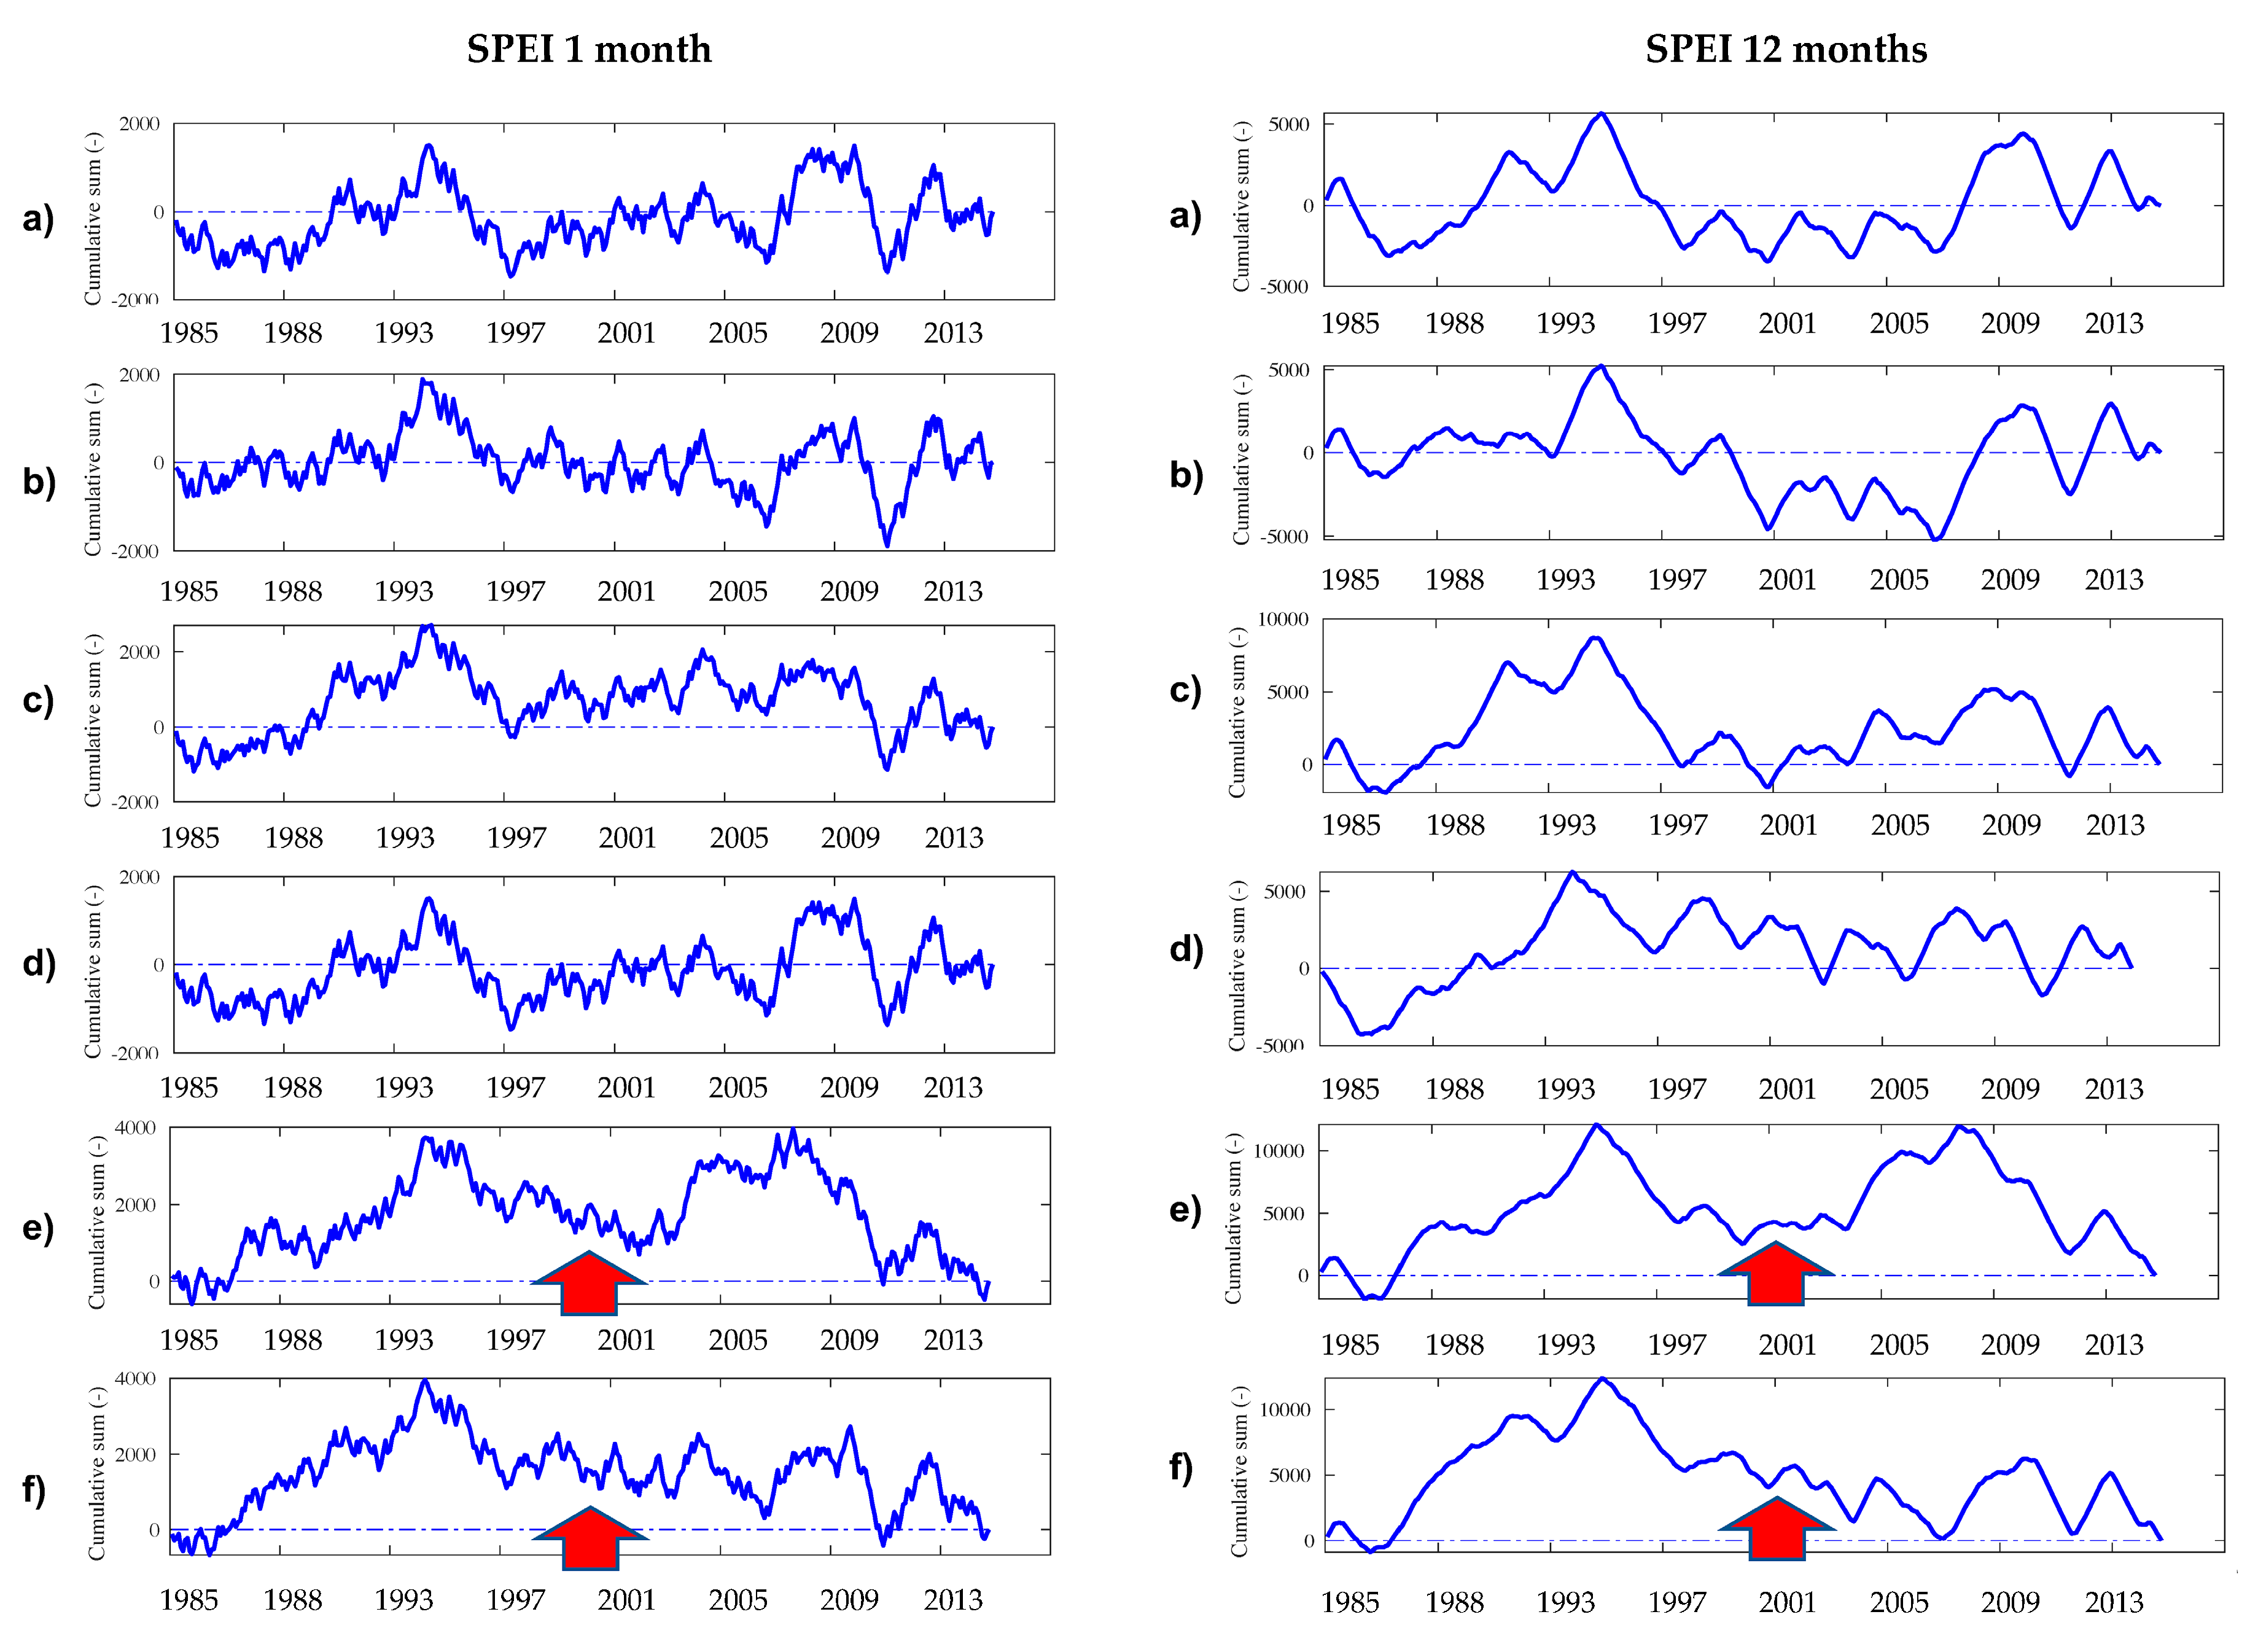
However, CRD plots constructed for calculated SPEIs for one and twelve months showed how air temperature (evapotranspiration) influences the trend direction (Figure 7). As stated in Section 3.1.2, SPEI indicates that rising temperature during the studied period also changed drought trends from humid to indistinct trends (except for the highest meteorological stations that retained humid trends). CRD plots also confirmed this previous result. Although abrupt changes in time series were not detected similarly as by CRD for SPIs, CRD for SPEIs recorded pronounced indistinct trends for all stations with the exception of the two highest meteorological stations (Telgárt and Lom nad Rimavicou) where clear trends toward wetter conditions were retained (positive trend directions). This result showed that abrupt changes during the studied period were not observed, but rising temperatures significantly influenced the slope of the SPEI trends compared to SPI. This finding, therefore, supports the results described in Section 3.1.
3.3. Trend Analyses of SPI and SPEI for Individual Months in the Period 1984–2014
Trend analyses of the SPIs and SPEIs showed significant (tested by the MK test) rising trends toward wetter conditions in July. Only at stations Sliač and Brezno were these trends insignificant. The second most frequent occurrence of significant trends toward wetter conditions was recorded in January.
The remaining monthly trends at all the stations were insignificant. Interesting trends, although insignificant, were recorded in April and May. All the stations recorded decreasing trends toward drier conditions based on both indices (SPI and SPEI). In December, all stations recorded an increasing trend toward wetter conditions, but these trends were insignificant. An interesting summary fact is that significant trends (July and January) were recorded along the whole altitudinal gradient. The summary of the trend analyses is presented in Table 3.
3.4. Spatial Identification of the Drought-Prone Areas
Attempts to identify drought-prone areas were based on results (summarized in Table 2) that the highest frequency of trends toward humid conditions was recorded at the stations Telgárt (901 m a.s.l.) and Lom nad Rimavicou (1013 m a.s.l.). We used this information to construct a map that is spatially divided along with the altitude of the station Telgárt (901 m a.s.l.). For the remaining lower located stations, only in one case (SPI for 12 months) was the trend recorded as significant toward wetter conditions. Also, significant trends toward the humid condition of the SPEI for 12 months were detected only for the highest stations Telgárt and Lom nad Rimavicou. Therefore, since the SPEI for 12 months detects severe droughts more precisely than the SPI for twelve months due to accounting of evapotranspiration, the argument for delimitation of drought-prone areas below altitudes of 901 m a.s.l. is even more credible. Besides, significant trends of the SPEI for 12 months toward humid conditions at stations Telgárt and Lom nad Rimavicou imply lowering the frequency of severe drought occurrence within the studied period at altitudes higher than 901 m a.s.l. Based on this assumption, a map of the relative drought risk (Figure 8) was constructed. The map showed that relatively lower drought risk areas (trends toward humid conditions based on the SPI and SPEI for 12 months) are located in mountainous, mainly forested areas. These areas are also source areas of the Hron river (East of the Telgárt settlement) and all main tributaries. Hence, this implies relatively good prospects concerning the hydrological drought. On the other hand, in the south of the studied area, drought-prone areas were identified, where Štiavnické vrchy Mts. and Javorie Mts. are located. Therefore, in these locations and the Neresnica river basin (including the river’s source area), drought could become a severe problem if the evolution of drought trends will remain as occurred in the studied period.
4. Discussion
Observed generally rising trends in the SPIs toward humid conditions are likely connected to climate change involved in increasing the absolute humidity [20]. These trends are positively correlated with rising altitude within the area. This pattern was confirmed by results that showed rising R2 as well as the rising significance of the SPI trends with rising altitude (Figure 4 and Figure 5). However, these results were indistinct based on the SPI for one month. Assessing the SPI for twelve months indicated significant trends toward humid conditions. Another possible interpretation could be that severe drought episodes became less frequent in the given area during the studied period due to significant humid trends of the SPIs for twelve months, which represent severe drought with cumulative drought impacts, as stated in [30]. However, it is necessary to consider that the SPI takes into account only precipitation.
Therefore, we also utilized the SPEI, which also takes potential evapotranspiration into account. The influence of evapotranspiration flattened generally rising (humid) trends, especially at lower and middle altitudes (Figure 4 and Figure 5), and humid trends were revealed only for the highest located stations (Telgárt and Lom nad Rimavicou). That implies that rising temperatures (based on SPEI recalculated to evapotranspiration) within the studied period significantly influenced drought trend evolution. That has been confirmed particularly by the SPEI for twelve months. Results demonstrated the influence of the potential evapotranspiration (compared to the SPI) on drought episode extension and magnitude. That is evident in drought episodes of the early nineties, during the pan-European drought of the 2003, 2007, and 2011/2012 drought episodes. Based on this, it is evident that rising evapotranspiration, possibly linked with rising temperatures due to ongoing climate change [18,43], strongly influenced (and we argue that will continue to influence) drought patterns in the studied period. However, with rising altitudes, the evaporative demand of the atmosphere is lower [44]. That was distinct in retaining humid trends at the highest altitudes (Table 2). This feature somehow implies a relatively lower drought risk at higher altitudes. However, we are discussing standard weather patterns, and under this assumption, we do not consider severe pan-continental drought situations linked with intense anticyclonal situations or with tropical air advection [45]. There is no doubt that these situations influence mountainous areas the same as low altitudes. That was confirmed by [4,14,30], and we confirmed that in Figure 5. Besides, in such a geographically heterogeneous region, drought occurs (especially hydrological droughts), also related to winter snow regime and spring air temperatures, mainly in mountainous areas. In this context, our results showed significantly increasing humid trends in January and insignificantly increasing trends in December. That could imply a better snow regime in mountainous areas. However, [46,47] argue that because of the rising air temperature in mountain regions during winter, these trends are instead linked with increasing water discharge from the river basins. That has a paradoxically negative influence on drought regimes in the cold part of the year and early spring. However, these drought aspects are beyond the scope of our investigation. We leave these aspects for further studies.
The most pronounced pattern that applies to almost all stations with two exceptions was a significant increasing trend of both indices in July. This is possibly linked to the increase of atmospheric convective activity in the hottest month [48]. Although this could imply that this could have a possible effect related to lowering drought risk in the region, some authors [48,49,50] argue that this convective precipitation situation in summer has a rather torrential character that leads to fast water discharge and flash floods and an insignificant influence on increasing soil and groundwater supplies. We argue that this has to be taken into account when considering the results of our investigation. Another result we would like to address is insignificant trends toward drier conditions in April and May.
Interestingly, all the stations had decreasing trends in these two months. Although these trends were insignificant, we would like to highlight this general trend, since April and May are the most crucial months for agricultural and forestry activities in the landscape [51]. Similar results were indicated in [14,24]. We argue that this fact should be an objective for further investigation of the highest priority.
CRD plots detected no abrupt changes in time series of the SPIs and SPEIs. Although there were some signals of sub-trends, based on the CRD methodology [42], we cannot reliably state that these signs are relevant. Constructed CRD plots, therefore, clearly confirmed analyses of linear trends tested in Section 3.1. In comparison to the results of previous research, it is interesting that CRD analyses of the SPEI for north of the Danube lowland (Požitavie region—50 km west of our study area) revealed a distinct negative trend direction [14], opposite to our findings. Based on this, it seems that climatic conditions in the inner Carpathian region in the context of drought and drought evolution in terms of ongoing climate change will have a very different course. That should be, however, the subject of further research interest.
Our results finally led to the construction of the drought risk map based on drought trends along the altitudinal gradient, since we found that drought trends correlated with altitude within the studied region. Our hypothesis is based on the assumption that at stations that showed no trends based on the 12-month SPEI, there exists a strong assumption that continual rising air temperatures in the coming decades will increase the frequency of droughts and thus lead to arid trends. Our hypothesis is supported by previous results [14], which clearly showed how increasing air temperature leads to an intensification of drought effects and its higher frequency due to increased evapotranspiration. We understand that this map simplifies some geographical aspects which could have a local influence on the drought patterns. However, the general overview of the drought risk spatial distribution over the region is clearly described.
Based on this prerequisite, we identified as drought-prone areas all altitudes up to 901 m a.s.l. (elevation of the Telgárt climatological station). The map is depicted as the most drought-prone agricultural lands situated in valleys of the Hron river and the Slatina river [51]. Forest ecosystems characterized as mixed forest [52] also fall to the drought-prone areas. In these forests, there are widely abundant European spruce, relatively drought-sensitive species [53,54]. That has to be taken into consideration in forest management of the area. Another fact that we suggest as an objective for further investigation is hydrological analyses focused primarily on the basin of the Neresnica river located in the south of the studied area. Besides other rivers in the area, only this river has a source area solely in the identified drought-prone area.
We argue that such a map, although simple, was missing until now and as the first attempt for regional-based mitigation and adaptation measures by local authorities, is sufficient. We understand the need to improve the map in a future investigation in terms of the incorporation of all possible geographical–climatological aspects.
Author Contributions
Conceptualization, J.V.; methodology, J.V.; software, J.V.; validation, J.V.; formal analysis, J.V.; investigation, J.V. and P.N.; data curation, J.V.; writing—original draft preparation, J.V. and P.N.; writing—review and editing, J.V. and P.N.; visualization, J.V. and P.N.; supervision, J.V. All authors have read and agreed to the published version of the manuscript.
Funding
This research was funded by VEGA research projects funded by the Science Grant Agency of the Ministry of Education, Science, Research and Sport of the Slovak Republic No. 1/0370/18 and by the Slovak Research and Development Agency under the contract No. APVV-18-0347, APVV-19-0340, and APVV-19-0183.
Conflicts of Interest
The authors declare no conflict of interest.
References
- Lindner, M.; Fitzgerald, J.B.; Zimmermann, N.E.; Reyer, C.; Delzon, S.; Van Der Maaten, E.; Schelhaas, M.-J.; Lasch, P.; Eggers, J.; Van Der Maaten-Theunissen, M.; et al. Climate change and European forests: What do we know, what are the uncertainties, and what are the implications for forest management? J. Environ. Manag. 2014, 146, 69–83. [Google Scholar] [CrossRef] [Green Version]
- Andrade, C.; Leite, S.M.; Santos, J.A. Temperature extremes in Europe: Overview of their driving atmospheric patterns. Nat. Hazards Earth Syst. Sci. 2012, 12, 1671–1691. [Google Scholar] [CrossRef] [Green Version]
- Blauhut, V.; Stahl, K.; Stagge, J.H.; Tallaksen, L.M.; De Stefano, L.; Vogt, J.V. Estimating drought risk across Europe from reported drought impacts, drought indices, and vulnerability factors. Hydrol. Earth Syst. Sci. 2016, 20, 2779–2800. [Google Scholar] [CrossRef] [Green Version]
- Gobiet, A.; Kotlarski, S.; Beniston, M.; Heinrich, G.; Rajczak, J.; Stoffel, M. 21st century climate change in the European Alps—A review. Sci. Total. Environ. 2014, 493, 1138–1151. [Google Scholar] [CrossRef]
- Ruffault, J.; Martin-StPaul, N.K.; Duffet, C.; Goge, F.; Mouillot, F. Projecting future drought in Mediterranean forests: Bias correction of climate models matters! Theor. Appl. Clim. 2013, 117, 113–122. [Google Scholar] [CrossRef]
- Stagge, J.H.; Kingston, D.G.; Tallaksen, L.M.; Hannah, D.M. Observed drought indices show increasing divergence across Europe. Sci. Rep. 2017, 7, 14045. [Google Scholar] [CrossRef] [PubMed]
- Vicente-Serrano, S.M.; Lopez-Moreno, J.-I.; Beguería, S.; Lorenzo-Lacruz, J.; Sanchez-Lorenzo, A.; García-Ruiz, J.M.; Azorin-Molina, C.; Morán-Tejeda, E.; Revuelto, J.; Trigo, R.; et al. Evidence of increasing drought severity caused by temperature rise in southern Europe. Environ. Res. Lett. 2014, 9, 044001. [Google Scholar] [CrossRef]
- Trnka, M.; Balek, J.; Štěpánek, P.; Zahradníček, P.; Možný, M.; Eitzinger, J.; Žalud, Z.; Formayer, H.; Turňa, M.; Nejedlík, P.; et al. Drought trends over part of Central Europe between 1961 and 2014. Clim. Res. 2016, 70, 143–160. [Google Scholar] [CrossRef] [Green Version]
- Spinoni, J.; Naumann, G.; Vogt, J. Spatio-temporal seasonal drought patterns in Europe from 1950 to 2015. EGU Gen. Assem. 2016, 18, 12268. [Google Scholar]
- Alfieri, L.; Burek, P.; Feyen, L.; Forzieri, G. Global warming increases the frequency of river floods in Europe. Hydrol. Earth Syst. Sci. 2015, 19, 2247–2260. [Google Scholar] [CrossRef] [Green Version]
- Dai, A. Increasing drought under global warming in observations and models. Nat. Clim. Chang. 2012, 3, 52–58. [Google Scholar] [CrossRef]
- Twardosz, R.; Cezak, U.K. Thermal anomalies in the Mediterranean and in Asia Minor (1951–2010). Int. J. Glob. Warm. 2019, 18, 304. [Google Scholar] [CrossRef]
- Vicente-Serrano, S.M.; García-Herrera, R.; Barriopedro, D.; Azorin-Molina, C.; López-Moreno, J.I.; Martín-Hernández, N.; Tomás-Burguera, M.; Gimeno, L.; Nieto, R. The Westerly Index as complementary indicator of the North Atlantic oscillation in explaining drought variability across Europe. Clim. Dyn. 2015, 47, 845–863. [Google Scholar] [CrossRef] [Green Version]
- Vido, J.; Nalevanková, P.; Valach, J.; Šustek, Z.; Tadesse, T. Drought Analyses of the Horné Požitavie Region (Slovakia) in the Period 1966–2013. Adv. Meteorol. 2019, 2019, 1–10. [Google Scholar] [CrossRef]
- Škvarenina, J.; Tomlain, J.; Hrvol’, J.; Škvareninová, J.; Nejedlík, P. Progress in dryness and wetness parameters in altitudinal vegetation stages of West Carpathians: Time-series analysis 1951–2007. Idojaras 2009, 113, 47–54. [Google Scholar]
- Miklós, L.; Hrnčiarová, T. Atlas Krajiny Slovenskej Republiky [Landscape Atlas of the Slovak Republic]; Ministry of Environment of the Slovak Republic, Slovak Agency of Environment: Basnská Bystrica, Slovak, 2002. [Google Scholar]
- Zeleňáková, M.; Purcz, P.; Blišťan, P.; Vranayová, Z.; Hlavatá, H.; Diaconu, D.C.; Portela, M.M. Trends in Precipitation and Temperatures in Eastern Slovakia (1962–2014). Water 2018, 10, 727. [Google Scholar] [CrossRef] [Green Version]
- Bartholy, J.; Pongrácz, R.; Gelybó, G.; Kern, A. What Climate Can We Expect in Central/Eastern Europe by 2071–2100? BT-Bioclimatology and Natural Hazards. In Bioclimatology and Natural Hazards; Střelcová, K., Mátyás, C., Kleidon, A., Lapin, M., Matejka, F., Blaženec, M., Škvarenina, J., Holécy, J., Eds.; Springer: Dordrecht, The Netherlands, 2009; pp. 3–14. [Google Scholar]
- Škvarenina, J.; Tomlain, J.; Hrvol’, J.; Škvareninová, J. Occurrence of Dry and Wet Periods in Altitudinal Vegetation Stages of West Carpathians in Slovakia: Time-Series Analysis 1951–2005 BT-Bioclimatology and Natural Hazards. In Bioclimatology and Natural Hazards; Střelcová, K., Mátyás, C., Kleidon, A., Lapin, M., Matejka, F., Blaženec, M., Škvarenina, J., Holécy, J., Eds.; Springer: Dordrecht, The Netherlands, 2009; pp. 97–106. [Google Scholar]
- Melo, M.; Lapin, M.; Kapolková, H.; Pecho, J.; Kružicová, A. Climate Trends in the Slovak Part of the Carpathians BT-The Carpathians: Integrating Nature and Society Towards Sustainability. In Bioclimatology and Natural Hazards; Kozak, J., Ostapowicz, K., Bytnerowicz, A., Wyżga, B., Eds.; Springer: Berlin/Heidelberg, Germany, 2013; pp. 131–150. [Google Scholar]
- Melo, M.; Lapin, M.; Damborská, I. Shifts in Climatic Regions in Mountain Parts of Slovakia. Sustain. Dev. Bioclimate 2009, 42–43. [Google Scholar] [CrossRef] [Green Version]
- Zlatník, A. Lesnícka Fytológia Forestry Phytology; SZN: Praha, Czech Republic, 1976. [Google Scholar]
- Vilček, J.; Škvarenina, J.; Vido, J.; Nalevanková, P.; Kandrík, R.; Škvareninová, J. Minimal change of thermal continentality in Slovakia within the period 1961–2013. Earth Syst. Dyn. 2016, 7, 735–744. [Google Scholar] [CrossRef] [Green Version]
- Zeleňáková, M.; Vido, J.; Portela, M.C.A.S.; Purcz, P.; Blišťan, P.; Hlavatá, H.; Hluštík, P. Precipitation Trends over Slovakia in the Period 1981–2013. Water 2017, 9, 922. [Google Scholar] [CrossRef] [Green Version]
- Briedoň, V. Ein Beitrag zum Problem der Niederschlagesabhängigkeit von der Seehohe im Tschechoslowakischen Karpatengebiet. In Príspevok k Meteorológii Karpát Contribution to Carpathian Meteorology; Konček, M., Ed.; Slovenská Akadémia Vied Slovak Academy of Sciences: Bratislava, Slovakia, 1961; pp. 212–220. [Google Scholar]
- Bochníček, O. Klimatický atlas Slovenska Climate atlas of Slovakia; Slovenský Hydrometeorologický ústav Slovak Hydrometeorological Institue: Bratislava, Slovakia, 2015. [Google Scholar]
- Škvarenina, J.; Vido, J.; Minďaš, J.; Střelcová, K.; Škvareninová, J.; Fleischer, P.; Bošeľa, M. Globálne zmeny klímy a lesné Ekosystémy Climate Change and Forest Ecosystems; Technická univerzita vo Zvolene Technical University in Zvolen: Zvolen, Slovakia, 2018. [Google Scholar]
- SHMI. Report Containing Additional In-Formation with Respect to the Implementation of the GCOS Plan, Following the Established Reporting Guidelines FCCC/SBSTA/2007/L.14; Slovak Hydrometeorological Institute: Bratislava, Slovakia, 2008; p. 210. [Google Scholar]
- Vido, J.; Střelcová, K.; Nalevanková, P.; Leštianska, A.; Kandrík, R.; Pástorová, A.; Škvarenina, J.; Tadesse, T. Identifying the relationships of climate and physiological responses of a beech forest using the Standardised Precipitation Index: A case study for Slovakia. J. Hydrol. Hydromech. 2016, 64, 246–251. [Google Scholar] [CrossRef] [Green Version]
- Vido, J.; Tadesse, T.; Šustek, Z.; Kandrík, R.; Hanzelová, M.; Škvarenina, J.; Škvareninová, J.; Hayes, M. Drought Occurrence in Central European Mountainous Region (Tatra National Park, Slovakia) within the Period 1961–2010. Adv. Meteorol. 2015, 2015, 1–8. [Google Scholar] [CrossRef] [Green Version]
- Šustek, Z.; Vido, J.; Škvareninová, J.; Skvarenina, J.; Surda, P. Drought impact on ground beetle assemblages (Coleoptera, Carabidae) in Norway spruce forests with different management after windstorm damage—A case study from Tatra Mts. (Slovakia). J. Hydrol. Hydromech. 2017, 65, 333–342. [Google Scholar] [CrossRef] [Green Version]
- McKee, T.B.; Doesken, N.J.; Kleist, J. The relationship of drought frequency and duration to time scales. In Proceedings of the 8th Conference on Applied Climatology, Anaheim, CA, USA, 17–22 January 1993; pp. 179–183. [Google Scholar]
- Edwards, D.C. Characteristics of 20th Century Drought in the United States at Multiple Time Scales; Climatology Report No. 97-2. Atmospheric Science Paper No. 634; Colorado State University: Fort Collins, CO, USA, 1997; p. 155. 155p. [Google Scholar]
- Hayes, M.J.; Svoboda, M.D.; Wilhite, D.A.; Vanyarkho, O.V. Monitoring the 1996 Drought Using the Standardized Precipitation Index. Bull. Am. Meteorol. Soc. 1999, 80, 430–438. Available online: http://digitalcommons.unl.edu/droughtfacpubhttp://digitalcommons.unl.edu/droughtfacpub/31 (accessed on 6 June 2020). [CrossRef] [Green Version]
- Bak, B.; Labedzki, L. Assessing drought severity with the relative precipitation index [RPI] and the standardised precipitation index [SPI]. J. Water Land Dev. 2002, 6, 89–105. [Google Scholar]
- Tirivarombo, S.; Osupile, D.; Eliasson, P. Drought monitoring and analysis: Standardised Precipitation Evapotranspiration Index (SPEI) and Standardised Precipitation Index (SPI). Phys. Chem. Earth, Parts A/B/C 2018, 106, 1–10. [Google Scholar] [CrossRef]
- Heim, R.R. A Review of Twentieth-Century Drought Indices Used in the United States. Bull. Am. Meteorol. Soc. 2002, 83, 1149–1166. [Google Scholar] [CrossRef] [Green Version]
- Vicente-Serrano, S.M.; Beguería, S.; López-Moreno, J.I. A Multiscalar Drought Index Sensitive to Global Warming: The Standardized Precipitation Evapotranspiration Index. J. Clim. 2010, 23, 1696–1718. [Google Scholar] [CrossRef] [Green Version]
- Thornthwaite, C.W. An approach toward a rational classification of climate. Geogr. Rev. 1948, 38, 55–94. [Google Scholar] [CrossRef]
- Yue, S.; Wang, C. The Mann-Kendall Test Modified by Effective Sample Size to Detect Trend in Serially Correlated Hydrological Series. Water Resour. Manag. 2004, 18, 201–218. [Google Scholar] [CrossRef]
- Onyutha, C. Influence of Hydrological Model Selection on Simulation of Moderate and Extreme Flow Events: A Case Study of the Blue Nile Basin. Adv. Meteorol. 2016, 2016, 1–28. [Google Scholar] [CrossRef] [Green Version]
- Onyutha, C. Statistical Uncertainty in Hydrometeorological Trend Analyses. Adv. Meteorol. 2016, 2016, 1–26. [Google Scholar] [CrossRef] [Green Version]
- Gudmundsson, L.; I Seneviratne, S. Anthropogenic climate change affects meteorological drought risk in Europe. Environ. Res. Lett. 2016, 11, 044005. [Google Scholar] [CrossRef]
- Lapin, M.; Gera, M.; Hrvol’, J.; Melo, M.; Tomlain, J. Possible impacts of climate change on hydrologic cycle in Slovakia and results of observations in 1951–2007. Biologia 2009, 64, 454–459. [Google Scholar] [CrossRef]
- Ionita, M.; Tallaksen, L.M.; Kingston, D.G.; Stagge, J.H.; Laaha, G.; Van Lanen, H.A.J.; Scholz, P.; Chelcea, S.M.; Haslinger, K. The European 2015 drought from a climatological perspective. Hydrol. Earth Syst. Sci. 2017, 21, 1397–1419. [Google Scholar] [CrossRef] [Green Version]
- Hríbik, M.; Majlingová, A.; Škvarenina, J.; Kyselová, D. Winter Snow Supply in Small Mountain Watershed as a Potential Hazard of Spring Flood Formation BT-Bioclimatology and Natural Hazards. In Bioclimatology and Natural Hazards; Střelcová, K., Mátyás, C., Kleidon, A., Lapin, M., Matejka, F., Blaženec, M., Škvarenina, J., Holécy, J., Eds.; Springer: Dordrecht, The Netherlands, 2009; pp. 119–128. [Google Scholar]
- Sleziak, P.; Szolgay, J.; Hlavčová, K.; Parajka, J. The Impact of the Variability of Precipitation and Temperatures on the Efficiency of a Conceptual Rainfall-Runoff Model. Slovak J. Civ. Eng. 2016, 24, 1–7. [Google Scholar] [CrossRef] [Green Version]
- Marzen, M.; Iserloh, T.; De Lima, J.L.; Fister, W.; Ries, J.B. Impact of severe rain storms on soil erosion: Experimental evaluation of wind-driven rain and its implications for natural hazard management. Sci. Total. Environ. 2017, 590–591, 502–513. [Google Scholar] [CrossRef]
- Hlavčová, K.; Kohnová, S.; Borga, M.; Horvát, O.; Šťastný, P.; Pekárová, P.; Majerčáková, O.; Danáčová, Z. Post-event analysis and flash flood hydrology in Slovakia. J. Hydrol. Hydromech. 2016, 64, 304–315. [Google Scholar] [CrossRef] [Green Version]
- Millan, M.M. Extreme hydrometeorological events and climate change predictions in Europe. J. Hydrol. 2014, 518, 206–224. [Google Scholar] [CrossRef]
- Šiška, B.; Takáč, J. Drought analyses of agricultural regions as influenced by climatic conditions in the Slovak Republic. Idojárás 2009, 13, 135–143. [Google Scholar]
- Střelcová, K.; Kučera, J.; Fleischer, P.; Giorgi, S.; Gömöryová, E.; Škvarenina, J.; Ditmarová, L. Canopy transpiration of mountain mixed forest as a function of environmental conditions in boundary layer. Biologia 2009, 64, 507–511. [Google Scholar] [CrossRef] [Green Version]
- Solberg, S. Summer drought: A driver for crown condition and mortality of Norway spruce in Norway. For. Pathol. 2004, 34, 93–104. [Google Scholar] [CrossRef]
- Ďurský, J.; Škvarenina, J.; Minďáš, J.; Miková, A. Regional analysis of climate change impact on Norway spruce (Picea abies L. Karst.) growth in Slovak mountain forests. J. For. Sci. 2006, 52, 306–315. Available online: http://www.scopus.com/inward/record.url?eid=2-s2.0-33746599991&partnerID=40 (accessed on 6 June 2020).
Figure 1.
The river basin of the Upper Hron river and its localization within Slovakia and Europe.

Figure 2.
Temporal course of one-month SPI with the linear trend of the time series. Letter (a) refers to climatological station Sliač, (b) station Vígľaš-Pstruša, (c) station Banská Bystrica, (d) station Brezno, (e) station Telgárt, (f) station Lom nad Rimavicou. The dashed line represents the linear trend line.

Figure 3.
Temporal course of a twelve-month SPI with the linear trend of the time series. Letter (a) refers to climatological station Sliač, (b) station Vígľaš-Pstruša, (c) station Banská Bystrica, (d) station Brezno, (e) station Telgárt, (f) station Lom nad Rimavicou. The dashed line represents the linear trend line.

Figure 4.
Temporal course of a one-month SPEI with the linear trend of the time series. Letter (a) refers to climatological station Sliač, (b) station Vígľaš-Pstruša, (c) station Banská Bystrica, (d) station Brezno, (e) station Telgárt, (f) station Lom nad Rimavicou. The dashed line represents the linear trend line.

Figure 5.
Temporal course of a twelve-month SPEI with the linear trend of the time series. Letter (a) refers to climatological station Sliač, (b) station Vígľaš-Pstruša, (c) station Banská Bystrica, (d) station Brezno, (e) station Telgárt, (f) station Lom nad Rimavicou. The dashed line represents the linear trend line.

Figure 6.
CRD plot of the SPI for one month (left) and twelve months (right) within the studied period 1984–2014. Letter (a) refers to climatological station Sliač, (b) station Vígľaš-Pstruša, (c) station Banská Bystrica, (d) station Brezno, (e) station Telgárt, (f) station Lom nad Rimavicou. The red arrow indicates a positive trend direction.

Figure 7.
CRD plot of the SPEI for one month (left) and twelve months (right) within the studied period 1984–2014. Letter (a) refers to climatological station Sliač, (b) station Vígľaš-Pstruša, (c) station Banská Bystrica, (d) station Brezno, (e) station Telgárt, (f) station Lom nad Rimavicou. The red arrow indicates a positive trend direction.

Figure 8.
Spatial identification of the areas with lower drought risk and relatively drought-prone areas based on the drought indices’ temporal evolution.
Figure 8.
Spatial identification of the areas with lower drought risk and relatively drought-prone areas based on the drought indices’ temporal evolution.


Table 1.
Climatological stations of the Slovak Hydrometeorological Institute (SHMI) used in the study with mean monthly air temperature and precipitation totals based on the period 1984–2014.
Table 1.
Climatological stations of the Slovak Hydrometeorological Institute (SHMI) used in the study with mean monthly air temperature and precipitation totals based on the period 1984–2014.
| Station Name | Jan. | Feb. | Mar. | Apr. | May | Jun. | Jul. | Aug. | Sep. | Oct. | Nov. | Dec. | |
|---|---|---|---|---|---|---|---|---|---|---|---|---|---|
| Sliač | WMO index 11903; | Altitude 313 m a.s.l.; | Latitude [φ] 48°38′33″; | Longitude [λ] 19°08′31″ | |||||||||
| Precipitation [mm] | 44.7 | 41.6 | 42.5 | 47.7 | 65.2 | 83.5 | 72.6 | 67.5 | 54.7 | 54.0 | 63.8 | 56.0 | |
| Temperature [°C] | −3.3 | −1.2 | 3.3 | 9.1 | 14.0 | 17.2 | 18.9 | 18.1 | 13.7 | 8.6 | 3.4 | −1.9 | |
| Vígľaš- | WMO index 11904; | Altitude 368 m a.s.l.; | Latitude [φ] 48°32′39″; | Longitude [λ] 19°19′19″ | |||||||||
| Pstruša | Precipitation [mm] | 31.5 | 30.9 | 31.6 | 46.1 | 70.1 | 85.4 | 73.1 | 62.1 | 50.8 | 47.3 | 53.6 | 44.2 |
| Temperature [°C] | −3.4 | −1.2 | 3.2 | 8.7 | 13.5 | 16.5 | 18.1 | 17.6 | 13.4 | 8.3 | 3.3 | −1.9 | |
| Banská | WMO index 11898; | Altitude 427 m a.s.l.; | Latitude [φ] 48°44′01″; | Longitude [λ] 19°07′01″ | |||||||||
| Bystrica | Precipitation [mm] | 55.9 | 51.4 | 52.4 | 55.9 | 82.1 | 89.3 | 81.4 | 71.0 | 62.2 | 66.0 | 80.4 | 71.1 |
| Temperature [°C] | −2.5 | −0.6 | 3.3 | 9.1 | 13.8 | 16.8 | 18.4 | 17.8 | 13.5 | 8.6 | 3.6 | −1.3 | |
| Brezno | WMO index 11917; | Altitude 487 m a.s.l.; | Latitude [φ] 48°48′06″; | Longitude [λ] 19°38′14″ | |||||||||
| Precipitation [mm] | 41.7 | 39.6 | 45.3 | 51.4 | 88.4 | 98.7 | 96.1 | 81.0 | 59.5 | 56.8 | 56.5 | 50.1 | |
| Temperature [°C] | −3.7 | −2.0 | 2.3 | 8.3 | 13.3 | 16.4 | 18.2 | 17.3 | 12.6 | 7.7 | 2.7 | −2.5 | |
| Telgárt | WMO index 11938; | Altitude 901 m a.s.l.; | Latitude [φ] 48°50′55″; | Longitude [λ] 20°11′21″ | |||||||||
| Precipitation [mm] | 33.6 | 40.6 | 41.9 | 63.1 | 113 | 121 | 92.6 | 87.1 | 60.6 | 63.3 | 70.7 | 42.2 | |
| Temperature [°C] | −5.3 | −4.0 | −0.5 | 4.5 | 9.6 | 12.6 | 14.3 | 13.6 | 10.2 | 5.7 | 0.3 | −4.0 | |
| Lom nad | WMO index 11910; | Altitude 1018 m a.s.l.; | Latitude [φ] 48°39′38″; | Longitude [λ] 19°39′57″ | |||||||||
| Rimavicou | Precipitation [mm] | 48.7 | 56.4 | 51.8 | 64.2 | 100 | 124 | 99.5 | 96.4 | 64.6 | 74.8 | 87.2 | 66.8 |
| Temperature [°C] | −5.4 | −4.1 | −0.6 | 4.3 | 9.7 | 12.6 | 14.5 | 13.9 | 10.3 | 5.6 | 0.3 | −4.0 | |
Table 2.
Trend indicators of time series 1984–2014 for studied stations.
| Station Name | SPI 1m | SPI 12m | SPEI 1m | SPEI 12m |
|---|---|---|---|---|
| Sliač | – | ▲ | – | – |
| p-value | 0.249 | 0.000 | 0.989 | 0.71 |
| Vígľaš-Pstruša | – | ▲ | – | – |
| p-value | 0.145 | <0.0001 | 0.946 | 0.862 |
| Banská Bystrica | – | ▲ | – | – |
| p-value | 0.109 | <0.0001 | 0.752 | 0.083 |
| Brezno | – | ▲ | – | – |
| p-value | 0.183 | <0.0001 | 0.823 | 0.217 |
| Telgárt | ▲ | ▲ | – | ▲ |
| p-value | 0.021 | <0.0001 | 0.161 | <0.0001 |
| Lom nad Rimavicou | ▲ | ▲ | – | ▲ |
| p-value | 0.023 | <0.0001 | 0.198 | <0.0001 |
▲ Significant rising trend toward wetter conditions (significance level α = 0.05), – No trend recorded.
Table 3.
Trend indicators of time series 1984–2014 for individual months at the studied stations.
| SPI (Standardised Precipitation Index) | ||||||||||||
| Station Name | Jan. | Feb. | Mar. | Apr. | May | Jun. | Jul. | Aug. | Sep. | Oct. | Nov. | Dec. |
| Sliač | ▲ | – | – | ▼ | ▼ | ▲ | ▲ | – | ▼ | – | ▼ | ▲ |
| p-value | 0.083 | 0.773 | 0.946 | 0.812 | 0.341 | 0.333 | 0.011 | 0.812 | 0.760 | 0.986 | 0.658 | 0.496 |
| Vígľaš-Pstruša | ▲ | ▲ | – | ▼ | ▼ | – | ▲ | – | – | ▲ | – | ▲ |
| p-value | 0.074 | 0.234 | 0.932 | 0.227 | 0.454 | 0.865 | 0.006 | 0.671 | 0.812 | 0.386 | 0.367 | 0.395 |
| Banská Bystrica | ▲ | ▲ | ▲ | ▼ | ▼ | – | ▲ | – | – | – | ▼ | ▲ |
| p-value | 0.004 | 0.683 | 0.518 | 0.529 | 0.292 | 0.540 | 0.004 | 0.671 | 1.000 | 0.878 | 0.734 | 0.465 |
| Brezno | ▲ | – | – | ▼ | ▼ | – | ▲ | ▲ | – | ▲ | ▼ | ▲ |
| p-value | 0.043 | 1.000 | 0.946 | 0.276 | 0.529 | 0.905 | 0.025 | 0.598 | 1.000 | 0.646 | 0.598 | 0.367 |
| Telgárt | ▲ | – | – | ▼ | ▼ | ▲ | ▲ | ▲ | ▲ | ▲ | – | ▲ |
| p-value | 0.110 | 0.799 | 0.812 | 0.434 | 0.405 | 0.118 | 0.004 | 0.359 | 0.825 | 0.367 | 0.852 | 0.385 |
| Lom nad Rimavicou | ▲ | ▲ | ▲ | ▼ | ▼ | – | ▲ | – | ▲ | ▲ | – | ▲ |
| p-value | 0.036 | 0.773 | 0.308 | 0.496 | 0.316 | 1.000 | 0.024 | 0.878 | 0.734 | 0.563 | 1.000 | 0.316 |
| SPEI (Standardised Precipitation Evapotranspiration Index) | ||||||||||||
| Station Name | Jan. | Feb. | Mar. | Apr. | May | Jun. | Jul. | Aug. | Sep. | Oct. | Nov. | Dec. |
| Sliač | ▲ | – | – | ▼ | ▼ | ▲ | ▲ | ▼ | ▼ | – | ▼ | ▲ |
| p-value | 0.096 | 0.919 | 0.812 | 0.234 | 0.292 | 0.892 | 0.069 | 0.465 | 0.622 | 0.973 | 0.191 | 0.454 |
| Vígľaš-Pstruša | ▲ | ▲ | ▲ | ▼ | ▼ | – | ▲ | – | – | – | – | ▲ |
| p-value | 0.004 | 0.683 | 0.518 | 0.529 | 0.292 | 0.540 | 0.004 | 0.671 | 1.000 | 0.878 | 0.734 | 0.465 |
| Banská Bystrica | ▲ | ▲ | – | ▼ | ▼ | ▼ | ▲ | ▼ | ▼ | – | ▼ | ▲ |
| p-value | 0.004 | 0.598 | 0.892 | 0.234 | 0.227 | 0.507 | 0.040 | 0.518 | 0.825 | 0.919 | 0.865 | 0.529 |
| Brezno | ▲ | ▲ | ▼ | ▼ | ▼ | ▼ | ▲ | ▲ | ▲ | – | ▼ | ▲ |
| p-value | 0.034 | 0.886 | 0.844 | 0.058 | 0.643 | 0.682 | 0.087 | 0.872 | 0.592 | 0.901 | 0.225 | 0.605 |
| Telgárt | ▲ | – | ▲ | ▼ | ▼ | ▲ | ▲ | ▲ | – | ▲ | ▼ | ▲ |
| p-value | 0.110 | 0.773 | 0.878 | 0.341 | 0.350 | 0.350 | 0.014 | 0.658 | 0.959 | 0.444 | 0.760 | 0.385 |
| Lom nad Rimavicou | ▲ | ▲ | ▲ | ▼ | ▼ | ▼ | ▲ | – | – | ▲ | – | ▲ |
| p-value | 0.036 | 0.721 | 0.563 | 0.158 | 0.341 | 0.575 | 0.045 | 0.658 | 0.747 | 0.696 | 0.721 | 0.316 |
▲ trend toward wetter conditions, ▼ trend toward drier conditions, – no trend, grey shaded cells imply the statistical significance of the trend (significance level α = 0.05).
Publisher’s Note: MDPI stays neutral with regard to jurisdictional claims in published maps and institutional affiliations. |
© 2020 by the authors. Licensee MDPI, Basel, Switzerland. This article is an open access article distributed under the terms and conditions of the Creative Commons Attribution (CC BY) license (http://creativecommons.org/licenses/by/4.0/).
Share and Cite
MDPI and ACS Style
Vido, J.; Nalevanková, P. Drought in the Upper Hron Region (Slovakia) between the Years 1984–2014. Water 2020, 12, 2887. https://doi.org/10.3390/w12102887
AMA Style
Vido J, Nalevanková P. Drought in the Upper Hron Region (Slovakia) between the Years 1984–2014. Water. 2020; 12(10):2887. https://doi.org/10.3390/w12102887
Chicago/Turabian StyleVido, Jaroslav, and Paulína Nalevanková. 2020. "Drought in the Upper Hron Region (Slovakia) between the Years 1984–2014" Water 12, no. 10: 2887. https://doi.org/10.3390/w12102887
Note that from the first issue of 2016, this journal uses article numbers instead of page numbers. See further details here.