Mass and Heat Balance of a Lake Ice Cover in the Central Asian Arid Climate Zone
by
 , , and
Peng Lu
1, 
Xiaowei Cao
1,
Guoyu Li
2,*,
Wenfeng Huang
3,
Matti Leppäranta
4,
Lauri Arvola
5,
Jussi Huotari
5 and
Zhijun Li
1,* 1
State Key Laboratory of Coastal and Offshore Engineering, Dalian University of Technology, Dalian 116023, China
2
Northwest Institute of Eco-Environment and Resources, Chinese Academy of Sciences, Lanzhou 730000, China
3
Key Laboratory of Subsurface Hydrology and Ecological Effects in Arid Region of the Ministry of Education, School of Environmental Science and Engineering, Chang’an University, Xi’an 710054, China
4
Institute of Atmospheric and Earth Sciences, University of Helsinki, 00014 Helsinki, Finland
5
Ecosystems and Environment Research Programme, Faculty of Biological and Environmental Sciences, Lammi Biological Station, University of Helsinki, 16900 Lammi, Finland
*
Authors to whom correspondence should be addressed.
Water 2020, 12(10), 2888; https://doi.org/10.3390/w12102888
Submission received: 23 September 2020
/
Revised: 13 October 2020
/
Accepted: 14 October 2020
/
Published: 16 October 2020
(This article belongs to the Section Hydrology)
Abstract
:To improve the understanding of the seasonal evolution of the mass and heat budget of ice-covered lakes in the cold and arid climate zone, in-situ observations were collected during two winters (2016–2017 and 2017–2018) in Lake Wuliangsuhai, Inner Mongolia, China. The mean snow thickness was 5.2 and 1.6 cm in these winters, due to low winter precipitation. The mean ice thickness was 50.9 and 36.1 cm, and the ice growth rate was 3.6 and 2.1 mm day−1 at the lower boundary of ice. Analyses of mass and heat balance data from two winters revealed that the surface heat budget was governed by solar radiation and terrestrial radiation. The net heat flux loss of the ice was 9–22 W m−2, affected by the snow and ice thickness. Compared to boreal lakes, Lake Wuliangsuhai received more solar radiation and heat flux from the water. The ice temperature had a strong diurnal variation, which was produced by the diurnal cycles of solar radiation, and air and water temperatures. These results expand our knowledge of the evolution of mass and heat balance in temperate lakes of mid-latitude arid areas.
1. Introduction
Lakes with seasonal ice are a major component of the terrestrial landscape. They cover approximately 2% of the Earth’s land surface, and the majority are located in the Northern Hemisphere [1,2]. Compared to other high-latitude terrestrial surfaces, lakes have a higher evaporation rate [3] and less daily and nightly temperature variability. The ice season is a key part of the annual cycle of cold climate lakes, with impacts on both the regional climate and weather events, such as thermal moderation and the lake effect on snow accumulation [1,4]. The water temperature and salinity structure under the ice remains normally stable due to the lack of wind mixing and solar forcing until spring, but in mid-latitude arid climates, solar radiation may force convection throughout the winter. Therefore, water conditions in autumn may influence the start-up of the next open water season, including the spring bloom. Previous studies have shown that ice seasons have generally become milder, resulting in a shorter duration and thinner ice cover [5,6,7,8].
The evolution of lake ice cover is dictated by the radiation balance, turbulent heat exchange at the air–ice interface, and heat flux from the water to the ice bottom [9]. Sunlight transmittance can be higher in the ice cover than in the water because colored dissolved organic matter is mostly excluded from congelation ice [10,11,12,13]. However, the presence of an eventual snow cover always limits the penetration of solar radiation into the water due to its small optical thickness of 15–20 cm [14]. During the melting season, solar radiation plays a dominant role in warming the water beneath the ice [15].
Various studies on mass balance and heat budget in high latitude lakes have shown that the heat budget of the ice cover is governed by terrestrial radiation in the ice season [6,9]. Aslamov et al. [16] reported that the heat flow from water to ice is an important component of the heat budget in Lake Baikal. Leppäranta et al. [17] carried out field research in a medium-size Arctic tundra lake (Lake Kilpisjärvi) and reported that the melting of lake ice accelerated due to the positive albedo feedback and occurred both at the top and bottom surfaces and in the ice interior.
Lakes in the cold and arid climates of Central Asia are frozen for several months of the year. Their mass and heat budgets are different from polar and boreal lakes in many aspects. For example, incoming solar radiation is at a high level throughout winter, because the solar altitude is about 45° at noon with almost continuously sunny days, and the snow cover on ice is very thin or absent due to low winter precipitation. In recent years, research on ice-covered lakes has increased in Central Asia, and this has shed light on several new phenomena related to the limnology of freezing lakes, such as the thermal diffusion of ice in saline lakes [18], high-heat flux from water to ice in the central Qinghai–Tibet Plateau [19], and the impact of global warming associated with later ice-on and earlier ice-off dates in Qinghai Lake [20]. However, research on ice mass and heat balance in this specific region is still limited [21].
In order to investigate ice and under-ice processes in lakes in the arid regions of Central Asia, long-term field research was carried out in Lake Wuliangsuhai, Inner Mongolia during the winters between 2016 and 2018. Field observations of snow and ice thickness, surface heat balance, penetration of solar radiation into ice and water, and temperature distribution in ice and water were conducted. The present study addresses three main questions: (i) How does the ice and snow thickness develop during the winter? (ii) What is the main controlling factor in the process of lake ice growth and melting? (iii) How do strong incoming solar radiation and diurnal variation of air temperature affect the ice and heat balance?
2. Materials and Methods
2.1. Research Site
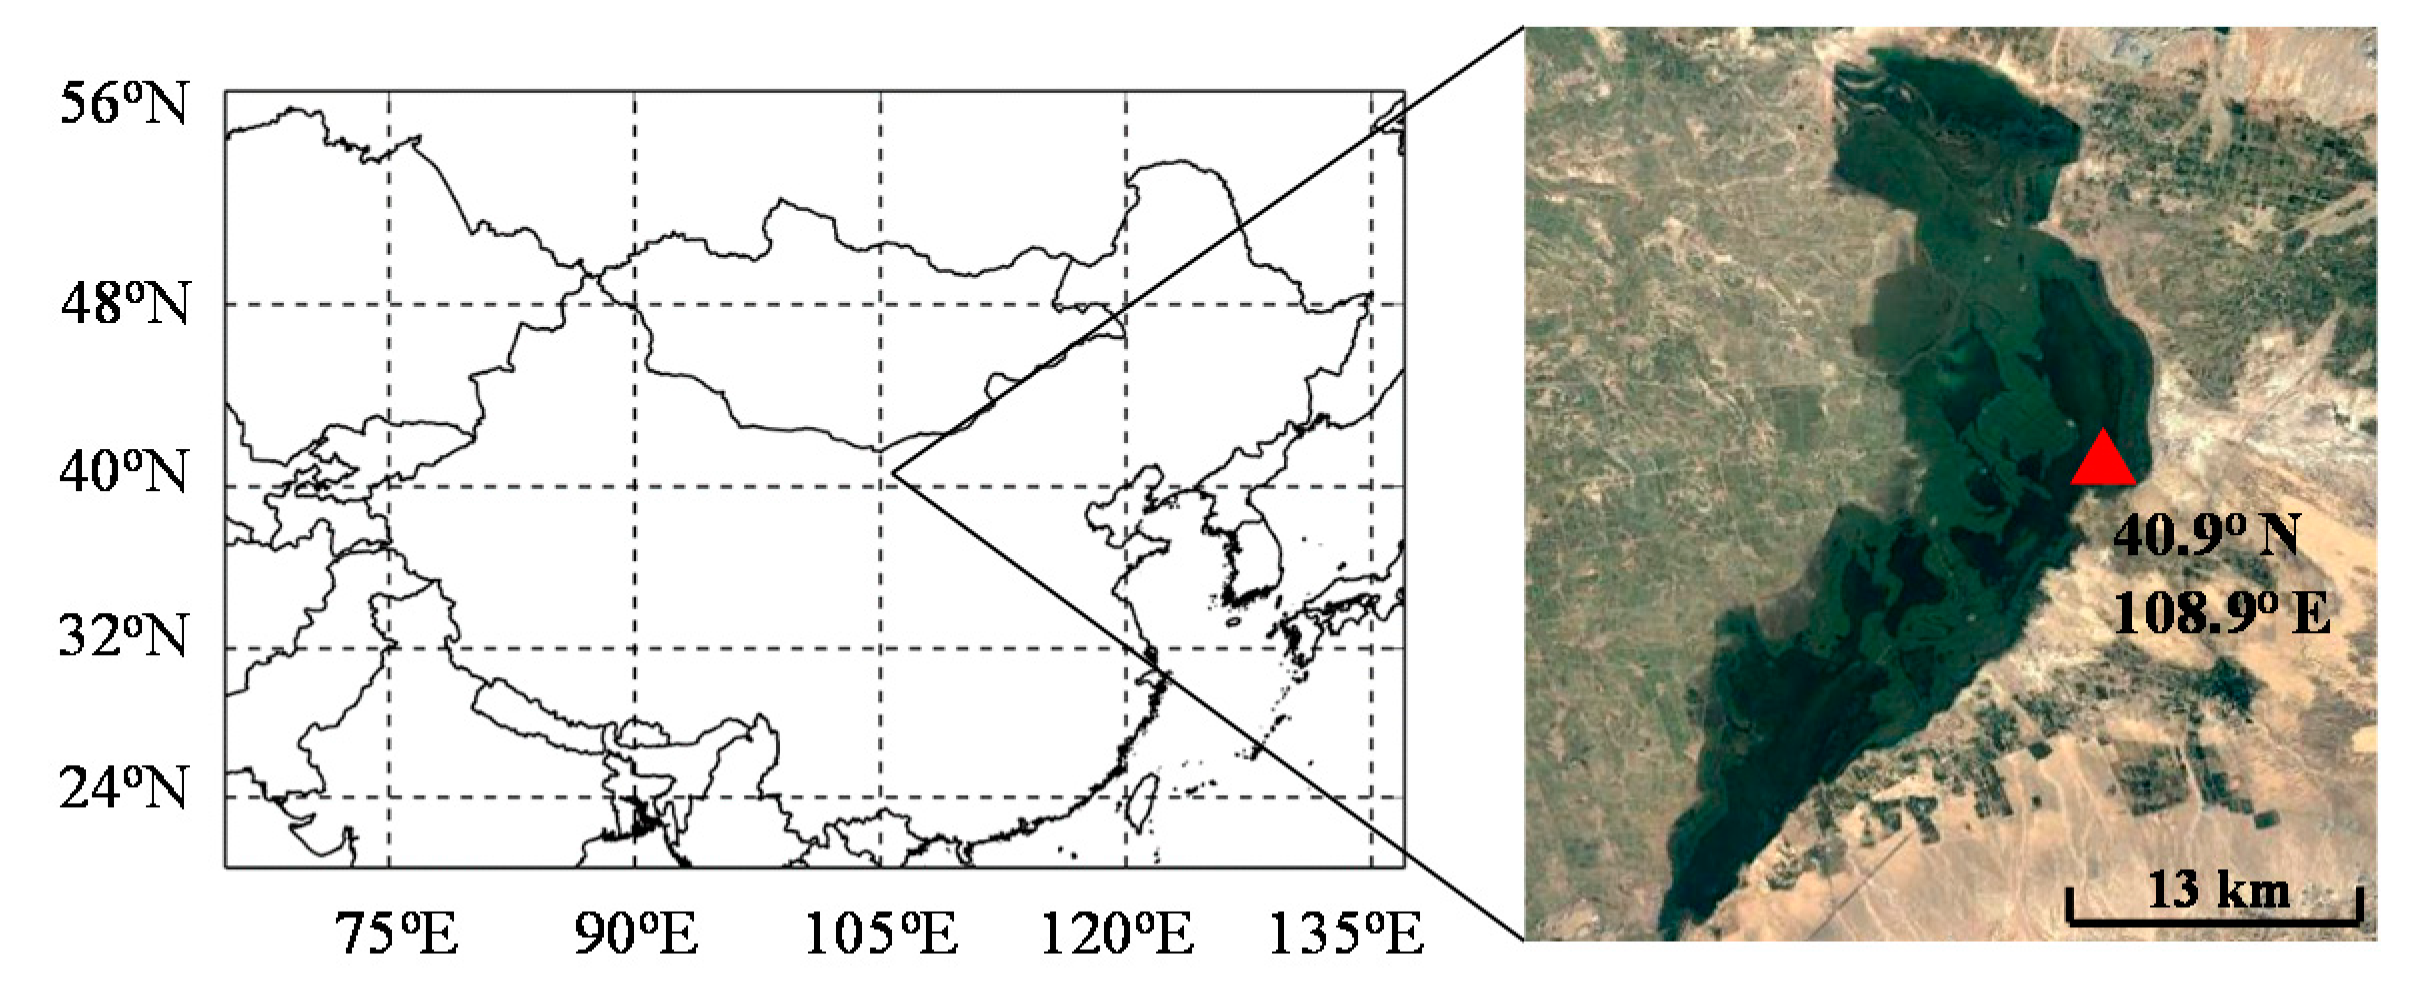
Lake Wuliangsuhai is located in Inner Mongolia, China, at 40°36′–41°30′ N, 108°43′–108°70′ E. The mean and maximum depths of the lake are 1.3 and 3 m, respectively. The lake covers a surface area of 306 km2, with a maximum length and width of 35.4 and 12.7 km, respectively. The annual mean air temperature is 7.5 °C and the annual precipitation is 220 mm, mainly occurring from June to September. The average annual maximum thickness of the ice is 0.63 m [22].
The fieldwork was carried out from January 1 to March 9 in 2017 and from January 9 to February 24 in 2018 (referred to as the winters of 2017 and 2018, hereafter). The study area was located in the eastern part of the lake (40.9° N, 108.9° E), 200 m from the shore (Figure 1). The water depth at the site was 1.7 m in 2017 and 1.4 m in 2018. The water level is normally controlled by water pumping and the variation seen in winter was negligible, because no inflow or outflow is allowed during the ice season [23].
2.2. Measurements
In-situ measurements were obtained for solar radiation, atmospheric surface layer (temperature, humidity, wind speed, and direction), snow and ice cover (radiative surface temperature, snow depth, ice thickness, vertical temperature distribution), and lake water body beneath the ice (temperature, solar radiation), and are summarized in Table 1
Global radiation was measured by two pyranometers, one for the incoming, and one for the outgoing radiation. The measurement band was 300–3000 nm and the accuracy of the sensors was 5% according to the manufacturer (http://www.jz322.net/prdouct_text.aspx?id=3630). Measurements of solar radiation beneath the ice were collected through Trios hyper-spectral radiometers (Rastede, Germany). These sensors detected the spectral irradiance over the 320–950 nm band under the ice at depths of 0.8 and 1.0 m from the ice surface.
Air temperature, wind speed and direction, and radiative surface temperature were measured by a weather station located about 20 m from the radiation site (Figure 2). The radiative surface temperature was detected by an infrared sensor placed 1.5 m above the ice surface. The humidity sensor was placed at an altitude of 1.5 m. The wind and air temperature sensors were placed at an altitude of 6 m in winter 2017 but at 2 m in winter 2018 (Figure 2b), because a simple frame was employed instead of the lifting tower, which was damaged in 2017.
Ice bottom depth was measured by an ultrasonic rangefinder [24] located 15 m away from the radiation sensor (Figure 2). This instrument is generally an exceptionally good estimator of ice thickness. Data on surface melting were obtained daily, measuring the vertical distance from a fixed position on the ice surface relative to the ultrasonic rangefinder. The snow thickness under the upwelling irradiance sensor was measured daily after snowfall using a ruler. The vertical temperature profile in ice and water was measured by platinum resistance temperature chains evenly spaced every 5 cm in ice and every 10 cm in water. The vertical ranges in ice and water were 60 and 100 cm in 2017 and 70 and 60 cm in 2018, respectively. Times presented here are China Standard Time, the local noon at the site in winter is within 12:45 ± 15 min.
2.3. Data Processing
The surface heat balance consists of the surface absorption of solar radiation, net longwave radiation, turbulent heat fluxes, and heat flux from precipitation. These fluxes sum into the surface heat gain parameter [2], which is defined as follows:
where is the surface absorption of solar radiation, is the net terrestrial radiation, is the turbulent sensible heat flux, is the latent heat flux, and is the precipitation heat flux. The last term is significant only in the presence of phase transitions, which were not present in this study.
The surface absorption of solar radiation is defined as:
where is the albedo, is the fraction transmitted through the near-surface layer, and is the incident solar radiation. Leppäranta [2] reported that the fraction , accounting for infrared radiation, is fairly stable and not sensitive to cloudiness or solar zenith angle.
The net terrestrial radiation was calculated as follows:
where is the ice surface temperature measured by the infrared sensor, is emissivity, is the Stefan–Boltzmann constant, is the air temperature, and the subscript z denotes the elevation. The ice surface emissivity () was 0.97 and the effective atmospheric emissivity (), which depends on humidity and cloudiness, was calculated as follows [2]:
where A and B are the clear sky parameters from Brunt’s equation (typically A = 0.68 and B = 0.036 mbar−0.5), is the water vapor pressure, C is the cloudiness coefficient (normal value is 0.18), and N is the cloudiness. In this study, cloudiness was estimated from the difference between the theoretical clear sky irradiance and the measured irradiance [9].
The turbulent heat fluxes ( and ) were calculated by the bulk formulae:
where is air density, is the specific heat of air, is the latent heat of evaporation or sublimation, and are the turbulent transfer coefficients of sensible and latent heat, and are the specific humidity of the surface and air, and is the wind speed. The transfer coefficients depend on the stability of the boundary layer and can be expressed as functions of the bulk Richardson number:
where g = 9.8 m s−2 is the acceleration due to gravity, and is a reference temperature (273.15 K). The transfer coefficients can be fully calculated using iterative methods, but for our purpose, a parametric approximation [25] is sufficient. This approach requires the use of the following equations:
where is the von Kármán constant, for heat fluxes, and is the roughness length. A typical value is 0.1 mm for a smooth ice surface. The neutral transfer coefficient is .
Absorption of solar radiation inside the ice was calculated as follows:
where is the downwelling irradiance reaching the ice bottom. In order to protect the sensor during long-term observations, measurements of the irradiance at the ice bottom were not taken continuously. Therefore, was estimated based on data collected by two Trios sensors located under the ice using the following equation [2]:
where is the irradiance at the Trios sensor depth (0.8 and 1.2 m), is the water attenuation coefficient, and is ice thickness.
At the bottom of the ice, the heat flux from ice growth/melting () and the conductive heat flux from the water body () must balance with the heat conduction released into the ice, as follows:
where is ice density, is the latent heat of freezing, is ice thickness, and are the thermal conductivities of water and ice, respectively.
The mass of the ice sheet changes at the lower boundary through freezing and melting (), and at the upper boundary through precipitation () and sublimation (). The mass balance of the ice cover in terms of water equivalent can be expressed as:
where represents the amount of lake water flooding the surface of the ice cover. In this dry region, , and was calculated as . and were estimated from the snow thickness and latent heat flux, respectively.
Internal melting is a very important process, and it can be greater or smaller than surface melting depending on ice quality and weather conditions [26]. Based on previous research by Leppäranta et al. [26], internal melting, , can be estimated from the net solar radiation absorbed by the ice layer when the average ice temperature reaches 0 °C, and is equal to the loss of ice volume per area across the entire ice thickness. The formula is:
3. Results
3.1. Meteorological Conditions
The ice season of Lake Wuliangsuhai lasted from early December to the following March in both 2017 and 2018. During January and February, the ice cover grew gradually and reached a thermal equilibrium stage, and then started to melt at the end of February. Precipitation did not contribute significantly, since only two snowfall events were recorded each winter.
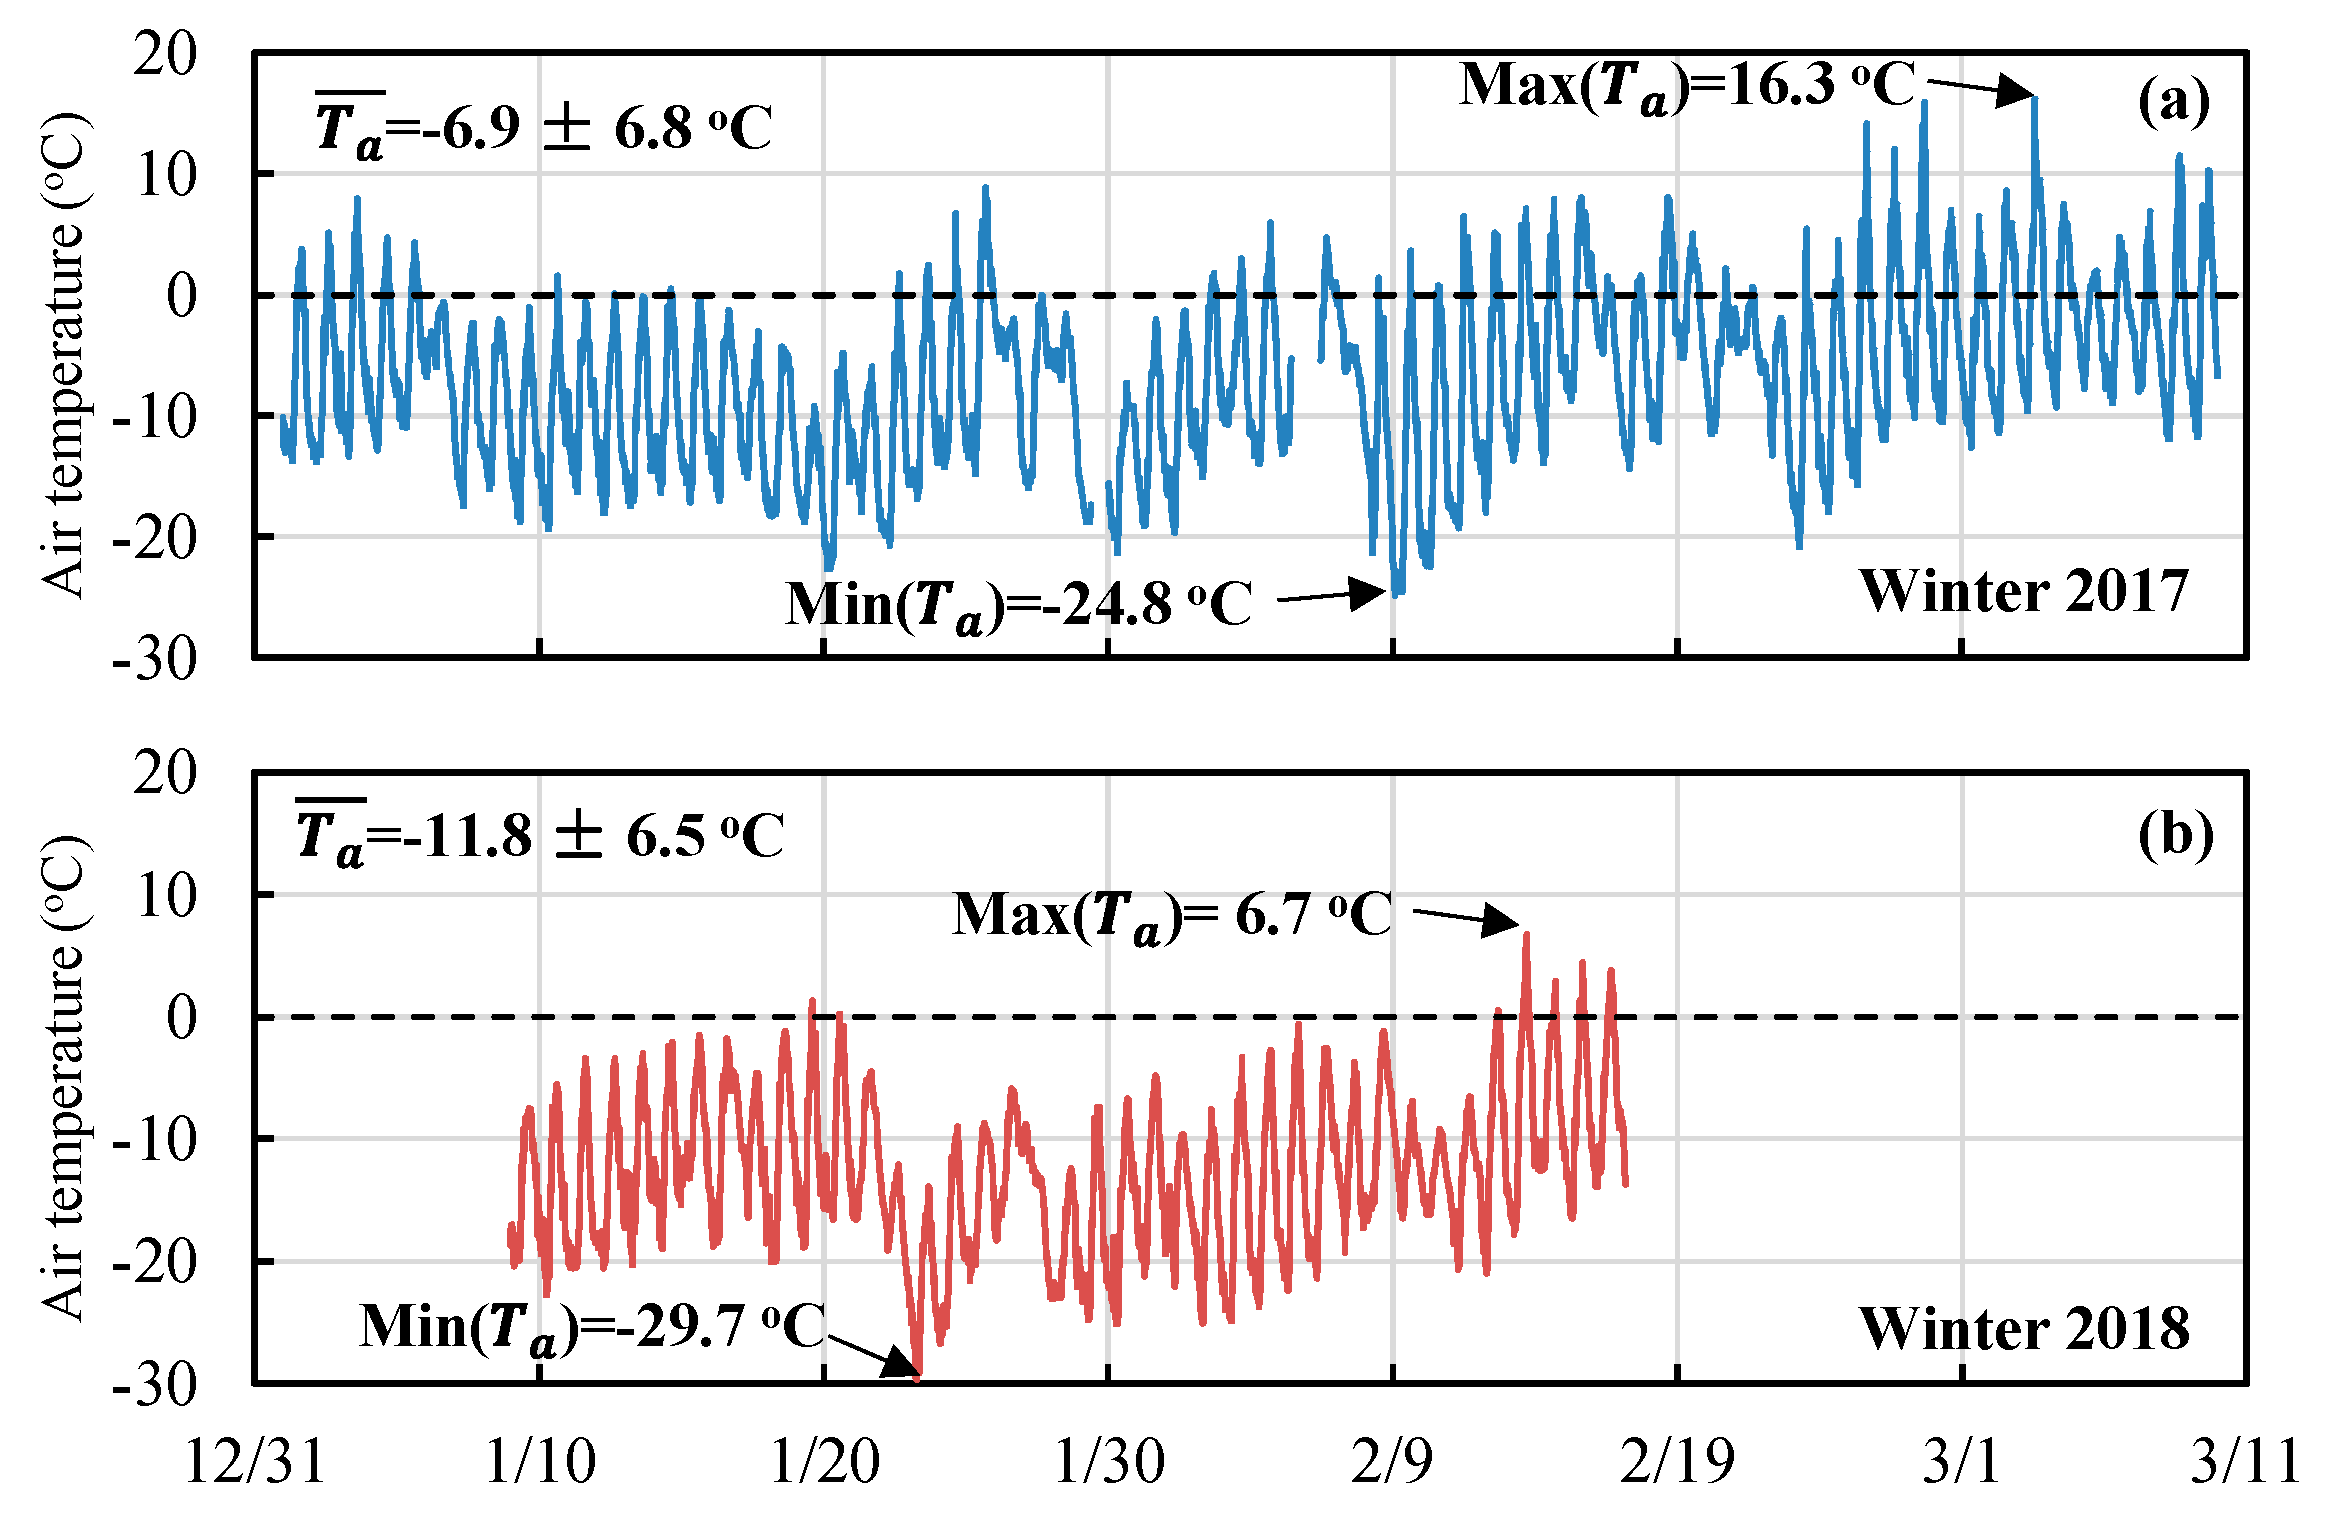
The average ± standard deviation values for air temperature () were −6.9 ± 6.8 °C and −11.8 ± 6.5 °C during the observation periods in 2017 and 2018, respectively. Large diurnal variation in is obvious in Figure 3. In winter 2017, the average diurnal range of was 15.6 °C, and the maximum was 16.3 °C on March 3. In 35 days, the highest exceeded 0 °C and night-and-day freeze–thaw cycles occurred on the ice surface. This phenomenon was also observed in winter 2016 [27]. In winter 2018, the average diurnal variation in was 15.6 °C, and the maximum was 22.3 °C on February 13. In winter 2018, the number of days when the daily maximum exceeded 0 °C were only six during the observation period, much less than in the corresponding period in winter 2017 (Figure 3). The low was reflected in a more stable state of the ice surface in winter 2018. The average wind speed in both winters was 2.1 m s−1, and the maxima were 16.5 m s−1 in 2017 and 11.3 m s−1 in 2018.
3.2. Lake Ice Mass Balance
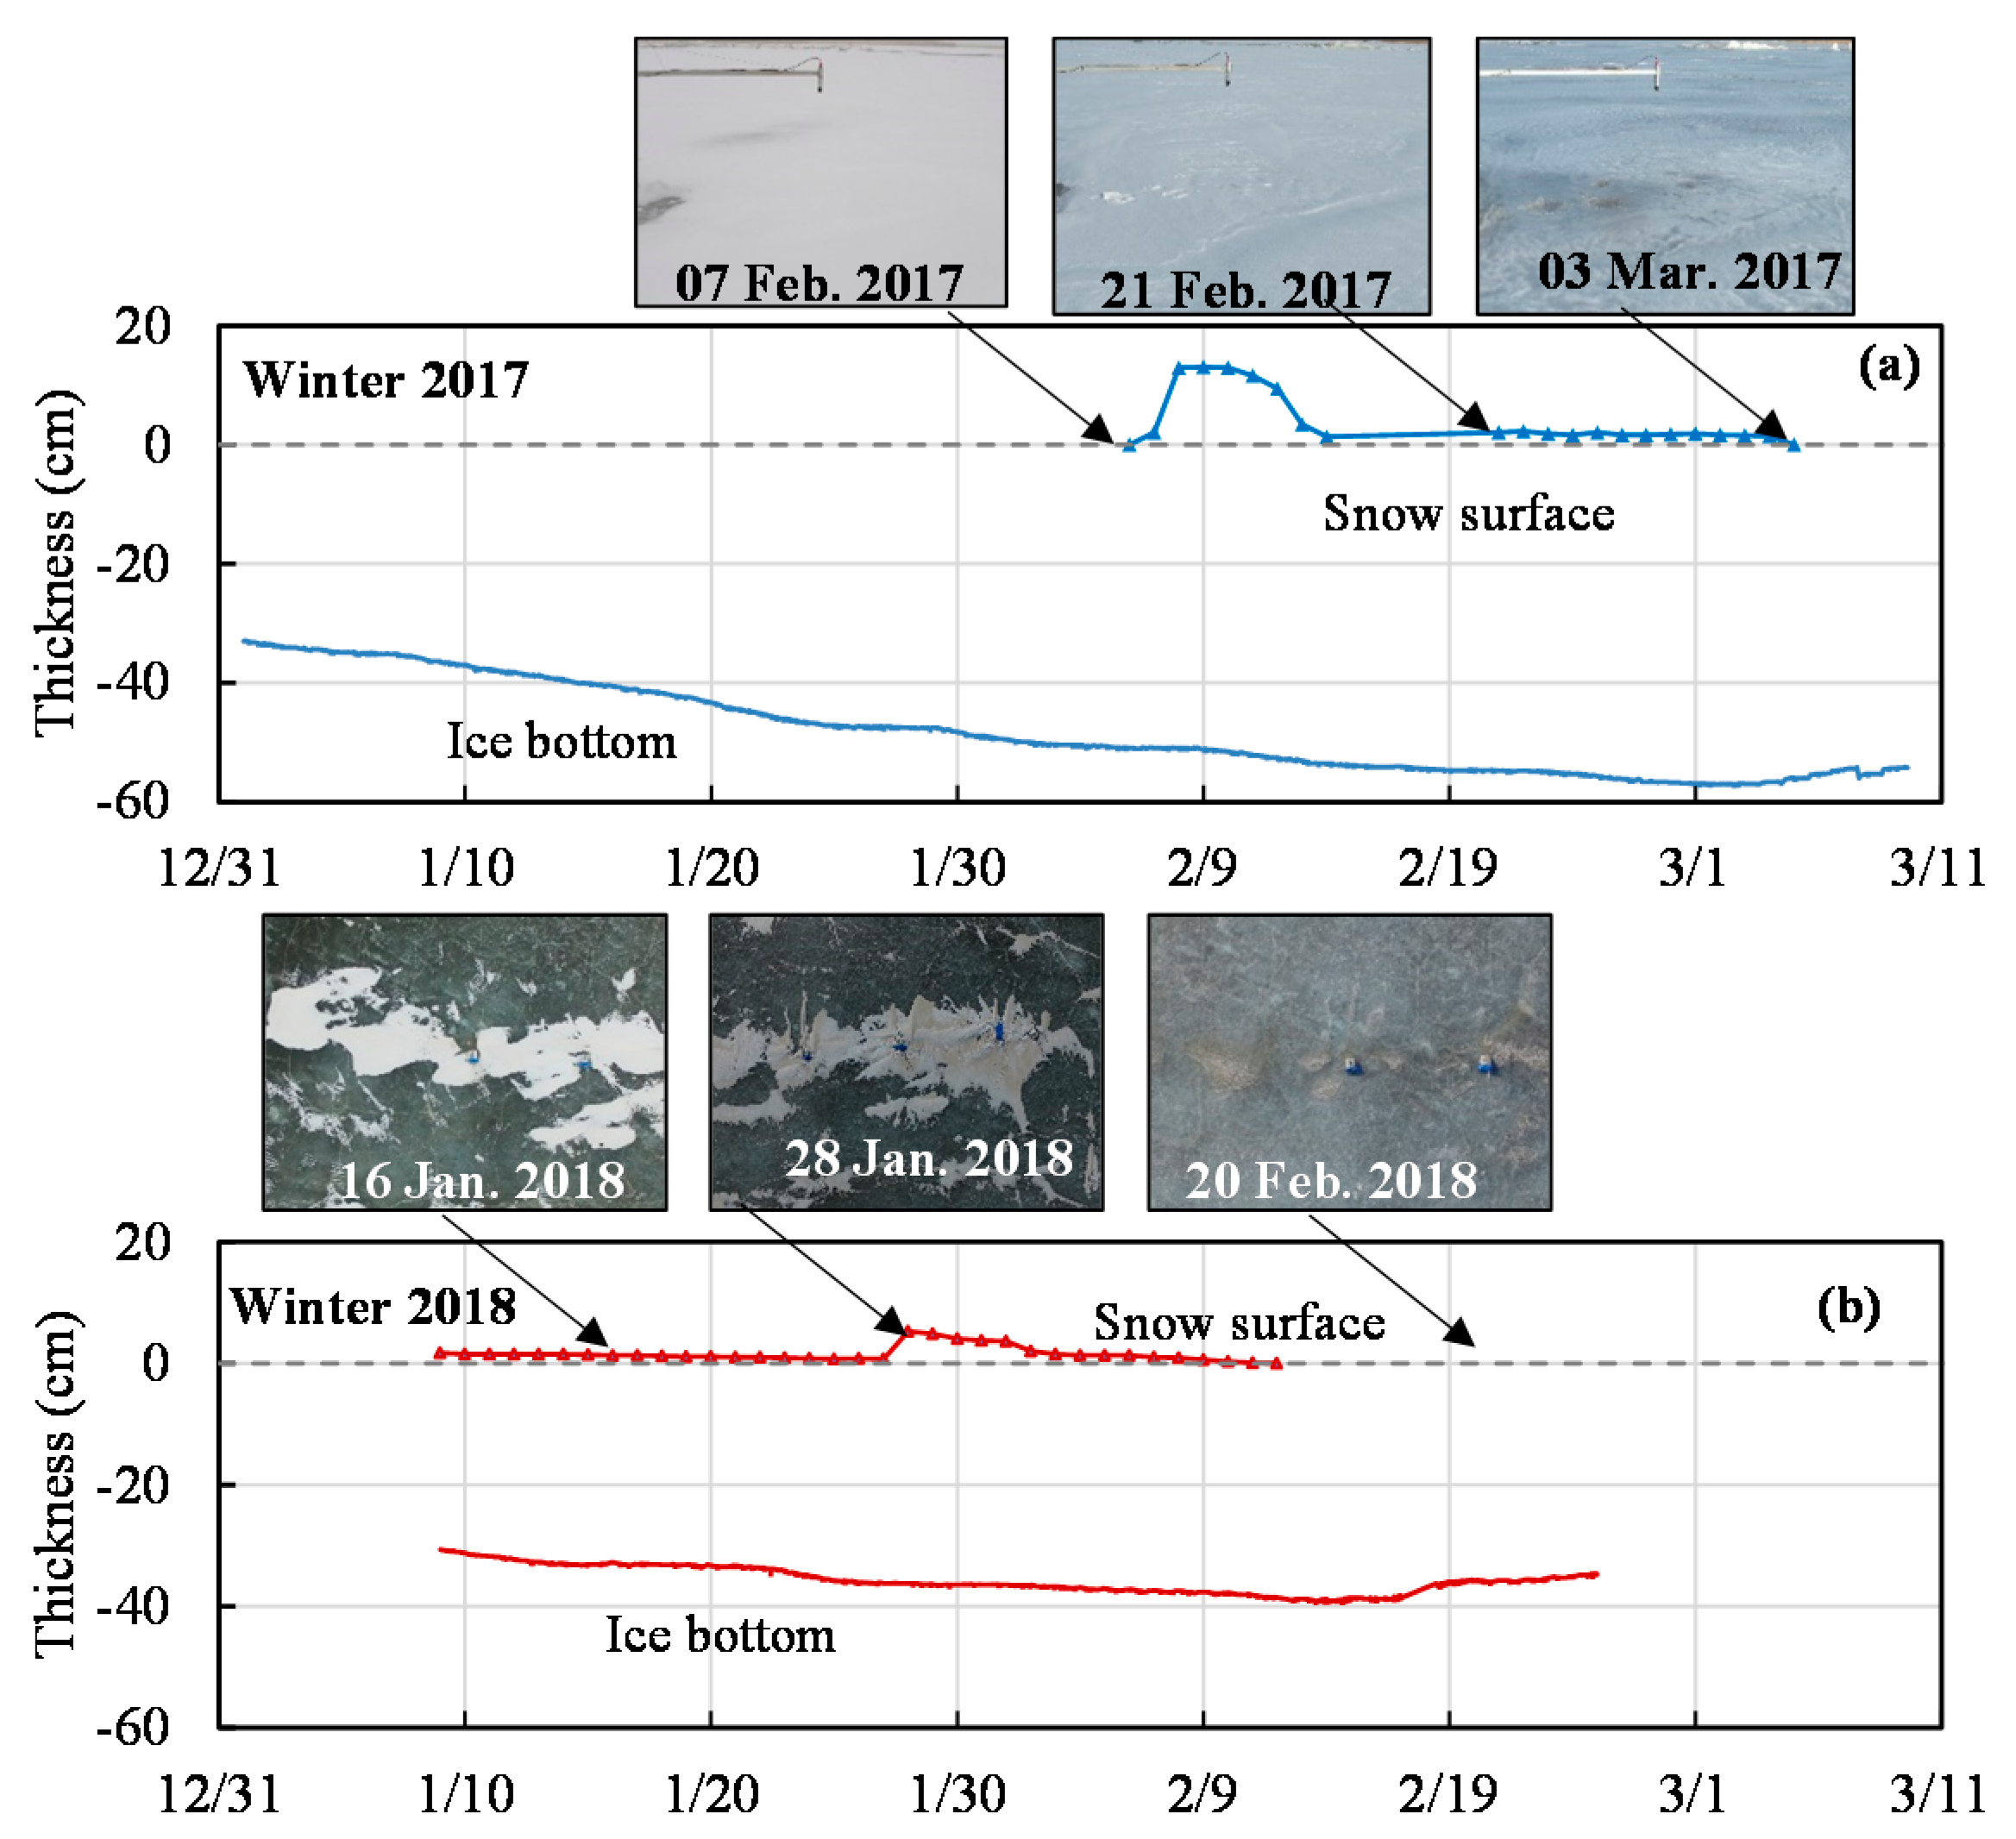
Figure 4 shows the variation of the ice bottom depth and snow surface in winter 2017 and 2018. The ice season can be divided into three periods: growth, equilibrium, and melting. In winter 2017, the growth period took place from January 1 to 24, with a growth rate of 0.55 cm day−1. The ice thickness reached the maximum value of 46.4 cm on February 28. After March 1, the ice began to melt at a rate of 0.4 cm day−1. In 2018, the ice was overall thinner than in 2017 (Figure 4b). Due to the late start of the observations, the growth period was not present in the data for winter 2018. The maximum ice thickness was 39.1 cm, registered on February 14. The onset of the melting period occurred earlier than in 2017, and ice thickness decreased by 0.5 cm day−1 in the following ten days.
Two snowfalls occurred during the observation period in 2017, on February 7 and 21. The first event deposited a 13 cm thick snow cover, which disappeared within the end of the following week (Figure 4a). The second snowfall was even more scarce. Its thickness was only 2.3 cm, and it completely melted over the following 13 days. The snow cover was different in 2018. Only a patchy snow cover on the ice surface, with a thickness of 0.7–1.7 cm, was recorded since the beginning of the observation period. The only snowfall event occurred on January 28, with a 5.2 cm thick snow cover that completely melted by February 12 (Figure 4b).
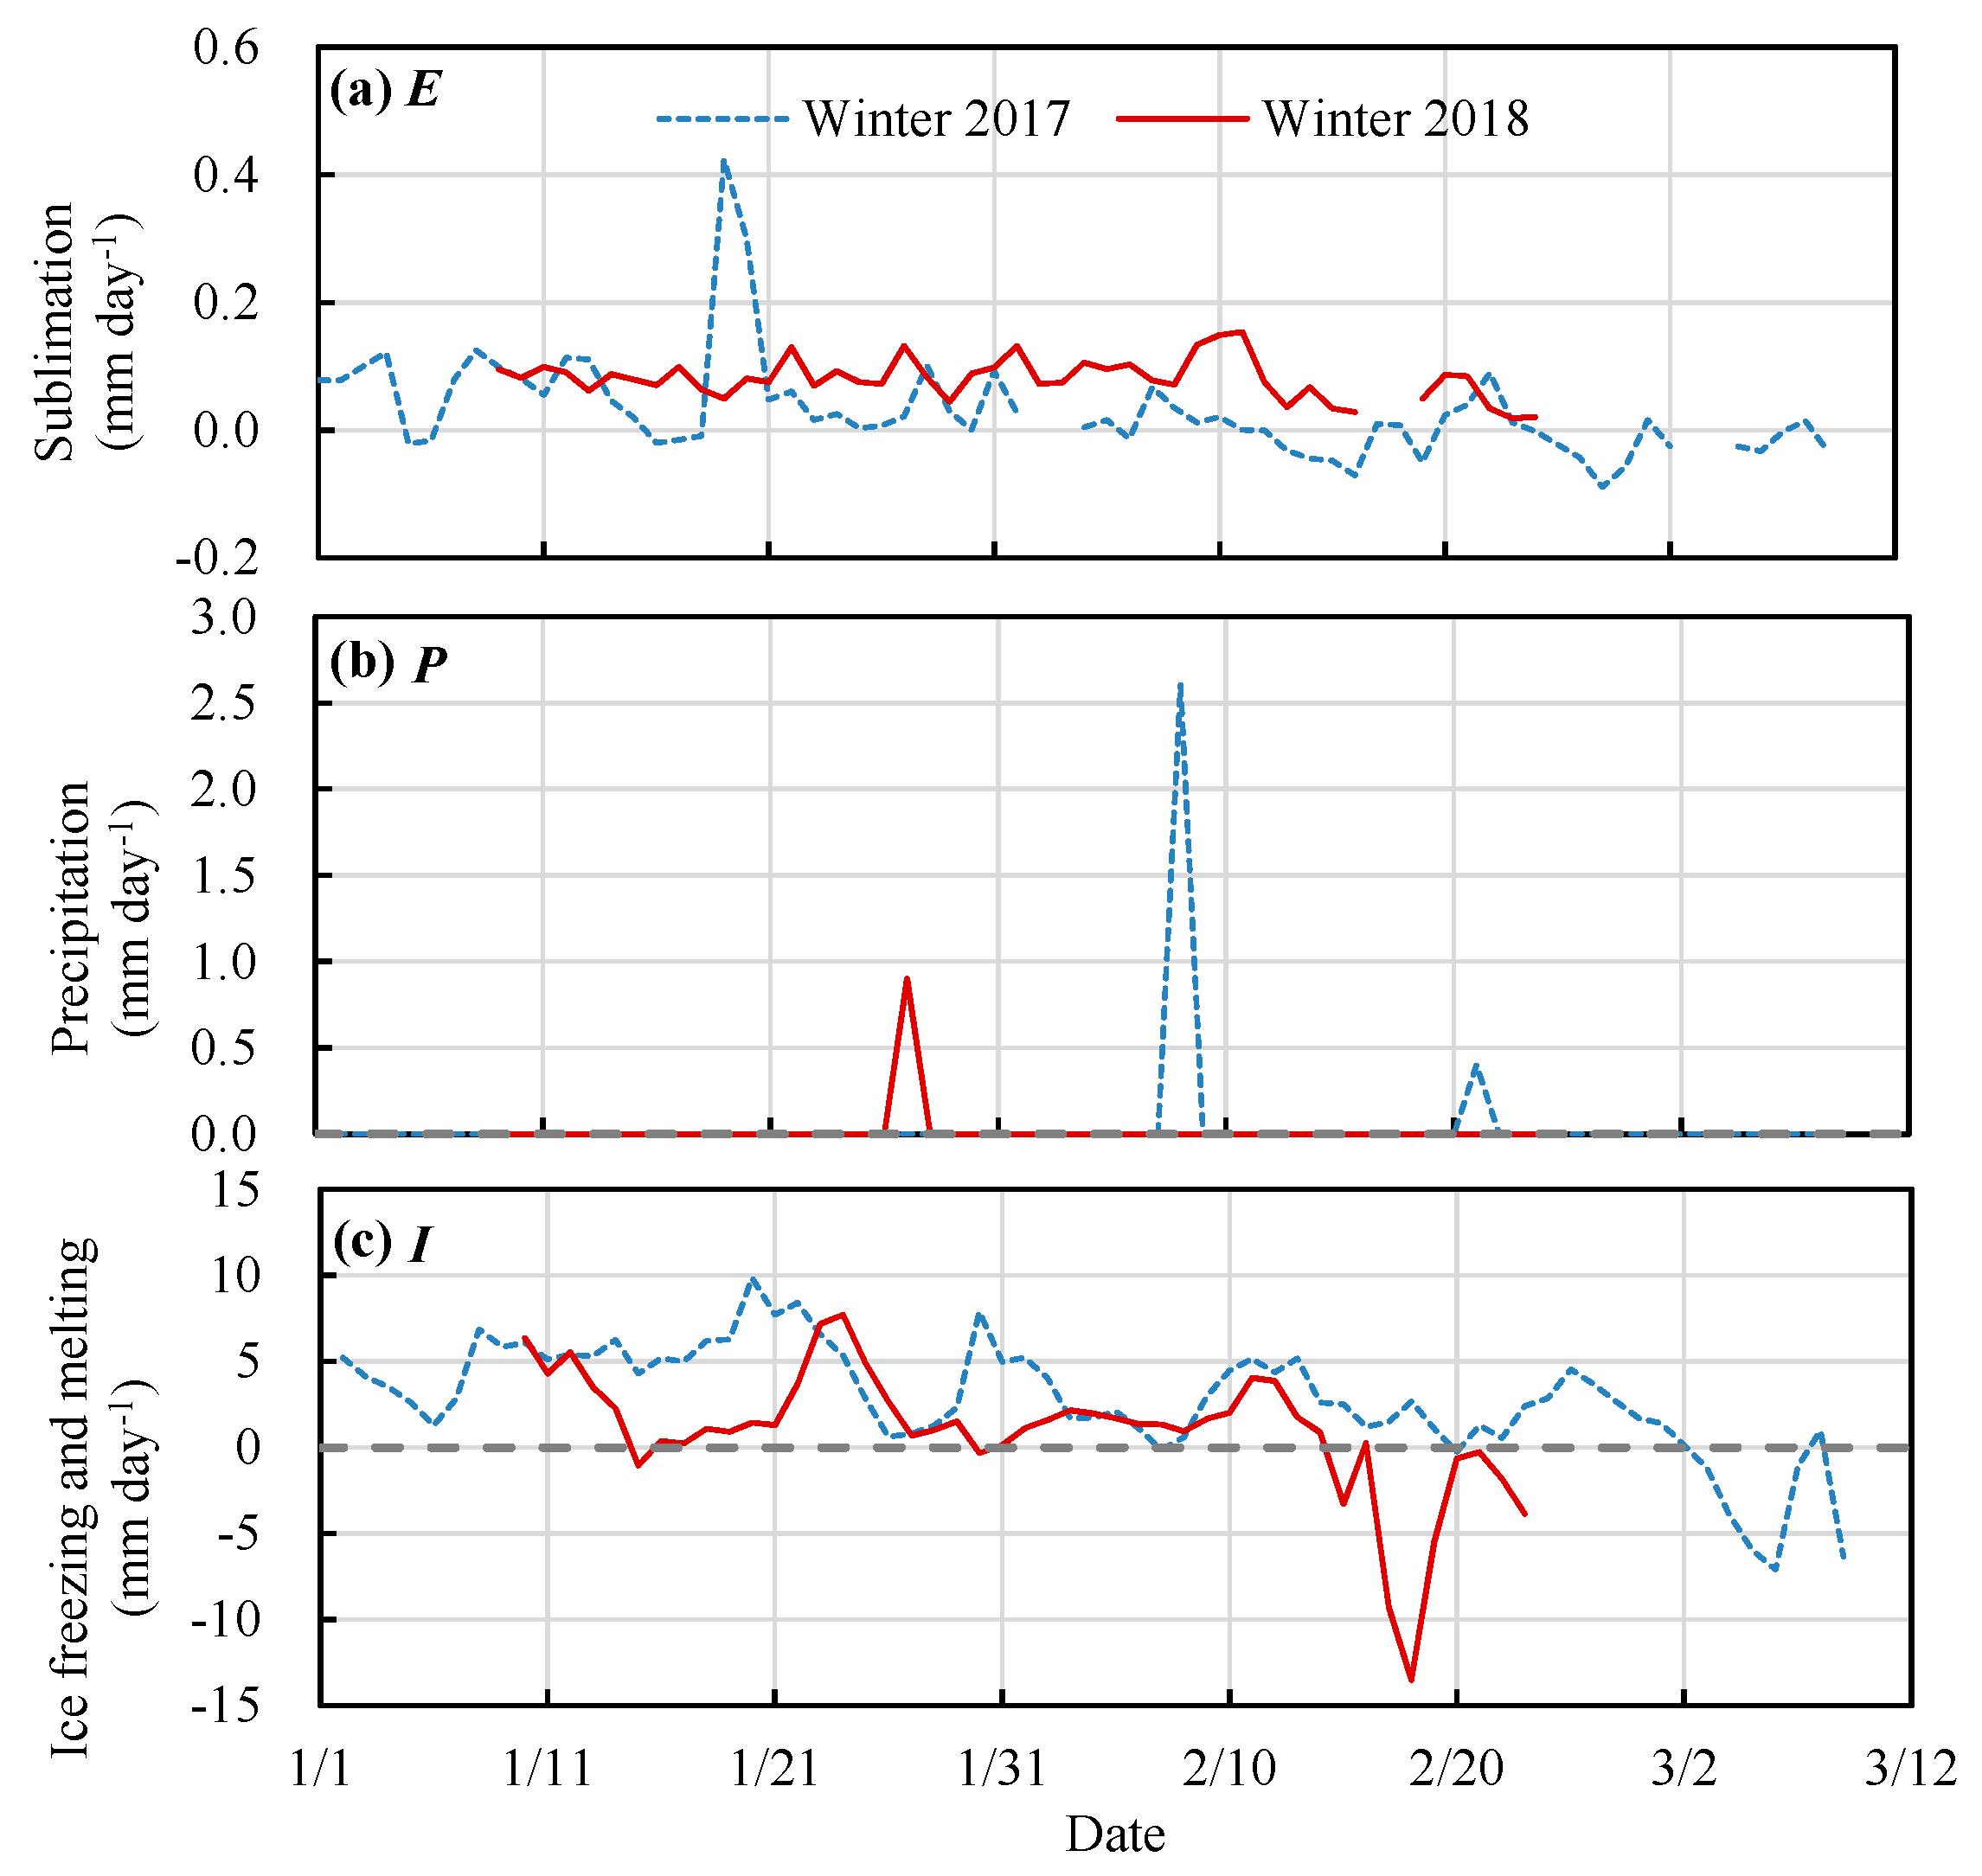
The mass of lake ice changed at the upper boundary through sublimation () and precipitation (). The accumulated sublimation was 1.9 and 3.6 mm in winter 2017 and 2018, respectively. The level was low in both winters due to weak winds, the mean wind speed being 2.1 m s−1 (Figure 5a). The maximum was 0.4 mm day−1 in 2017, on January 19, occurring at a wind speed of 4 m s−1. In 2017, there were some cases of negative sublimation, or deposition, when the air temperature was significantly higher than the ice temperature. In the short observation period of winter 2018, the daily sublimation was stable at a rate of approximately 0.1 mm day−1. In 2017 and 2018, the accumulated was 3.0 and 0.9 mm, respectively, during the observation period (Figure 5b).
The mass of lake ice normally changes at the lower boundary through freezing and melting (Figure 5c). In the winters of 2017 and 2018, the average freezing rates were 3.6 and 2.1 mm day−1, respectively, and the average melting rates were 3.1 and 5.0 mm day−1, respectively. During the melting period, the air temperature was still below 0 °C at night, which is when freezing occurred, while melting took place during the daytime. Based on Equation (15), the mean internal melting during the daytime was 3.4 mm in 2017. In 2018, the value was 1.3 mm, due to the thinner ice and the shorter observation period during the melting stage.
3.3. Temperature Regime
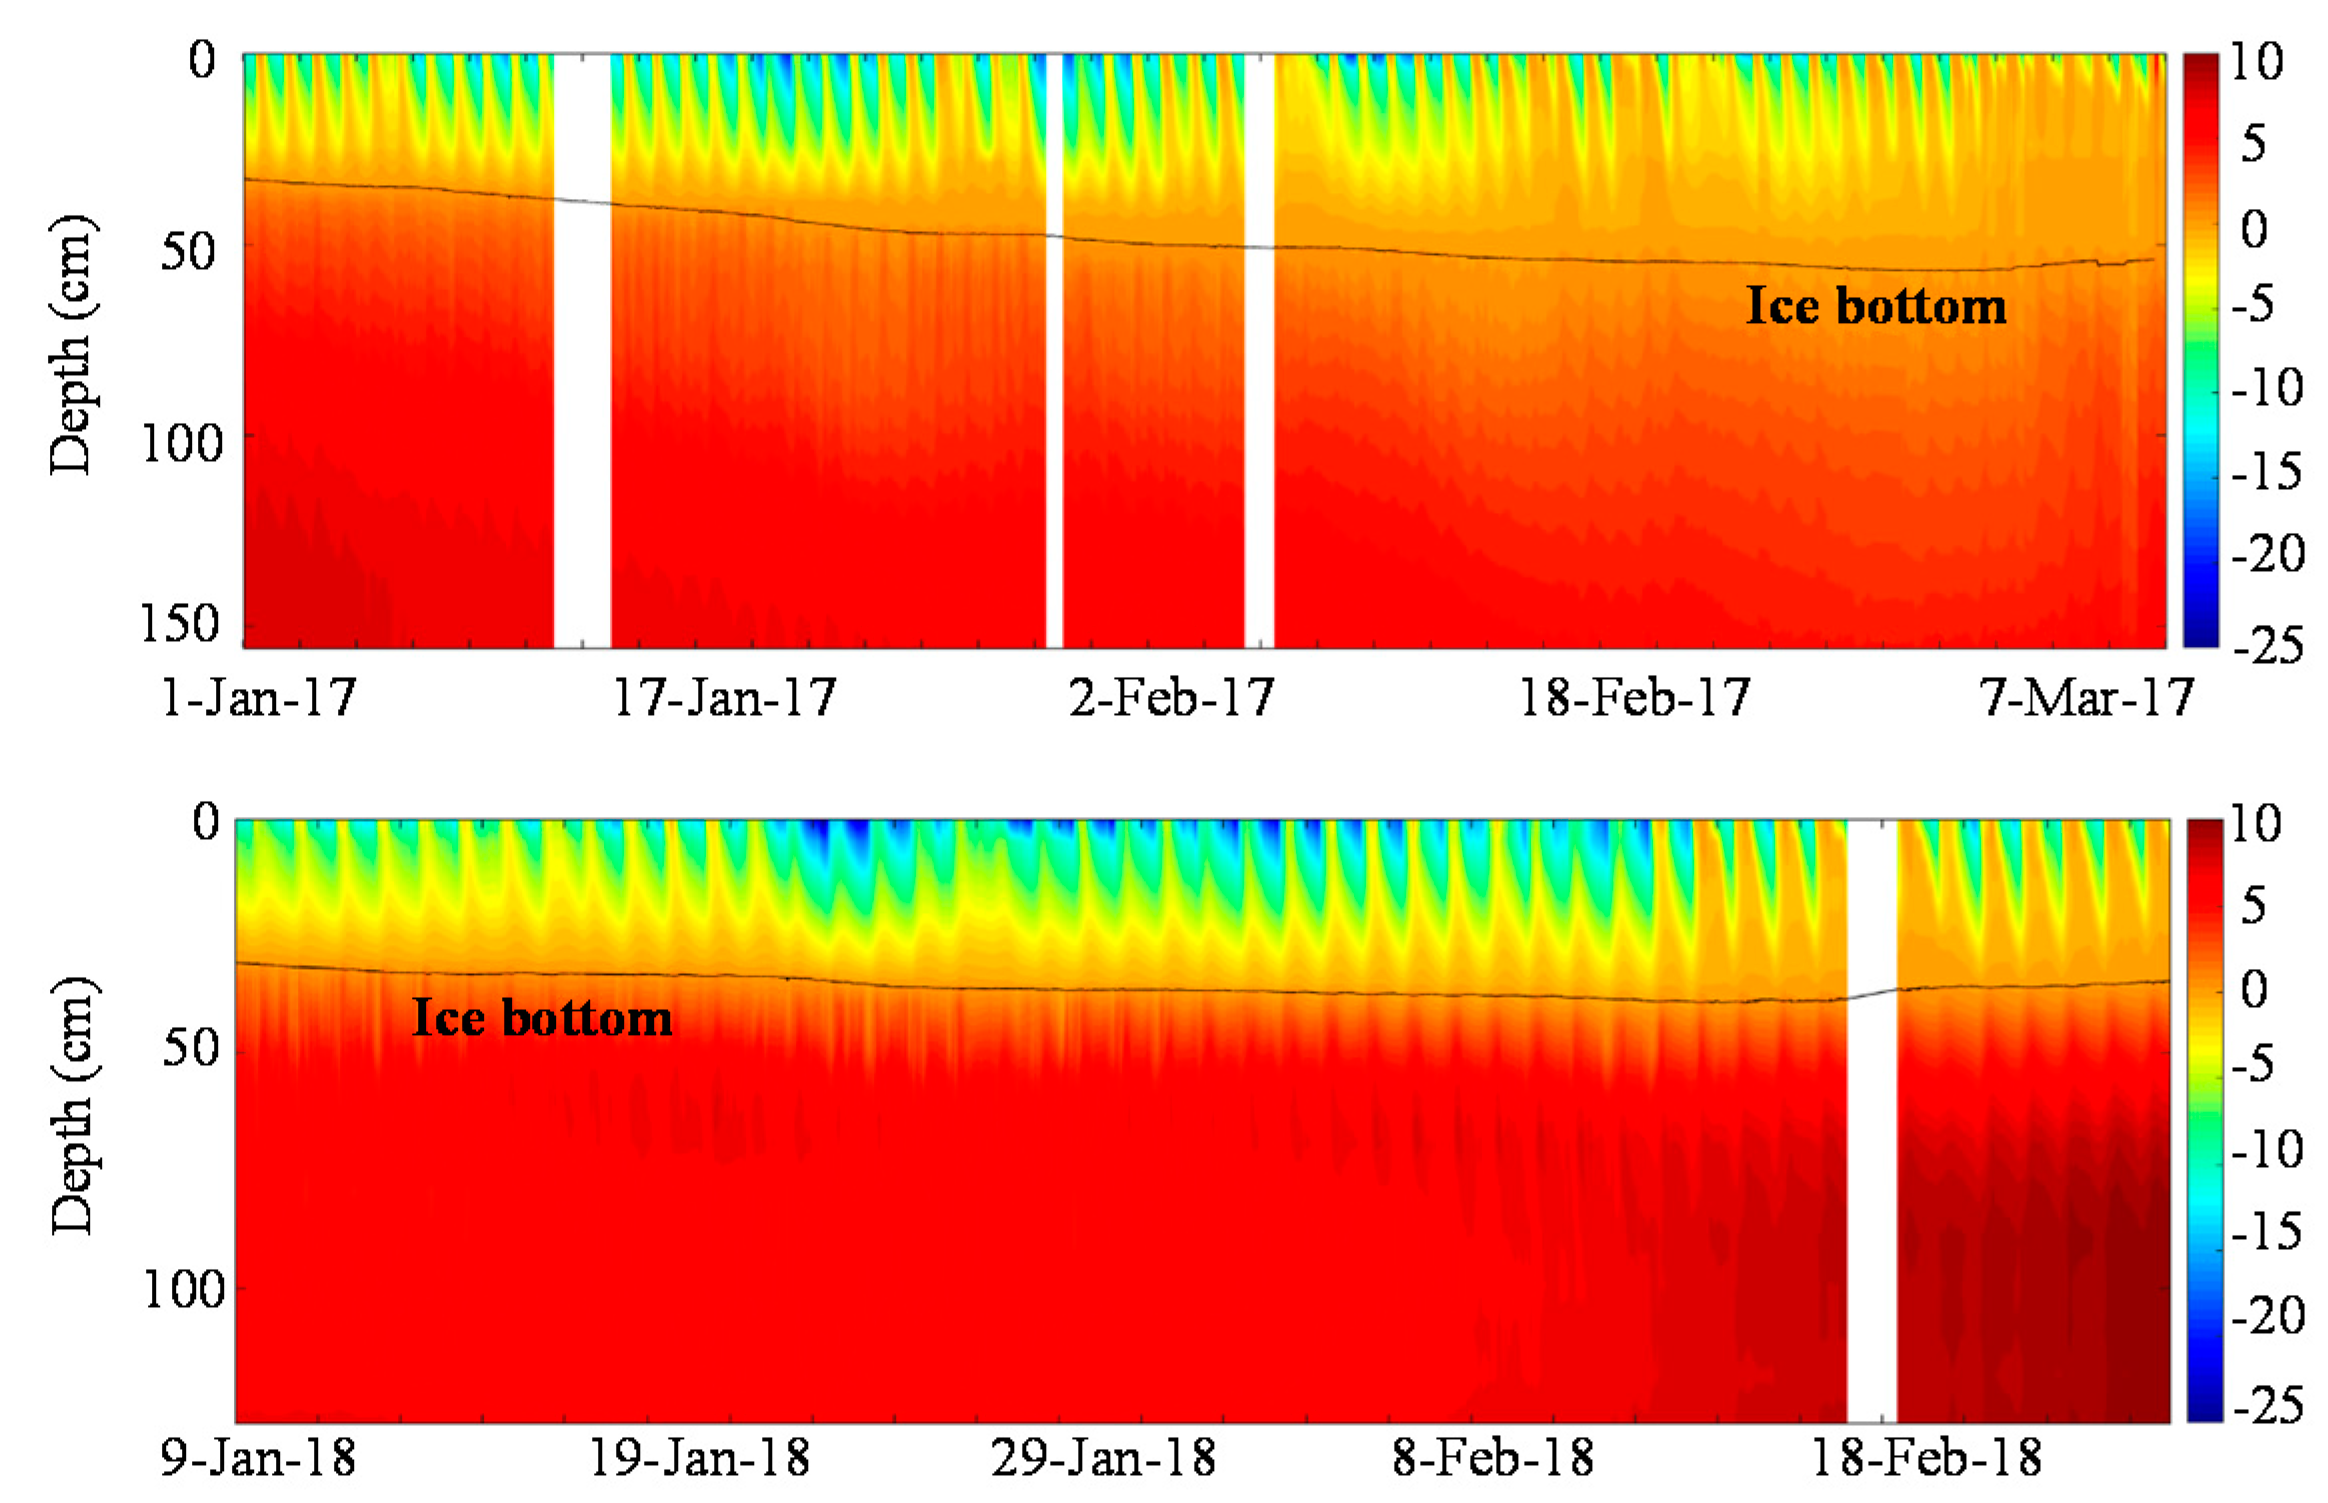
The evolution of the temperature of lake ice () and water () are shown in Figure 6. The ice lake temperature had a strong daily variation, and the minimum and maximum ice temperatures occurred at approximately 8:00 and 16:00, respectively (solar noon was around 12:45). In winter 2017, the daily variation was notably weakened after snowfall events, because the snow cover increased the albedo and blocked the heat exchange between the air and ice. This phenomenon was not obvious in the winter of 2018, due to the uneven snow cover that allowed more solar radiation into the ice, leading to a stronger air–ice heat exchange. During the melting period, was close to 0 °C for most of the day. In a comparison of the vertically averaged ice temperatures, only a minimal difference existed between the two winters. The mean was –3.4 ± 1.7 °C in 2017, with a minimum temperature of −7.8 °C. In 2018, the mean was −5.1 ± 1.8 °C with a minimum of −9.7 °C.
No significant daily variation was found in water temperature. In 2017 and 2018, the average was 3.8 and 4.7 °C, respectively. This was due to the presence of thinner ice in 2018, which determined a stronger radiational heating of the water body. The water body was maintained relatively stable by the stratification of salinity, which allowed high water temperatures. In the melting period in 2018, was as high as 10 °C.
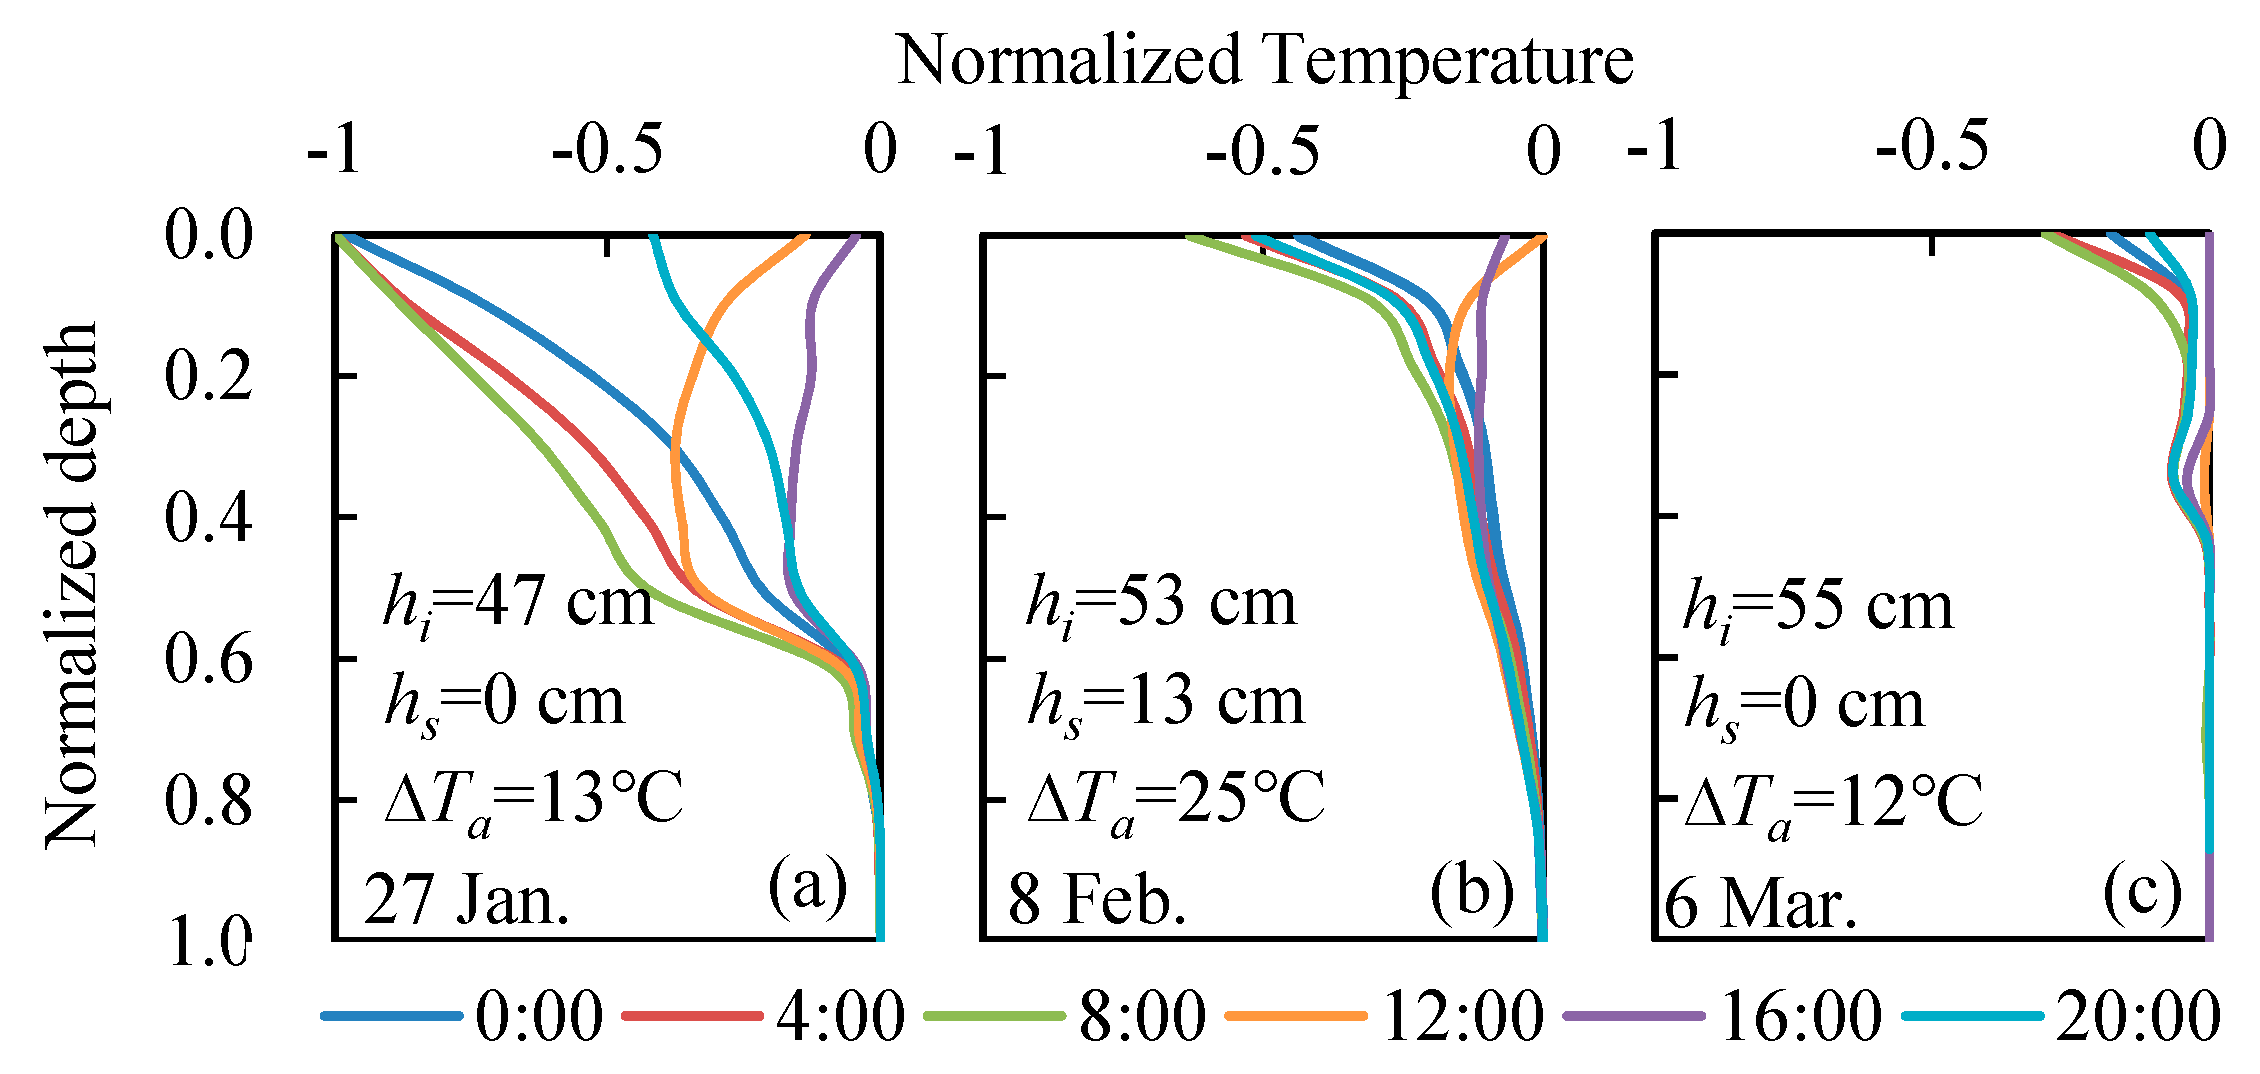
In order to fully understand the daily variations in ice temperature under different surface conditions, three specific situations of winter 2017 were selected for further investigation: freezing period with no snow cover (January 27), with snow cover (February 8), and melting period (March 6). The daily cycles of temperature variation are shown in Figure 7. Ice thickness is normalized into 0–1 and is also normalized using the daily range of air temperatures, in order to clarify the comparisons between different days. Corresponding variations in 2018 are not shown. The thermodynamic length scales are here the light attenuation and heat conduction depths. The former is greater than ice thickness [27], while for daily cycles, the latter is 0.3 m (as reported in Leppäranta [2]). For snow cover, the corresponding length scales are 0.15 and 0.1 m.
The profile of along the ice depth was almost linear in the upper layer at 0:00, 4:00, and 8:00 due to conduction. There was no incident solar radiation and was low (Figure 7a). Daytime conduction and solar radiation heated the near-surface layer and the temperature profile became “C–shaped” at 12:00 and 16:00. However, in the lower layer was still controlled by water temperature, and its value was close to 0 °C at all times at the normalized depth > 0.6. After the snowfall, the snow cover limited heat conduction to the ice and scattered back most of the incident solar radiation. The profile showed changed only in the top 0.2 layer and the temperature range was only half of the case with no snow cover (Figure 7b). The impact of on was limited only in this top layer, and below it, a nearly fixed linear increase of up to the freezing point at the ice bottom was observed.
The ice temperature in the melting period was different from the freezing period (Figure 7c). The ice was nearly isothermal and close to the freezing point due to high air temperature and to the increase in solar radiation absorption in the daytime. Penetrating solar radiation determined an increase in temperature at the depth of 0.2–0.3 [28], and internal melting mainly occurred at this sub-surface layer. Two colder layers existed, at the surface and at the depth of 0.4, forming a “reverse S-shaped” profile at 0:00, 4:00, 8:00, and 20:00. The low-temperature region located at the depth of 0.3–0.4, and maintained as such following the previous cold nights (see Figure 3), was gradually weakened by the increased absorption of solar radiation. Affected by the ice–water interface, the temperature of the lower half of the ice was close to 0 °C. A similar profile was observed by Huang et al. [29] in the Qinghai Tibet Plateau.
3.4. Heat Balance
3.4.1. Ice Surface Heat Budget
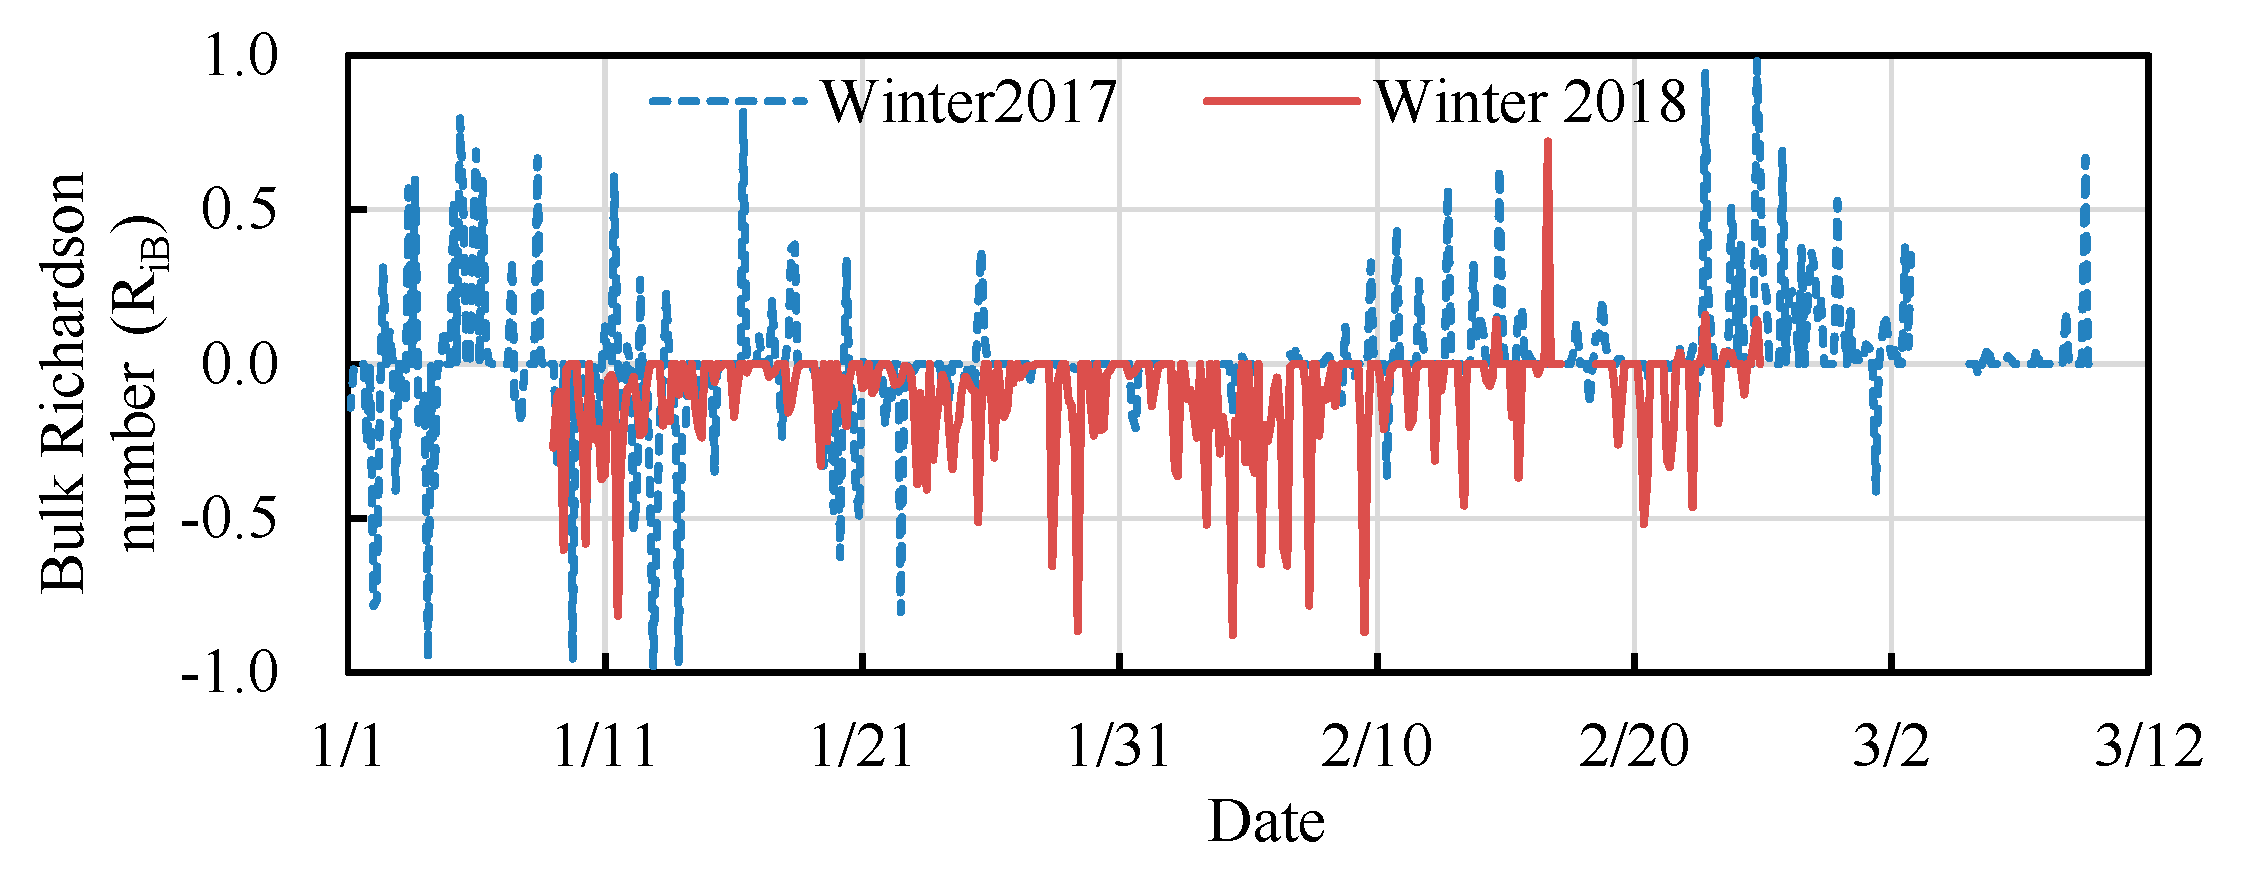
The turbulent transfer coefficients at the air–ice interface were calculated from Equations (7) and (8)–(10). The estimation of the bulk Richardson number was limited by the accuracy of the temperature and wind speed measurements, , respectively. Therefore, we replaced the cases of or with the near-neutral case (). Results for 2017 and 2018 are shown in Figure 8.
The stratification was unstable before the snowfall event on February 7, 2017, especially at the beginning of the observation period and mostly during the night, due to low air temperature. After the snowfall, the stratification was stabilized. The insulation effect of snow largely decoupled the surface from the water body, resulting in a sharp drop in surface temperature at night. In 2018, the stratification was mostly unstable, due to uneven snow distribution and smaller ice thickness, which contributed to a stronger air–water coupling.
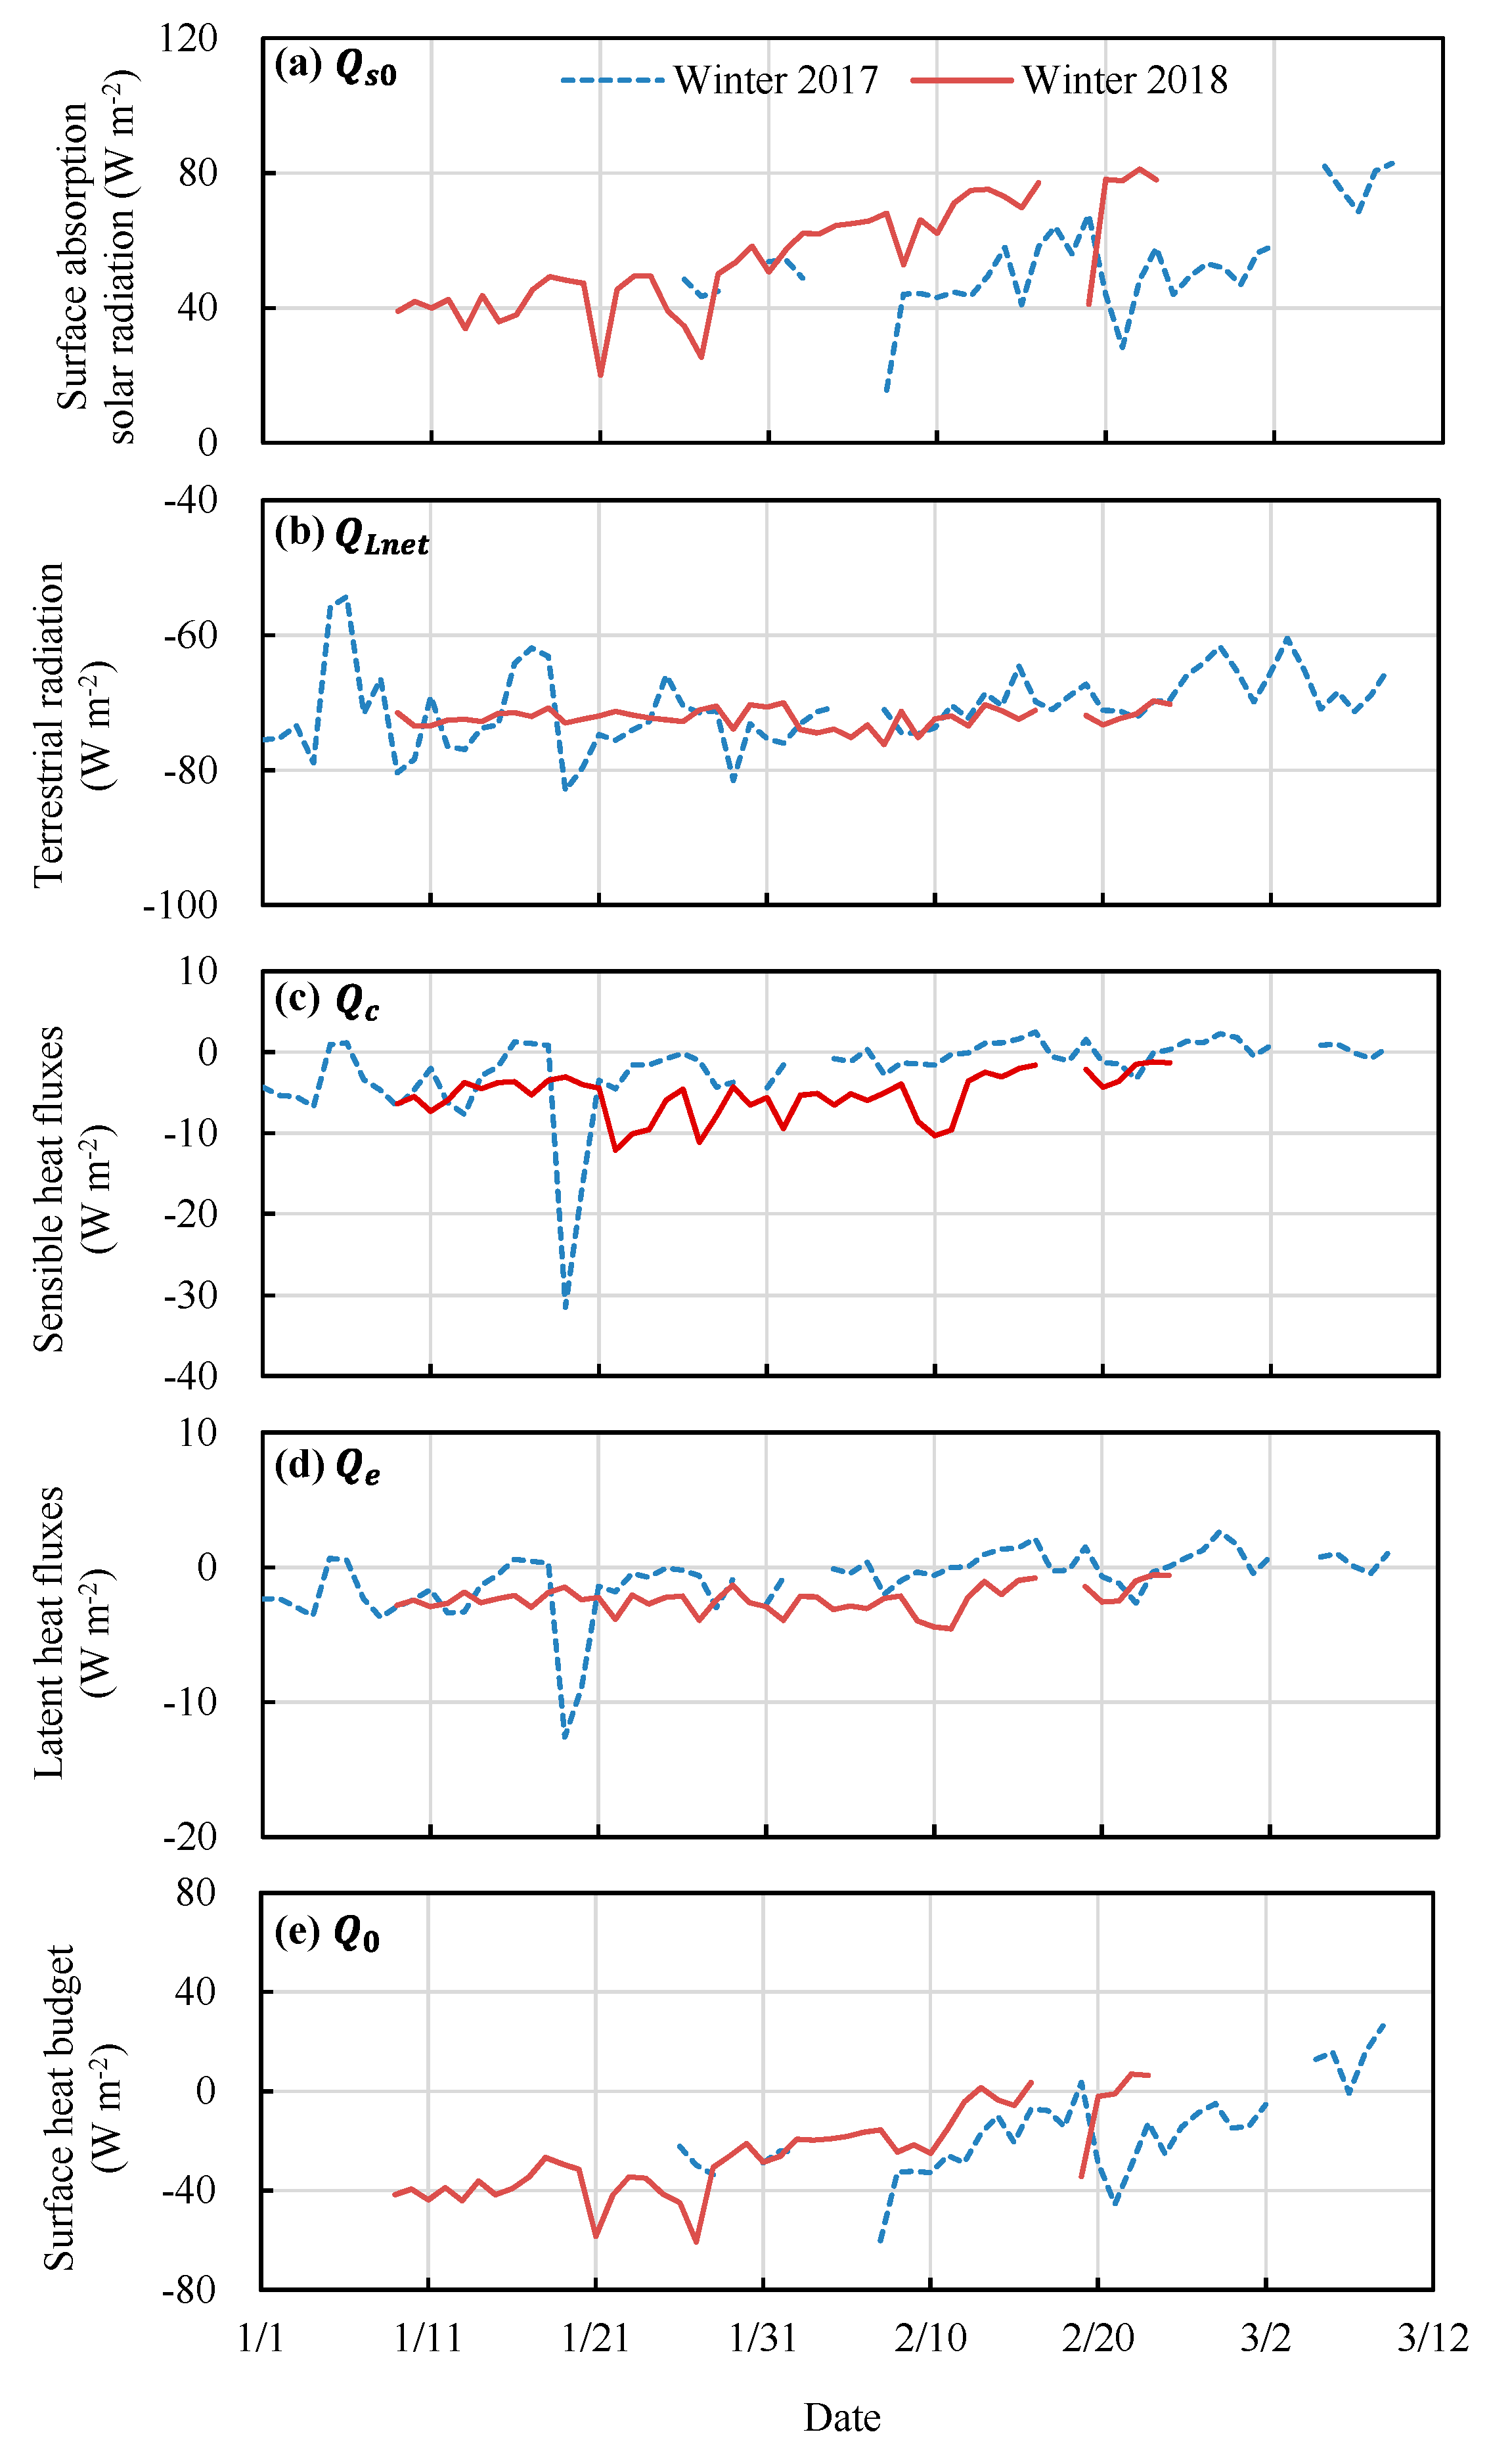
Once the turbulent transfer coefficients are estimated, obtaining the surface heat budget is a straightforward calculation (Figure 9). The solar radiation absorbed by the ice surface () gradually increased in both winters, mainly affected by snow cover and solar elevation. The average slowly increased from 48.5 to 54.7 W m−2 from January 26 to February 4 in 2017. After the snowfall event on February 7, was reduced by about 10 W m−2, and then it increased sharply from 56.4 to 82.9 W m−2 during the following melting period (March 1 to 9). A steady increase of from 39.1 to 77.9 W m−2 took place in winter 2018. Three sudden drops in were attributed to cloudy days that reduced the incident solar radiation. The influence of snow was limited because of the patchy and thin snow cover.
The net terrestrial radiation was stable in both winters, with an average of −70.6 in 2017 and −72.3 W m−2 in 2018. The sensible () and latent () heat fluxes were small due to weak winds, mostly between zero and −10 W m−2 and they varied less in 2018 than in 2017. The average values of and were −2.1 and −1.0 W m−2, respectively, in 2017, and the peaks ( = −31.5 W m−2 and = −12.5 W m−2) were observed on January 19 in presence of a high wind speed (4.1 m s−1). In 2018, the average values of and were −5.3 and −2.4 W m−2, respectively, largely due to unstable stratification (Figure 3).
The evolution of the surface heat budget () mostly followed the trend of (Figure 9e). Two significant drops caused by the snow cover in 2017 are evident, and in 2018 increased steadily except for the two drops visible in Figure 9a. In 2017 and 2018, the average was −16.6 and −25.5 W m−2, respectively. Values are negative because most of the observation periods took place during the ice growth phase. On average, 55% of the surface heat budget was determined by terrestrial radiation, 5% by turbulent fluxes, and 40% by the absorbed solar radiation at the surface.
3.4.2. Absorption of Solar Radiation by Lake Ice
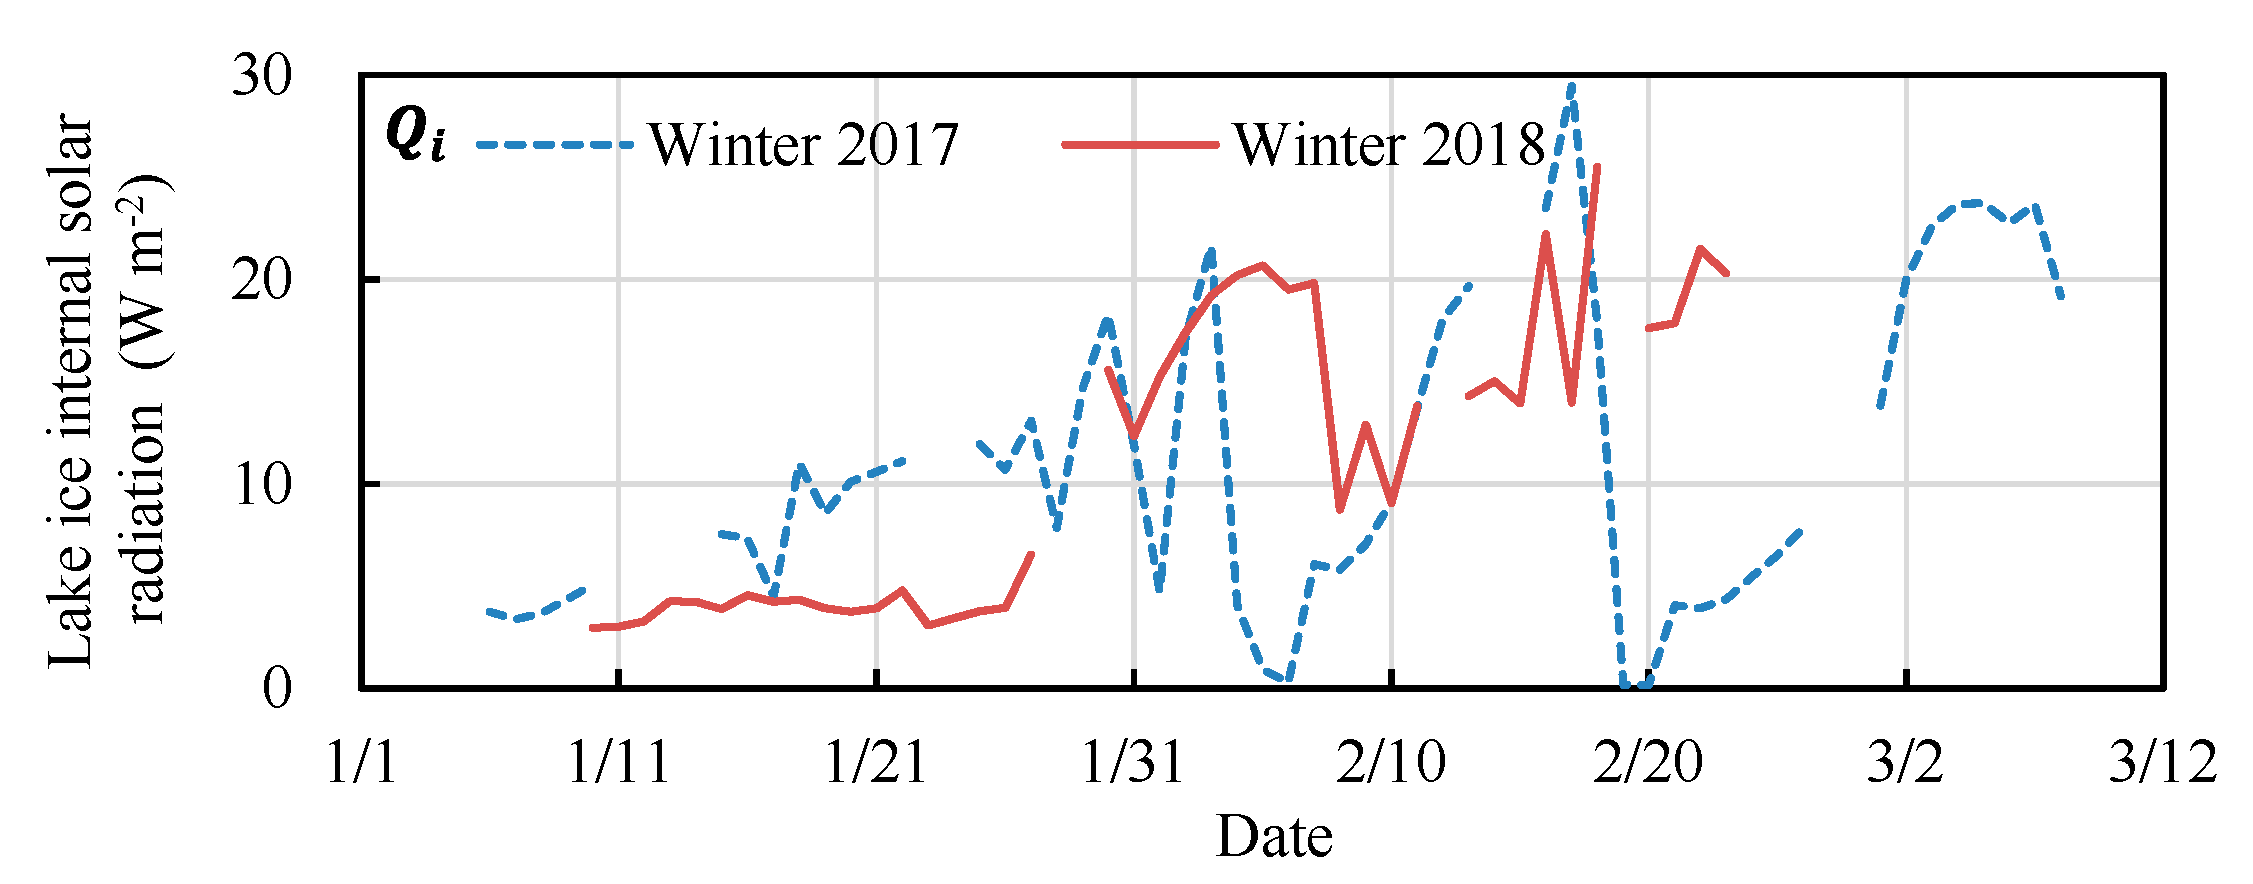
Compared with boreal lakes, the ice in Lake Wuliangsuhai receives more solar radiation during the ice growth period because of the higher solar elevation and less cloud cover. Figure 10 shows the solar radiation absorbed by the ice as determined by Equation (11). The average in the two winters was 11 W m−2. Snow was the primary controlling factor in 2017. Before the first snowfall, increased gradually from 3 to 20 W m−2, and after the snowfall, it dropped to zero and rapidly increased again to 29 W m−2. The same occurred during the second snowfall. In 2018, experienced three stages. From January 10 to 26, was stable at 4 W m−2 because the low air temperature kept the area and properties of snow cover stable. With the decrease in snow area and thickness, increased rapidly from January 27 to 31. After the snowfall on February 7, decreased by 10 W m−2, but due to the uneven snow cover, it did not reach zero as in 2017. In the final observation period in 2018, was stable at 20 W m−2.
3.4.3. Ice Bottom Heat Budget
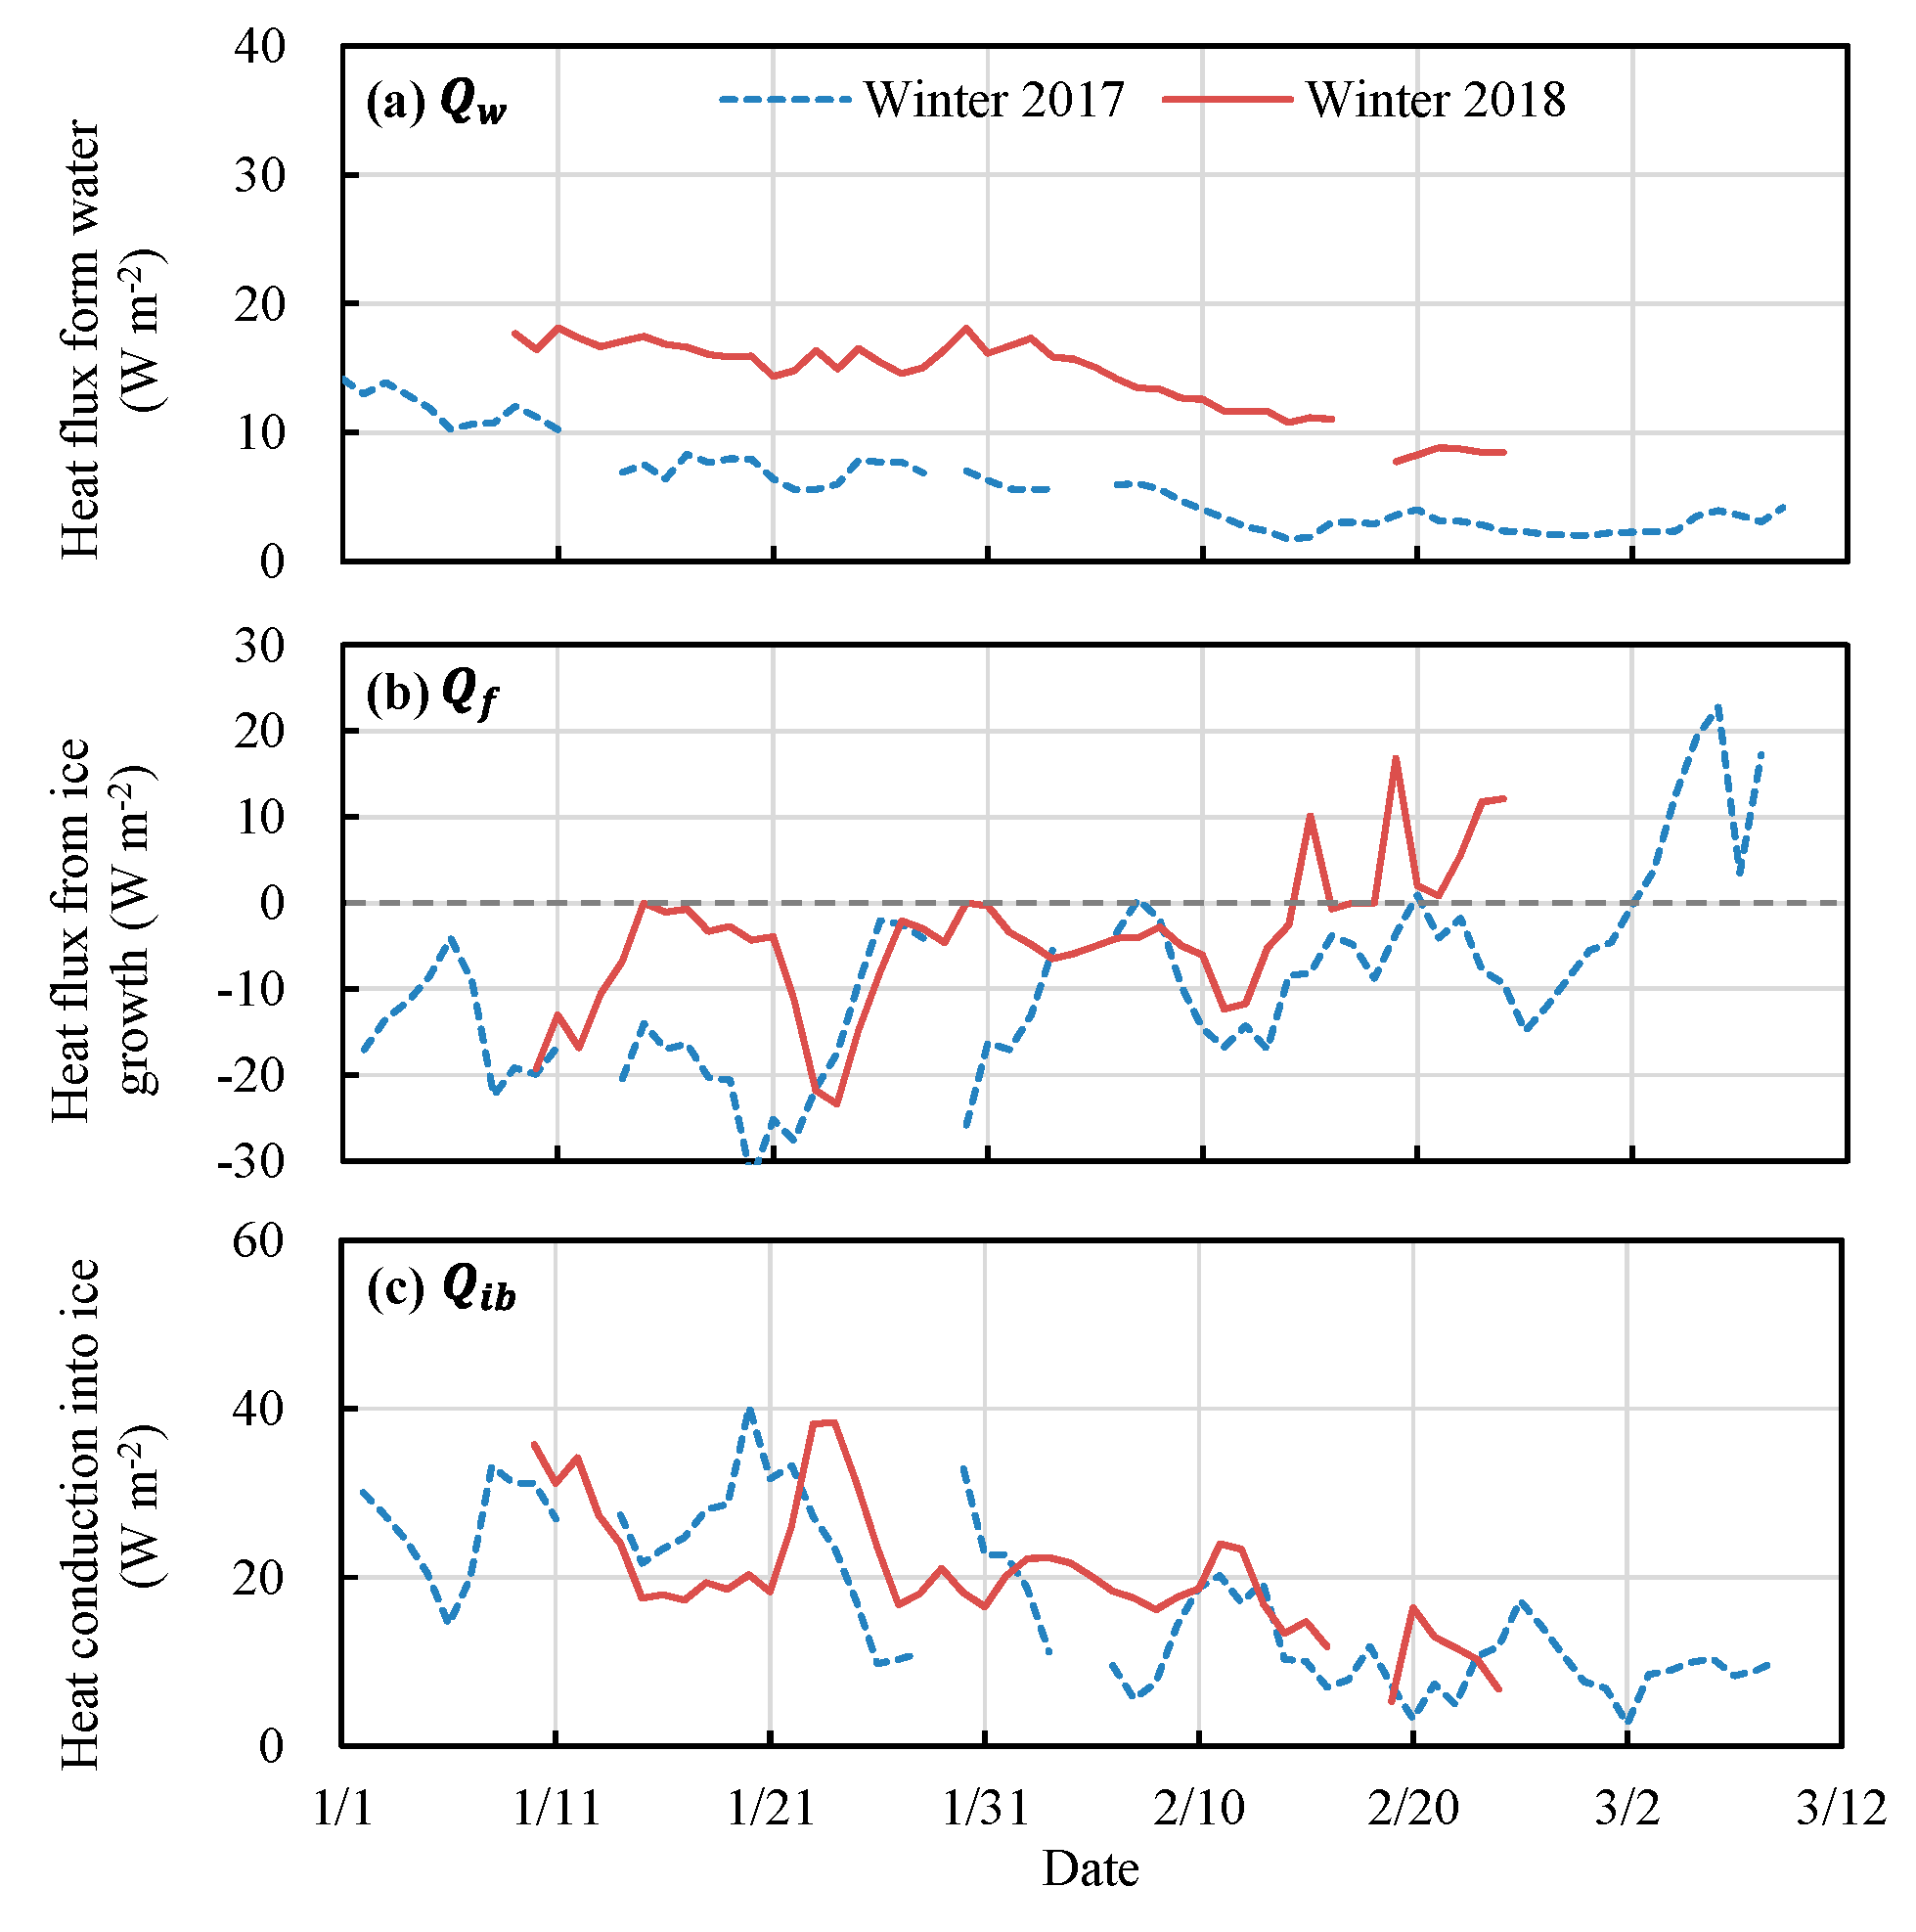
The heat budget at the ice bottom can be calculated using the measured temperature profile (Figure 11). In both winters, the heat flux from water (), derived from Equation (13), first gradually decreased by about −0.18 W m−2 d−1 and then kept stable during the melting period. However, was higher in 2018 than in 2017, with average values of 14.2 and 6.4 W m−2, respectively. The difference was mainly caused by the higher water temperature gradient present in 2018 (0.23 °C cm−1) than in 2017 (0.10 °C cm−1), resulting from stronger solar heating of the water. Figure 11b shows the heat flux during ice growth and melting periods (). Compared to , had no regularity and a strong volatility. In the winters of 2017 and 2018, the average was −11.9 and −4.2 W m−2, respectively. The difference was caused by the slower ice growth rate occurring in 2018 (0.2 cm day−1) than in 2017 (0.4 cm day−1). The heat conduction from bottom to ice () was consistent with , and the peaks were mainly caused by (Figure 11c). Consistent with , was higher in 2018 than in 2017, with average values of 16.7 and 20.3 W m−2, respectively.
3.4.4. Daily Variation in Heat Flux
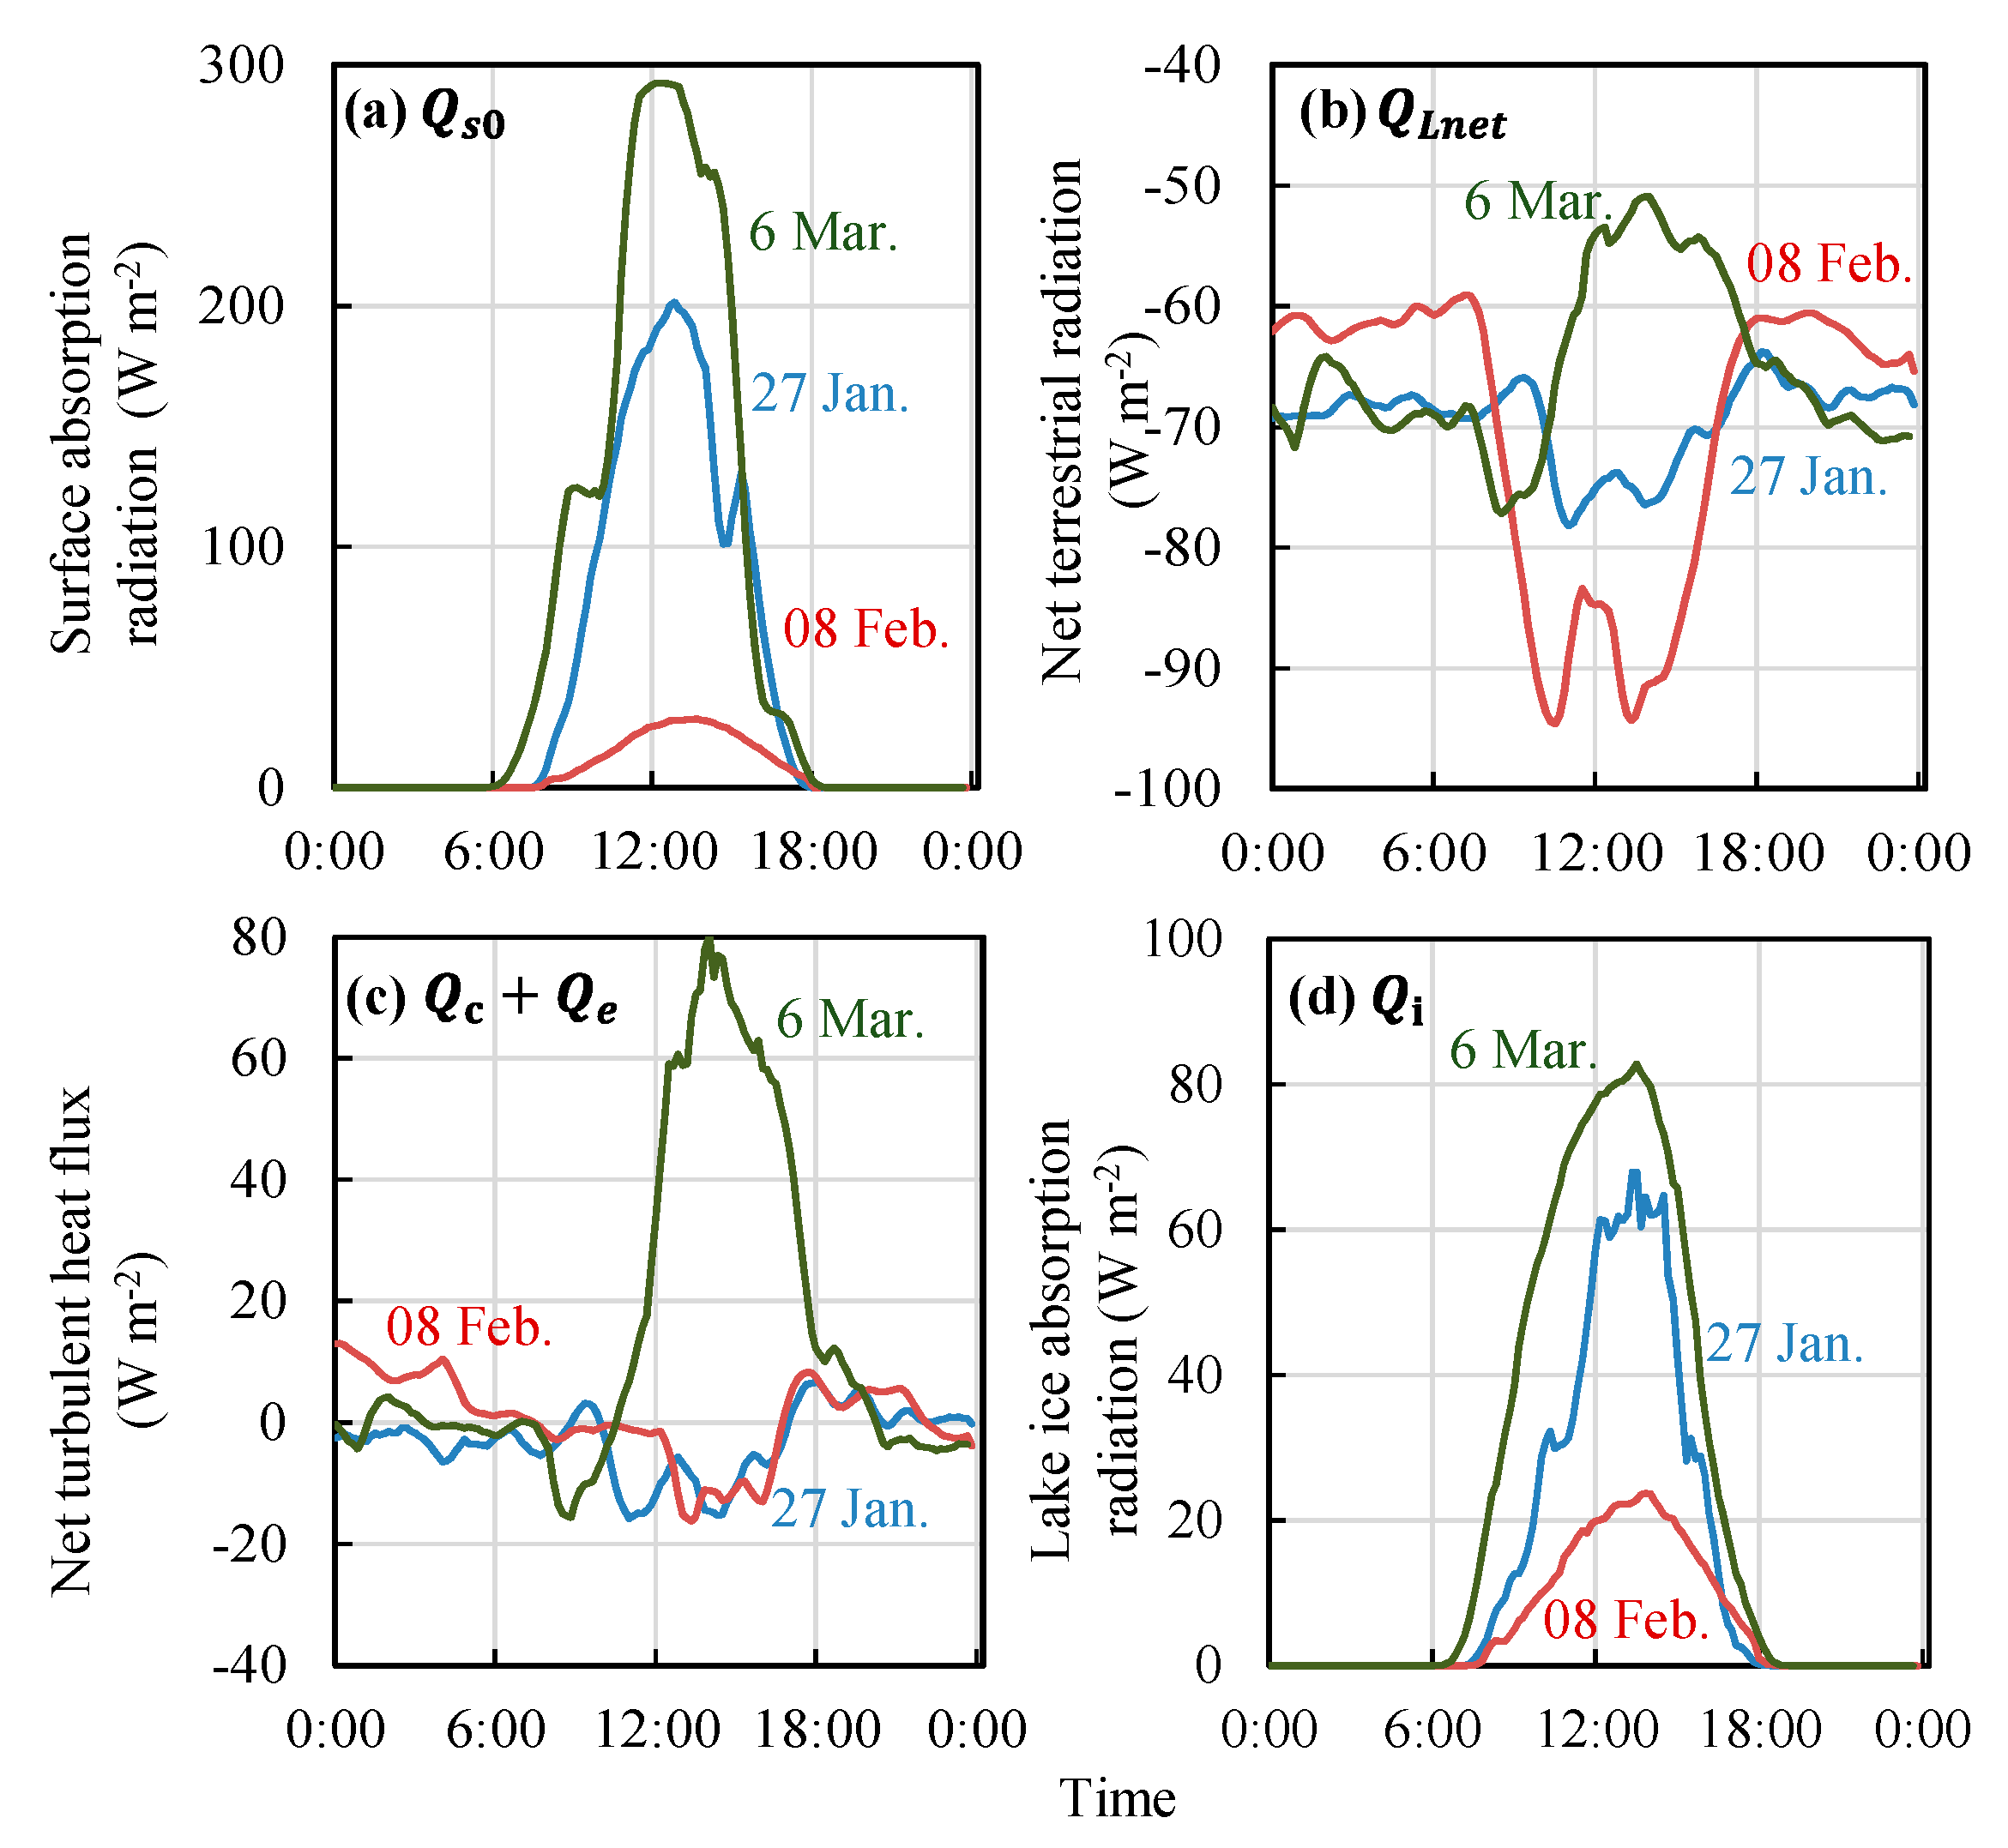
The daily cycle of the surface heat balance was strong in this arid region, because of the large variation in solar elevation and the almost permanent cloudless sky. This is in contrast to boreal lakes, where the low solar altitude and often-overcast sky determine very limited changes in the incident solar radiation during the day in winter [26]. Figure 12 shows the daily cycle of surface heat fluxes under different surface conditions.
The maximum net surface absorption of solar radiation occurred at 13:00, which corresponds to the maximum solar altitude. The highest occurred during the melting period, due to the increase in the surface water volume. was low after snowfall (February 8), and there was only a weak peak at 14:00, probably because the backscatter from snow cover was less sensitive to solar elevation. The net terrestrial radiation () was relatively stable at night (Figure 12b). During the daytime in the bare ice and snow cover period, greatly decreased due to the low , which determined an increase in the difference between surface and air temperatures. However, in the melting period, increased, as increased, reducing the temperature difference.
The net turbulent heat flux was similar to the net terrestrial radiation (Figure 12c). It was stable at about −5 W m−2 in the bare ice and snow cover winter days. After entering the melting period, the turbulent flux became positive, increasing to 14 W m−2. The absorption of radiation inside the ice was similar to that occurring at the surface, and the highest level of absorption occurred during the melting period.
3.4.5. Monthly Average Heat Flux
Table 2 summarizes the monthly heat fluxes to the top surface, ice interior, and bottom surface. In January and February, the surface heat budget was governed by the net terrestrial radiation with a mean value of −71 W m−2. This caused about 29 W m−2 of net heat loss at the ice surface and was mainly compensated by the heat flux derived from water and by the heat released from ice growth. In March 2017, the net terrestrial radiation was still dominant, but solar radiation led to a positive net surface heat budget, causing surface melting. The turbulent heat flux was a minor factor during the observation period.
The solar radiation absorbed by the ice was mainly affected by snow cover, day of the year, and ice physical properties, such as crystal structure, gas bubbles, and colored dissolved organic matter (CDOM). In January, the absorbed radiation was almost equal in both winters. In February, the value of 2017 (10 W m−2) was about half of that of 2018 (22 W m−2), because the snow cover in 2017 increased the surface albedo. After the snow had melted in March 2017, the solar radiation absorbed by the ice increased sharply from 10 to 21 W m−2. The heat flux from the water was 7–8 W m−2 higher in winter 2018 than in winter 2017, due to higher water temperature.
4. Discussion
4.1. Comparisons with Boreal Lake Ice
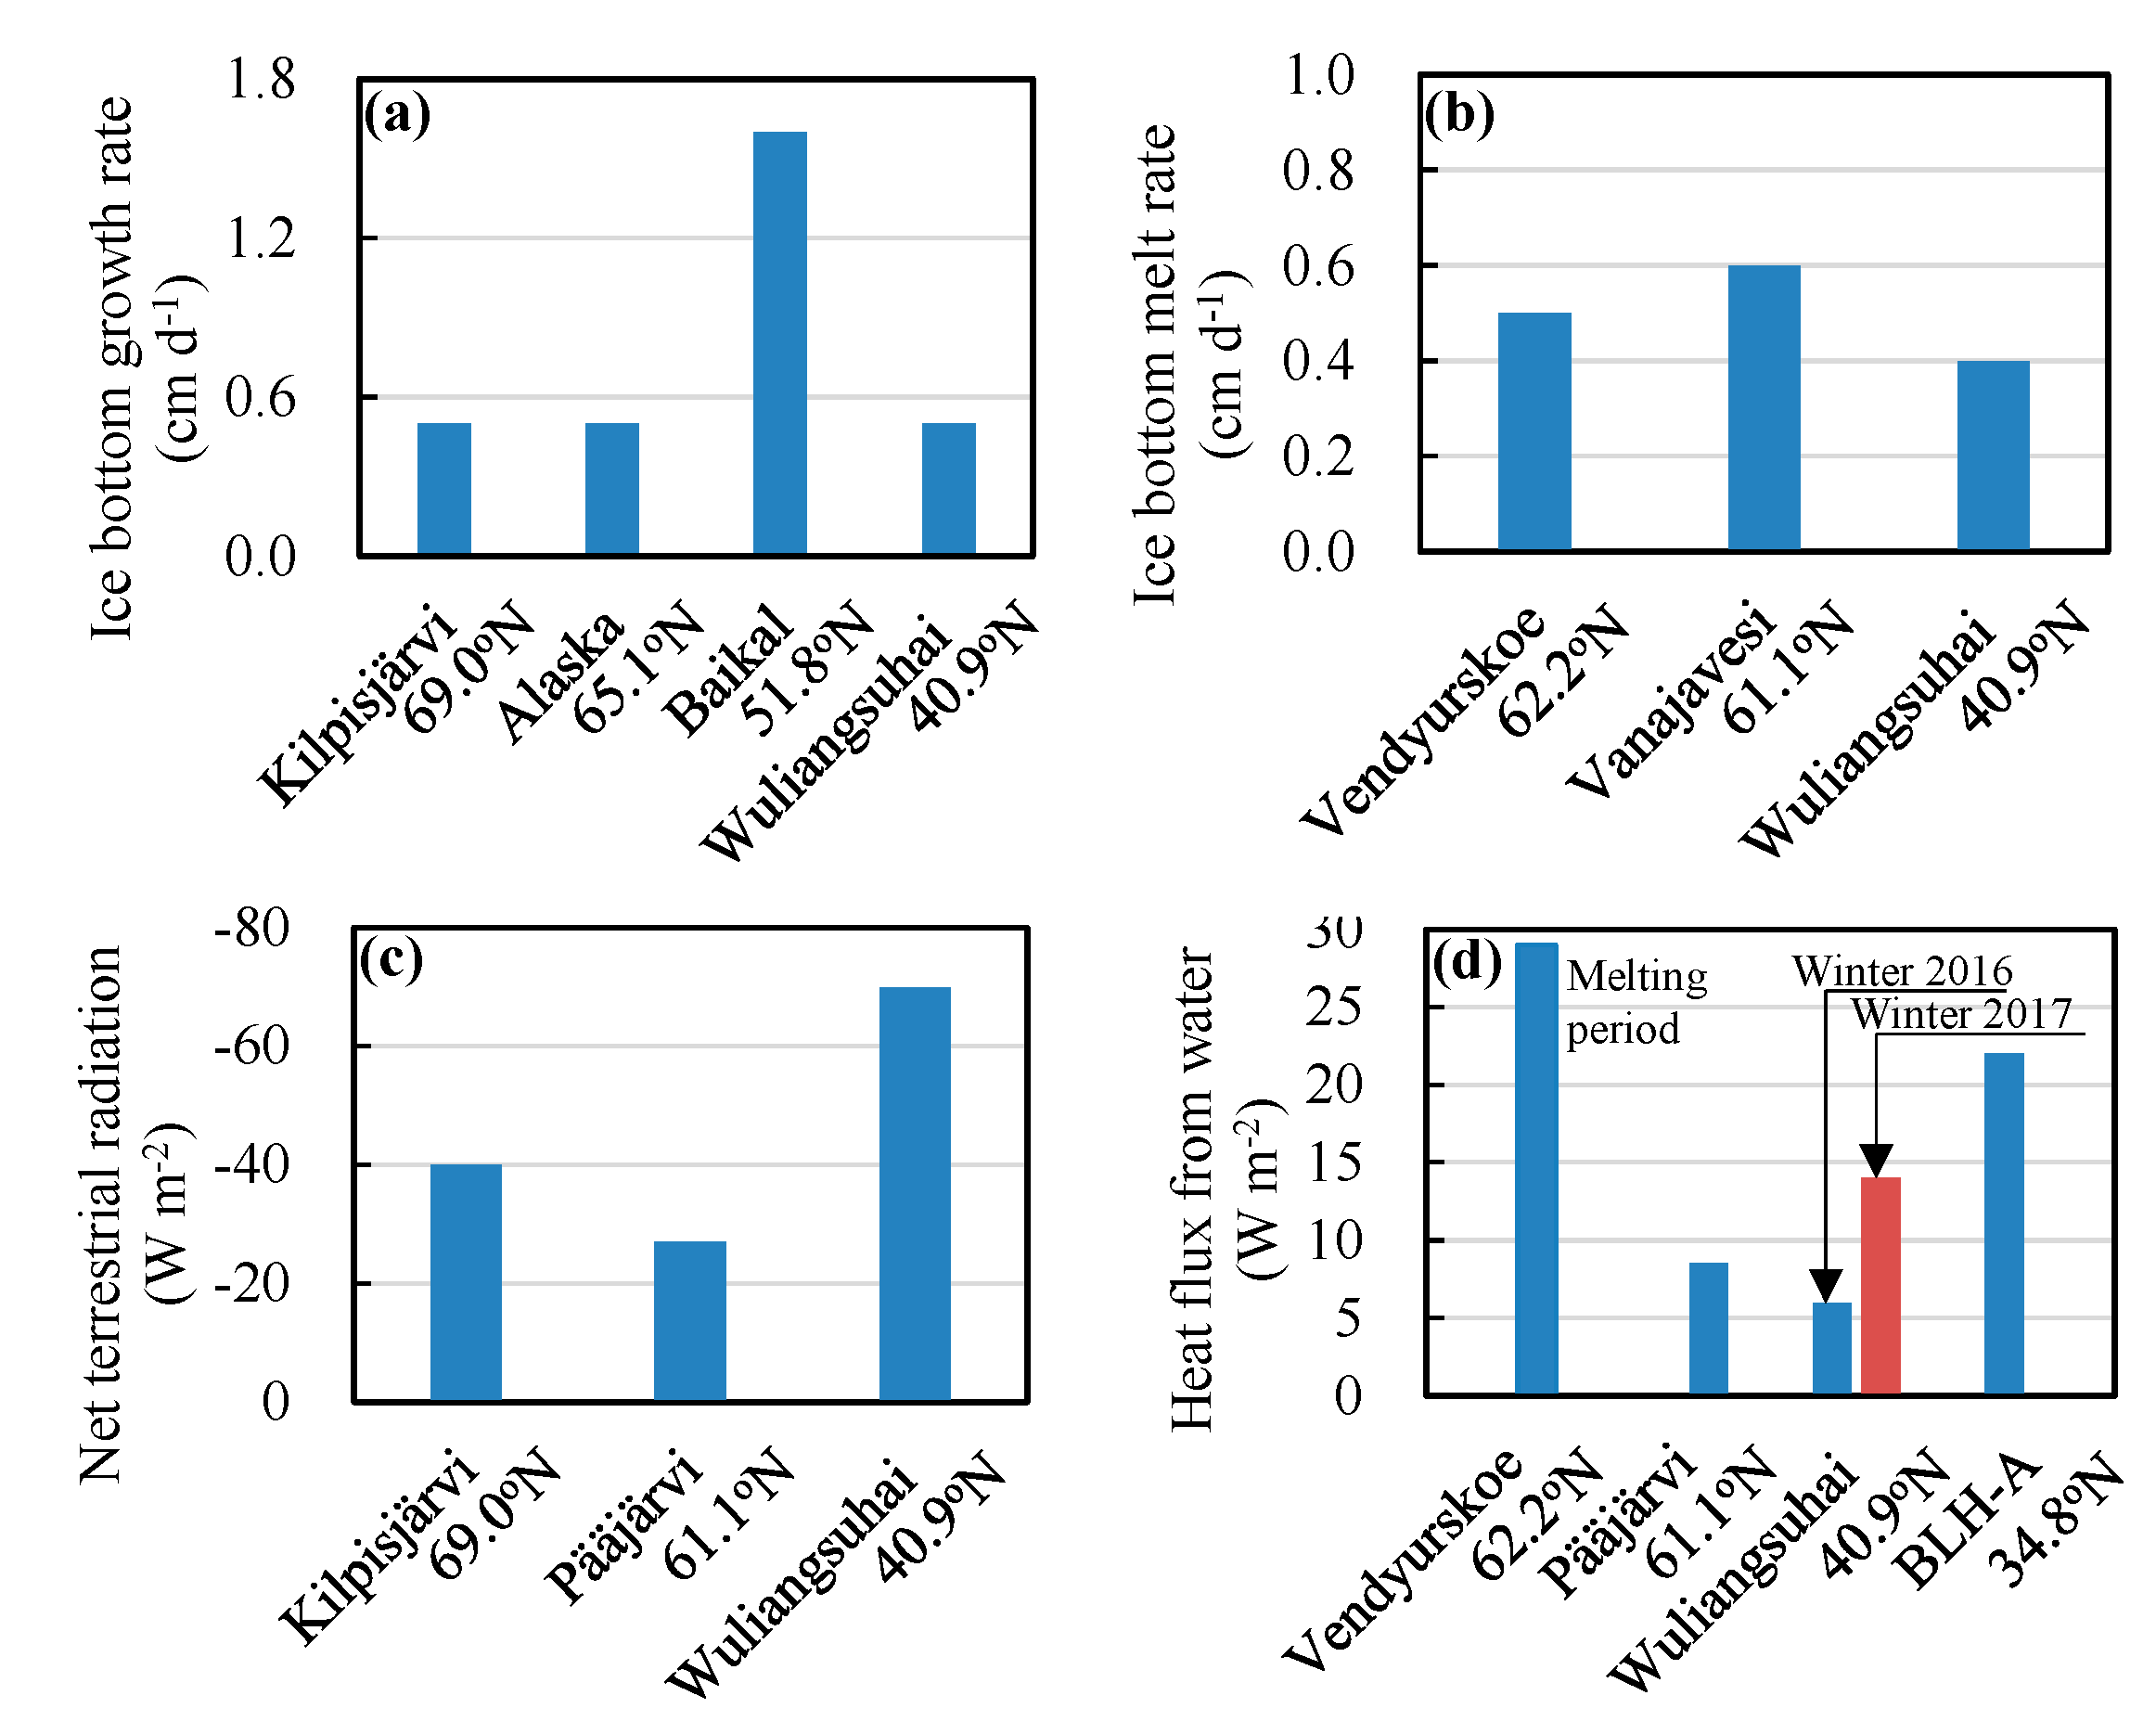
A large number of studies investigated ice dynamics in boreal and tundra lakes, and interesting differences emerge when comparing these high-latitude lakes with the mid-latitude Lake Wuliangsuhai, subject of the present study. (Figure 13).
The ice growth rates of Lake Kilpisjärvi in Arctic tundra [6], Lake Wuliangsuhai, and lakes in central Alaska [29] are almost equal at a value of approximately 0.5 cm d−1. In Lake Baikal the ice growth rate is three times larger (Figure 13a), mainly because of the very thin (<3 cm) snow cover [16]. Snow cover is a dominant factor during the freezing period because ice growth is determined by the intensity of the heat losses at the air-snow/ice and ice–water boundaries [16]. Studies found that the ice melt rate at the ice bottom was 0.5 cm d−1 in Lake Vendyurskoe [26], 0.6 cm d−1 in Lake Vanajavesi [30], and 0.4 cm d−1 in Lake Wuliangsuhai, as shown in Figure 13b. The melting rates of the three lakes were similar, and no obvious regularity is seen, as was the case with the growth rate. The data reported above all refer to the early stage of melting, and the melt rate should increase in later stages [17,29]. The latitude dependence of the ice bottom growth and melting rates, which are mainly affected by the solar radiation, air and water temperature, and snow cover [9,31], is not clear.
The net terrestrial radiation was about −70 W m−2 in Lake Wuliangsuhai, twice as low as in the two high latitude lakes (Figure 13c). This was due to the considerably lower cloudiness present at Lake Wuliangsuhai. As opposed to what occurs during the polar night in high-latitude lakes, the large terrestrial radiation loss observed in Lake Wuliangsuhai was balanced by solar radiation (about 50 W m−2). The average net surface flux was −20 W m−2 in the ice growth period in Lake Wuliangsuhai, which was consistent with values observed in Lake Pääjärvi (−30 W m−2) [9] and Lake Kilpisjärvi (−20 W m−2) [6]. During the melting period, the surface heat balance values of Lake Wuliangsuhai and the high-latitude lakes were similar. The net surface heat flux gradually became positive as solar radiation became stronger.
The results of the heat flux from water to ice in Lake Vendyurskoe [26], Lake Pääjärvi [9], and BLH-A [19] were compared (Figure 13d). The flux was about 8 W m−2 in Lake Pääjärvi. In Lake Wuliangsuhai, there was a large difference between the winters of 2017 and 2018. In 2017, the average was 6 W m−2, similar to the value observed in Lake Pääjärvi. However, in 2018, the average heat flux was considerably greater, measuring 14 W m−2. Compared to 2017, winter 2018 presented less snow cover and thinner ice, which caused more radiation to penetrate through the ice. High-latitude lakes normally have a heavier snow accumulation, which prevents solar radiation from penetrating into the under-ice water, hindering the vertical mass flux and heat conduction and allowing only small heat fluxes at the ice–water interface [19]. Leppäranta et al. [26] reported that the heat flux from water to ice was 29 W m−2 beneath the snow-free ice cover in Lake Vendyurskoe during the melting period. Huang et al. (2019b) also reported that the average heat flux was 22 W m−2 in Lake BLH-A (34.8° N, 92.9° E) during the ice season. These high values are consistent with the results from Lake Wuliangsuhai in 2018, specifically explained by the presence of clear sky, thin ice, and limited snow accumulation.
4.2. Differences in Temperature Regime in the Winters of 2017 and 2018
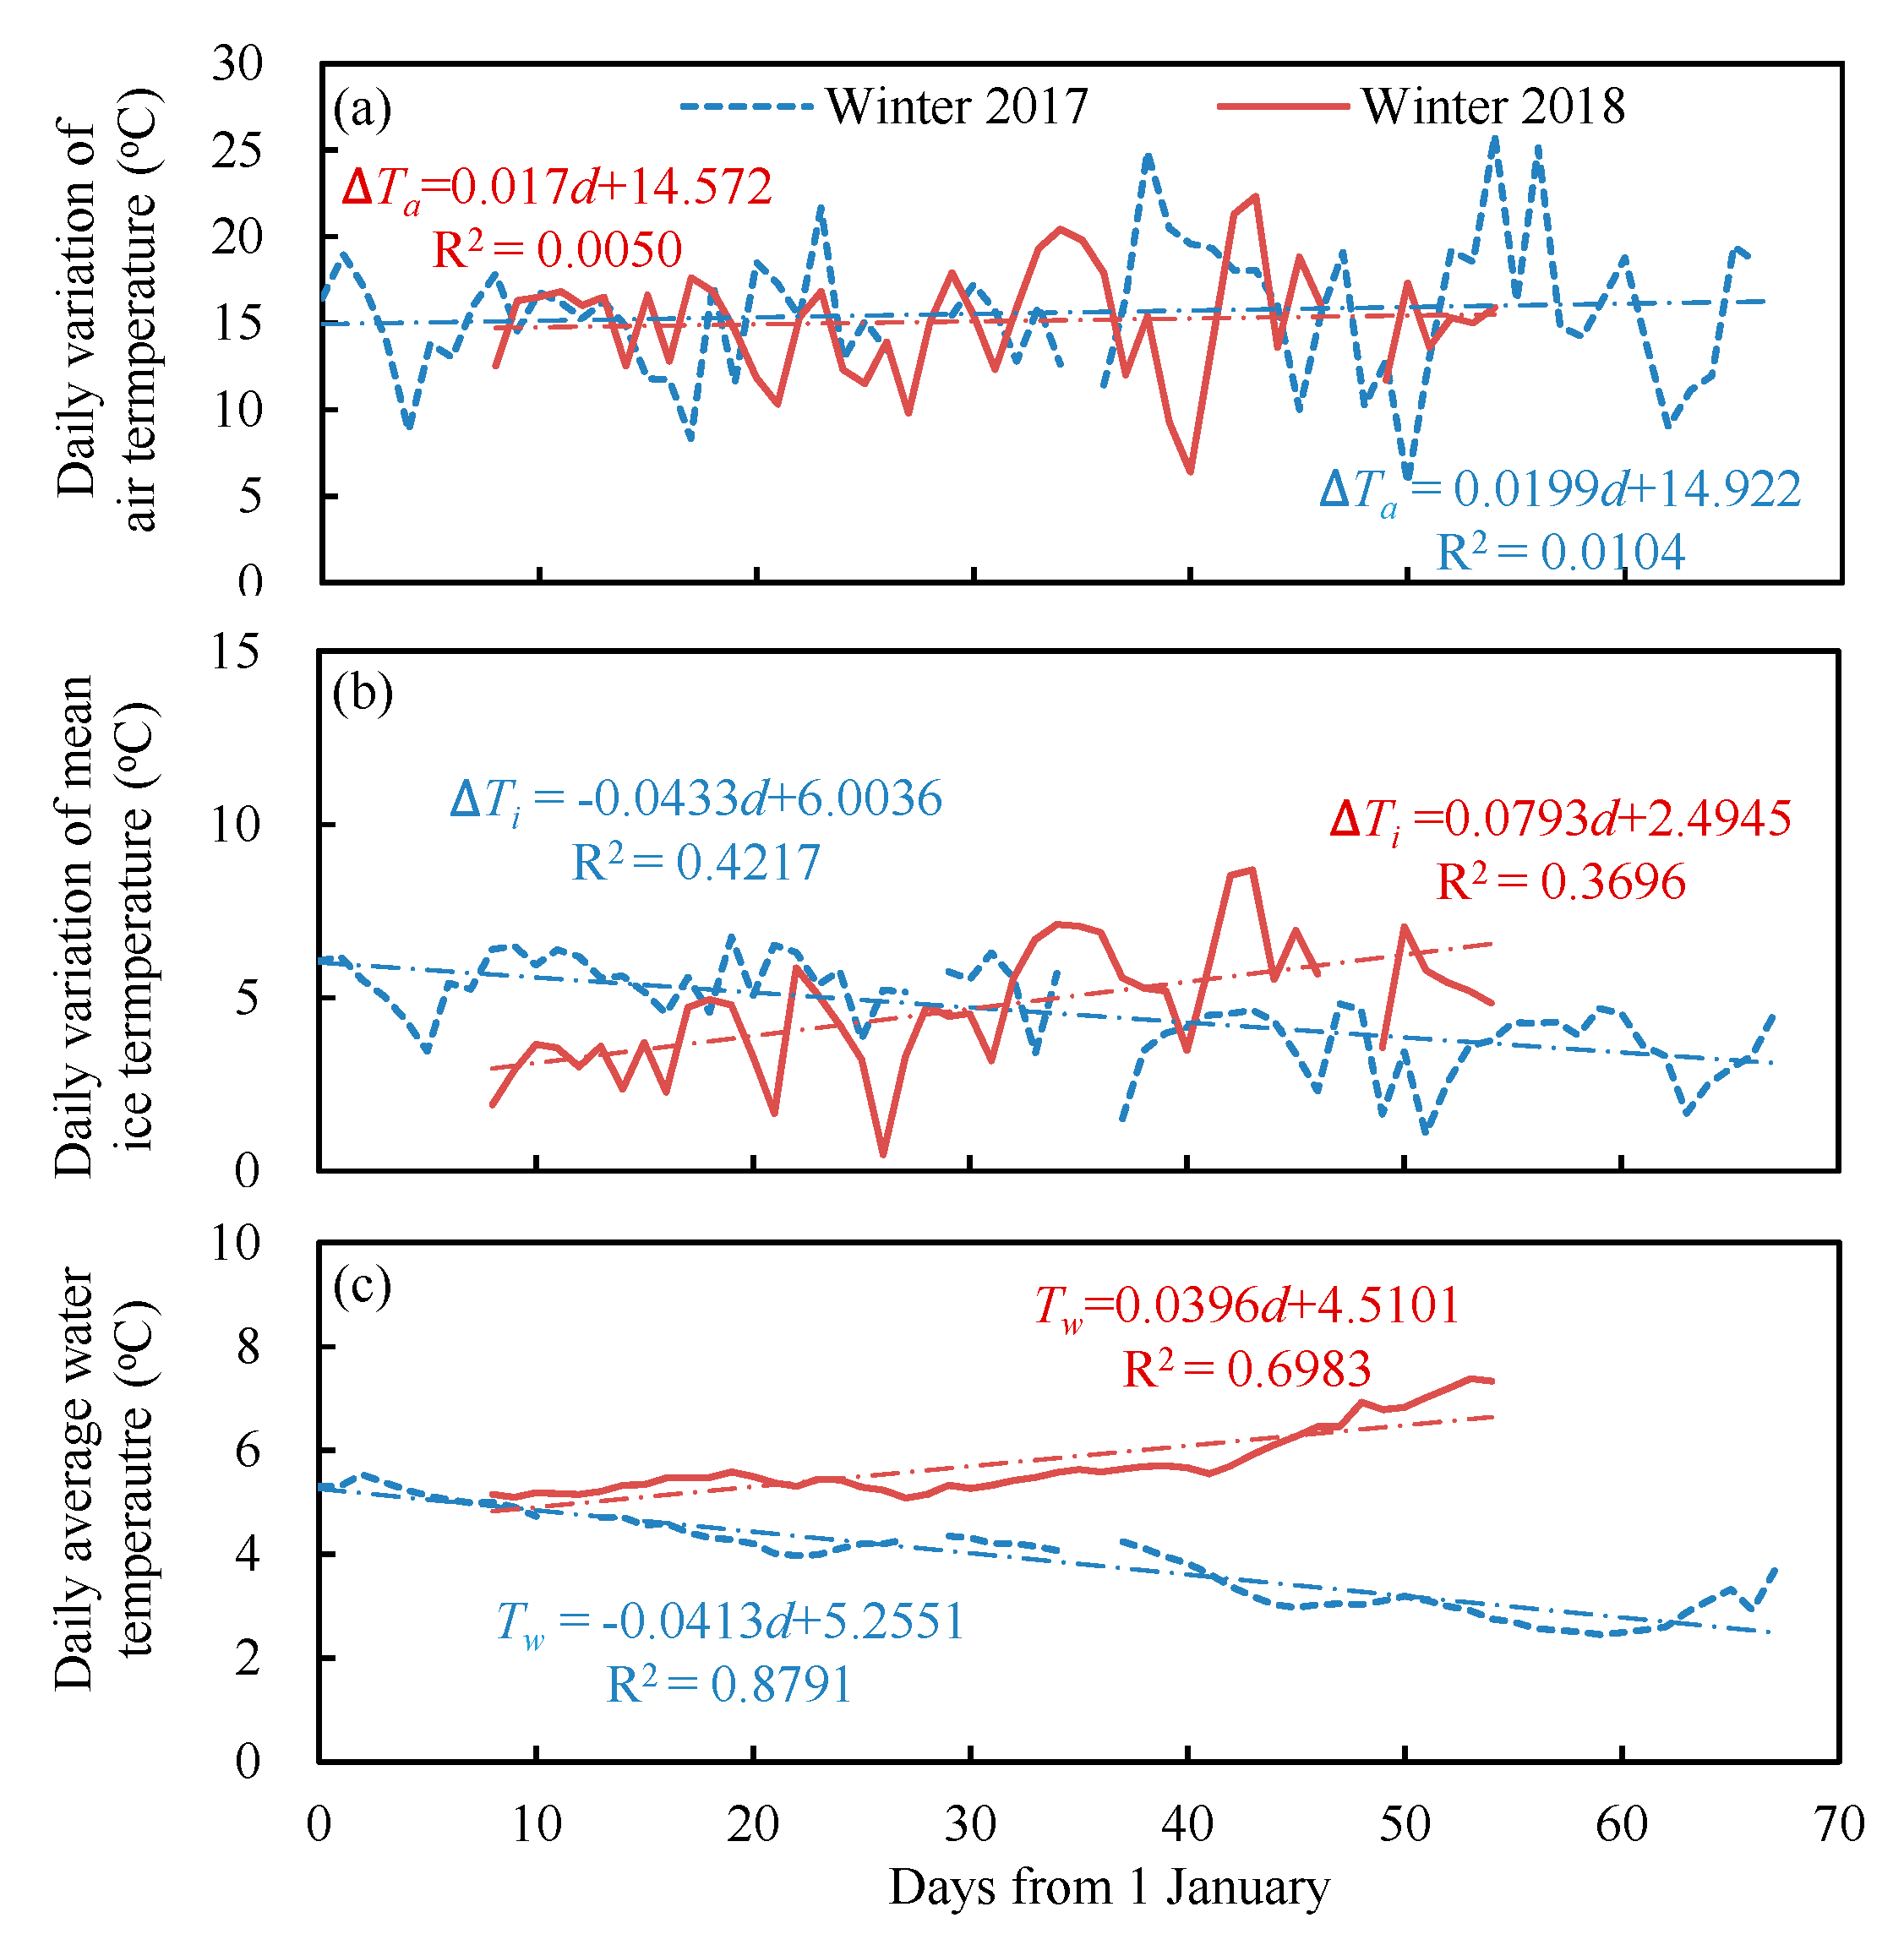
The variations of ice mass and heat budgets in Lake Wuliangsuhai are not identical in the two winters. A major difference existed in the temperature regime (Figure 4). The periodic variability of the upper ice temperature at daytime is affected by the diurnal cycle of air temperature [16], and the deeper ice temperature is affected by water temperature. To fully understand the differences between the two winters, the daily ranges of mean ice temperature (ΔTi) and air temperature (ΔTa) are defined, and their values are shown in Figure 14, as well as the daily mean water temperature (Tw).
The variation of ΔTa was similar in both winters and it ranged from 5 to 25 °C (Figure 14a), but ΔTi was different in the two winters (Figure 14b). In 2017, the average ΔTi was 4.5 °C with a standard deviation of 1.3 °C, and the variation was different from ΔTa. In 2018, the average ΔTi was 4.7 ± 1.7 °C, showing an increasing trend. The average water temperature was 3.8 ± 1.7 °C and 5.7 ± 0.6 °C in 2017 and 2018, respectively (Figure 14c). The trend was the same for the variation of both daily water temperature and ΔTi.
Variations in ΔTi can be further analyzed based on the total daytime heat flux, from 8:00 to 16:00, because ΔTi also represents the rise of ice temperature during the daytime. The total heat flux mainly included the net surface heat flux (), lake ice internal heating (), and ice bottom heat flux (), calculated by Equations (1), (11) and (13), respectively. The heat required for temperature changes was calculated as follows [17,32]:
where is the specific heat of freshwater ice. The second term on the right of the equation determines the internal melting during the melting period. The results are summarized in Table 3.
The last column of Table 3 gives the proportion of the heat flux increase due to variations in ice temperature. In 2018, more than 85% of the heat flux was allocated to the modification of ice temperature. At the beginning of winter 2017, the proportion was similar to that of 2018. After the snowfall event, the proportion decreased to 65%, and the residual part contributed to snow melting [33]. During the melting period, the proportion further reduced to 57% (33% for ΔTi and 24% for internal melting). A larger amount of heat flux was used for internal melting, which is an important factor that affects the melting period [26]. This also resulted in a faster internal melting rate in 2017 (3.4 mm day−1) than in 2018 (1.3 mm−1 day−1).
There were some differences in , , and between the two winters. was mainly affected by the presence of snow, and its value in 2018, when snow was patchy, was about 10% less than that in 2017, when snow was absent at similar dates. Attenuation of light with depth was assumed to follow the Beer–Lambert law of exponential light absorption [9]. The average ice thickness was 0.15 m greater in 2017 than in 2018. According to Equation (12), thicker ice absorbs about 15% more solar radiation, which is consistent with our observations. Conversely, thinner ice allows more radiation to penetrate and warm the lake water. Higher water temperatures conducted more heat into the ice in 2018, delaying the ice growth rate [19].
As shown in Figure 14c, water temperature increased with time. During the observation period, Tw increased by approximately 2.3 °C, which required a radiation flux of about 2.3 W m−2. In 2018, the average solar radiation penetrating through the ice was about 7.6 W m−2, enough for Tw to rise. Compared to 2017, winter 2018 produced thinner ice (15 cm) and shallower water depth (30 cm), which were the main reasons for the difference in Tw.
5. Conclusions and Prospect
Field experiments were performed in Lake Wuliangsuhai, Inner Mongolia, in the winters of 2017 and 2018. This mid-latitude lake and high-latitude lakes differ in terms of their ice season. The measurements considered in this study were ice and snow thickness, surface heat balance, temperature distribution in ice and water, and solar radiation at the surface and below the ice. The purpose was to examine the evolution of the ice and snow thickness, and the mass and heat balance of the lake in winter.
In 2017 and 2018, the mean snow and ice thickness values were 5.2 and 50.9 cm, and 1.6 and 36.1 cm, respectively. As for the lake ice mass balance, the accumulated sublimation was 1.9 and 3.6 mm, respectively. At the lower ice boundary, the freezing rate was 3.6 and 2.1 mm day−1. In 2017 and 2018, the mean internal melting during the daytime was 3.4 and 1.3 mm, respectively. The surface heat budget was governed by solar radiation and terrestrial radiation, which caused heat losses of approximately 20–40 W m−2 during the ice growth period. The snow and ice internal radiative heat flux was 9–22 W m−2, and it was affected by snow and ice thickness. Compared to high-latitude lakes, the heat flux derived from water was higher in Lake Wuliangsuhai, due to the strong solar heating of the water. The ice temperature had a strong diurnal variation, which was produced by the diurnal cycles of solar radiation, air, and water temperatures.
The results of this study can be used to assess models of mass and heat balance of frozen lakes in cold and arid climates at middle latitudes. These results, together with knowledge from previous studies of boreal lakes, will improve our understanding of the response of ice-covered lakes to global and local changes in the climate. In this study, due to the weakening of ice, technical problems, and safety issues, it was not possible to collect sufficient data during the melting period. In future studies, a floating platform [6] will be used to monitor the area throughout the winter to further clarify the dynamics of ice mass and heat balance during melting processes.
Author Contributions
Conceptualization, Z.L. and G.L.; investigation, X.C.; writing—original draft preparation, X.C., P.L., and M.L.; writing—review and editing, W.H., L.A., and J.H. All authors have read and agreed to the published version of the manuscript.
Funding
This research was supported by the National Natural Science Foundation of China (51979024, 41876213, 41676187), the Open Fund of State Key Laboratory of Frozen Soil Engineering (SKLFSE201604), the Fundamental Research Funds for the Central Universities (DUT20GJ206). Matti Leppäranta was supported by the Bilateral Exchange Programme of the Chinese Academy of Sciences and Academy of Finland. Lauri Arvola was supported by the Academy of Finland (grant number 298312, 310997, 315527, 325382). Jussi Huotari was supported by the Academy of Finland (grant number 311520, 316866, 325446) and by The European Regional Development Fund (grant number A75357).
Acknowledgments
The authors would like to thank the research group from Water Conservancy and Civil Engineering College (Inner Mongolia Agricultural University), for their contributions to the in-situ measurement.
Conflicts of Interest
The authors declare no conflict of interest. The funders had no role in the design of the study; in the collection, analyses, or interpretation of data; in the writing of the manuscript, or in the decision to publish the results.
References
- Brown, L.C.; Duguay, C.R. The response and role of ice cover in lake-climate interactions. Prog. Phys. Geogr. 2010, 34, 671–704. [Google Scholar] [CrossRef]
- Leppäranta, M. Freezing of Lakes and the Evolution of Their Ice Cover; Springer: Heidelberg, Germany, 2015; pp. 91–129. [Google Scholar] [CrossRef]
- Rouse, W.R.; Binyamin, J.; Blanken, P.D.; Bussières, N.; Duguay, C.R.; Qswald, C.J.; Schertzer, W.M.; Spence, C. The influence of lakes on the regional energy and water balance of the Central Mackenzie River Basin. Cold region atmospheric and hydrologic studies. In The Mackenzie Gewex Experience, Volume 1: Atmospheric Dynamics; Springer: Berlin, Heidelberg, 2008; pp. 309–325. [Google Scholar] [CrossRef]
- Prowse, T.D.; Chew, H.A.M.; Demuth, M.N. The deterioration of freshwater ice due to radiation decay. J. Hydraul. Res. 1990, 28, 685–697. [Google Scholar] [CrossRef]
- Magnuson, J.J.; Robertson, D.M.; Benson, B.J.; Wynne, R.H.; Livingstone, D.M.; Arai, T.; Assel, R.A.; Barry, R.G.; Card, V.; Kuusisto, E.; et al. Historical trends in lake and river ice cover in the northern hemisphere. Science 2000, 289, 174–175. [Google Scholar] [CrossRef] [PubMed] [Green Version]
- Leppäranta, M.; Lindgren, E.; Shirasawa, K. The heat budget of Lake Kilpisjärvi in the Arctic tundra. Hydrol. Res. 2017, 48, 969–980. [Google Scholar] [CrossRef]
- Hewitt, B.A.; Lopez, L.S.; Gaibisels, K.M.; Murdoch, A.; Higgins, S.N.; Magnuson, J.J.; Paterson, A.M.; Rusak, J.A.; Yao, H.X.; Sharma, S. Historical trends, drivers, and future projections of ice phenology in small north temperate lakes in the Laurentian Great Lakes Region. Water 2018, 10, 70. [Google Scholar] [CrossRef] [Green Version]
- Solarski, M.; Rzętała, M. Ice Regime of the Kozłowa Góra Reservoir (Southern Poland) as an Indicator of Changes of the Thermal Conditions of Ambient Air. Water 2020, 12, 2435. [Google Scholar] [CrossRef]
- Jakkila, J.; Leppäranta, M.; Kawamura, T.; Shirasawa, K.; Salonen, K. Radiation transfer and heat budget during the ice season in Lake Pääjärvi, Finland. Aquat. Ecol. 2009, 43, 681–692. [Google Scholar] [CrossRef]
- Leppäranta, M.; Tikkanen, M.; Shemeikka, P. Observations of ice and its sediments on the Baltic coast. Hydrol. Res. 1998, 29, 199–220. [Google Scholar] [CrossRef]
- Belzile, C.; John, A.E.G.; Vincent, W.F. Colored Dissolved organic matter and dissolved organic carbon exclusion from lake ice: Implications for irradiance transmission and carbon cycling. Limnol. Oceanol. 2002, 47, 1283–1293. [Google Scholar] [CrossRef] [Green Version]
- Lei, R.B.; Zhang, Z.H.; Matero, I.; Cheng, B.; Li, Q.; Huang, W.F. Reflection and transmission of irradiance by snow and sea ice in the central Arctic Ocean in summer 2010. Polar Res. 2012, 31, 17325. [Google Scholar] [CrossRef]
- Lu, P.; Cao, X.W.; Wang, Q.K.; Leppäranta, M.; Cheng, B. Impact of a surface ice lid on the optical properties of melt ponds. J. Geophys. Res. Oceans. 2018, 123, 8313–8328. [Google Scholar] [CrossRef]
- Lei, R.B.; Leppäranta, M.; Erm, A.; Jaatinen, E.; Pärn, O. Field investigations of apparent optical properties of ice cover in Finnish and Estonian lakes in winter 2009. Est. J. Earth Sci. 2011, 60, 50–64. [Google Scholar] [CrossRef]
- Arst, H.; Erm, A.; Leppäranta, M.; Reinart, A. Radiative characteristics of ice covered fresh and brackish–water bodies. Proc. Est. Acad. Sci. Geol. 2006, 55, 3–23. [Google Scholar]
- Aslamov, I.A.; Kozlov, V.V.; Kirillin, G.B.; Mizandrontsev, I.B.; Kucher, K.M.; Makarov, M.M. Ice-water heat exchange during ice growth in Lake Baikal. J. Great Lakes Res. 2014, 40, 599–607. [Google Scholar] [CrossRef]
- Leppäranta, M.; Lindgren, E.; Wen, L.J.; Kirillin, G. Ice cover decay and heat balance in Lake Kilpisjärvi in Arctic tundra. J. Limnol. 2019, 78, 163–175. [Google Scholar] [CrossRef] [Green Version]
- Shi, L.Q.; Li, Z.J.; Niu, F.J.; Huang, W.F.; Lu, P.; Feng, E.; Han, H.W. Thermal diffusivity of thermokarst lake ice in the Beiluhe basin of the Qinghai–Tibetan Plateau. Ann. Glaciol. 2014, 55, 153–158. [Google Scholar] [CrossRef] [Green Version]
- Huang, W.F.; Zhang, J.R.; Leppäranta, M.; Li, Z.J.; Cheng, B.; Lin, Z.J. Thermal structure and water-ice heat transfer in a shallow ice-covered thermokarst lake in central Qinghai-Tibet Plateau. J. Hydrol. 2019, 578, 124122. [Google Scholar] [CrossRef]
- Su, D.S.; Hu, X.Q.; Wen, L.J.; Zhao, L.; Li, Z.G.; Du, J.; Kirillin, G. Numerical study on the response of the largest lake in China to climate change. Hydrol. Earth Syst. Sci. 2019, 23, 2093–2109. [Google Scholar] [CrossRef] [Green Version]
- Huang, W.F.; Cheng, B.; Zhang, J.R.; Zhang, Z.; Vihma, T.; Li, Z.J.; Niu, F.J. Modeling experiments on seasonal lake ice mass and energy balance in the Qinghai–Tibet Plateau: A case study. Hydrol. Earth Syst. Sci. Dicuss. 2019, 23, 2173–2186. [Google Scholar] [CrossRef] [Green Version]
- Yang, F.; Li, C.Y.; Shi, X.H.; Zhao, S.N.; Hao, Y.Z. Impact of seasonal ice structure characteristics on ice cover impurity distributions in Lake Ulansuhai. J. Lake Sci. 2016, 28, 455–462. (In Chinese) [Google Scholar] [CrossRef] [Green Version]
- Song, S.; Li, C.Y.; Shi, X.H.; Zhao, S.N.; Li, Z.J.; Bai, Y.L.; Cao, X.W.; Wang, Q.K.; Huotari, J.; Tulonen, T.; et al. Under-ice metabolism in a shallow lake in a cold and arid climate. Freshw. Biol. 2019, 64, 1710–1720. [Google Scholar] [CrossRef]
- Li, Z.J.; Yang, Y.; Peng, X.M.; Wang, G.Z.; Lu, Y.C. The analysis of the field observation data of fresh ice growing process in Hongqipao Reservoir of Heilongjiang. J. Xi’an Univ. Technol. 2009, 25, 270–274. (In Chinese) [Google Scholar] [CrossRef]
- Louis, J.F. Parametric model of vertical eddy fluxes in the atmosphere. Bound. Layer Meteor. 1979, 17, 187–202. [Google Scholar] [CrossRef]
- Leppäranta, M.; Terzhevik, A.; Shirasawa, K. Solar radiation and ice melting in Lake Vendyurskoe, Russian Karelia. Hydrol. Res. 2010, 41, 50–62. [Google Scholar] [CrossRef]
- Cao, X.W.; Lu, P.; Leppäranta, M.; Arvola, L.; Huotari, J.; Shi, X.H.; Li, G.Y.; Li, Z.J. Solar radiation transfer for an ice-covered lake in the central Asian arid climate zone. Inland Waters 2020. [Google Scholar] [CrossRef]
- Cheng, B.; Zhang, Z.H.; Vihma, T.; Johansson, M.; Bian, L.G.; Li, Z.J.; Wu, H.D. Model experiments on snow and ice thermodynamics in the Arctic Ocean with CHINARE 2003 data. J. Geophys. Res. 2008, 113, C09020. [Google Scholar] [CrossRef] [Green Version]
- Jeffries, M.O.; Morris, K.; Duguay, C.R. Lake ice growth and decay in central Alaska, USA: Observations and computer simulations compared. Ann. Glacial. 2005, 40, 195–199. [Google Scholar] [CrossRef] [Green Version]
- Yang, Y.; Leppäranta, M.; Cheng, B.; Li, Z.J. Numerical modelling of snow and ice thicknesses in Lake Vanajavesi, Finland. Tellus A Dyn. Meteorol. Oceanogr. 2012, 64, 17202. [Google Scholar] [CrossRef] [Green Version]
- Cheng, B.; Vihma, T.; Rontu, L.; Kontu, A.; Pour, H.K.; Duguay, C.; Pulliainen, J. Evolution of snow and ice temperature, thickness and energy balance in Lake Orajärvi, northern Finland. Tellus A Dyn. Meteorol. Oceanogr. 2014, 66, 21564. [Google Scholar] [CrossRef]
- Aslamov, I.A.; Kozlov, V.V.; Kirillin, G.B.; Mizandrontsev, I.B.; Kucher, K.M.; Makarov, M.M.; Granin, N.N. A study of heat transport at the ice base and structure of the under-ice water layer in Southern Baikal. Water Resour. 2017, 44, 428–441. [Google Scholar] [CrossRef]
- Welch, H.E.; Legault, J.A.; Bergmann, M.A. Effects of snow and ice on the annual cycles of heat and light in Saqvaqjuac Lakes. Can. J. Fish. Aquat. Sci. 1987, 44, 1451–1461. [Google Scholar] [CrossRef]
Figure 1.
Location of Lake Wuliangsuhai, Inner Mongolia, and field site in winter 2017 and 2018 marked by the red triangle (source of the picture on the right: http://www.google.cn/maps).
Figure 1.
Location of Lake Wuliangsuhai, Inner Mongolia, and field site in winter 2017 and 2018 marked by the red triangle (source of the picture on the right: http://www.google.cn/maps).

Figure 2.
Meteorological tower measurements at the site in winter 2017 (a) and 2018 (b). Due to the damage to the lifting tower, a simple frame was used in 2018.
Figure 2.
Meteorological tower measurements at the site in winter 2017 (a) and 2018 (b). Due to the damage to the lifting tower, a simple frame was used in 2018.

Figure 3.
Time series of air temperature in winter 2017 (a) and 2018 (b). Maximum, minimum, and average values are highlighted.
Figure 3.
Time series of air temperature in winter 2017 (a) and 2018 (b). Maximum, minimum, and average values are highlighted.

Figure 4.
Snow and ice thickness in winter 2017 (a) and 2018 (b), and photographs of the ice surface on different dates. The zero level in the plots refers to the ice surface. In the winter of 2017, a camera was used to photograph the surface below the radiation sensor, and in the winter of 2018, an unmanned aerial vehicle was used to shoot the whole observation area.

Figure 5.
The daily sublimation (a), precipitation (b), and freezing and melting (c) in the winters of 2017 and 2018. The mass of lake ice is expressed as the thickness of equivalent water.
Figure 5.
The daily sublimation (a), precipitation (b), and freezing and melting (c) in the winters of 2017 and 2018. The mass of lake ice is expressed as the thickness of equivalent water.

Figure 6.
Ice and water temperatures in the winters of 2017 and 2018.

Figure 7.
Ice temperature vs. normalized depth at 0:00, 4:00, 8:00, 12:00, 16:00, and 20:00 on 27 January (no snow) (a), February 8 (with snow cover) (b), and March 6 (melting period) (c). and are the ice and snow thickness, respectively, and is the daily variation of air temperature.
Figure 7.
Ice temperature vs. normalized depth at 0:00, 4:00, 8:00, 12:00, 16:00, and 20:00 on 27 January (no snow) (a), February 8 (with snow cover) (b), and March 6 (melting period) (c). and are the ice and snow thickness, respectively, and is the daily variation of air temperature.

Figure 8.
The bulk Richardson number in the winters of 2017 and 2018.

Figure 9.
Solar radiation absorbed by the ice surface (a), terrestrial radiation (b), sensible (c) and latent (d) heat fluxes, and net surface heat flux (e).
Figure 9.
Solar radiation absorbed by the ice surface (a), terrestrial radiation (b), sensible (c) and latent (d) heat fluxes, and net surface heat flux (e).

Figure 10.
Snow and ice absorption of solar radiation in 2017 and 2018.

Figure 11.
Heat budget of the ice bottom, heat flux from water (a), heat flux from ice growth (b), and heat conduction from bottom to ice (c).
Figure 11.
Heat budget of the ice bottom, heat flux from water (a), heat flux from ice growth (b), and heat conduction from bottom to ice (c).

Figure 12.
The daily cycle of the surface absorption of solar radiation (a), net terrestrial radiation (b), net turbulent heat flux (c), and lake ice absorption of solar radiation (d) on January 27, February 8, and March 6.
Figure 12.
The daily cycle of the surface absorption of solar radiation (a), net terrestrial radiation (b), net turbulent heat flux (c), and lake ice absorption of solar radiation (d) on January 27, February 8, and March 6.

Figure 13.
Comparison of Lake Wuliangsuhai with high-latitude lakes in terms of ice growth rate (a) [6,16,29], melt rate (b) [26,30], net terrestrial radiation (c) [6,9], and heat flux from water (d) [9,19,26].

Figure 14.
Daily variation of mean air temperature (a), ice temperature (b), and daily average water temperature (c).
Figure 14.
Daily variation of mean air temperature (a), ice temperature (b), and daily average water temperature (c).


Table 1.
Specifications of the measuring instruments.
| Quantity | Sensor | Range | Accuracy |
|---|---|---|---|
| Temperature | PTWD | −40–+80 °C | ±0.04 °C |
| Humidity | PTS-3 | 0–100% RH | ±2% RH |
| Wind speed | PC-2FB | 0.1–30 m/s | ±0.4 m/s |
| Wind direction | EC-9X1A | 0–360° | ±0.6° |
| Radiative surface temperature | S1-111 | −40–+70 °C | ±0.5 °C |
| Ice thickness (ultrasonic) | WUUL-I | 10–200 cm | ±0.2 cm |
| Spectral irradiance | RAMSES-ACC-VIS | 320–950 nm band | <5% |
| Global radiation | TBQ-2 | 300–3000 nm band | <5% |
Table 2.
Monthly heat fluxes (W m−2) in the winters of 2017 and 2018.
| Winter 2017 | Winter 2018 | ||||
|---|---|---|---|---|---|
| January | February | March | January | February | |
| Surface heat budget | |||||
| Solar radiation | 48 | 48 | 72 | 41 | 58 |
| Net terrestrial radiation | −72 | −70 | −67 | −72 | −73 |
| Net turbulent heat flux | −6 | 1 | 4 | −8 | −7 |
| Net surface flux | −31 | −22 | 9 | −40 | −22 |
| Ice and snow interior | |||||
| Solar radiation | 9 | 10 | 21 | 9 | 22 |
| Ice bottom | |||||
| Heat flux from water | 9 | 4 | 3 | 16 | 12 |
| Freezing | −16 | −8 | 0 | −8 | −6 |
| Melting | 0 | 0 | 9 | 0 | 7 |
Table 3.
Average daytime (8:00–16:00) heat flux and variation of ice temperature in different surface conditions.
Table 3.
Average daytime (8:00–16:00) heat flux and variation of ice temperature in different surface conditions.
| Year | Date (Month.Day) | Total | ΔT | |||||
|---|---|---|---|---|---|---|---|---|
| (W m−2) | (°C) | (W m−2) | ||||||
| 2017 | 1.1–2.6 (No snow) | 54 | 32 | 20 | 106 | 2.7 | 88 | 0.82 |
| 2.7–2.28 (Snow) | 70 | 30 | 11 | 112 | 2.1 | 73 | 0.65 | |
| 3.1–3.9 (Melting) | 139 | 55 | 8 | 204 | 1.8 | 117 | 0.57 | |
| 2018 | 1.9–2.12 (Partly snow) | 47 | 23 | 43 | 114 | 4.3 | 101 | 0.88 |
| 2.13–2.24 (Melting) | 112 | 41 | 12 | 166 | 5.9 | 154 | 0.92 | |
Publisher’s Note: MDPI stays neutral with regard to jurisdictional claims in published maps and institutional affiliations. |
© 2020 by the authors. Licensee MDPI, Basel, Switzerland. This article is an open access article distributed under the terms and conditions of the Creative Commons Attribution (CC BY) license (http://creativecommons.org/licenses/by/4.0/).
Share and Cite
MDPI and ACS Style
Lu, P.; Cao, X.; Li, G.; Huang, W.; Leppäranta, M.; Arvola, L.; Huotari, J.; Li, Z. Mass and Heat Balance of a Lake Ice Cover in the Central Asian Arid Climate Zone. Water 2020, 12, 2888. https://doi.org/10.3390/w12102888
AMA Style
Lu P, Cao X, Li G, Huang W, Leppäranta M, Arvola L, Huotari J, Li Z. Mass and Heat Balance of a Lake Ice Cover in the Central Asian Arid Climate Zone. Water. 2020; 12(10):2888. https://doi.org/10.3390/w12102888
Chicago/Turabian StyleLu, Peng, Xiaowei Cao, Guoyu Li, Wenfeng Huang, Matti Leppäranta, Lauri Arvola, Jussi Huotari, and Zhijun Li. 2020. "Mass and Heat Balance of a Lake Ice Cover in the Central Asian Arid Climate Zone" Water 12, no. 10: 2888. https://doi.org/10.3390/w12102888
Note that from the first issue of 2016, this journal uses article numbers instead of page numbers. See further details here.