Effect of Soluble Salt Loss via Spring Water on Irrigation-Induced Landslide Deformation
by
 ,
,
Zonglin Zhang
1,2 ,
,
Runqiang Zeng
1,2,*, 
Xingmin Meng
1,2,
Yi Zhang
1,2,
Shufen Zhao
1,2,
Jianhua Ma
2,3 and
Yunqi Yao
1,2 1
School of Earth Sciences, Lanzhou University, Lanzhou 730000, China
2
Technology & Innovation Centre for Environmental Geology and Geohazards Prevention, Lanzhou 730000, China
3
College of Earth Environmental Sciences, Lanzhou University, Lanzhou 730000, China
*
Author to whom correspondence should be addressed.
Water 2020, 12(10), 2889; https://doi.org/10.3390/w12102889
Submission received: 21 August 2020
/
Revised: 13 October 2020
/
Accepted: 14 October 2020
/
Published: 16 October 2020
(This article belongs to the Special Issue Water-Induced Landslides: Prediction and Control)
Abstract
:Landslide exposes the previously blocked groundwater discharge. High concentrations of soluble salt form salt sinters that can be observed near discharge passages. Based on existing laboratory investigation results of soil leaching and shearing reported in the literature, the effect of the soluble salt loss via spring water on irrigation-induced landslide deformation was studied under large-scale conditions. During our field investigation of landslides in the Heitai terrace of the Yellow River’s upper reaches in Gansu Province, China, 35 spring outlets were found, and the Heitai terrace was divided into five subareas, based on the difference in spring flow. Deformation data for the terrace were obtained by small baseline subset technology (SBAS-InSAR). These data were analyzed in combination with the amount of soluble salt loss, to explore the correlation between the deformation of the landslide and the soluble salt loss in the loess irrigation area. The results showed that the cumulative deformation and the loss of soluble salt were increasing continuously in the terrace. Although the increasing intensity of each subarea was different, the changing intensity of the two during the corresponding monitoring period was highly consistent. The statistical analysis revealed a strong positive correlation between the accumulated loss of soluble salt via spring water and the accumulated displacement of the terrace edge (p < 0.01). After the slope k between the two was tested by the Grubbs test and t-test, the k was no abnormality (α = 0.05) and difference (Sig > 0.05), further providing the basis for confirming the existence of this positive correlation. When the loss of soluble salt in rock and soil increased gradually, the accumulated deformation of the terrace edge also increased continuously. The findings of this study are of great significance for understanding the formation mechanism of landslides and the identifying landslide revival in irrigation areas of the Loess Plateau.
1. Introduction
The area covered by loess in China is approximately 631,000 km2, which accounts for 6.6% of the country’s total area [1]. Irrigation-induced landslides occur in loess areas, and the Heifangtai terrace in Yongjing County, northwest China, is typical irrigation-induced landslide area. The types of landslides include loess-bedrock planar slide, loess flow, loess flowslide, and loess slide [2]. Several scholars have reported that rising groundwater levels aggravate the saturated area of loess and that the matrix suction inside a slope decreases under saturated water conditions [3,4]. This causes the affected loess to soften and liquefy, thereby inducing a landslide’s deformation and instability [2,5,6,7,8,9,10,11]. This is one of the reasons for the alteration of the stability of a landslide on the edge of the corresponding terrace, which can transform from a stable state under natural conditions to an unstable state under irrigation conditions.
Many studies have used the characteristics of the loess microstructure to reveal the fundamental cause of the significant changes in the stability of loess landslides in loess irrigation areas. During its formation and evolution, loess consists of basic structural units (monomers and mineral aggregates), cement (e.g., easily soluble salts and carbonates) and pores. Loess is a type of cemented soil [12,13]; when the cement (especially non-stable aqueous aggregates) comes into contact with water, the cementation strength among the particles is weakened by chemical or physical changes [14,15]. This destroys the microstructure of the soil [16] and changes the structural strength of the soil, thus affecting slope stability [17,18]. According to the Coulomb–Mohr law, the shear strength of a soil is related to the cohesion (c’), the effective normal stress on the failure plane (σ’n), and the angle of shearing resistance (φ’). Xu et al. [19] also confirmed that the soluble salt concentration of loess varies between different ranges. The changing trend of the shear strength of a soil is determined by c’ or φ’, which are closely related to the loess microstructure [20,21]. Dijkstra et al. [22] found that the shear strength of loess decreased with soluble salt’s lixiviation. In a shear test of loess, it was found that the salt content and water content of the soil had a certain influence on its shear strength and other parameters [23,24,25,26]. The salt solution concentration in the pores has also been found to significantly improve soil’s shear strength [27,28]. In soluble salt leaching experiments, the residual shear strength and its related parameters were observed to decrease with an increase in the leaching times of loess [25,29,30].
In Northwest China’s loess deposit region, the underlying mudstone is often highly differentiated into wet and soft clay under the effect of weathering. The infiltration of groundwater or surface water can lead to physicochemical reactions of mudstone (e.g., dissolution and hydrolysis), which change its material composition and structure [31]. Previous studies have shown that the leaching of soluble salts or variations in the salt concentration of pores in clay and mudstone are reasons for the changes in the shear strength; hence, loess–bedrock (mudstone) landslides are prone to occur [29,31,32,33,34]. Further, a large number of salt sinters can be observed at the toe of loess landslides (e.g., Figure 1d).
The interferometric synthetic aperture radar (InSAR) technology extracts surface deformation data through the relationship between the radar wave phase difference and spatial distance in two SAR observations [35]. This technology is suitable for large-scale surface deformation monitoring and has the advantages of having high precision and all-time, all-weather usage [36]. Gabriel et al. [37] proposed the differential InSAR (DInSAR), which contributed greatly to the development of time series InSAR technologies such as the persistent scatter InSAR (PSInSAR) [38] and small baseline subsets (SBAS-InSAR) [39]. Time series InSAR technology can obtain more accurate surface deformation data; it has been widely used in landslide and ground instability monitoring, and it has achieved remarkable results [40,41,42,43]. In this study, the cumulative displacement data of the Heitai terrace was obtained by using SBAS-InSAR technology. There are two main reasons: On the one hand, SBAS-InSAR technology generates differential interferograms in spatial, temporal baselines and small Doppler center frequency difference data pairs, which solves the spatial incoherence problem caused by the long spatial baseline of conventional InSAR and increases the time sampling frequency. On the other hand, SBAS algorithm can identify the coherent point target by setting the temporal baseline and spatial baseline of generating interferograms, so as to reduce the orbit error and incoherence noise.
In summary, so far, too many scholars have analyzed the effect of soluble salt loss and pore water chemistry on shear strength and parameters of rock and soil based on results of indoor leaching test and shear test. To a certain extent, the reasons are expounded for the decrease of landslide stability in the irrigation area. However, there is no actual field evidence. Based on this reason, we have carried out statistical analysis on the soluble salt loss in rock and soil mass and its deformation at a large regional scale. This study has two purposes: (1) to explore the correlation between the loss of soluble salt via the Heitai Springs and the displacement of the terrace edge, and (2) to verify the results of rock and soil shear tests by considering the salt effects in the laboratory-based on this correlation and the investigation results of settlement deformation at the landslide site. The findings of this study will be of great significance for the understanding the forming mechanism of loess landslides and evaluating the stability mechanism in loess irrigation areas.
2. Materials and Methods
2.1. Study Area
The Heifangtai terrace is the fourth terrace of the Yellow River and is situated at the junction of the Yellow River (to the south) and Huangshui River (to the north), approximately 42 km to the west of Lanzhou City. The surface of the terrace is almost flat, but it is cut by many gullies, including the Yehu gully, Shancheng gully, and Moshi gully. Taking the Hulang gully (the first tributary of the Yellow River) as the boundary, the eastern area is the Heitai terrace, with an area of ~12.0 km2, and the western area is the Fantai terrace, with an area of ~1.7 km2. The area is located at an elevation of approximately 1730 m and is 130 m higher than the present riverbed of the Yellow River. The unique tectonic landform makes the Heifangtai terrace an island; there is almost no hydraulic connection with the outside world [44,45]. The climate is temperate and semi-arid, with an average annual temperature of 8.4 °C, average annual precipitation of 310 mm, and an evaporation capacity of approximately 1689 mm. Approximately 70–80% of the annual rainfall is concentrated during the period from July to September [46]. It is difficult to recharge groundwater effectively; therefore, the nature of Heifangtai is a dry platform. In the early 1960s, Heifangtai was confirmed as a settlement site, and irrigation became a necessary measure to ensure immigrants’ agricultural production. Since 1964, 22 irrigation projects have been built. The irrigated area is approximately 7.55 km2, which is 55.13% of the total area. The volume of annual irrigation increased to ~8.8 × 10⁵ m3 in the 1980s, from ~7.22 × 10⁵ m3 [7], and subsequently increased to approximately 6.0 × 10⁶ m3 in recent years. After over 40 years of flooding irrigation, the groundwater level rose by at least 20 m by the end of 2012 [47]. The groundwater level is currently rising at a rate of 0.18 m/year [48], and massive loess landslides have been induced around the Heifangtai terrace [11,49]. According to incomplete statistics, more than 140 loess landslides have occurred at the edge of the terrace, whereby 3–5 landslides currently happen each year.
The lithological profile of the Heifangtai terrace (from the bottom to the top) is mainly composed of four units. The basement is comprised of sand–mudstone off the Hekou Group (Lower Cretaceous). A clay layer (~4–17 m) is situated above a gravel layer (~2–5 m), which both formed during the Middle Pleistocene. The upper loess stratum (~25–50 m) is composed of Lishi loess and Malan loess of the Middle Pleistocene and Late Pleistocene, respectively [7]. We have also provided some basic physical properties of the loess and silty clay in the study area (Table 1).
The rising groundwater level has increased the number of discharge outlets of the platform margin spring. A field investigation of the Heitai terrace revealed a total of 35 spring discharge outlets, which are derived from loess pores, gravel layer pores, and bedrock fractures. Based on the fact that spring flow is closely related to the geographical location of the spring discharge outlet distribution, the study area was divided into five subareas (zones I–V; Figure 1).
2.2. Spring Water Sampling and Spring Flow Measurements
Based on the terrace edge field investigation, it was found that the drainage system around the terrace was composed of 35 descending springs. Because the spring water flows out from loess pore, sand–gravel interlayer, and bedrock fissure, the soluble salt content has differences in these three types of spring water. According to the actual terrain of the spring dew point distribution, 15 spring samples of three water types were collected at relatively flat positions of the channel in the five subareas at each period (Figure 1). The sampling tools include 500 mL pure water bottle, label paper, marker, and absorbent paper. Before sampling, the container was rinsed with spring water, at least 2 or 3 times. Two bottles were sampled for each spring water dew point; we wiped off the spring water on the bottle wall with absorbent paper, put a label paper on it, and sealed the containers after sampling.
The spring flow was determined, indirectly, by using Equation (1):
where V represents the flow velocity (m/s), B represents the channel width (cm), and h represents the water depth (cm).
Parameters B, h, and V were measured as follows. Firstly, the width and depth of the flat bottom of the spring channel were measured. Secondly, when the water surface was gentle, the water-surface velocity was measured 10 times, using a handheld surface velocimeter. Thirdly, considering that the water depth is of a centimeter-level, the average water-surface velocity was used to replace the water-flow velocity.
2.3. Chemical Component Analysis of Samples
The degree of mineralization is expressed by the total salt content of water and was calculated in this study by using the additive anion and cation method. The salt ions of the rock and soil on the Heitai terrace are mainly composed of NO3−, Cl−, SO 2−, HCO3−, NH4+, Ca2+, Mg2+, Na+, and K+. The lixiviation of rock and soil by infiltrating irrigation water is a soluble salt source to spring water. Therefore, the spring water samples contained the same ions as the rock and soil. Table 2 shows the methods used to determine the various ions in the spring water samples.
2.4. Analysis of the SBAS-InSAR Data
Forty-one Sentinel-1A images covering the Heitai terrace area (Table 3) were acquired for the period between 14 October 2014 and 7 May 2017, with a repeat period of 12 days and a ground resolution of 20 m. In the SARscape plug-in of ENVI software (L3Harris Geospatial, Broomfield, CO, USA), the processing steps were as follows: image clipping and co-registration, removal of the topography phase and flat-earth phase of the interferogram (Figure 2), orbit refinement and re-flattening, extraction of high coherence points, phase unwrapping, and error correction. A time series of the ground displacement data at a millimeter-scale for the Heitai terrace was obtained, and the spatiotemporal characteristics of the surface deformation in the five subareas were analyzed.
2.5. Statistical Analysis
The normal distribution was tested by Shapiro–Wilk (W test) and Quantile–Quantile (Q–Q) Plot test methods before the statistical analysis of the data. The bivariate correlation test method was used to judge the correlation between each group of variables, and the Pearson’ r correlation coefficient R was used to evaluate the degree of correlation between the two variables, where R2 represents the goodness of fit of the regression equation, and the significance level was set was α = 0.05. Grubbs test was used to judge the abnormal value, and t-test was used to test the difference of value.
3. Results
3.1. Variation Characteristics of the Soluble Salt Loss
There are two main sources of soluble salt to spring water in the study area. The first is the leaching of substances from rock and soil, which occurs due to the groundwater flow while irrigation water infiltrates. The second potential source is the salt contained within irrigation water itself. The laboratory test results of the chemical composition of the spring water samples showed that soluble salt was composed of easily soluble salt (mainly NaCl and KCl, followed by Na SO), medium soluble salt (mainly CaSO and MgSO), and insoluble salt (CaCO). The loss of easily soluble salt is the most serious and is followed by the medium soluble salt and then insoluble salt. The loss of soluble salt from soil changes the soil’s microstructure, which then changes the soil stability. By calculating a mass balance of the soluble salt from the study area, it is possible to determine the main source of salt discharge, which can then provide a basis to explore the terrace’s stability.
In recent years, due to the variation in planting patterns and plant varieties, the volume of annual irrigation water applied to Heitai terrace has ranged from ~590.91 × 10⁴ m3 to ~779.00 × 10⁴ m3 (the Heifangtai Water Management Office, Yongjing County, Linxia Hui Autonomous Prefecture, Gansu Province). The mineralization degree of irrigation water was calculated as 0.236 g/L, and the total amount of salt that was brought into the soil on Heitai terrace due to irrigation was estimated to be between ~0.139 × 10⁴ t to ~0.184 × 10⁴ t. The annual spring flow was estimated to range from ~91.46 × 10⁴ m3 to ~201.36 × 10⁴ m3. The mineralization degree of spring water was calculated to be 15–29 g/L, and the amount of salt discharged via the spring water was between ~1.372 × 10⁴ t to ~5.839 × 10⁴ t, which is ~7–42 times the amount of salt brought in. According to the mass balance results of the annual amount of soluble salt, it was concluded that the loss of soluble salt via spring water occurred mainly through the lixiviation of soluble salt in soil following the infiltration of irrigation water. An increase in the irrigation intensity and the accumulation of irrigation time on Heitai terrace means that the total amount of salt loss continually increases. In order to better understand the spatial and temporal distributions of soluble salt loss on Heitai terrace, the spring flow and mineralization degree in zones I, II, III, IV, and V were measured in the field and in the laboratory, respectively, from September 2016 to April 2017. The results are shown in Table 4 and Table 5.
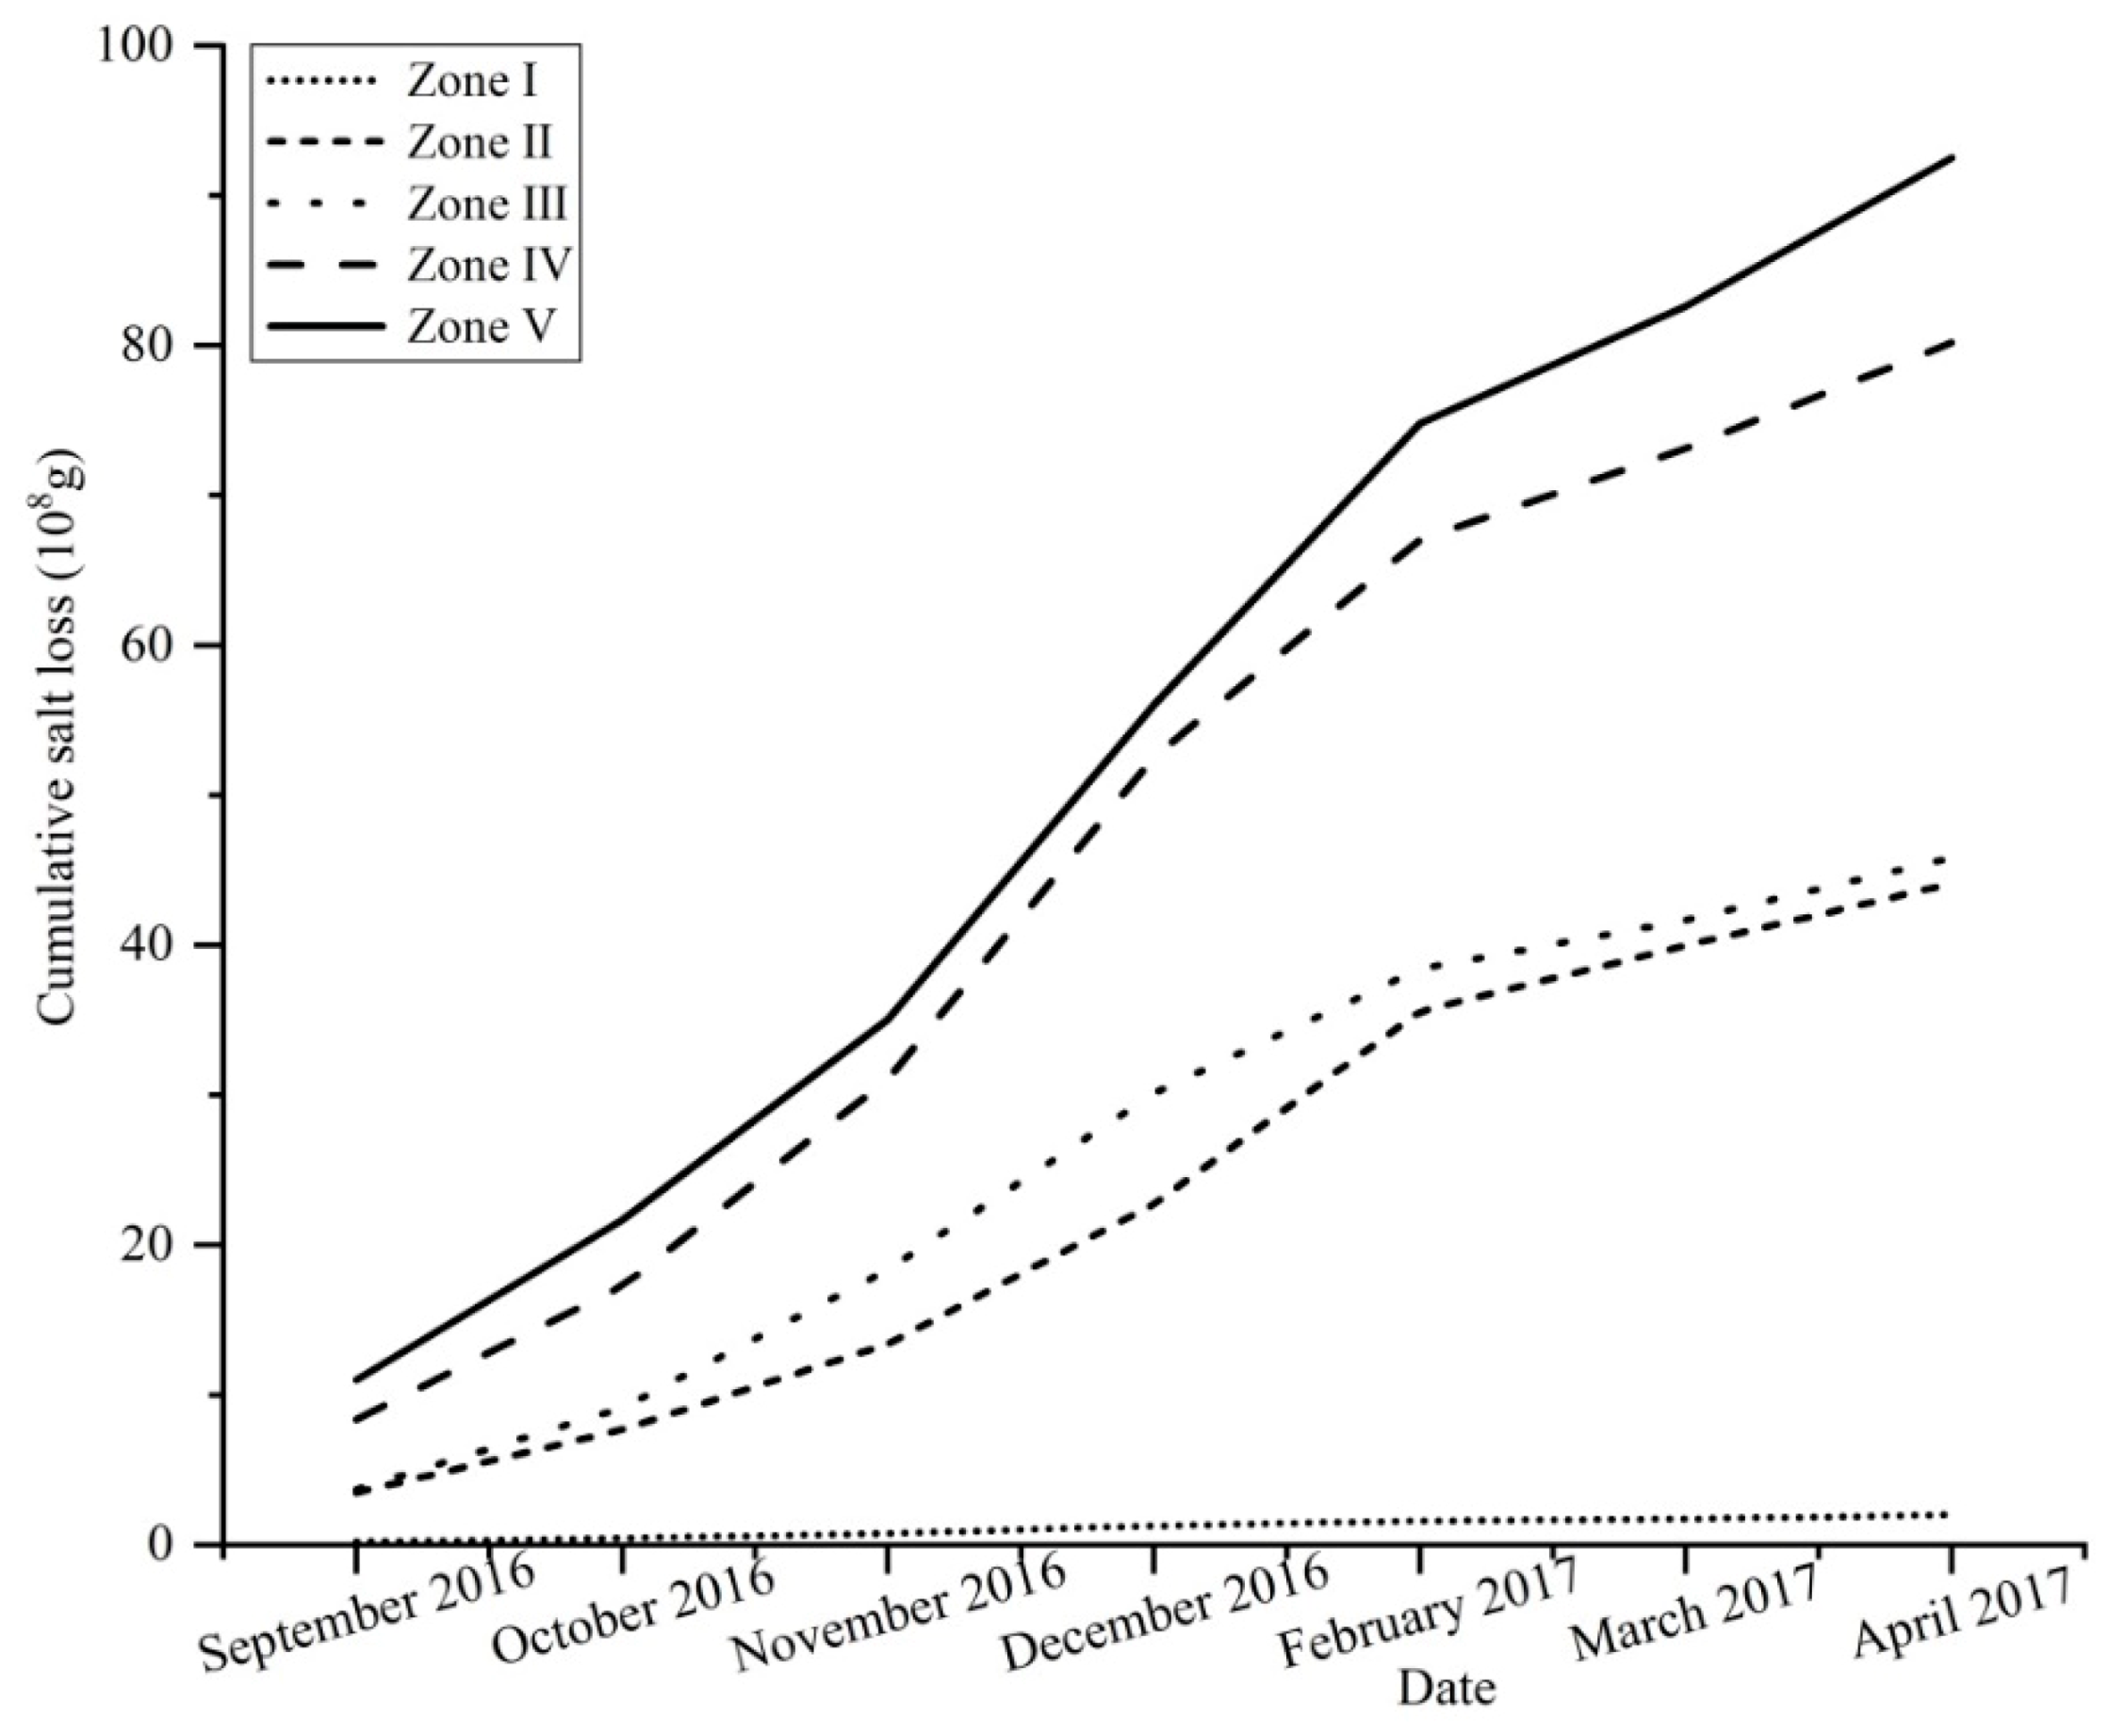
Figure 3 shows the differences in the soluble salt loss of each subarea. Although the cumulative loss increased gradually over time for all subareas, there was a clear difference in the variation of the accumulation loss of soluble salt in each subarea. The greatest variation occurred in zones V and IV, followed by zones III and II. During the monitoring period, the cumulative loss of soluble salt in zone I was relatively low and only about 1/23 of that of zones II and III, and 1/45 that of zones IV and V. We also find the loss of soluble salt increased significantly in February 2017; this is because the temperature of Heitai is lower in December, January, and early February, while its thawing period in the middle of February. Therefore, the dew point of frozen spring water melts in the process of temperature rising, and a large amount of water is discharged, leading to the increase of soluble salt loss. We can also know that this phenomenon takes place less on sunny slopes.
3.2. Variation Characteristics of the Cumulative Displacement
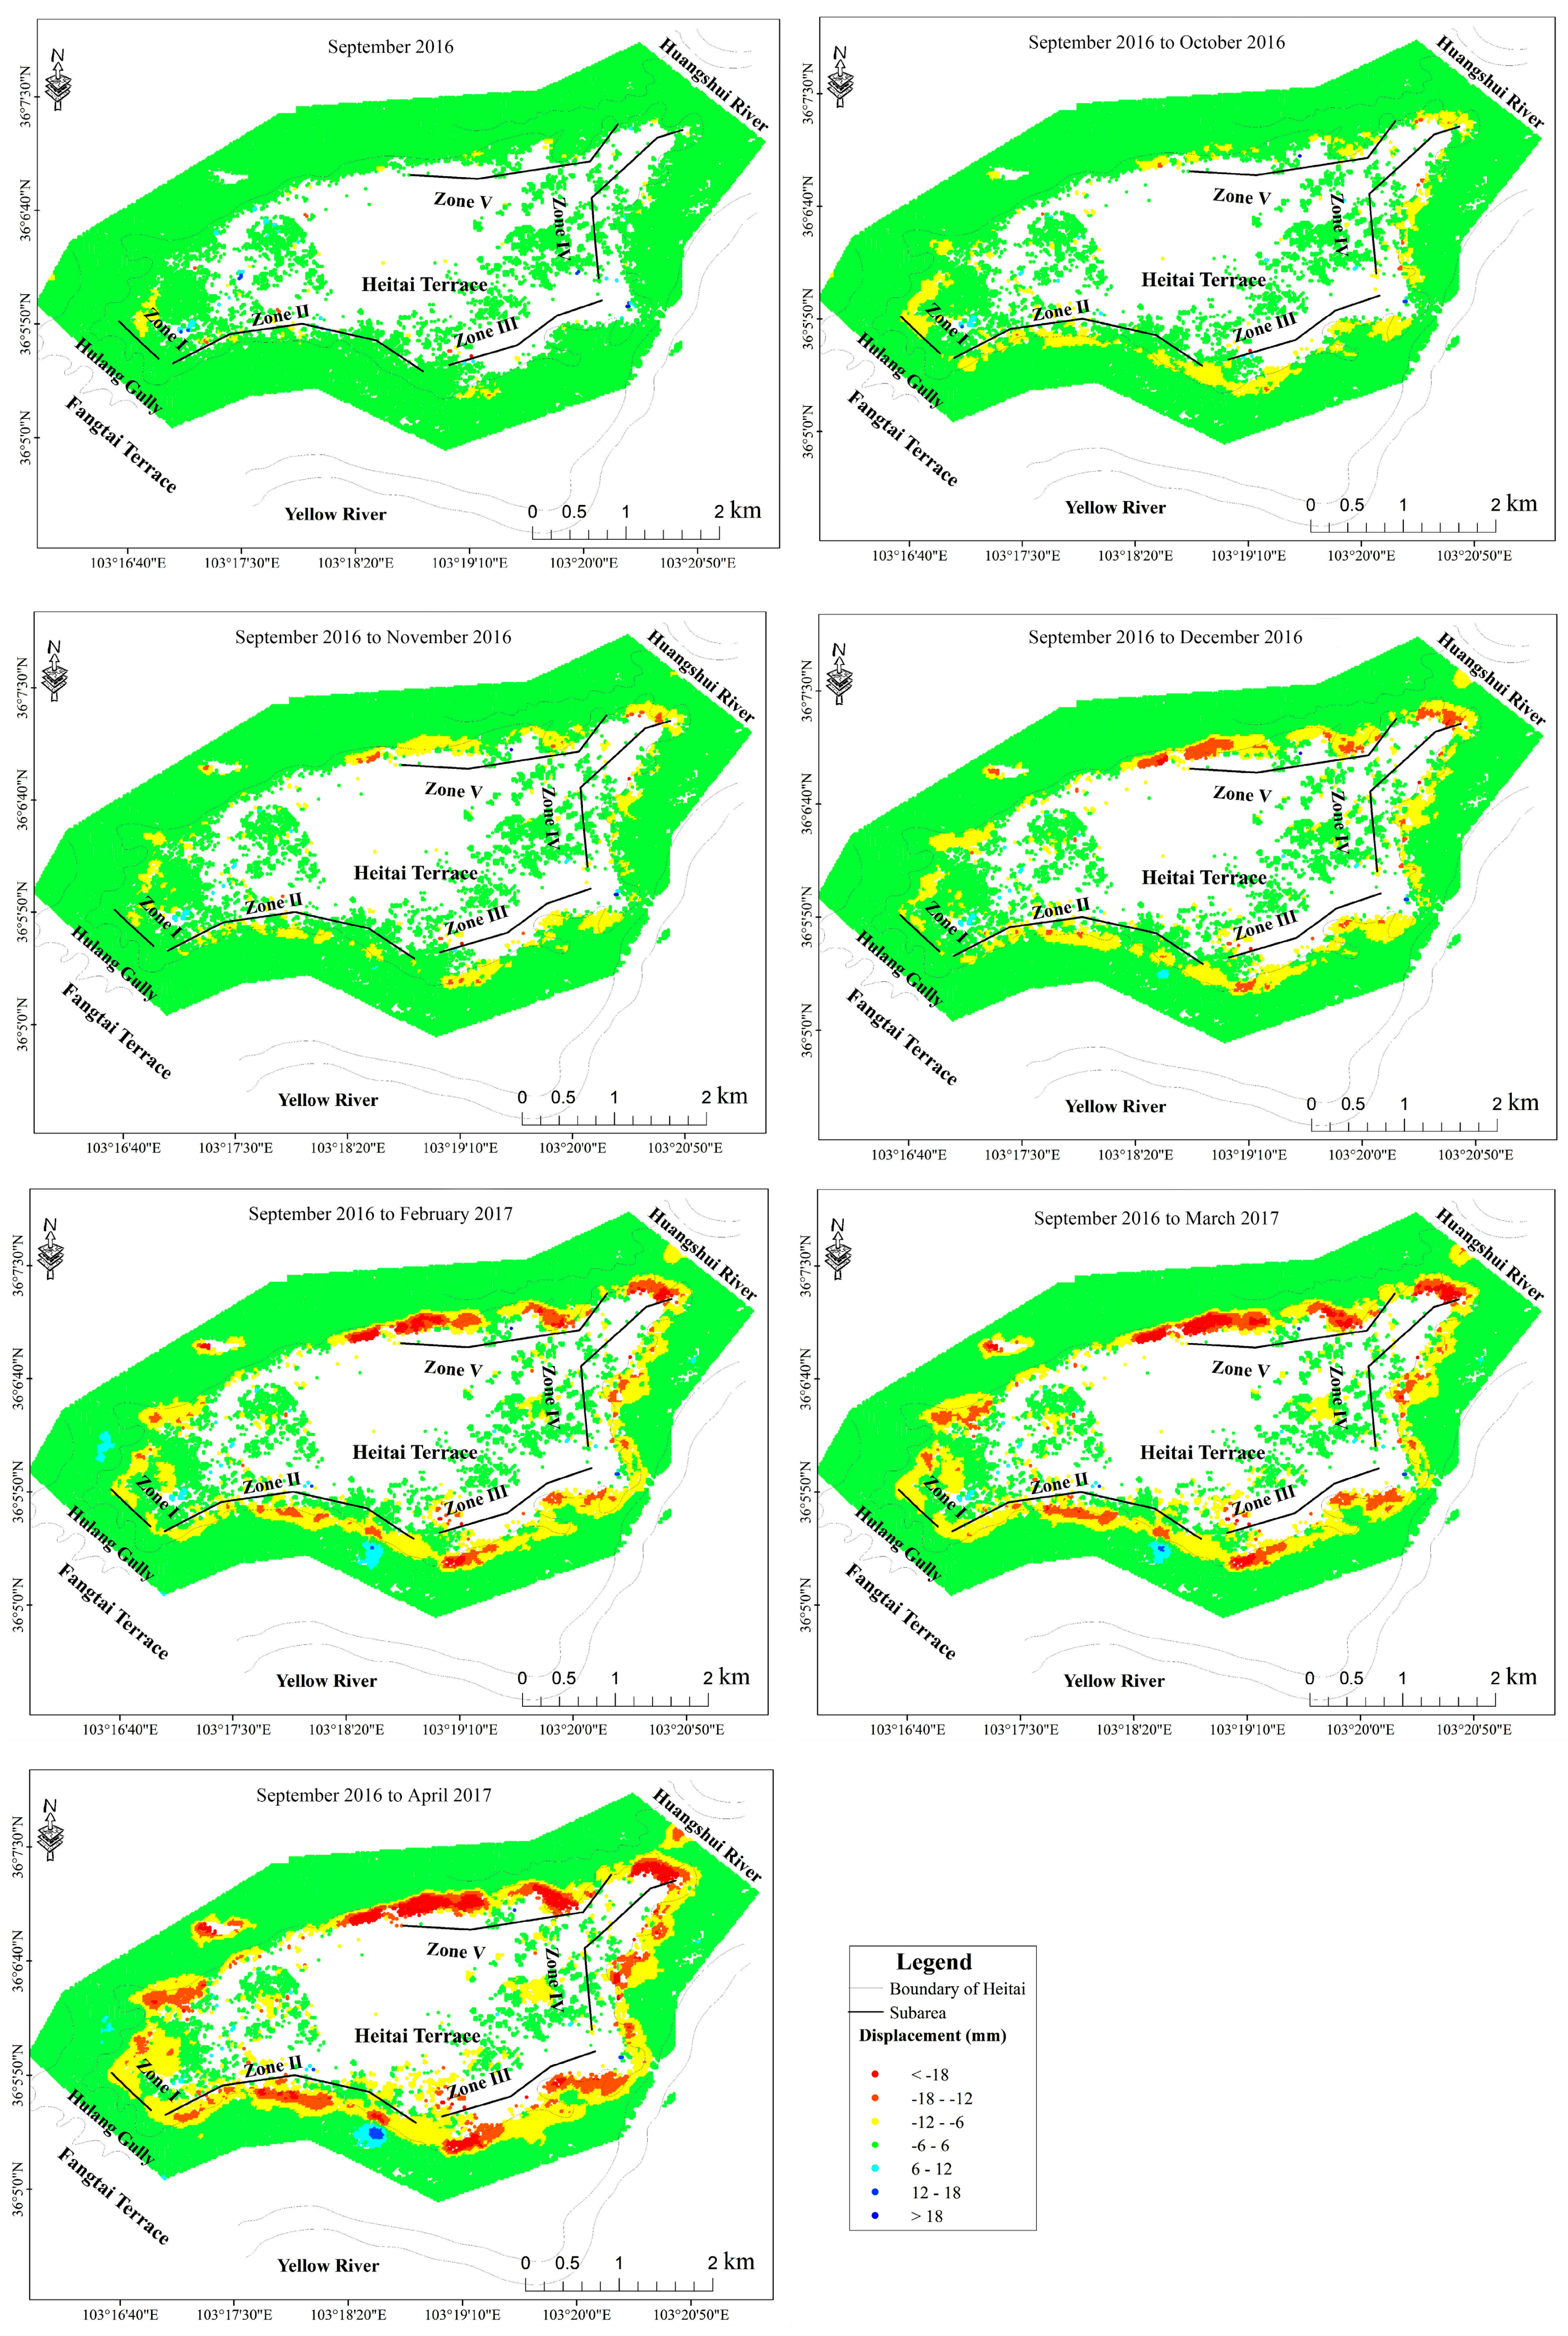
Figure 4 presents the displacement of Heitai terrace along the radar line-of-sight (LOS), which was obtained by using SBAS technology, from September 2016 to April 2017. According to the standard deviation of the total study area’s coherent points, we are setting the relative stability threshold of displacement range—6 to 6 mm. A negative value indicates that the deformation moves away from the sensor along the LOS direction, and a positive value indicates that the deformation moves along the LOS direction toward the sensor. It can be seen that the accumulated displacement change of the terrace was mainly concentrated between 6 and 6 mm, but the displacement exhibited obvious spatiotemporal distribution characteristics at the terrace edge. With increasing time, the accumulated displacement of zones II, III, IV, and V gradually increased to within 18 mm, and the local cumulative displacement was >18 mm, which indicates intensive deformation characteristics. The cumulative displacement of zone I was within 12 mm during the monitoring period and exhibited no obvious change.
3.3. Correlation Analysis of the Cumulative Salt Loss and Cumulative Displacement
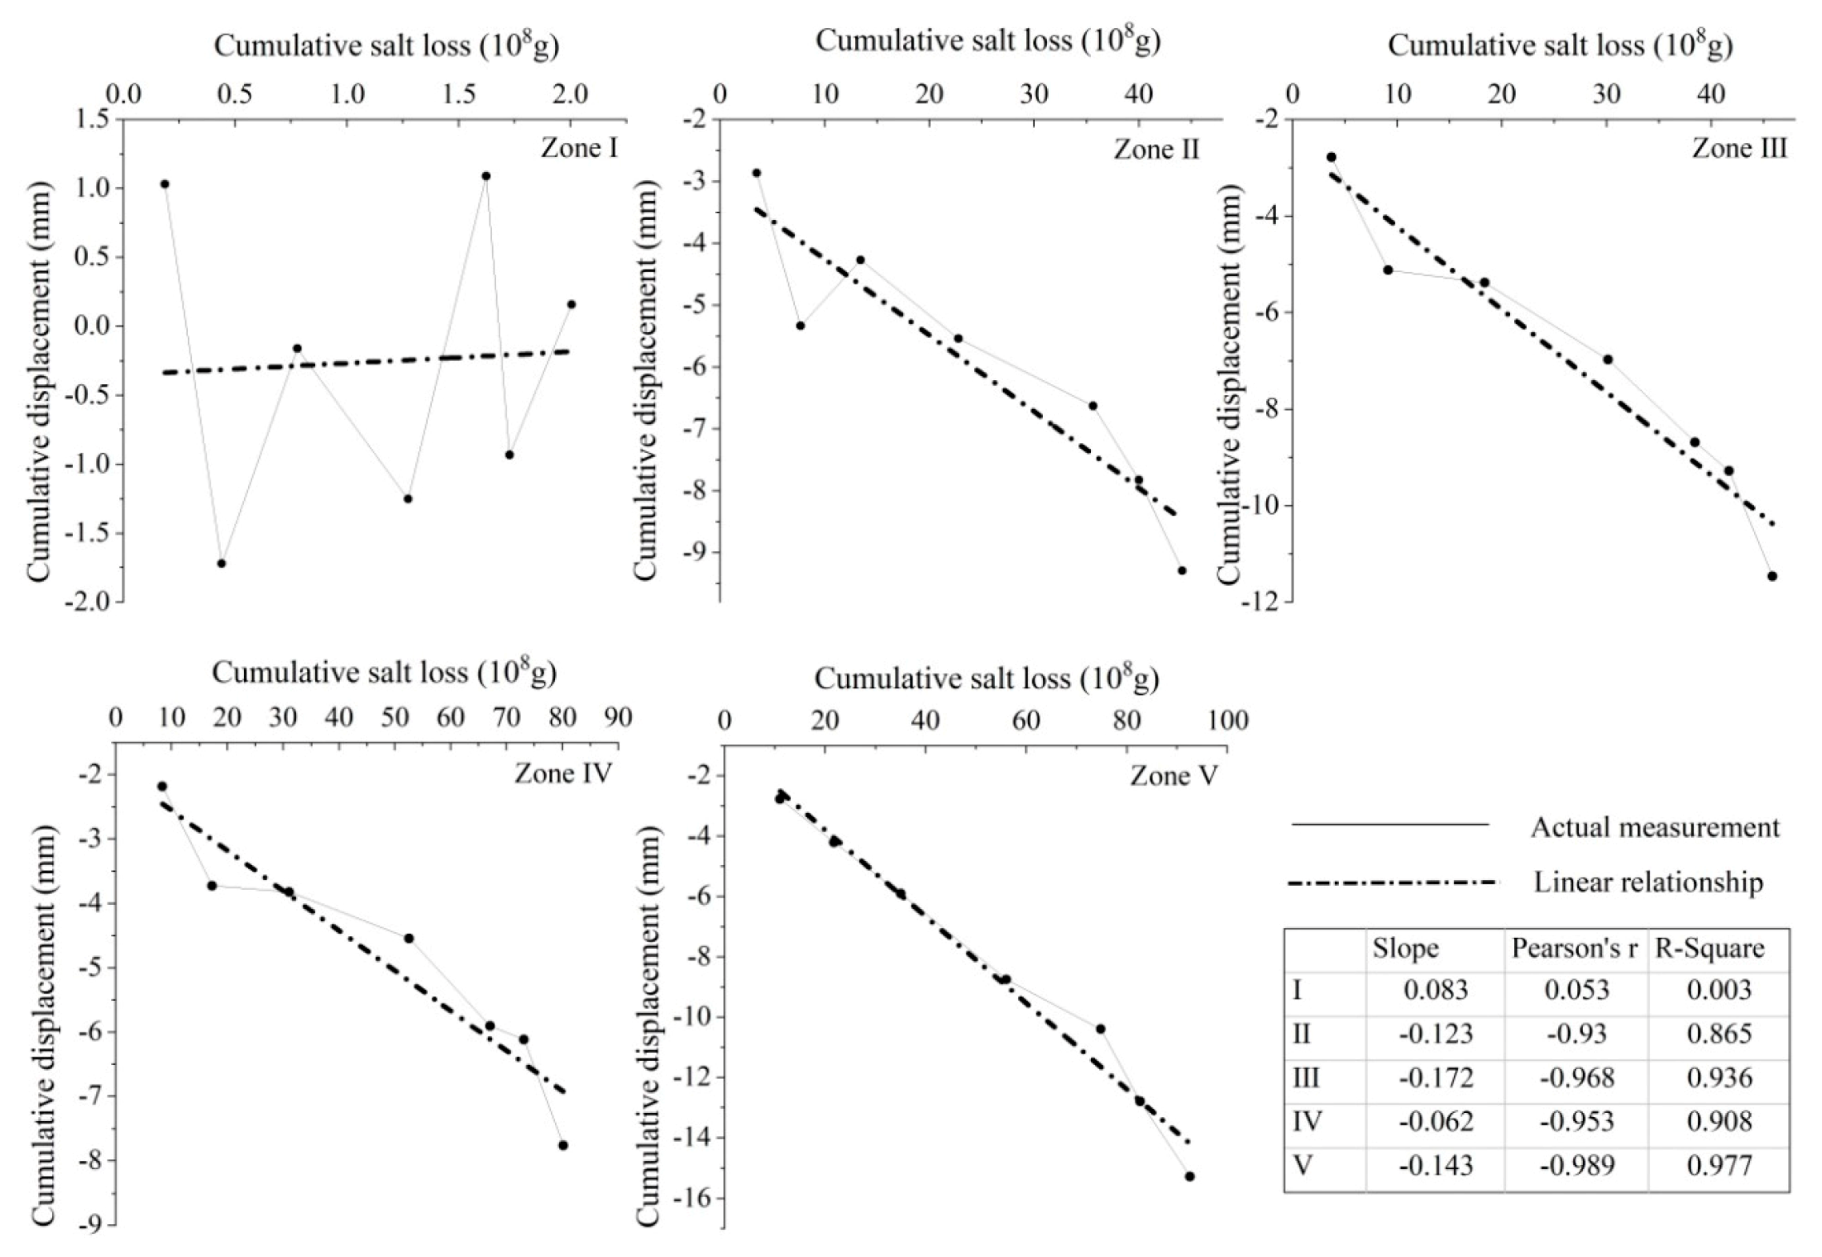
The cumulative loss of soluble salt via spring water presented the same spatial and temporal distribution characteristics as the accumulated displacement of the terrace edge. The SPSS software was used to verify the normal distribution hypothesis of the experimental data. The results of the Q–Q Plot test basically showed a straight line, and W test results were sig >0.05. Therefore, we consider that the data meet the normal distribution. We attempted to use the bivariate correlation method to explore the correlation between the two. The relationship between the cumulative loss of soluble salt via the spring water was positively correlated with the accumulated displacement of the terrace in zones II, III, IV, and V. The two variables exhibited a good linear relationship in zones II, III, IV, and V (R2 = 0.865, R2 = 0.936, R2 = 0.908, and R2 = 0.973 (p < 0.01)) (Figure 5). Although we do zoning research based on the difference of spring flow in different geographical locations. We had to admit that, at the boundaries of each subarea, the spring water might come from the groundwater in two adjacent areas. This led to the “false” of soluble salt loss in this area.
However, there was no linear relationship in zone Ⅰ, but there were positive cumulative displacements. The positive cumulative displacement that appears in the Zone I caused by the orbital SAR image that does not express the deformation on the downslope of the region well. The positive cumulative displacement in a certain period of time also indicates that there is a slight change in the slope itself during the imaging period. For the total study area, the displacement change in a certain period of time cannot affect the evolution trend of the entire time series, which is in the acceptable range. The accumulated displacements of the other four areas are larger than the set stability threshold. Combined with field verification, it is believed that the terrace in these subareas has obvious signs of deformation.
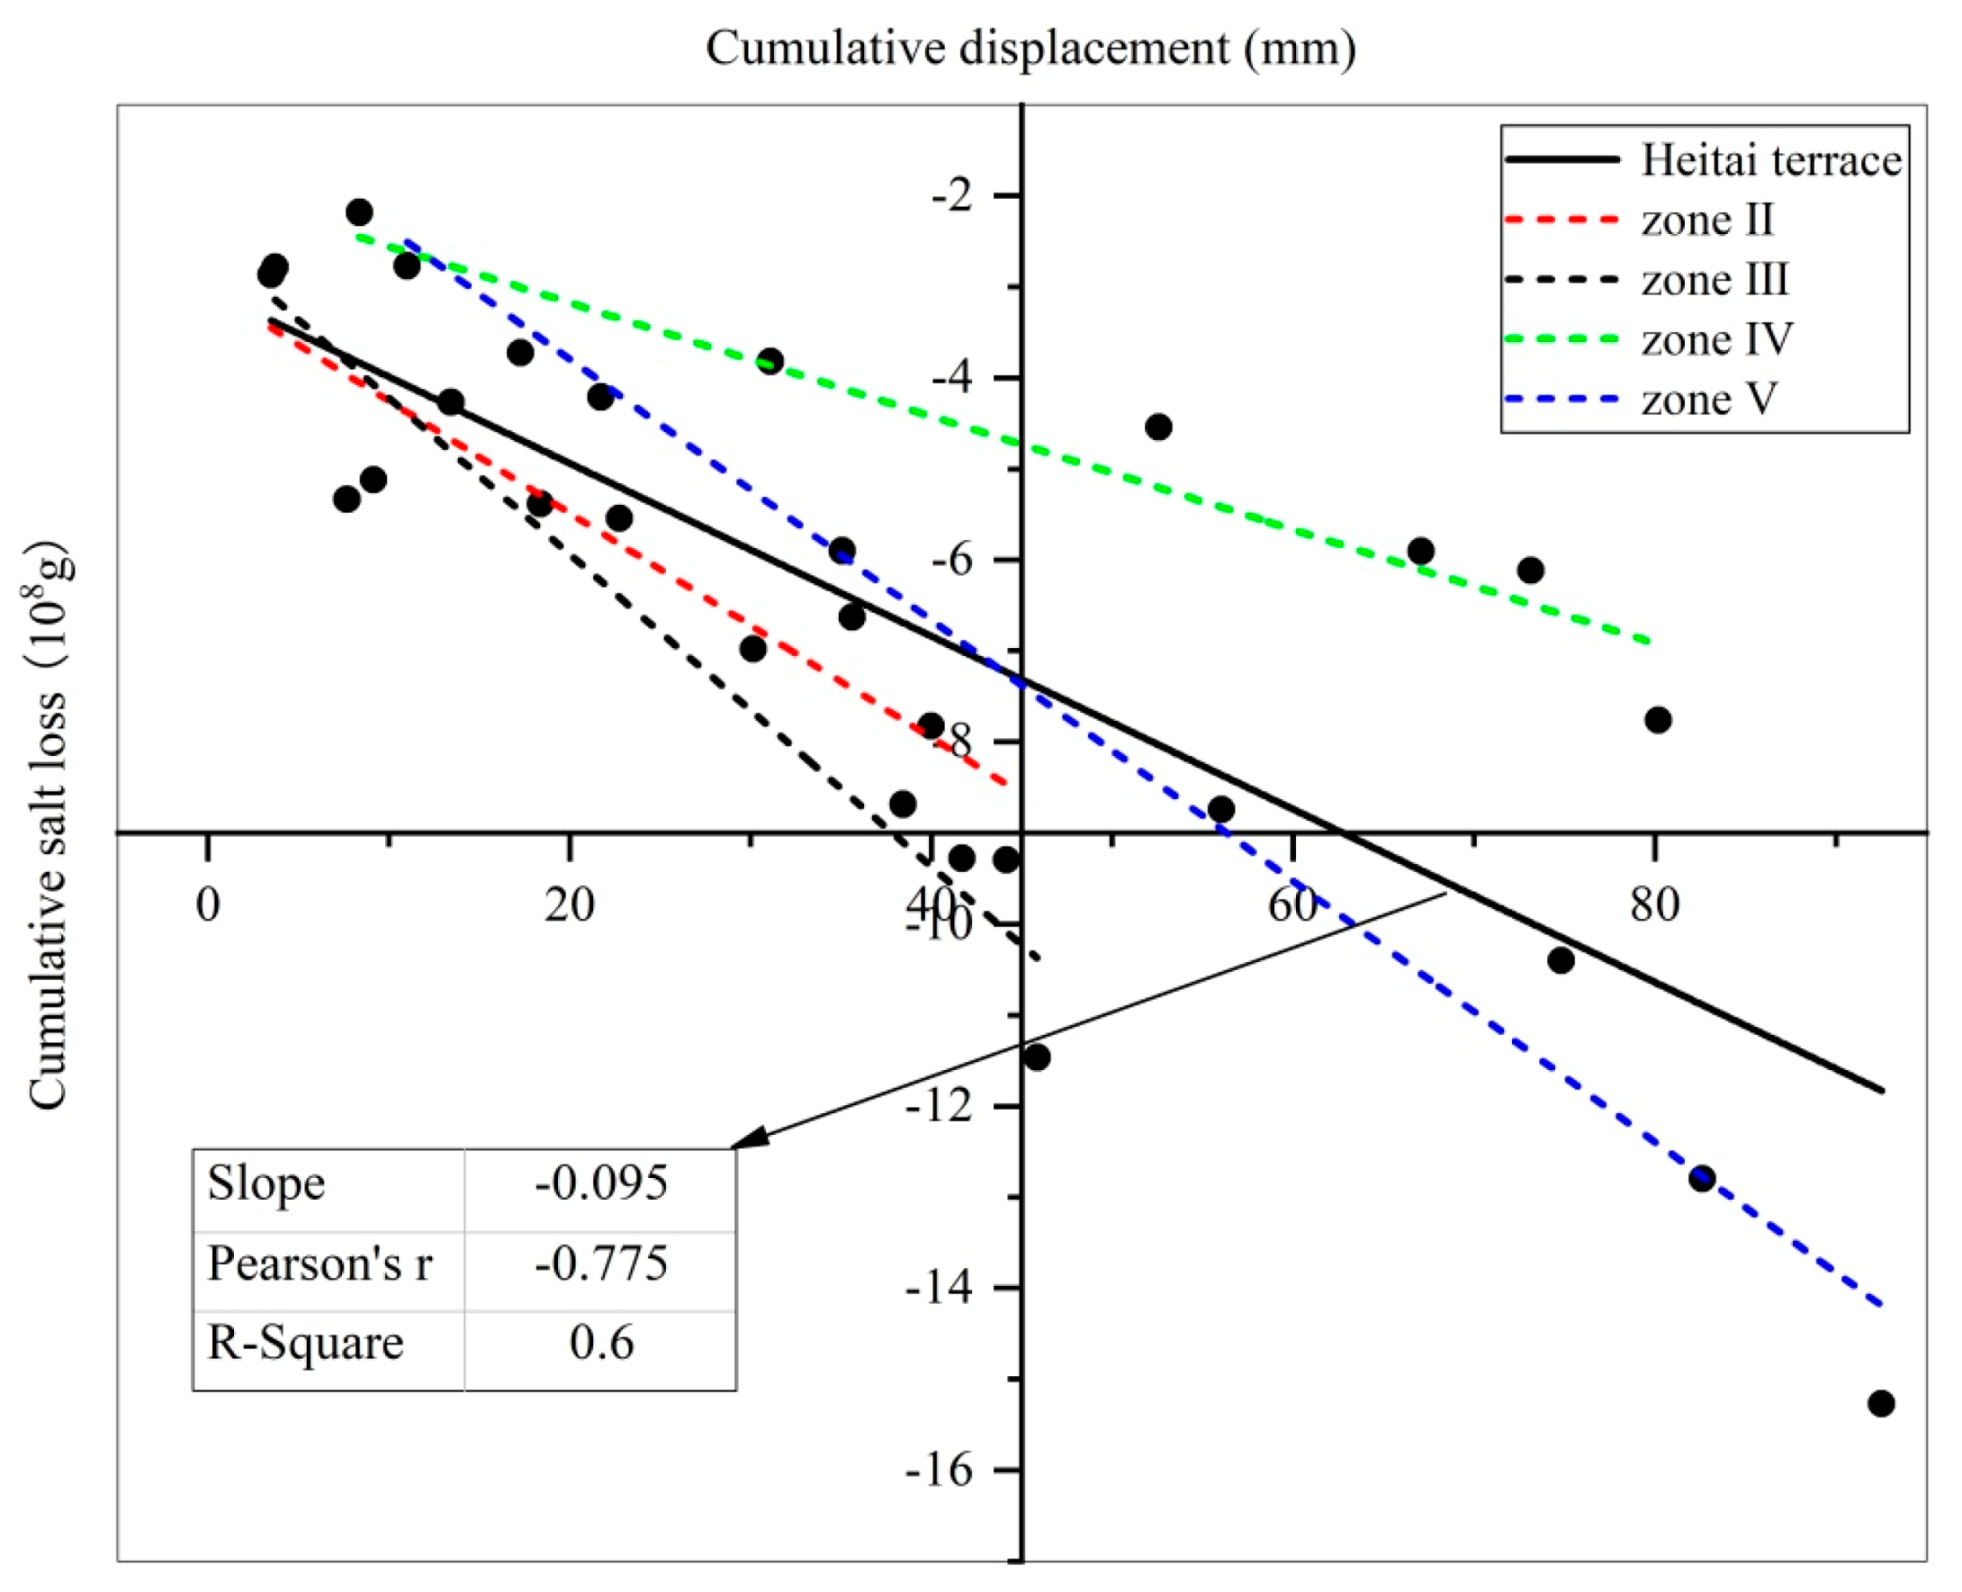
Using the Grubbs test method, the outlier of slope k between the accumulated loss of soluble salt and the cumulative displacement in zones II, III, IV, and V was tested. At a detection level of α = 0.05, the calculated G < G (4) showed that there was no abnormality for slope k in the study subareas. According to the accumulated loss of soluble salt and displacement of zones II, III, IV, and V in the monitoring period, the central scatter diagram (Figure 6) was obtained. In Figure 6, there were obvious differences in the distribution characteristics of data points in each subarea. However, a large number of data points were of a banded distribution, and there was a positive linear correlation between them (R2 = 0.600, p < 0.01). Taking the slope value as the detection value and expressing it as k, a t-test was used to distinguish the difference between k and k. First, the results showed that the concomitant probability of the t-test was 0.288, and the upper and lower limits of the 0.95 confidence level were −0.104 and 0.044. Second, the concomitant probability of the t-test was greater than the significance level of 0.05. The results indicate that there was no significant difference between slope k and k in each study subarea, further confirming the strong positive correlation between the cumulative loss of soluble salt and displacement.
4. Discussion
Subsidence and deformation were very common in the Loess irrigation area. As mentioned, it was confirmed that the soluble salt loss in rock and soil can affect the shear strength of its, resulting in subsidence and deformation of soil [51,52]. In this study, SBAS-InSAR technology was used to monitor the long-term ground deformation in the Loess irrigation area, i.e., Heifangtai, and the soluble salt content lost in the soil was obtained in the corresponding period. Through statistical analysis, it was found that there was a strong positive correlation between the two, proving that the change of soluble salt content of loess had an effect on its shear strength to a certain extent. However, the statistical analysis results also show that no positive correlation was found between the two variables in zone I. We offer two possible explanations for this observation. On the one hand, it can be seen from the elevation distribution of groundwater on Heitai terrace (Figure 7) that the groundwater level was relatively high in the western and southwestern areas. Although groundwater domes were observed in the western area of the terrace, there was minimal groundwater flow into zone I, which is similar to the findings of Peng et al. [49]. On the other hand, there was a serious drying-up of springs in zone I during the monitoring period. According to Table 4, the minimum and maximum spring flows of the other zones were approximately 15.7 and 91 times that of zone I (average of 34 times), and the loss of soluble salt in zones I, II, III, IV, and V was 2.01 × 10⁸ g, 44.13 × 10⁸ g, 45.84 × 10⁸ g, 80.18 × 10⁸ g, and 92.53 × 10⁸ g, respectively (Figure 3). Based on these two aspects, we believe that the total amount of soluble salt brought out by spring water was very small in zone I; hence, more salt was retained in the zone’s pore solution.
The irrigation frequency and volume of the terrace also increased due to the reform of the planting patterns and plant varieties; however, the salt supplied by irrigation water to the Heitai terrace is still weak. On the contrary, the infiltration of irrigation water has a serious effect on the dissolution and lixiviation of soluble salt in rock and soil. This changes the shear strength and other parameters of loess, which then affect the stability of the landslide mass [18,53,54]. In addition, these changes may cause the formation of collapsible pits and cracks, which can become dominant channels for the rapid infiltration of water. This accelerates the rising groundwater level and leads to the reactivation of landslide mass and the regression damage of terrace edges [6,11,55,56].
Moreover, we found differences in the mineralization degree of spring water in each study area that also fluctuated during the monitoring period (Table 4, Figure 8). Li et al. [28] analyzed the mechanism of loess’s strength weakening under groundwater leaching, by means of ring shear, ion chromatograph, and zeta potentiometer. With the increased of the soil immersion time, the soluble salt in soil was dissolved continuously, leading to the destruction of soil structure, and ion concentration in the soil pore water increases. The soil shear strength and shear strength indexes, φ’, appeared as “spoon-shape” changes in this process. Wen and He [29] reported that the physicochemical interaction between water and salt was the dissolution and leaching of soluble salt, which greatly affected the c’ or φ’ of red mudstone. After the soluble salt in the red mudstone was leached many times, the downward trend of the residual shear strength became very weak. Zhang et al. [27] had studied the influence of the pore water chemistry on soil shear behavior in Heitai, including the soil shear behavior with NaCl concentration in pore water and the shear behavior of soil by desalination effect of soil. The results showed that the shear strength increased with increasing NaCl concentration, and then decreased with further increase of NaCl concentration; the long-term irrigation can decrease the NaCl concentration and then can lower the soil shear strength in Heitai terrace. Other scholars had also confirmed that the weakening of the shear characteristics of soil is mainly caused by the change of the parameter c’ or φ’ caused by the dissolution loss of soluble salt through laboratory experiments, and they believe that this weakening tends to zero with the increase of leaching times [25,30]. Therefore, the changing trend of the soluble salt content of spring water was analyzed. The fluctuation in the mineralization degree is related to the degree of leaching. A landslide mass begins to deform slowly due to the weakening of the soil shear strength until the settlement deformation changes the seepage path; hence, a soil that has experienced little dissolution again suffers from the main leaching of groundwater. The soluble salt is brought out from the terrace, which again increases the mineralization degree. This continuous cycle eventually leads to the landslide deformation instability or resurrection, which has been extensively verified at the landslide site (Figure 9). There are also relevant reports that the continuous loss of salt ions caused by long-term seepage leaching further aggravates soil structure degradation and strength. This eventually leads to the large deformation of the loess surface, which may cause slope instability [18,29,57,58]. The results of the present study, as well as the laboratory test results of other investigations, demonstrate that the mechanical behavior of rock and soil is affected by the chemical composition of the pore fluid to a certain extent. However, it is necessary to make a more quantitative assessment of these behaviors, to gain a deeper understanding of the potential processes, in order to evaluate their role in the occurrence and movement of loess landslides. At the same time, the water content of the soil will inevitably change during the leaching process of soluble salt in the Loess irrigation area, but this is only limited to the shallow unsaturated area of loess. Although the water content of rock and soil can also affect its shear behavior [6,24,25], we did not quantify the impact of water-content change on the deformation of shallow loess, and this is a deficiency of this work.
5. Conclusions
As mentioned, the shear strength can be used as an important evaluation index of landslide stability, which is closely related to factors, such as the soluble salt content or pore salt solution concentration in rock and soil. The study aimed to explore a new method to quantify the relationship between the loss of soluble salt from rock and soil and its deformation behavior. This was investigated via a field investigation of the spring flow on Heitai terrace, laboratory determination of spring water’s mineralization degree, and analysis of surface deformation data obtained by using SBAS technology. Data analysis and interpretation led to the following conclusions.
The main source of salt in the groundwater of the Heitai terrace is the leaching of soluble salts from rock and soil by irrigation water. The loss of soluble salt is concentrated in the northern, northeastern, eastern, southeastern, and southern areas of the terrace. This is consistent with the spatial distribution of intense deformation in the Heitai terrace area, and there is a positive correlation between them.
According to the salt ion concentration change in spring water, the loss of soluble salt via spring water was estimated. Along with the results of a large number of landslide field investigations, our findings suggest that the landslide mass began to deform slowly due to the weakening of the soil shear strength. We infer that, until the settlement deformation changes the seepage path, the soil with a low degree of lixiviation again suffers from groundwater’s main leaching. Hence, the concentration of pore salt ions decreases in soil, and soluble salt is brought out from the terrace. This continuous cycle eventually leads to landslide deformation instability or resurrection.
Based on the positive correlation between the two, the relative deformation of slope can be recognized by detecting the loss of soluble salt in water during the period. This will provide a new idea for the early identification of landslides in the future.
Author Contributions
Conceptualization, R.Z.; methodology, R.Z. and Z.Z.; software, Z.Z., Y.Z. and S.Z.; validation, R.Z., Z.Z. and X.M.; formal analysis, R.Z., Z.Z. and X.M.; investigation, R.Z., Z.Z., Y.Z., S.Z., J.M. and Y.Y.; resources, R.Z. and X.M.; data curation, Z.Z.; writing of the original draft, Z.Z.; review and editing, R.Z., Z.Z., X.M., Y.Z., S.Z., J.M. and Y.Y.; supervision, R.Z.; project administration, R.Z. and X.M.; funding acquisition, R.Z. and X.M. All authors have read and agreed to the published version of the manuscript.
Funding
This research was supported by the National Key R & D Program of China (grant No. 2018YFC1504704), the Youth Program of Science and Technology Foundation of Gansu Province (grant No. 18JR3RA298), the Fundamental Research Funds for the Central Universities (grant Nos. lzujbky—2018–46 and lzujbky—2020—sp03), and the Program for International S & T Cooperation Projects of Gansu Province (grant No. 2018–0204—GJC—0043).
Acknowledgments
The authors would like to thank H.L. Yin, Y.X. Li, and S.Q. Bian for their advice and support during the field operations.
Conflicts of Interest
The authors declare no conflict of interest.
References
- Liu, D.S. Loess and Environment; Science Press: Beijing, China, 1985; pp. 1–481. (In Chinese) [Google Scholar]
- Peng, D.; Xu, Q.; Liu, F.-Z.; He, Y.; Zhang, S.; Qi, X.; Zhao, K.; Zhang, X. Distribution and failure modes of the landslides in Heitai terrace, China. Eng. Geol. 2018, 236, 97–110. [Google Scholar] [CrossRef]
- Conte, E.; Troncone, A. A method for the analysis of soil slips triggered by rainfall. Géotechnique 2012, 62, 187–192. [Google Scholar] [CrossRef]
- Conte, E.; Troncone, A. Simplified Approach for the Analysis of Rainfall-Induced Shallow Landslides. J. Geotech. Geoenviron. Eng. 2012, 138, 398–406. [Google Scholar] [CrossRef]
- Yan, R.; Peng, J.; Huang, Q.-B.; Chen, L.-J.; Kang, C.-Y.; Shen, Y.-J. Triggering Influence of Seasonal Agricultural Irrigation on Shallow Loess Landslides on the South Jingyang Plateau, China. Water 2019, 11, 1474. [Google Scholar] [CrossRef] [Green Version]
- Zhang, D.; Wang, G.; Luo, C.; Chen, J.; Zhou, Y. A rapid loess flowslide triggered by irrigation in China. Landslides 2008, 6, 55–60. [Google Scholar] [CrossRef]
- Xu, L.; Dai, F.; Tham, L.; Tu, X.; Min, H.; Zhou, Y.; Wu, C.; Xu, K. Field testing of irrigation effects on the stability of a cliff edge in loess, North-west China. Eng. Geol. 2011, 120, 10–17. [Google Scholar] [CrossRef]
- Xu, L.; Dai, F.C.; Gong, Q.M.; Tham, L.G.; Min, H. Irrigation-induced loess flow failure in Heifangtai Platform, North-West China. Environ. Earth Sci. 2011, 66, 1707–1713. [Google Scholar] [CrossRef]
- Yan, R.-X.; Peng, J.; Zhang, J.-Y.; Wang, S.-K. Static Liquefaction Capacity of Saturated Undisturbed Loess in South Jingyang Platform. Water 2020, 12, 2298. [Google Scholar] [CrossRef]
- Leng, Y.; Peng, J.; Wang, Q.; Meng, Z.; Huang, W. A fluidized landslide occurred in the Loess Plateau: A study on loess landslide in South Jingyang tableland. Eng. Geol. 2018, 236, 129–136. [Google Scholar] [CrossRef]
- Xu, Q.; Qi, X.; Xiu, D.H.; Zhao, K.Y. Critical water level of abrupt loess landslides: A case study in Heifangtai, Gansu Province. J. Hydraul. Eng. 2019, 50, 315–322. (In Chinese) [Google Scholar]
- Zhang, Z.H. Study on Microstructure of loessial soil in China. Acta Geol. Sinica. 1964, 3, 357–369, 375. (In Chinese) [Google Scholar]
- Li, P.; Vanapalli, S.; Li, T. Review of collapse triggering mechanism of collapsible soils due to wetting. J. Rock Mech. Geotech. Eng. 2016, 8, 256–274. [Google Scholar] [CrossRef]
- Gao, G.R. Classification of microstructure of loess in China and their collapsibility. Sci. Sin. 1981, 24, 962–974. [Google Scholar]
- Zhang, B.P.; Wang, L.; Yuan, H.Z. The quantitative analysis effects of soil moisture upon the loess structure strength. J. Northwest A F Univ. Nat. Sci. Ed. 1994, 1, 54–60. (In Chinese) [Google Scholar]
- Liu, Z.; Liu, F.; Ma, F.; Wang, M.; Bai, X.; Zheng, Y.; Yin, H.; Zhang, G. Collapsibility, composition, and microstructure of loess in China. Can. Geotech. J. 2016, 53, 673–686. [Google Scholar] [CrossRef] [Green Version]
- Dijkstra, T. Geotechnical thresholds in the Lanzhou loess of China. Quat. Int. 2001, 76, 21–28. [Google Scholar] [CrossRef]
- Toulegilan, M.M.; Chenari, R.J.; Neshaei, M.A.L.; Forghani, A. Changes in stability conditions of clay slopes due to leaching: A case study. Sn Appl. Sci. 2020, 2, 1–10. [Google Scholar] [CrossRef]
- Xu, H.L.; Gao, M.X.; Li, X.F.; Wang, Z.Y.; Liu, W.J.; Lu, Y. Research on influence of soluble salt concentration on shear strength index. J. Inn. Mong. Agric. Univ. Nat. Sci. Ed. 2012, 33, 159–161. (In Chinese) [Google Scholar]
- Wang, N.Q.; Luo, D.H.; Yao, Y.; Chen, X.X.; Yang, J.G. Dynamic strength and microstructure change of malan loess under triaxal cyclic loading. J. Eng. Geol. 2011, 19, 467–471. (In Chinese) [Google Scholar]
- Wen, B.-P.; Yan, Y.-J. Influence of structure on shear characteristics of the unsaturated loess in Lanzhou, China. Eng. Geol. 2014, 168, 46–58. [Google Scholar] [CrossRef]
- Dijkstra, T.; Rogers, C.; Smalley, I.; Derbyshire, E.; Li, Y.J.; Meng, X.M. The loess of north-central China: Geotechnical properties and their relation to slope stability. Eng. Geol. 1994, 36, 153–171. [Google Scholar] [CrossRef]
- Lei, H.Y.; Zhang, W.S.; Zhang, X.F.; Wang, B. Study on engineering property indexes of ultracholrine saline soil. J. Changchun Univ. Sci. Technol. 2001, 31, 70–73. (In Chinese) [Google Scholar]
- Liu, X.J.; Chen, X.J.; Fen, M.; Gong, X.L. Study of influence of soluble salts on original loess strength. J. Eng. Geol. 2018, 26, 652–656. (In Chinese) [Google Scholar]
- Fu, J.-T.; Hu, X.-S.; Li, X.-L.; Yu, D.-M.; Liu, Y.-B.; Yang, Y.-Q.; Qi, Z.-X.; Li, S.-X. Influences of soil moisture and salt content on loess shear strength in the Xining Basin, northeastern Qinghai-Tibet Plateau. J. MT SCI-ENG 2019, 16, 1184–1197. [Google Scholar] [CrossRef]
- Xu, J.; Li, Y.; Wang, S.; Wang, Q.; Ding, J. Shear strength and mesoscopic character of undisturbed loess with sodium sulfate after dry-wet cycling. Bull. Int. Assoc. Eng. Geol. 2019, 79, 1523–1541. [Google Scholar] [CrossRef]
- Zhang, F.; Wang, G.; Kamai, T.; Chen, W.; Zhang, D.; Yang, J. Undrained shear behavior of loess saturated with different concentrations of sodium chloride solution. Eng. Geol. 2013, 155, 69–79. [Google Scholar] [CrossRef] [Green Version]
- Li, S.; Xu, Q.; Zhang, L.Z.; Peng, D.L.; LÜ, H.B.; Song, S.J. Time effect and mechanism of strength weakening of loess soaked in water in Heifangtai area. Rock Soil Mech. 2017, 38, 2043–2048. (In Chinese) [Google Scholar]
- Wen, B.-P.; He, L. Influence of lixiviation by irrigation water on residual shear strength of weathered red mudstone in Northwest China: Implication for its role in landslides’ reactivation. Eng. Geol. 2012, 151, 56–63. [Google Scholar] [CrossRef]
- Yan, Y.J.; Wen, B.P.; Huang, Z.Q. Effect of soluble salts on shear strength of unsaturated remoulded loess in Lanzhou city. Rock Soil Mech. 2017, 38, 2881–2887. (In Chinese) [Google Scholar]
- Chen, W.W.; Lin, G.C.; Liu, W.; Wu, W.J.; Fu, X.L.; Peng, H.Z.; Zhao, P. Physical and mechanical properties of weathered green and red mudston.es. Chin. J. Rock Mech. Eng. 2016, 35, 2572–2582. (In Chinese) [Google Scholar]
- Bjerrum, L. Geotechnical Properties of Norwegian Marine Clays. Géotechnique 1954, 4, 49–69. [Google Scholar] [CrossRef]
- Bjerrum, L.; Rosenqvist, I.T. Some Experiments with Artificially Sedimented Clays. Géotechnique 1956, 6, 124–136. [Google Scholar] [CrossRef]
- He, L.; Wen, B.P. Effect of lixiviation by irrigation water on undrained shear strength of weathered red mudstone in Northwest China. Hydrogeol. Eng. Geol. 2014, 41, 47–52. (In Chinese) [Google Scholar]
- Hoffmann, J.; Galloway, D.L.; Zebker, H.A. Calibrating a Regional Ground–Water Flow and Subsidence Model in Antelope Valley, California, Using in SAR–Derived Subsidence Maps. AGUFM 2001, H41E-0320. [Google Scholar]
- Rosen, P.A.; Hensley, S.; Joughin, I.R.; Li, F.K.; Madsen, S.N.; Rodriguez, E.; Goldstein, R.M. Synthetic aperture radar interferometry. Proc. IEEE 2000, 88, 333–380. [Google Scholar] [CrossRef]
- Gabriel, A.K.; Goldstein, R.M.; Zebker, H.A. Mapping small elevation changes over large areas: Differential radar interferometry. J. Geophys. Res. Space Phys. 1989, 94, 9183–9191. [Google Scholar] [CrossRef]
- Ferretti, A.; Prati, C.; Rocca, F. Analysis of Permanent Scatterers in SAR interferometry. In Proceedings of the IGARSS 2000, IEEE 2000 International Geoscience and Remote Sensing Symposium, Taking the Pulse of the Planet: The Role of Remote Sensing in Managing the Environment, Proceedings (Cat. No.00CH37120), Honolulu, HI, USA, 24–28 July 2000; Volume 2, pp. 761–763. [Google Scholar]
- Berardino, P.; Fornaro, G.; Lanari, R.; Sansosti, E. A new algorithm for surface deformation monitoring based on small baseline differential SAR interferograms. IEEE Trans. Geosci. Remote Sens. 2002, 40, 2375–2383. [Google Scholar] [CrossRef] [Green Version]
- Zeng, R.Q.; Meng, X.M.; Wasowski, J.; Dijkstra, T.; Bovenga, F.; Xue, Y.T.; Wang, S.Y. Ground instability detection using PS-InSAR in Lanzhou, China. Q. J. Eng. Geol. Hydrogeol. 2014, 47, 307–321. [Google Scholar] [CrossRef]
- Kang, Y.; Zhao, C.; Zhang, Q.; Lu, Z.; Li, B. Application of InSAR Techniques to an Analysis of the Guanling Landslide. Remote Sens. 2017, 9, 1046. [Google Scholar] [CrossRef] [Green Version]
- Zhang, Y.; Meng, X.; Jordan, C.; Novellino, A.; Dijkstra, T.; Chen, G. Investigating slow-moving landslides in the Zhouqu region of China using InSAR time series. Landslides 2018, 15, 1299–1315. [Google Scholar] [CrossRef]
- Zhang, Y.; Meng, X.; Dijkstra, T.; Jordan, C.; Chen, G.; Zeng, R.; Novellino, A. Forecasting the magnitude of potential landslides based on InSAR techniques. Remote. Sens. Environ. 2020, 241, 111738. [Google Scholar] [CrossRef]
- Yu, Z.S. Analysis on landslide disaster cause of at the Yellow River Three Gorges area in large—Scale mass. Ground Water 2010, 32, 149–151. (In Chinese) [Google Scholar]
- Peng, D.; Xu, Q.; Qi, X.; Fan, X.; Dong, X.; Li, S.; Ju, Y. Study on Early Recognition of Loess Landslides Based on Field Investigation. Int. J. Geohazards Environ. 2016, 2, 35–52. [Google Scholar] [CrossRef]
- Guo, P.; Meng, X.; Li, Y.; Chen, G.; Zeng, R.; Qiao, L. Effect of large dams and irrigation in the upper reaches of the Yellow River of China, and the geohazards burden. Proc. Geol. Assoc. 2015, 126, 367–376. [Google Scholar] [CrossRef]
- Dong, Y.; Sun, P.P.; Zhang, M.S.; Chen, X.J.; Bi, J.B. The response of regional groundwater system to irrigation at Heifangtai terrace, Gansu Province. Geol. Bull. China 2013, 32, 868–874. (In Chinese) [Google Scholar]
- Xu, L.; Dai, F.; Tu, X.; Tham, L.G.; Zhou, Y.; Iqbal, J. Landslides in a loess platform, North-West China. Landslides 2013, 11, 993–1005. [Google Scholar] [CrossRef]
- Peng, D.; Xu, Q.; Zhang, X.; Xing, H.; Zhang, S.; Kang, K.; Qi, X.; Ju, Y.; Zhao, K. Hydrological response of loess slopes with reference to widespread landslide events in the Heifangtai terrace, NW China. J. Asian Earth Sci. 2019, 171, 259–276. [Google Scholar] [CrossRef]
- Gu, T.-F.; Zhang, M.-S.; Wang, J.-D.; Wang, C.-X.; Xu, Y.-J.; Wang, X. The effect of irrigation on slope stability in the Heifangtai Platform, Gansu Province, China. Eng. Geol. 2019, 248, 346–356. [Google Scholar] [CrossRef]
- Xie, W.L.; Wang, Y.S.; Ma, Z.H.; Ge, R.H.; Wang, J.D. Research Status and Prospect of Loess Collapsibility Mechanism. Geoscience 2015, 29, 397–407. (In Chinese) [Google Scholar]
- Xin, R.X. Experimental Study on Influence of Soluble Salt Content on Collapsibility of Heifangtai Loess. Master’s Thesis, North China University of Water Resources and Electric Power, Zhengzhou, China, 2017. (In Chinese). [Google Scholar]
- Dawson, E.M.; Roth, W.H.; Drescher, A. Slope stability analysis by strength reduction. Géotechnique 1999, 49, 835–840. [Google Scholar] [CrossRef]
- Zhang, K.; Cao, P.; Bao, R. Rigorous back analysis of shear strength parameters of landslide slip. Trans. Nonferr. Met. Soc. China 2013, 23, 1459–1464. [Google Scholar] [CrossRef]
- Zeng, R.; Meng, X.; Zhang, F.; Wang, S.; Cui, Z.; Zhang, M.; Zhang, Y.; Chen, G. Characterizing hydrological processes on loess slopes using electrical resistivity tomography—A case study of the Heifangtai Terrace, Northwest China. J. Hydrol. 2016, 541, 742–753. [Google Scholar] [CrossRef]
- Qi, X.; Xu, Q.; Peng, D.L.; Dong, X.J.; Tao, Y.Q. Mechanism of gradual retreat loess landslide caused by groundwater: A case study of the irrigation loess landslide in Heifangtai, Gansu province. J. Eng. Geol. 2017, 25, 147–153. (In Chinese) [Google Scholar]
- Fan, X.; Xu, Q.; Scaringi, G.; Li, S.; Peng, D. A chemo-mechanical insight into the failure mechanism of frequently occurred landslides in the Loess Plateau, Gansu Province, China. Eng. Geol. 2017, 228, 337–345. [Google Scholar] [CrossRef]
- Xu, L.; Xu, L.; Baudet, B.A.; Gao, C.; Huang, C. The structure degradation of a silty loess induced by long-term water seepage. Eng. Geol. 2020, 272, 105634. [Google Scholar] [CrossRef]
Figure 1.
(a) Location of Heifangtai terrace in China, (b) spatial distribution of landslides and Springs on Heitai terrace, and (c) lithology profile of Heifangtai (d) salt sinters at the toe of a landslide, where sampling and spring flow measurements were performed.
Figure 1.
(a) Location of Heifangtai terrace in China, (b) spatial distribution of landslides and Springs on Heitai terrace, and (c) lithology profile of Heifangtai (d) salt sinters at the toe of a landslide, where sampling and spring flow measurements were performed.

Figure 2.
(a) Time baseline of image pair and (b) space baseline of image pair.

Figure 3.
The cumulative loss of soluble salt in each study subarea, from September 2016 to April 2017.
Figure 3.
The cumulative loss of soluble salt in each study subarea, from September 2016 to April 2017.

Figure 4.
Variation of the cumulative displacement of Heitai terrace. Strong deformation of the terrace edge occurred during the monitoring period.
Figure 4.
Variation of the cumulative displacement of Heitai terrace. Strong deformation of the terrace edge occurred during the monitoring period.

Figure 5.
Relationship between cumulative displacement and soluble salt loss. The solid line represents the actual data, and the dotted line represents the linear fit.
Figure 5.
Relationship between cumulative displacement and soluble salt loss. The solid line represents the actual data, and the dotted line represents the linear fit.

Figure 6.
Slope value between cumulative displacement and soluble salts loss. The slope value of the solid line represents the k, whereas the dotted line represents the k.
Figure 6.
Slope value between cumulative displacement and soluble salts loss. The slope value of the solid line represents the k, whereas the dotted line represents the k.

Figure 7.
Groundwater elevation distribution of Heitai terrace. A groundwater dome can be seen in the western area of the terrace.
Figure 7.
Groundwater elevation distribution of Heitai terrace. A groundwater dome can be seen in the western area of the terrace.

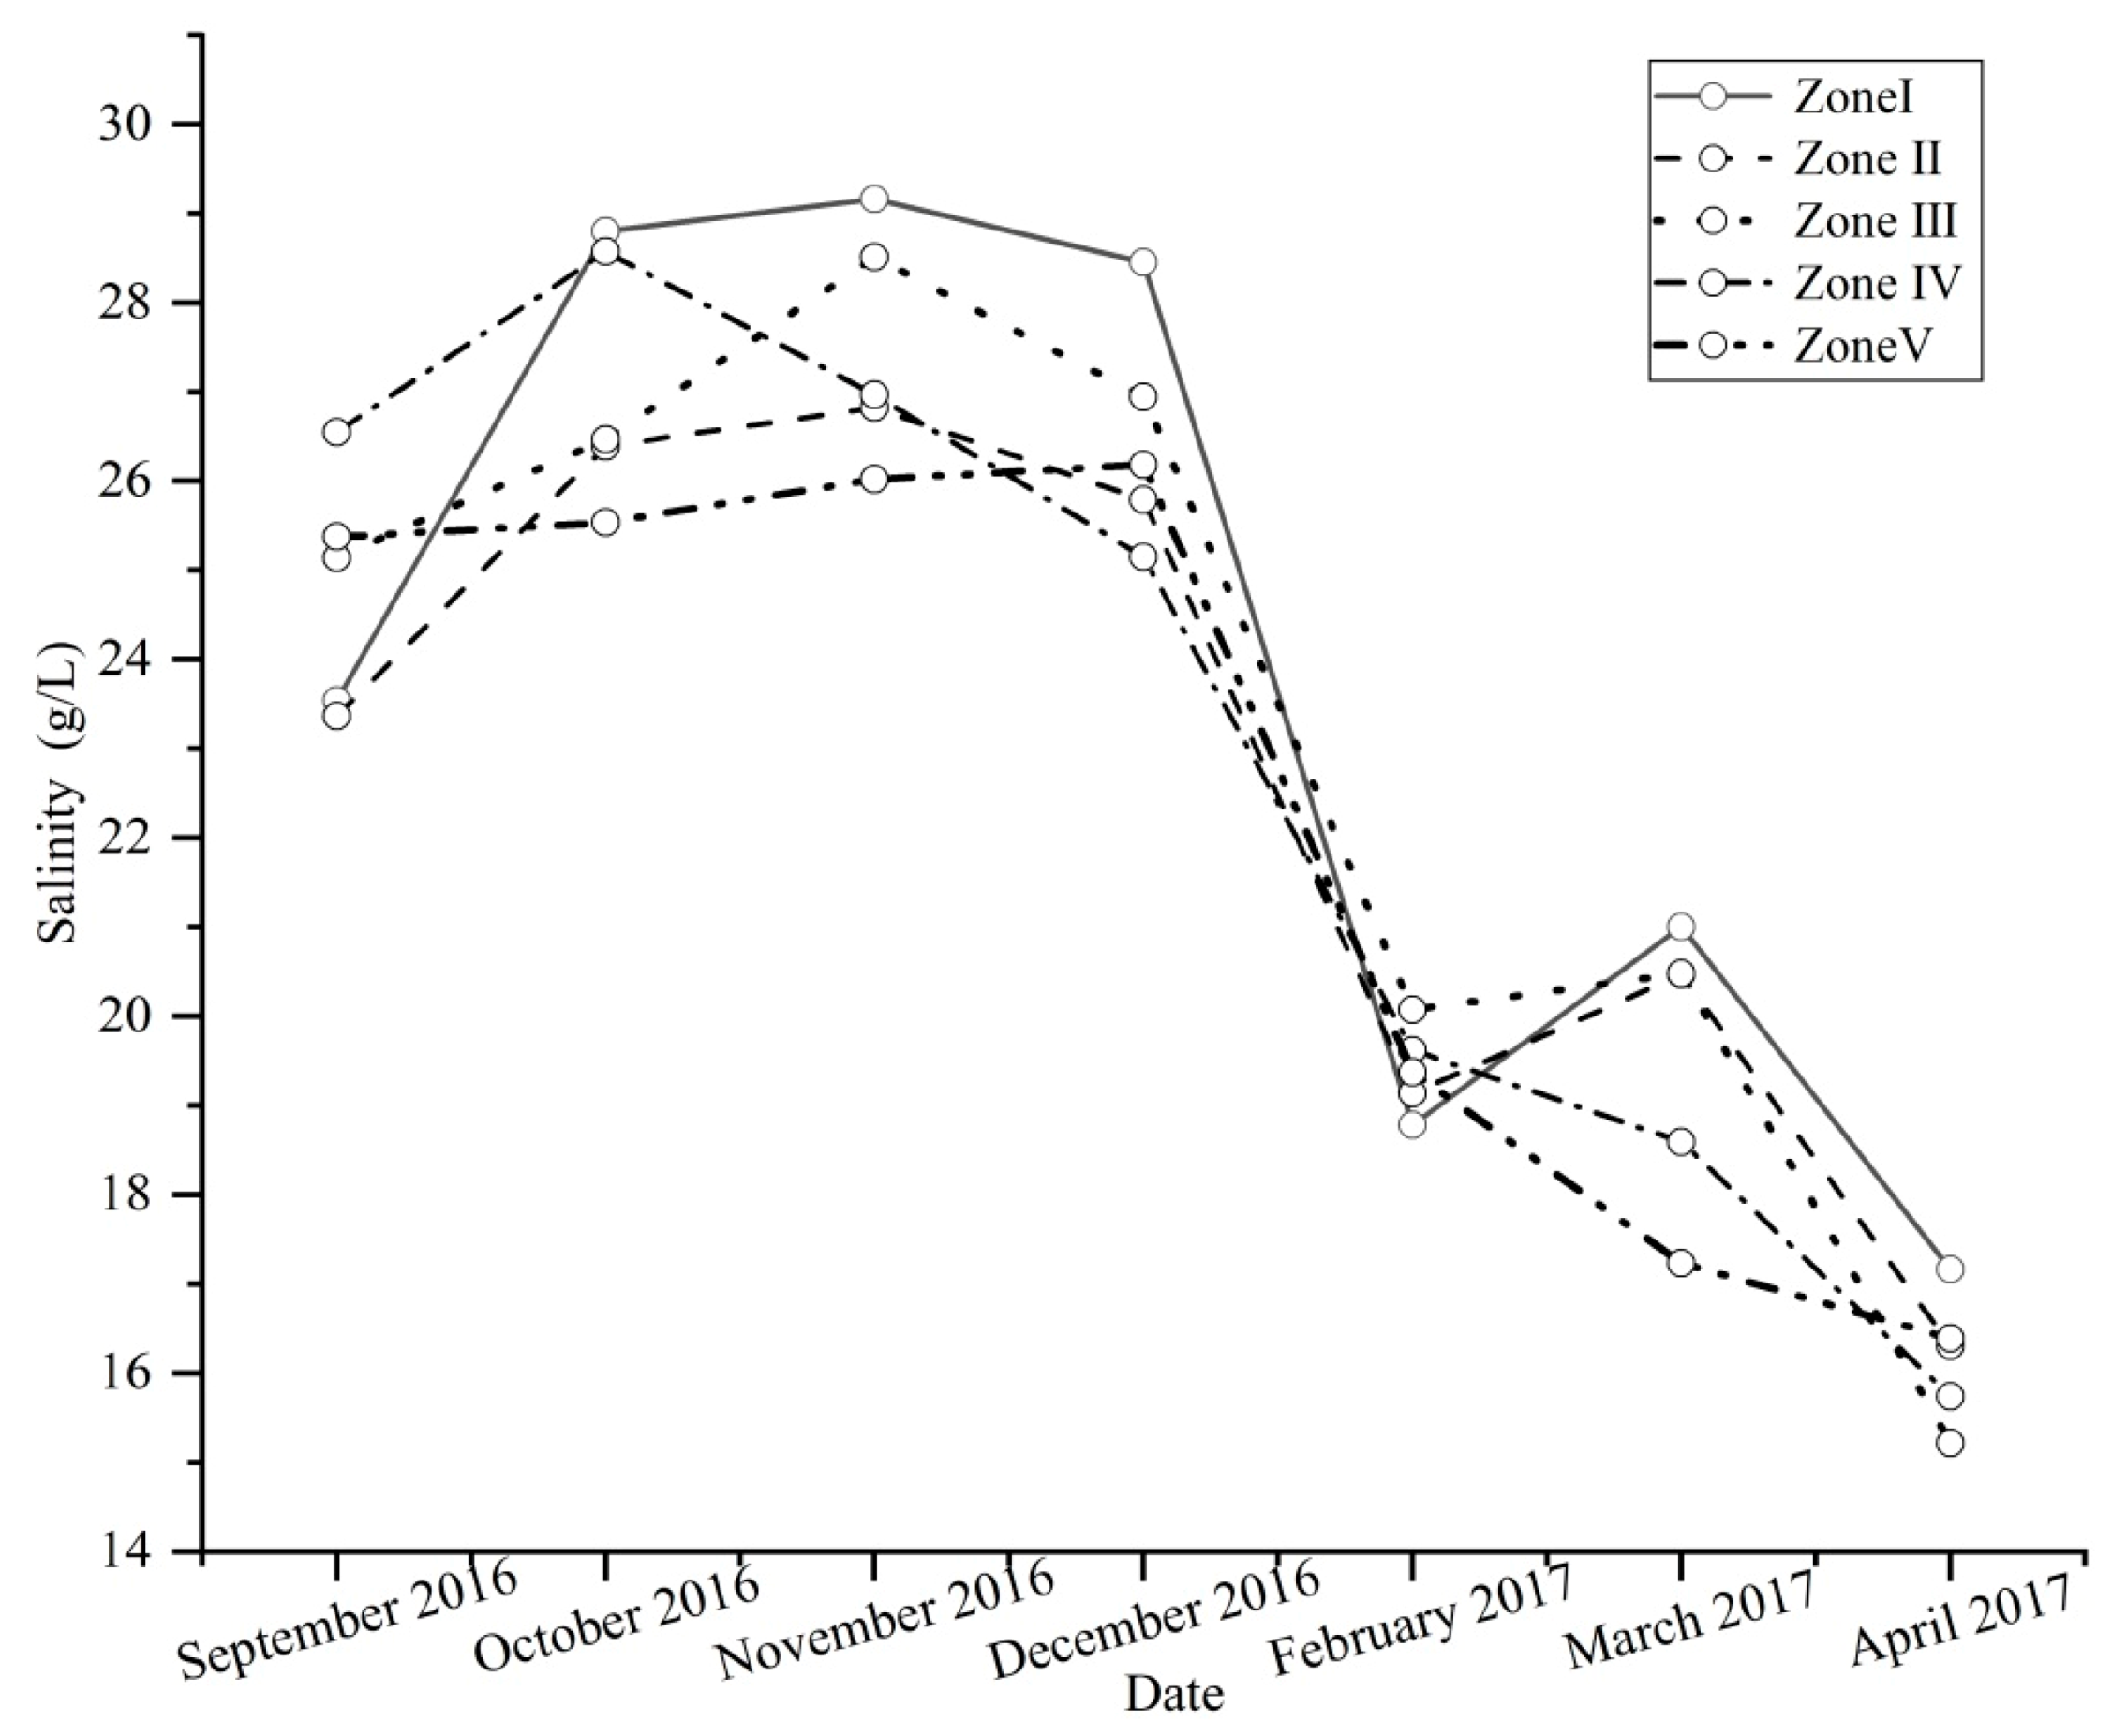
Figure 8.
Variation of the mineralization degree of spring water during the monitoring period.

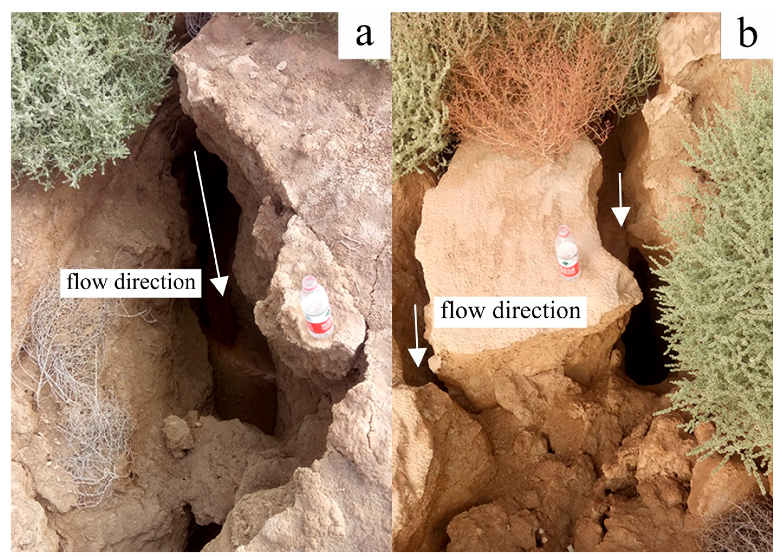
Figure 9.
Site of landslide mass settlement deformation: (a) the main path of spring, it is changing slowly, and (b) the two or more branch seepage paths caused by the collapse deformation of soil. At this location, evidence of soil collapse can be clearly found, which is common on landslide mass.
Figure 9.
Site of landslide mass settlement deformation: (a) the main path of spring, it is changing slowly, and (b) the two or more branch seepage paths caused by the collapse deformation of soil. At this location, evidence of soil collapse can be clearly found, which is common on landslide mass.


Table 1.
Physical properties of the test soil (Gu et al. [50]).
Table 1.
Physical properties of the test soil (Gu et al. [50]).
| Name | Natural Density g/cm3 | Water Content/% | Specific Gravity Gs | Plastic Limit/% | Liquid Limit/% |
|---|---|---|---|---|---|
| Loess | 1.465 | 5.404 | 2.69 | 11.36 | 27.89 |
| Silty clay | 1.592 | 12.137 | 2.71 | 15.63 | 25.02 |
Table 2.
Methods for determining salt ions.
| Salt Ion Species | Method of Determination |
|---|---|
| NO−, NH+ | Spectrophotometer |
| Cl− | Silver nitrate titration |
| SO2– | EDTA indirect complexometric titration |
| HCO− | Double indicator neutralization titration |
| Ca2+, Mg2+ | EDTA titration |
| Na+, K+ | Flame photometry |
Table 3.
Data list of Sentinel-1A from 14 October 2014 to 7 May 2017.
| No. | Image Date | No. | Image Date |
|---|---|---|---|
| 1 | 20141014 | 22 | 20160418 |
| 2 | 20141107 | 23 | 20160512 |
| 3 | 20141201 | 24 | 20160605 |
| 4 | 20141225 | 25 | 20160629 |
| 5 | 20150118 | 26 | 20160723 |
| 6 | 20150211 | 27 | 20160816 |
| 7 | 20150307 | 28 | 20160909 |
| 8 | 20150331 | 29 | 20161003 |
| 9 | 20150424 | 30 | 20161027 |
| 10 | 20150518 | 31 | 20161120 |
| 11 | 20150705 | 32 | 20161214 |
| 12 | 20150729 | 33 | 20170107 |
| 13 | 20150822 | 34 | 20170131 |
| 14 | 20150915 | 35 | 20170212 |
| 15 | 20151009 | 36 | 20170224 |
| 16 | 20151102 | 37 | 20170320 |
| 17 | 20151126 | 38 | 20170401 |
| 18 | 20151220 | 39 | 20170413 |
| 19 | 20160113 | 40 | 20170425 |
| 20 | 20160301 | 41 | 20170507 |
| 21 | 20160325 |
Table 4.
Spring flow of each study subarea (L/s), from September 2016 to April 2017.
| September 2016 | October 2016 | November 2016 | December 2016 | February 2017 | March 2017 | April 2017 | |
|---|---|---|---|---|---|---|---|
| I | 0.380 | 0.425 | 0.560 | 0.420 | 0.450 | 0.240 | 0.520 |
| II | 7.196 | 7.690 | 10.292 | 8.732 | 16.192 | 10.314 | 8.160 |
| III | 7.110 | 9.892 | 15.600 | 10.540 | 9.950 | 7.650 | 8.800 |
| IV | 15.199 | 15.024 | 24.711 | 20.595 | 17.815 | 15.745 | 14.391 |
| V | 20.916 | 20.225 | 24.730 | 19.312 | 23.380 | 21.847 | 19.445 |
Table 5.
Mineralization degree of spring water in each study subarea (g/L), from September 2016 to April 2017.
Table 5.
Mineralization degree of spring water in each study subarea (g/L), from September 2016 to April 2017.
| September 2016 | October 2016 | November 2016 | December 2016 | February 2017 | March 2017 | April 2017 | |
|---|---|---|---|---|---|---|---|
| I | 23.544 | 28.801 | 29.163 | 28.453 | 18.781 | 21.004 | 17.163 |
| II | 23.365 | 26.391 | 26.824 | 25.789 | 19.138 | 20.47 | 16.304 |
| III | 25.14 | 26.467 | 28.515 | 26.947 | 20.074 | 20.482 | 15.218 |
| IV | 26.548 | 28.574 | 26.967 | 25.151 | 19.617 | 18.593 | 15.742 |
| V | 25.375 | 25.533 | 26.020 | 26.185 | 19.371 | 17.235 | 16.392 |
Publisher’s Note: MDPI stays neutral with regard to jurisdictional claims in published maps and institutional affiliations. |
© 2020 by the authors. Licensee MDPI, Basel, Switzerland. This article is an open access article distributed under the terms and conditions of the Creative Commons Attribution (CC BY) license (http://creativecommons.org/licenses/by/4.0/).
Share and Cite
MDPI and ACS Style
Zhang, Z.; Zeng, R.; Meng, X.; Zhang, Y.; Zhao, S.; Ma, J.; Yao, Y. Effect of Soluble Salt Loss via Spring Water on Irrigation-Induced Landslide Deformation. Water 2020, 12, 2889. https://doi.org/10.3390/w12102889
AMA Style
Zhang Z, Zeng R, Meng X, Zhang Y, Zhao S, Ma J, Yao Y. Effect of Soluble Salt Loss via Spring Water on Irrigation-Induced Landslide Deformation. Water. 2020; 12(10):2889. https://doi.org/10.3390/w12102889
Chicago/Turabian StyleZhang, Zonglin, Runqiang Zeng, Xingmin Meng, Yi Zhang, Shufen Zhao, Jianhua Ma, and Yunqi Yao. 2020. "Effect of Soluble Salt Loss via Spring Water on Irrigation-Induced Landslide Deformation" Water 12, no. 10: 2889. https://doi.org/10.3390/w12102889
Note that from the first issue of 2016, this journal uses article numbers instead of page numbers. See further details here.