A Detailed Assessment of Groundwater Quality in the Kabul Basin, Afghanistan, and Suitability for Future Development


1
Department of Geology, Faculty of Geosciences, Bamyan University, Bamyan 1601, Afghanistan
2
Department of Geosciences, Western Michigan University, Kalamazoo, MI 49008, USA
3
The Environment & Resource Efficiency Cluster (EREC) Nazarbayev University, Nazarbayev University Research and Innovation System, Nur Sultan 010000, Kazakhstan
4
Water Sciences Laboratory, University of Nebraska-Lincoln, Lincoln, NE 68503, USA
*
Author to whom correspondence should be addressed.
Water 2020, 12(10), 2890; https://doi.org/10.3390/w12102890
Submission received: 23 September 2020
/
Revised: 7 October 2020
/
Accepted: 9 October 2020
/
Published: 16 October 2020
(This article belongs to the Special Issue Assessing Surface and Ground- Water Vulnerability and Pollution Risk)
Abstract
:Kabul is one of the most populated cities in Afghanistan and providing resources to support this population in an arid climate presents a serious environmental challenge. The current study evaluated the quality of local Kabul Basin groundwater to determine its suitability water for drinking and irrigation purposes now and into the future. This aim was aided through groundwater parameter assessment as well as determination of Water Quality Index (WQI) developed from 15 observation points near the city. The results of our physicochemical analysis illustrate that groundwater in the majority of areas of the Kabul Basin is not generally suitable for human consumption, and in some cases the concentrations of many contaminants are higher than accepted health standards or water quality benchmarks. The aquifer underlies an arid landscape, and because of this 85% of the samples tested are very hard while just over 13% are classified as hard. Groundwater in the Kabul Basin is typically high in calcium and magnesium and overall classified as a calcium bicarbonate water type. Overall, more than 60% of the analyzed samples had concentrations higher than the World Health Organization (WHO) standard of total dissolved solids (TDS), 10% in total hardness (TH), about 30% in turbidity and more than 90% in magnesium. The results show that based on WQI, without treatment, roughly 5% of groundwater in the studied area is unsuitable for human consumption, while 13.3% is very poor and 40% is poor quality water. Approximately 40% of the assessed groundwater has good quality and could be used as drinking water for future development. Groundwater in some areas shows evidence of pollution and high dissolved solids content, rendering these sources unsuitable for either drinking or irrigation purposes.
1. Introduction
The study of geochemical properties of groundwater is one of the most important means for evaluation of groundwater quality, because the quality of groundwater can be changed by land use development, mining, climate change, or from natural chemical weathering as it flows through the subsurface [1,2], interacts with soil layers and rocks [3], and generally leads to increasing levels of dissolved solids [4,5]. In addition, groundwater [1] often provides that main source of freshwater [3] used for drinking, domestic, agricultural, industrial, and ecological supplies worldwide. Thus, preservation of groundwater quality is a growing concern globally [6,7]. It is important to measure and understand the processes controlling the chemical composition of groundwater for the assessment of quality and potential future use. Management should be aimed at determination of a balanced set of solutions to ensure sustainability and socioeconomics [2]. Generally, groundwater pollution is divided into natural [8,9] and artificial causes [9]. Water quality parameters are divided into three classes, which include chemical, physical, and biological. Often measured parameters include dissolve ions and other substances, while physical parameters may include the color, turbidity, odor, temperature, and taste, and coliform bacteria may provide some indication of the suitability for drinking water quality [4]. It is helpful to compare concentrations of measured parameters with different water quality standards used worldwide such as standards of the World Health Organization (WHO) to evaluate suitability for different uses. In addition to reporting individual parameters, the water quality index (WQI) helps to classify the quality of groundwater and communicate suitability for given purposes to individuals responsible for decision making [4,10].
Geochemical data can be shown graphically using Piper diagrams to help understand processes, such as chemical weathering, which have led to groundwater composition. Piper diagrams show the relative proportion of cations and anions and may be used to infer mineral sources of dissolved solids which occur in groundwater [11,12]. It is no doubt true that there is a close relationship between water quality and composition of geological materials at groundwater recharge areas. Some rocks and other geological materials tend to weather quickly as water recharges an aquifer, and the mineral contents of these materials is controlled by the elements present in these rocks. Because mineral solubility is variable, some such as gypsum, halite, and fluorite react to impart dissolved elements to the water more quickly than others [11,13].
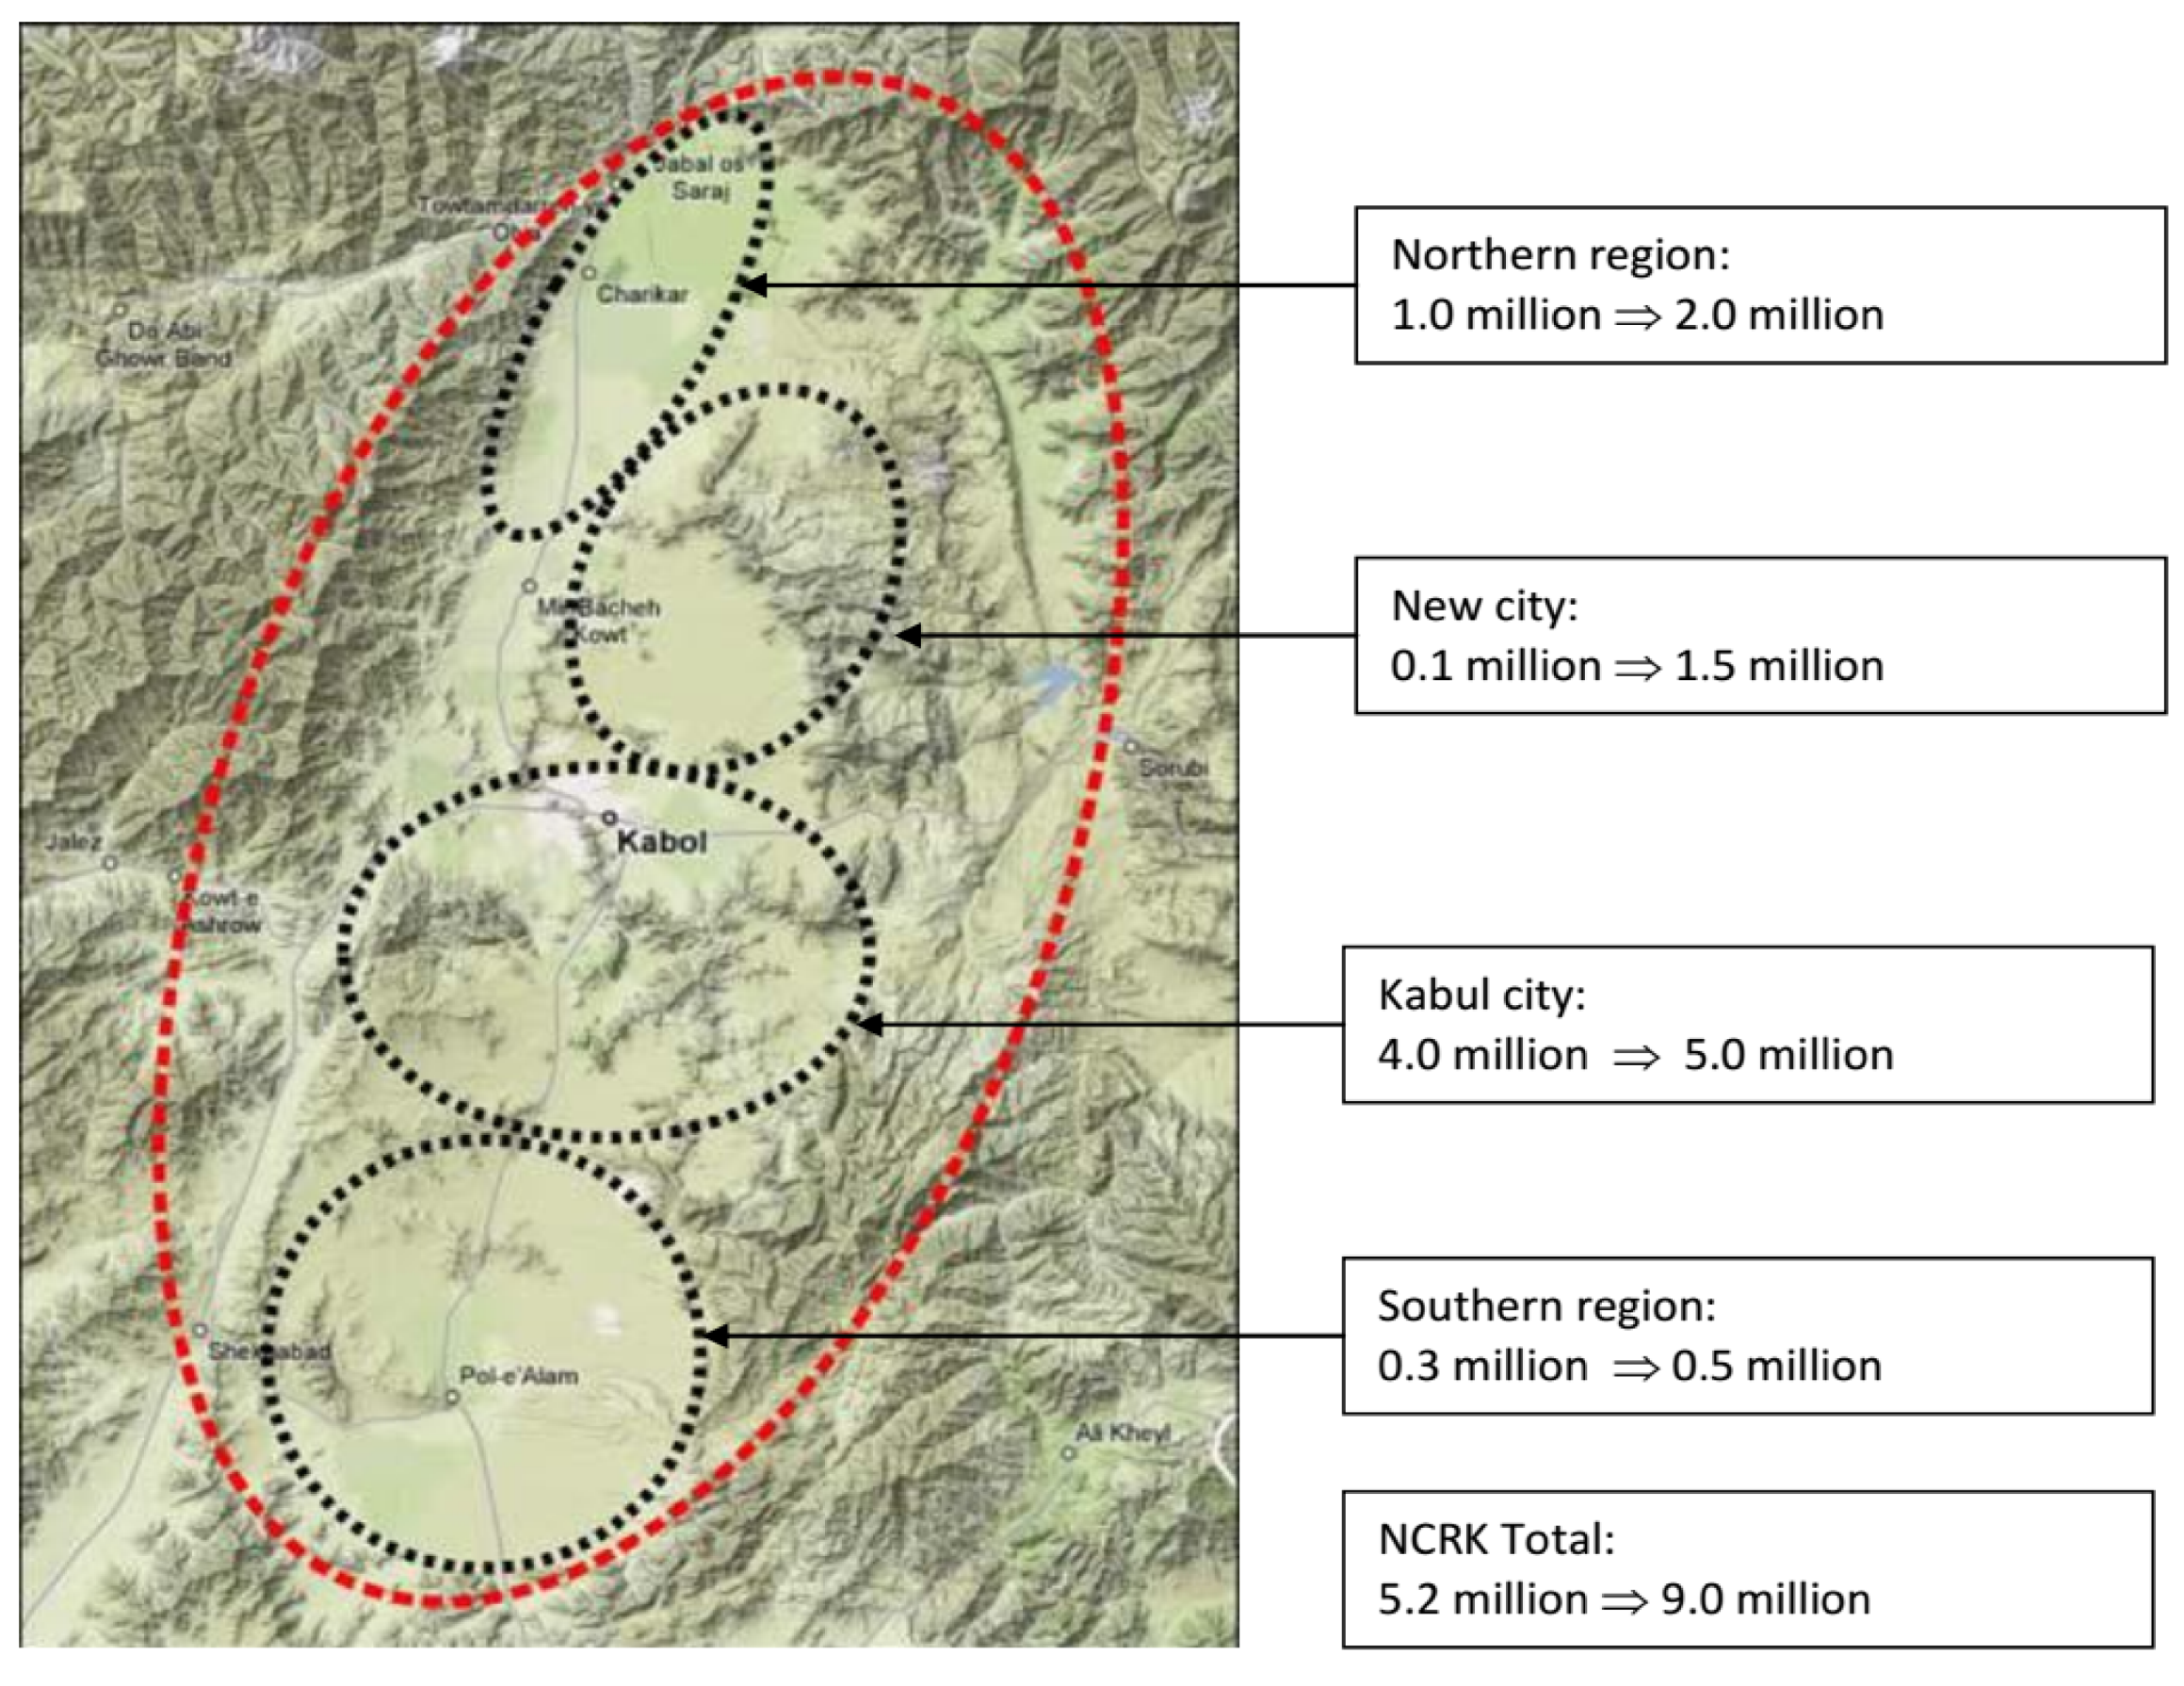
Groundwater scarcity and contamination in aquifers is likely be affected by changing land use such as construction [14], agriculture and changes in population, and industrial development activities at city boundaries. Hydrogeological properties, exploration potential, and recharge processes are key factors of evaluating groundwater scarcity in groundwater [15]. According to Afghan government data and recent studies, approximately five million people are now living in Kabul City in spite of the fact that the city’s infrastructure was designed to support only 2.5–3 million citizens [16,17]. It is likely that recent population growth has led to a substantial increase in groundwater extraction and pollution both of which may be causes for future groundwater scarcity. Thus, it becomes necessary to assess the current groundwater quality systematically and evaluate suitability for drinking and irrigation purposes.
The purposes of the current paper are two-fold: (1) to assess the general situation of groundwater quality in the Kabul Basin using recently collected data; and (2) to provide interpretation of the suitability of quality for drinking and for irrigation. Hence, physicochemical features of groundwater in the Kabul Basin, WQI, nitrate, bacteria, and hardness were used to reach the mentioned aims.
2. Materials and Methods
2.1. Study Area Description
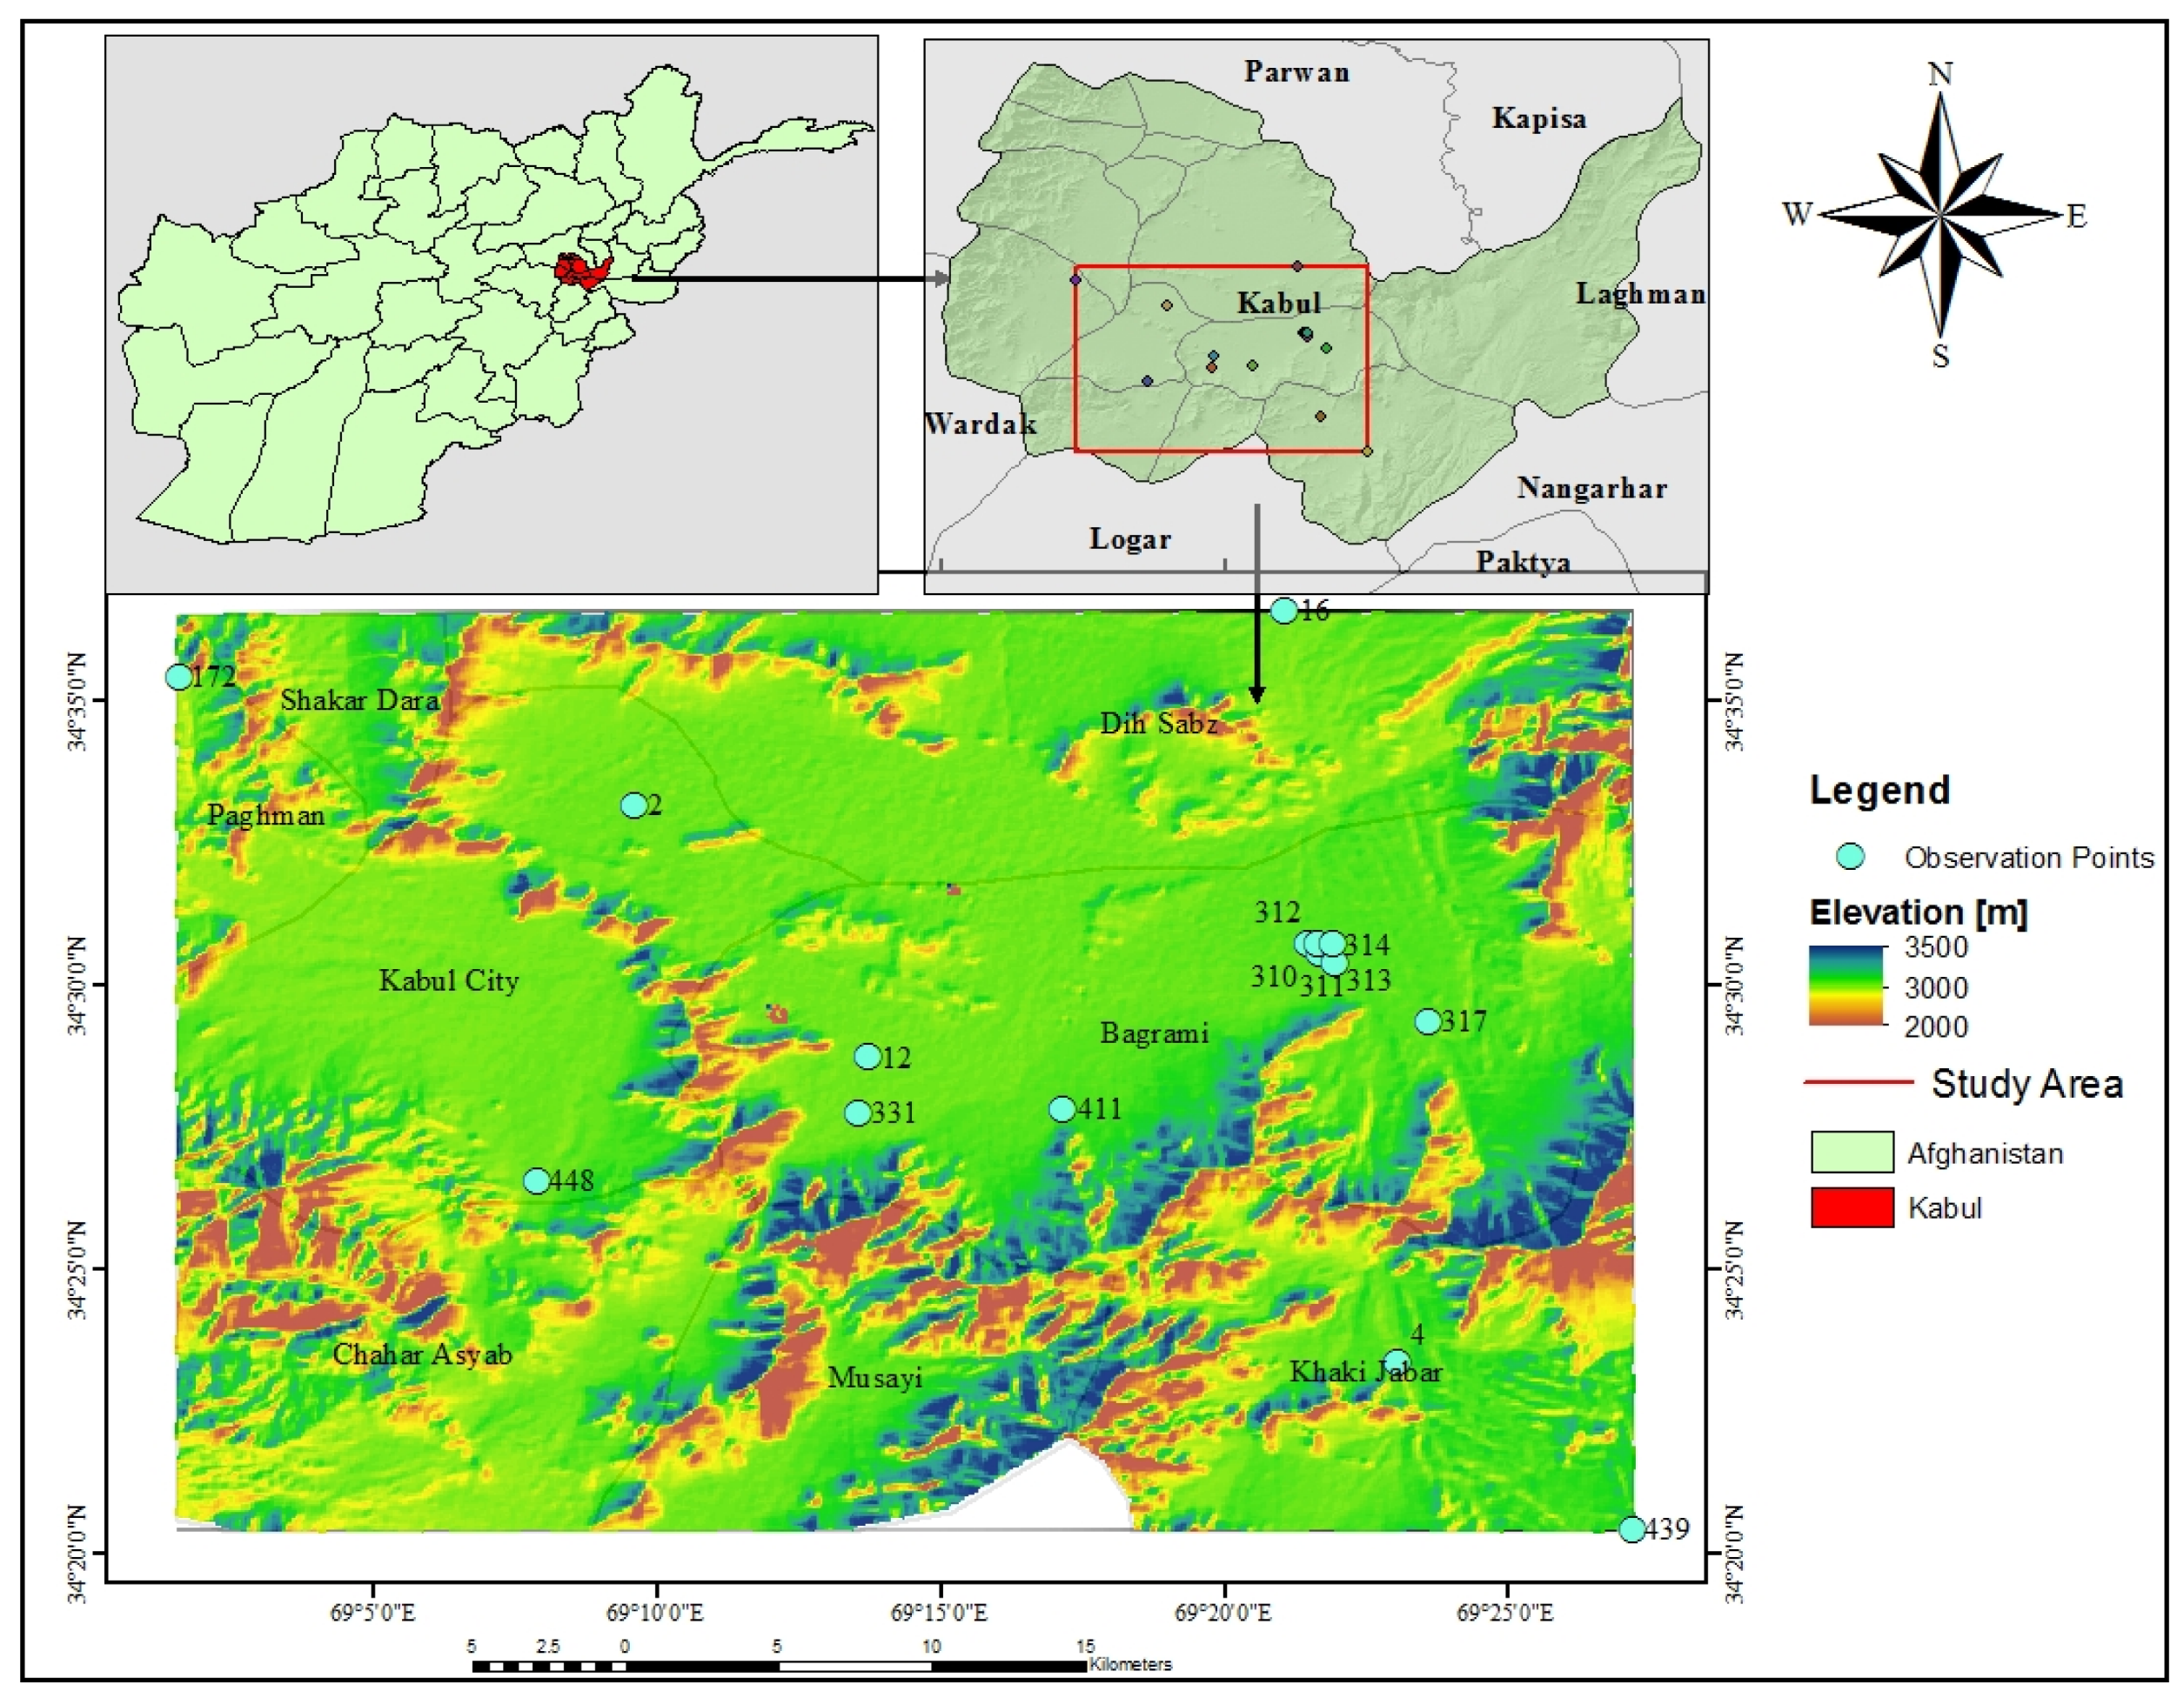
Geographically, the Guzarga-Asmain Mountain divides the Kabul Basin into upper and lower regions. The upper sub-basin located to the northwest of Kabul City and surface water generally drains southeast through the upper Kabul and Paghman rivers. The lower Kabul River is formed when these two rivers join together at a narrow gorge called Share Darvwaza, which is connected to the upper and lower Kabul sub-basins. The lower Kabul sub-basin located under the northeastern part of Kabul City drains via the Kabul and Logar rivers, and they join and pass through the second narrow gorge called Tangi Gharo [18].
The Kabul Basin is divided into three hydrologic sub-basins referred to as the Logar–Upper Kabul, Panjshir, and Lower Kabul sub-basins, as shown in Figure 1. These three hydrologic units include the upper Tertiary (Neogene) aquifer as well as several aquitard systems and Quaternary alluvial deposits. According to Thomas [19], the thickness of the strata in the Kabul Basin is approximately 600 m. The Afghan Geological Survey (AGS) indicates that Neogene sediments of the Lower Kabul sub-basin, named the Kabul-Logar sub-basin, are up to 647 m in thickness. The thickness of Neogene sediments of the upper Kabul sub-basin, also called the Darulaman-Paghman sub-basin, increases to approximately 690 m. Seepage from the Kabul River is likely a main source of groundwater recharge in the area; however, during snow melt and rainfall, local recharge may occur [16,20]. The Kabul Basin is divided into four Quaternary and interconnected aquifers [20]. The upper Kabul Basin, or Darulaman-Paghman sub-basin, forms two aquifers located along the Paghman River course and the upper part of Kabul River, and the lower Kabul Basin, or Kabul-Logar sub-basin, dividing into two other aquifers located along the Logar as well as the lower Kabul River [16,18,19]. Generally, groundwater flows from west or southwest to the east [20]. Based on the borehole results, partially cemented gravel and sandy beds form the main aquifer materials [20].
During the last 19 years, a number of national authorities including the Afghan Geological Survey (AGS) and international organizations including the Danish Committee for Aid to Afghan Refugees (DACAAR), the United States Geological Survey (USGS), the Bündesanstalt für Geowissenschaften und Rohstoffe (BGR), the and Japan International Cooperation Agency (JICA) have studied the physicochemical characteristics of groundwater in the Kabul Basin [21]. Previous reports of groundwater quality suggest that composition and quality varies widely, likely a result of stressors such as population growth, local development, and changing local water use. In areas with little development, total dissolved solids concentration is relatively low, while in other regions a high amount of dissolved solids are present in groundwater limiting use for irrigation and human consumption. According to previous investigations, dissolved solids (salinity), nitrate, hardness, boron, and coliform bacteria are all primary water quality concerns in this area [18,19].
2.2. Geological Setting
Several formations of differing ages exist within the Kabul Basin, which is presently surrounded by mountains and underlain primarily by metamorphic rocks (Figure 2). For example, in the south and eastern basins, Precambrian metamorphic basement is composed of gneisses, granitic-gneisses, amphibolite, mica, schist, quartzite, marbles, and some younger sedimentary rocks (upper Paleozoic–Mesozoic) such as limestone and marls. The shallow parts of the basin are filled with consolidated and unconsolidated clastic and alluvial sedimentary rocks such as clay, sand, gravel, pebble, and conglomerate aged upper tertiary and Quaternary (Table 1) [16]. A number of block boundaries are indicated through suture zones, and the Kabul Block is one contisting of Proterozoic metamorphic rocks, overlain with Paleozoic to Cenozoic (Pliocene) sedimentary strata [20]. The Kabul Basin, which was formed because of faulting of crystalline rocks and erosion, and plate movements during the Late Paleocene (Tertiary), is placed in the north-central part of the Kabul block [20]. Metamorphic rocks comprise part of the Kabul Block, intersected through the Herat-Bamyan main fault in the western part, the Sorobi fault in the eastern part, and the Chaman fault in the southeastern parts, all surrounded and underlain in the Kabul Basin [20]. The shallow (phreatic) aquifer of the Kabul Basin is a surficial sedimentary aquifer type containing alluvium and loess deposits [22].
2.3. Sampling and Data Preparation
A portion of the data used in the current study was collected by the Danish Committee for Aid to Afghan Refugees (DACAAR) from the Kabul River basin, and includes samples collected from Kabul City, the capital of Afghanistan in 2018. From the regional study, 15 observation points were selected for additional sampling and further characterization of local groundwater quality (Figure 1). Additional samples were collected during March–April 2018. Several parameters were measured at the time of sample collection, including electrical conductivity (µS/cm), total dissolved solid (mg/L), oxidation-reduction potential (mV), pH, and temperature (°C). Before sampling from dug wells, the water was pumped out for one–two minutes with a PM1 pump (Grundfos Corporation, Denmark) in order to purge the well, then a suction pump was used to obtain a representative sample for laboratory testing. Collected samples were stored in a cooler with ice. Samples for nitrate and ammonia, chloride, and sulfate were collected in 50 milliliter (mL) glass bottles and the rest were collected in 100 mL plastic bottles.
Using these results, concentrations of several physicochemical parameters were selected to compare with published drinking and irrigation water standards. A correlation coefficient index and additional relations between the studied physicochemical parameters permitted more complete statistical analysis. Additionally, Geochemist’s Workbench edition 12.0 (Aqueous Solutions, LLC, Champaign, IL, USA) was used to construct a Piper diagram for groundwater classification based on major ions. The results and suitability of groundwater for drinking were then compared to the World Health Organization (WHO), Afghan standard of drinking water, Indian and European drinking water quality standards [23,24,25]. Irrigation water quality standards are from Ayres [26].
2.4. Laboratory Analysis
Water samples were analyzed in the laboratory using standard test methods. The pH, electrical conductivity (EC), total dissolved solids (TDS), total hardness (TH), chloride (Cl−), turbidity, sulfate (SO42−), fluoride (F−), nitrate (NO3−), phosphate (PO43−), boron (B), calcium (Ca), magnesium (Mg), total iron (Fe) were analyzed in the laboratory using colorimetric and water chemistry methods supplied by HACH (Loveland, CO, USA) (Table 2). Reference methods are taken from the manufacturer’s website.
2.5. Water Quality Index (WQI) Calculation
The WQI was calculated following WHO guidelines and used to classify water suitability for human consumption. This index reflects the composite impact of parameters of water quality on intended use [4,10]. According to [4], the calculation was performed by evaluating the importance of the measured parameters on water quality for drinking and using accepted values from international standards of twelve of the measured physicochemical parameters pH, total dissolved solids (TDS), turbidity, total hardness (TH), sulfate, calcium, magnesium, chloride, fluoride, boron, nitrate, and total iron. Some measurements, such as fecal coliforms were not used in the WQI calculation. Following WHO guidelines, each parameter was assigned a factor (wi) (range from 1 to 5) to calculate the relative weight () needed for WQI assessment. Those which have a larger impact on drinking water quality were numbered 1, whereas the parameters with lowest impact on water quality were numbered as 5. The relative weight () of all selected parameters was calculated using the following equation:
here, () shows the relative weight, () and illustrates the weight of every parameter and (i) is the number of parameters included in the calculation. The results of each relative weight are shown in Table 3.
After relative weight calculation, a quality rating scale (qi) of each parameter (excluding pH) is determined by dividing the concentration of every water sample to the respective standard and multiplied by 100 [23,27].
In Equation (2), the qi is shown as the quality rating, (mg/L) is each chemical parameter concentration in every water sample, and finally, illustrates the value of the Afghan standard or WHO (mg/L) for each parameter.
It should be noted that quality rating of pH and dissolved oxygen cannot be calculated through the above formula; alternatively, they are calculated based on the following formula given [27,28].
Herein, is the value of the parameter and is the recommended standard, is the ideal value which is equal to 7.0 for pH and 14.6 for dissolved oxygen (DO) at saturation.
Following, the sub-index (), which is needed for WQI calculation of each parameter, is counted.
where is a sub-index of ith parameter, is a relative weight of ith parameter, is the rating according of ith parameter concentration, and n is a chemical parameter number.
2.6. Evaluation of Water Quality for Irrigation
Finally, due to potential use for irrigation, groundwater suitability for this purpose was evaluated through a comparison of recorded parameters with standard of water quality for agriculture [6,26]. According to [26], salinity, infiltration rate, specific ion toxicity, and miscellaneous effects are the common problems in irrigated agriculture related to water quality. Also, as [26] suggested, the Sodium Adsorption Ratio (SAR) is determined and included as a way to assess water quality utilized for irrigation purposes, and it is calculated by the following formula.
Herein, SAR is the value of sodium adsorption ration in me/L, Na, Ca, Mg are sodium, calcium, and magnesium in mg/L received from groundwater analysis.
3. Results and Discussion
3.1. Physicochemical Parameters
Water is the most important resource for all life, thus it should be regularly monitored before use for drinking, domestic, irrigation, or industrial purposes. One main reason for groundwater testing is to characterize chemical composition derived from rocks and minerals. Mineral dissolution from chemical weathering of rocks in recharge areas is a primary mechanism controlling water quality. Groundwater quality is related to the recharge water composition, and the chemical interactions between water and aquifer materials over time. Generally, groundwater quality measurements are divided into three categories such as physical, chemical, and biological [31]. While it is impossible to assess all parameters, suitability of water can be evaluated even from a limited number of measurements [4,30]. Though several physicochemical parameters in the study area were measured and evaluated with respect to WQI, the value of some, such as chromium, magnesium, ammonia, copper, aluminum, arsenic, and fecal coliforms were either below detection or could not be measured with confidence, and thus these parameters were not included in the data analysis.
3.1.1. Hydrogen Ion Potential (pH)
In the study area, all samples were slightly alkaline, and the maximum pH value was 8.44, which was recorded in observation point 12 located in the Logar sub-basin zone (Figure 1). The lowest pH value of 7.59 was measured at point 2 located in the Pol-e-Charkhi sub-basin. The comparison of recorded pH values in the study area with common standards suggest that groundwater is good quality for intended use as nearly all recorded values are in the standards range. The overall alkaline pH measurements suggest that aquifer materials provide some buffering, and water from these wells should have a low potential for corrosion.
3.1.2. Total Dissolved Solids (TDS)
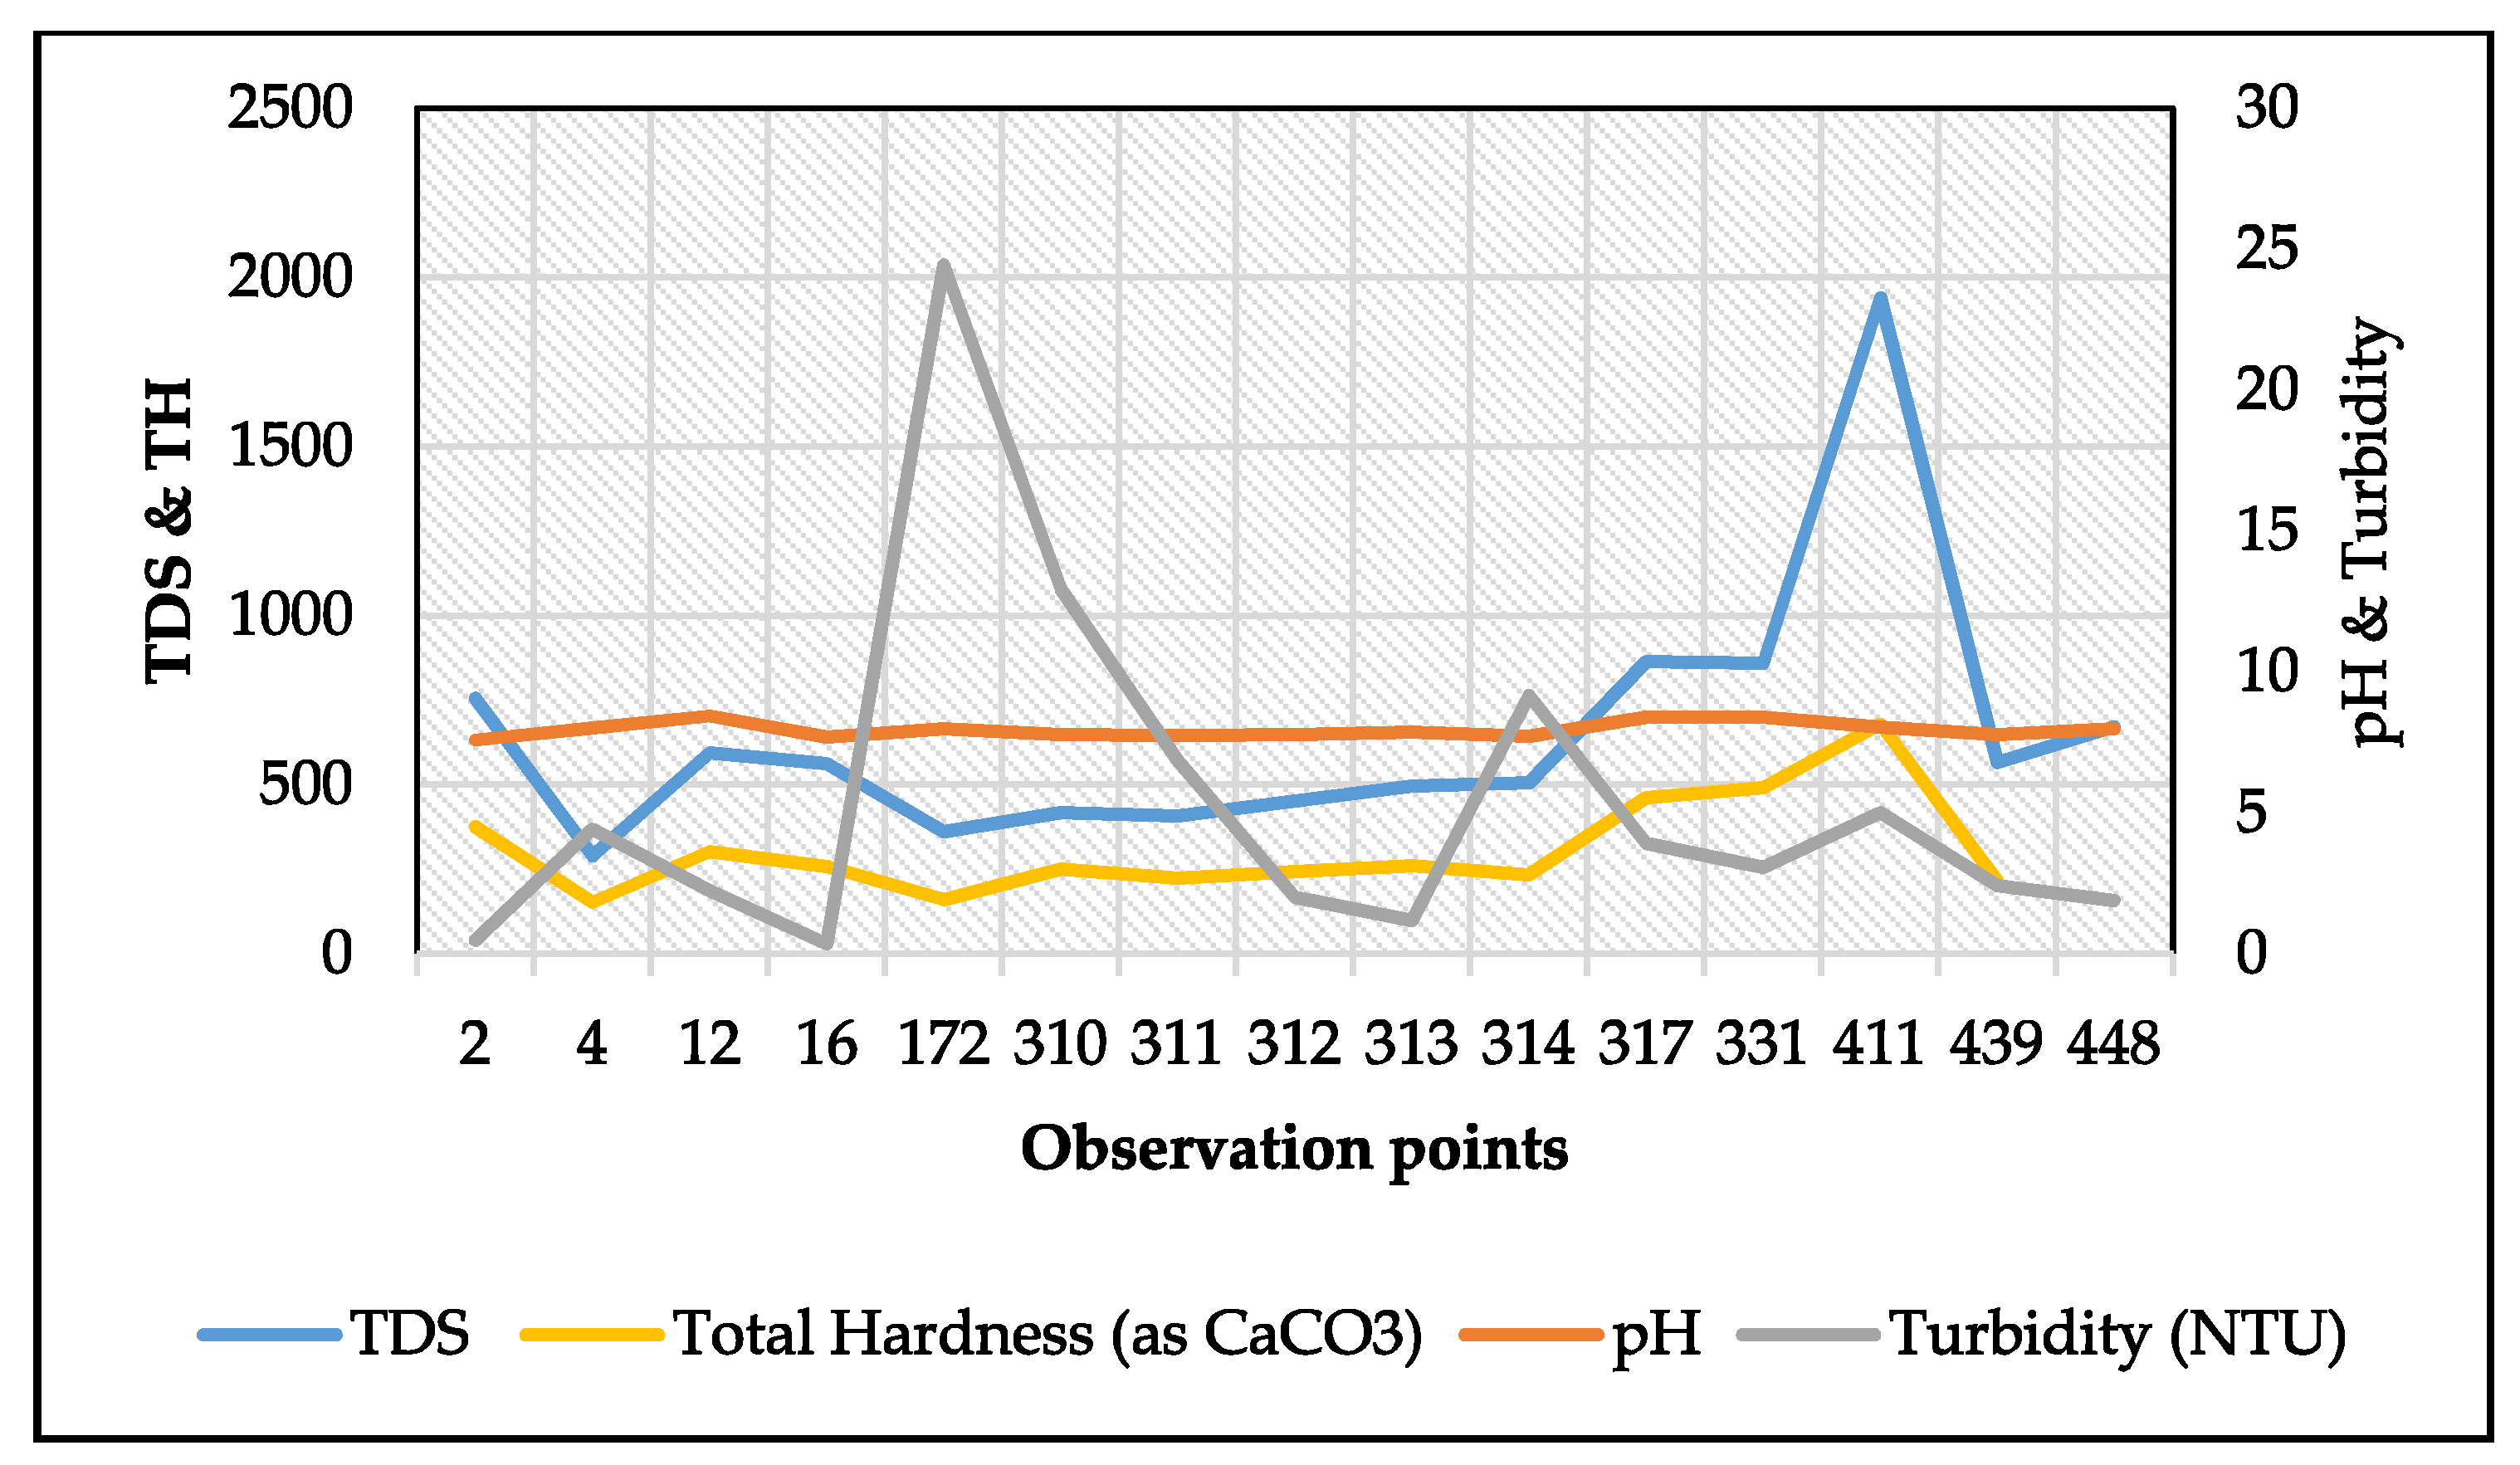
Total dissolved solids are the sum of dissolved mineral content, including bicarbonate, carbonate, sulphate, chloride, nitrate, calcium, magnesium, sodium, potassium ions as well as trace element constituents in the water. The general range of TDS in groundwater is previously reported to range from ~20 mg/L in the high rainfall area to near 100,000 mg/L in desert brines [32]. According to the World Health Organization [25], TDS concentrations up to 500 mg/L are generally acceptable for drinking water quality. In the study area, TDS is much higher with the maximum amount of TDS (1940 mg/L) measured in a sampling point in the Damana Kamari village located in the Logar sub-basin. The very high TDS compared with Afghan and WHO standards (1000 and 500 mg/L, respectively), however, is within with the Indian standard for drinking water specification (ISDWS), which indicates that the maximum acceptable TDS is 2000 mg/L for drinking purposes [19]. As it is shown in Figure 3, TDS of several observation points are higher than accepted WHO standards.
3.1.3. Total Hardness (TH)
According to [32], the concentrations of divalent ions such as calcium, magnesium, and iron in water contributes to its harness; however, commonly water hardness is determined from calcium and magnesium concentrations. From a hardness point of view, more than 86% of groundwater is very hard in the Kabul Basin, whereas just 13% of groundwater is hard (see Table 6). Calcium and magnesium concentrations are relatively high and likely related to the composition of geological materials of this area. Geologically, carbonates with high solubility are found in the Logar sub-basin and likely contributes to groundwater hardness in the region.
3.1.4. Fluoride
According to [25], dissolved fluoride can occur in naturally different sources of groundwater. Because it is difficult to remove fluoride, dilution of high fluoride is the main treatment for high fluoride water sources. In the Kabul Basin, fluoride concentrations range from 0.52 to 2.02 mg/L, suggesting that some water is higher than acceptable for drinking purposes.
3.1.5. Boron
Boron is not as serious a problem as others in the Kabul Basin because most values fall below accepted drinking water standards. As shown in Table 7, the maximum value of boron (2.84 mg/L) is slightly more than the maximum acceptable amount with standard (2.4 mg/L), occurring in a single well (411) located in the Logar sub-basin. Boron can originate from different sources such as residual solutions of evaporating surface water, anthropogenic pollution and detergent which may enter from sewage (especially in the Logar sub-basin), as well as from weathering of boron-bearing minerals.
3.1.6. Turbidity
The measurement of water cloudiness or murkiness caused by suspended particles is called turbidity. Most turbidity originates from organic particles from decomposed plant and animals matter, from inorganic suspended clay or colloidal matter, and from biological microorganisms such as bacteria and algae. Groundwater turbidity can be influenced by heavy rains and flooding, surface activities such as construction and agriculture [33,34]. Measured groundwater turbidity is relatively low overall (Figure 3), except in groundwater samples from Paghman, a mountainous area with heavy precipitation, especially in winter and summer and runoff flows turbulently. Turbidity here is likely due to resuspension of clay from aquifer solids.
3.1.7. Major Ion Chemistry
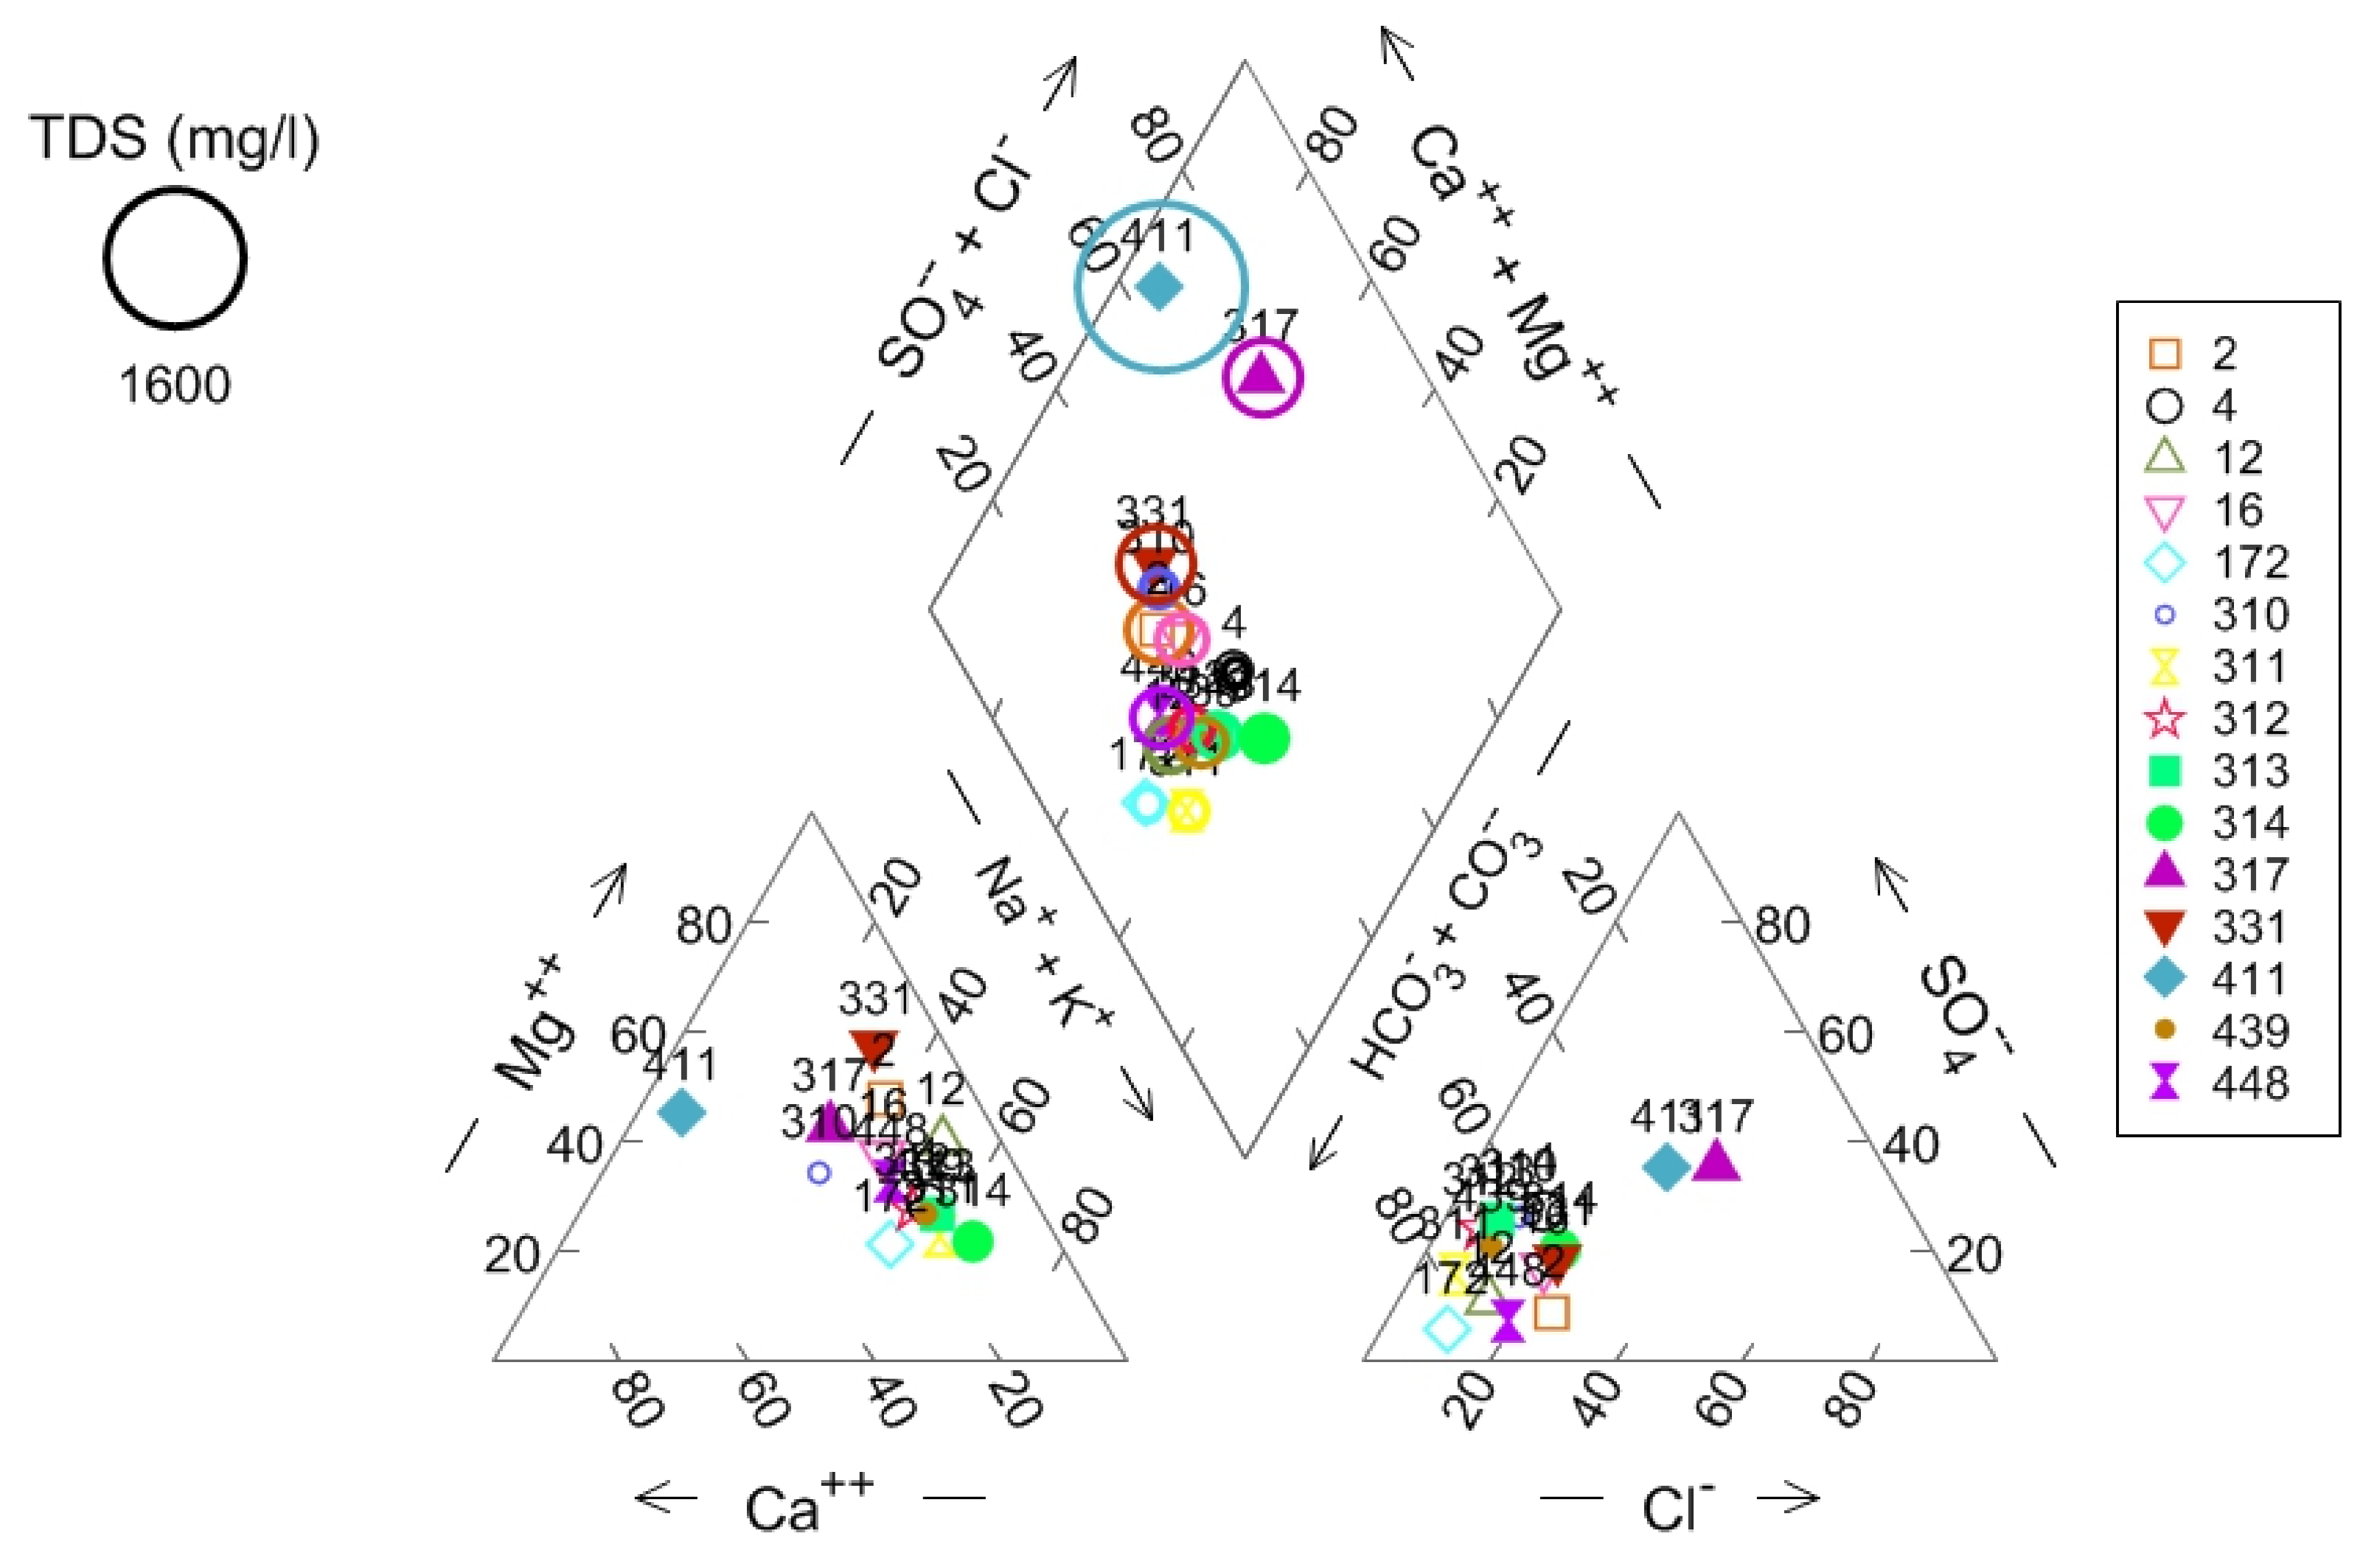
Based on major ion chemistry, groundwater in the Kabul Basin consists primarily of two types or classifications. The first group is classified as a calcium-bicarbonate type while the remaining is a sodium-bicarbonate type as illustrated on a Piper diagram (Figure 4). Calcium concentration range between 140 mg/L and 22 mg/L maximally and minimally, and is within in the accepted standards (Table 7), as are the concentrations of magnesium, sulfate, and chloride. Dissolved inorganic ions generally originate from weathering of calcite, dolomite, biotite, and some other common minerals as well as from ionic exchange with clay minerals.
3.1.8. Total Iron
Elevated iron concentrations occur in groundwater samples from an area known for mining activities, though based on this survey dissolved iron does not significantly impact on groundwater within Kabul City boundaries. As shown in Table 7, the amount of total iron in the Kabul Basin ranges from 0.2 to 0.7 mg/L respectively and averages near standard values for drinking water (0.3 mg/L).
3.1.9. Nitrate
Nitrate is one of the most common pollutants of groundwater, especially in areas with intensive agricultural activities [6]. Nitrate also appears to be a serious issue in the Kabul Basin and elevated concentrations in some wells are likely the result of human and agricultural activities at the surface. As shown in Table 7, the maximum measured concentration of nitrate was 63 mg/L is higher than Afghan, World Health Organization, and European guidelines recommending no more than 50 mg/L nitrate in drinking water. The minimum measured value is 11.6 mg/L, and in generally higher nitrate concentrations occur in the Logar sub-basin where many surface activities may contribute to excess nitrate. Animal waste, poorly-managed septic systems, leaking city wastewater pipes, fertilizers, and agricultural run-off are common sources for nitrate and likely reflect development, population growth, and poor urban planning in the Kabul Basin (Figure 5).
3.2. Comparison of Studied Parameters with Different Standards
In the case of understanding more about the condition of groundwater quality, all analyzed data were compared with worldwide standards. According to Table 8, concentrations of some physicochemical parameters are extremely high compared to the water quality standards. From an acidity point of view, groundwater in the Kabul Basin is solidly alkaline with values ranging from 8.44 and 7.59 maximally and minimally, and somewhat higher than accepted standards. In addition, the accepted range for total dissolved solids is 259–500 mg/L in WHO, 500–2000 mg/L in the Indian standard, while the Afghan standard accepts only 1000 mg/L. However, the maximum measured value 1940 mg/L while the minimum is 289 mg/L. The concentrations of some dissolved ions such as sulfate, chloride, calcium, and magnesium are lower than Afghan or WHO standards, whereas the concentrations of fluoride are high, with an amount of 2.02 mg/L maximally.
Overall, more than 60% of the samples had concentrations higher than WHO standards with respect to TDS, while TH and turbidity have shown to be 10% and 30.7% higher than WHO standards. More than 90% of the samples tested were found with higher concentrations of magnesium compared with WHO values, while the amounts of sulfate, chloride, fluoride, and total iron were lower than WHO standard values (Table 8).
3.3. Correlation Analysis
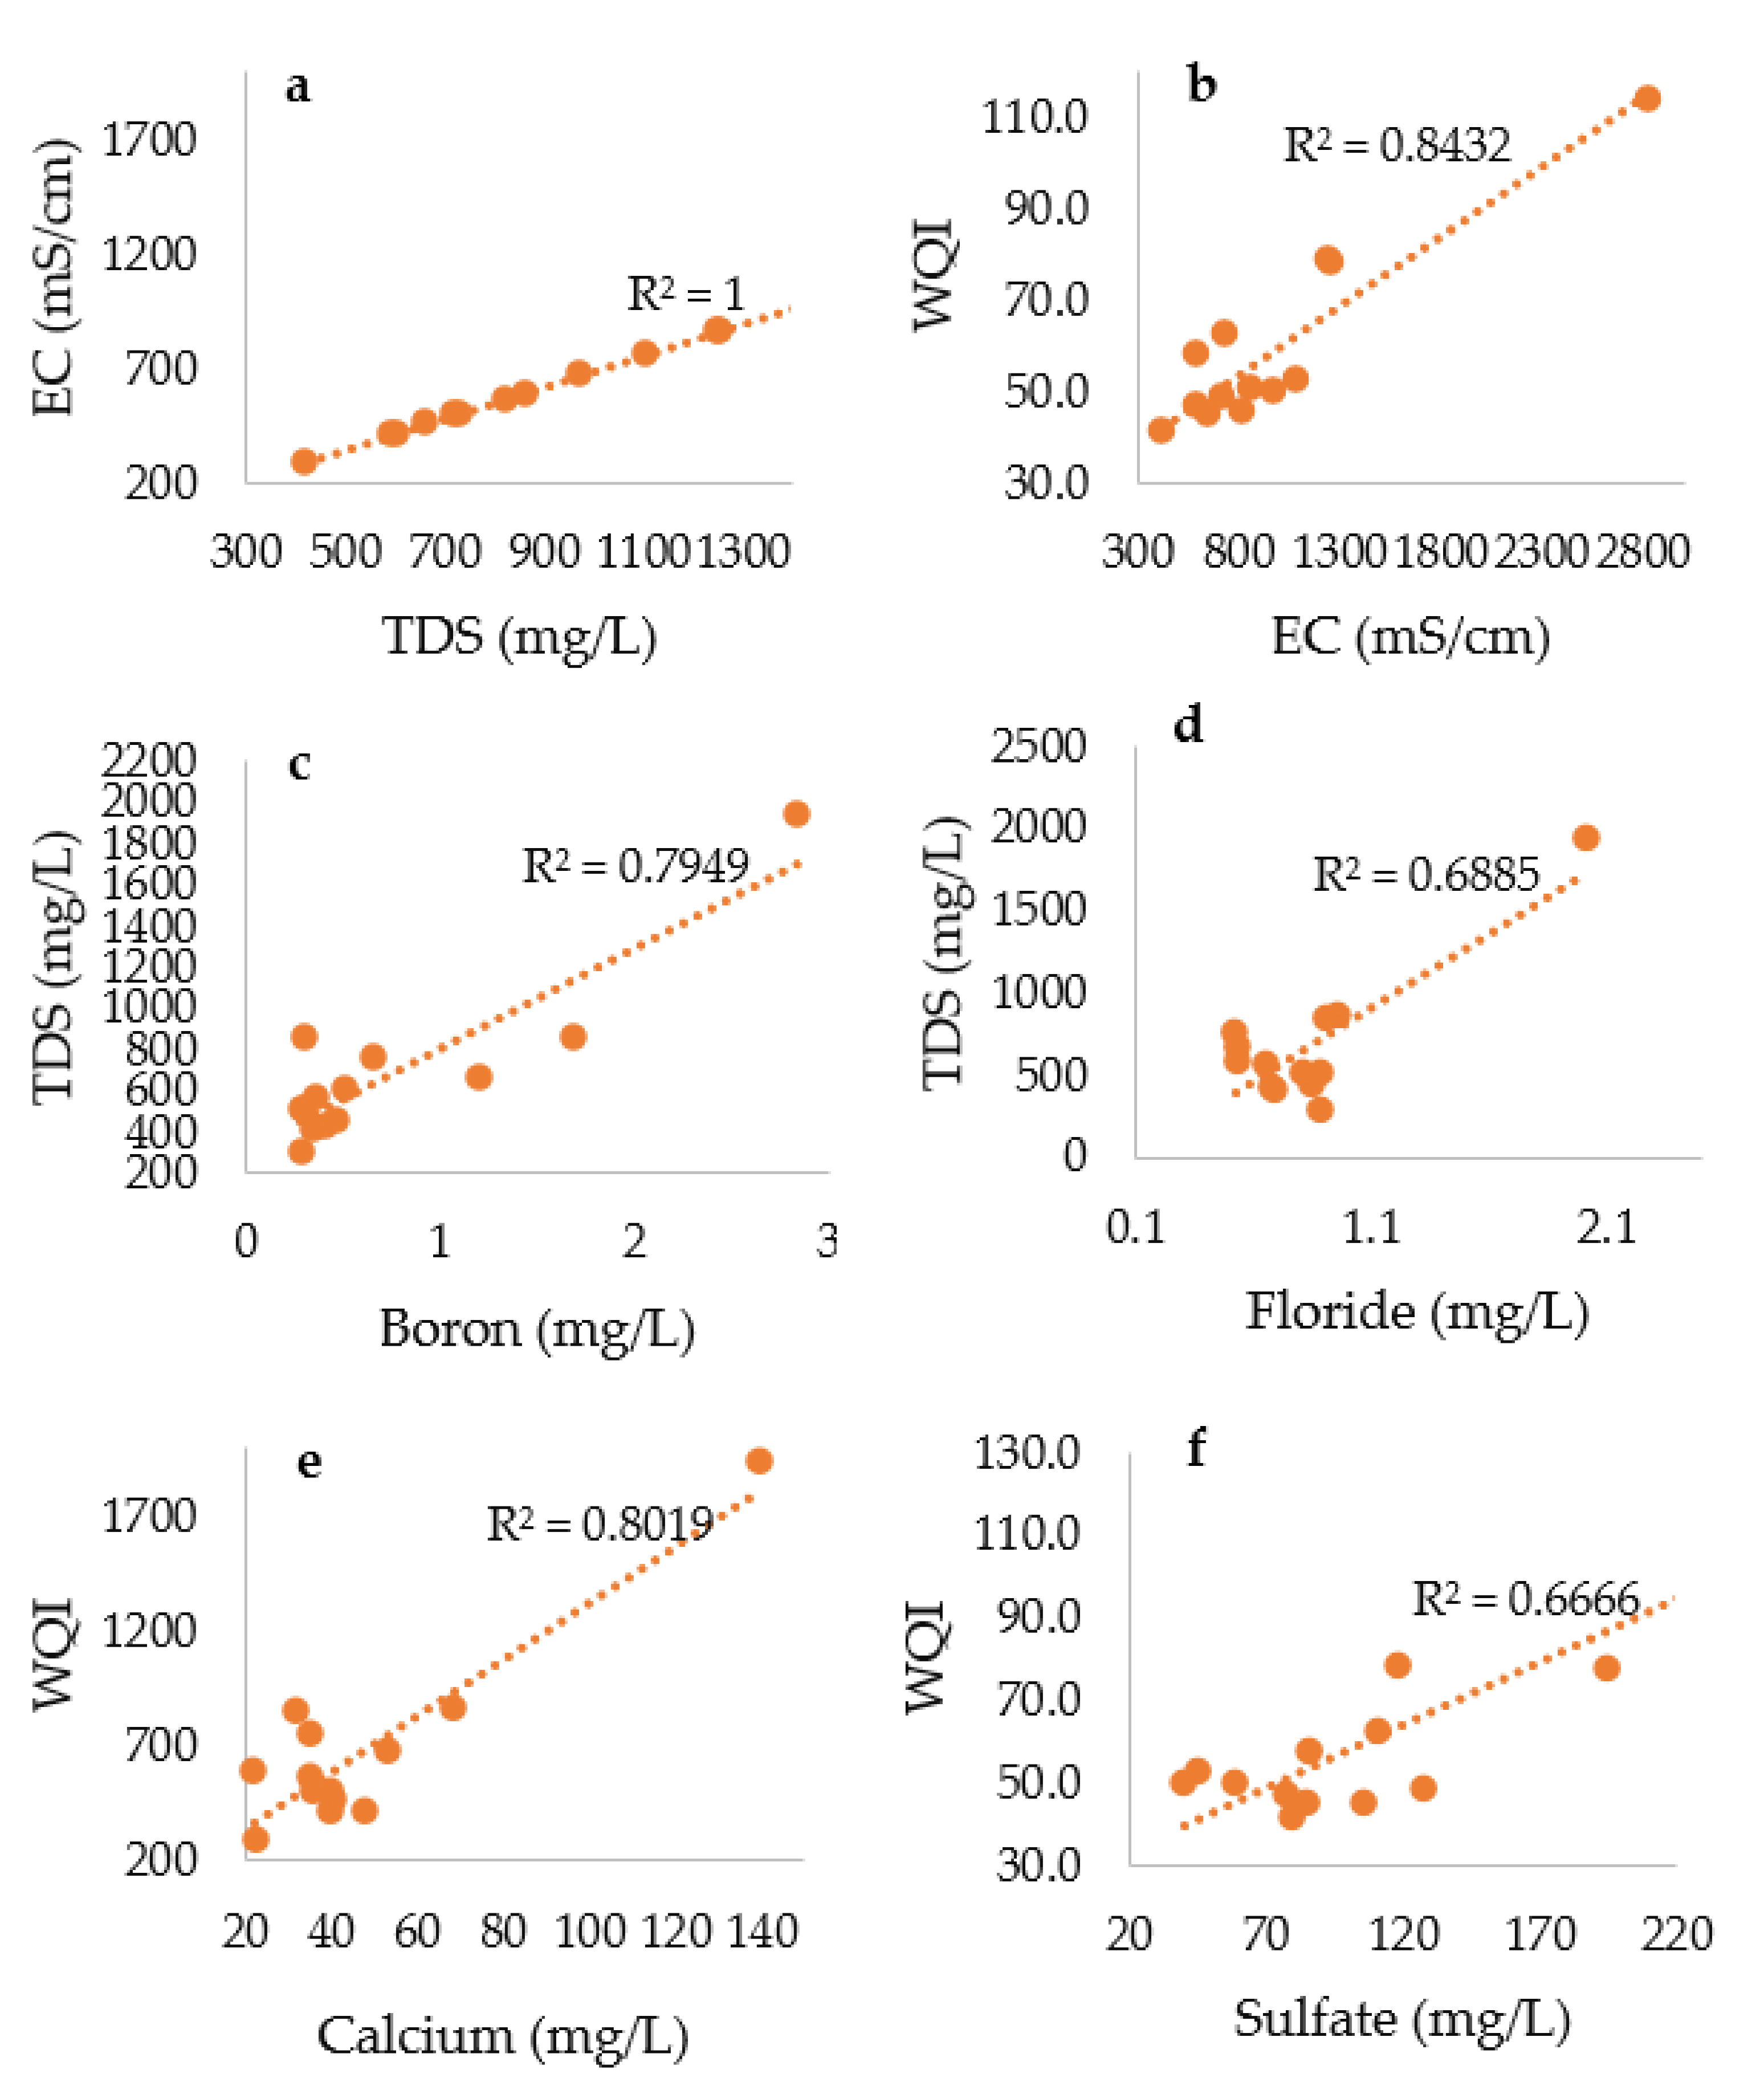
Statistical dependency between two variables can be evaluated using the correlation coefficient, also known at coefficient of determination (R2). The simple correlation coefficient widely used between these variables is shown as the sufficiency of the first one for prediction of the second variable. In addition, this factor can be used for determining the relation between two variables if the dependent (x) is influenced only through the independent (y) variable and may range between −1 to +1. Two variables are perfectly correlated if the correlation coefficient value is +1 or −1 as the sign illustrates if the relationship of variables is positive or negative. A correlation coefficient is zero when the variables are not related [4,36]. According to [36], the coefficient (r) is calculated using the following formula:
here in Equation (7), r is the correlation coefficient, X and Y are the variables, and n is the number of water parameters. The coefficient of determination (R2) between 15 measured parameters was calculated using Microsoft Excel and the results for several are presented as scatter plots (Figure 6).
3.4. Water Quality Index (WQI)
A WQI gives information about the quality of water numerically for any proposed use. The WQI defines a rating that reflects a composition of influences from several water quality parameters, which are a concern due to determination of groundwater suitability for drinking. Assessment of WQI is ab effective method to evaluate water quality and may be helpful for future groundwater management and policy making. Furthermore, this is a simple way for presenting results with groundwater quality, and appropriateness depends upon the groundwater parameters selection technique [29,37].
The calculated WQI, water type, and the percentage of different types of water in the Kabul Basin are shown in Table 9. According to the data, the WQI in the study area is different and ranges from 40 to 110. Using this index, no excellent quality (0–25) groundwater occurs in the Kabul Basin, while only 40% of the sampled water was in a good quality condition. More than 50% of samples suggest poor-to-very-poor groundwater quality (Table 10). More than 6% of Kabul groundwater is entirely unsuitable for drinking. Samples of unsuitable quality were sampled from observation point 411, located in the Damana Kamari village, Bagrami district of the Logar sub-basin. Based on physicochemical analysis of groundwater samples of this area, there is a high amount of dissolved material, and it is determined as about 2820 µS/cm of EC and almost 2000 mg/L of TDS. Furthermore, because of the elevated concentration of several dissolved ions (especially K, Cl, NO3, SO42− and Mn) the WQI value of many wells indicates groundwater with poor or very poor quality (Table 10). Generally, groundwater in the Logar sub-basin near Bagrami and 21th areas is of very poor quality. Pollution is likely related to population growth, improper management of wastewater and waste disposal, and potentially from poor urban planning. In contrast, the second part of the Logar sub-basin 21th of Kabul City and the Pol-e-Charkhi sub-basin have groundwater with good quality using the WQI. Overall, about 60% of the wells sampled fall in the poor, very poor, and unfit classes based on this index.
3.5. Interpretation of Water Quality for Irrigation
According to [26], the suitability of groundwater for irrigation is based on similar criteria and also ensuring that enough water is available of sufficient quality. Hence, the measured water quality was evaluated with respect to its suitability for irrigation. The results show that, from a salinity point of view, the electrical conductivity is not the most serious challenge in the Kabul Basin (see Table 11), though most measurements fall within none and slight-to-moderate ranges of restriction for agricultural purposes. Based on TDS, almost all water samples had slight-to-moderate restrictions for irrigation except for four samples taken from wells at 4, 172, 310, and 311, with no restrictions for irrigation. However, in general the concentrations of calcium, magnesium, sulfate, as specific ion toxicity parameters and acidity suggest little restrictions for irrigation uses. Concentrations of nitrate can be divided into two categories for irrigation. Almost half of the analyzed samples have elevated nitrate and are placed in severe restriction on use, while the second half of the samples show slight-moderate restriction on use in irrigation (Table 11).
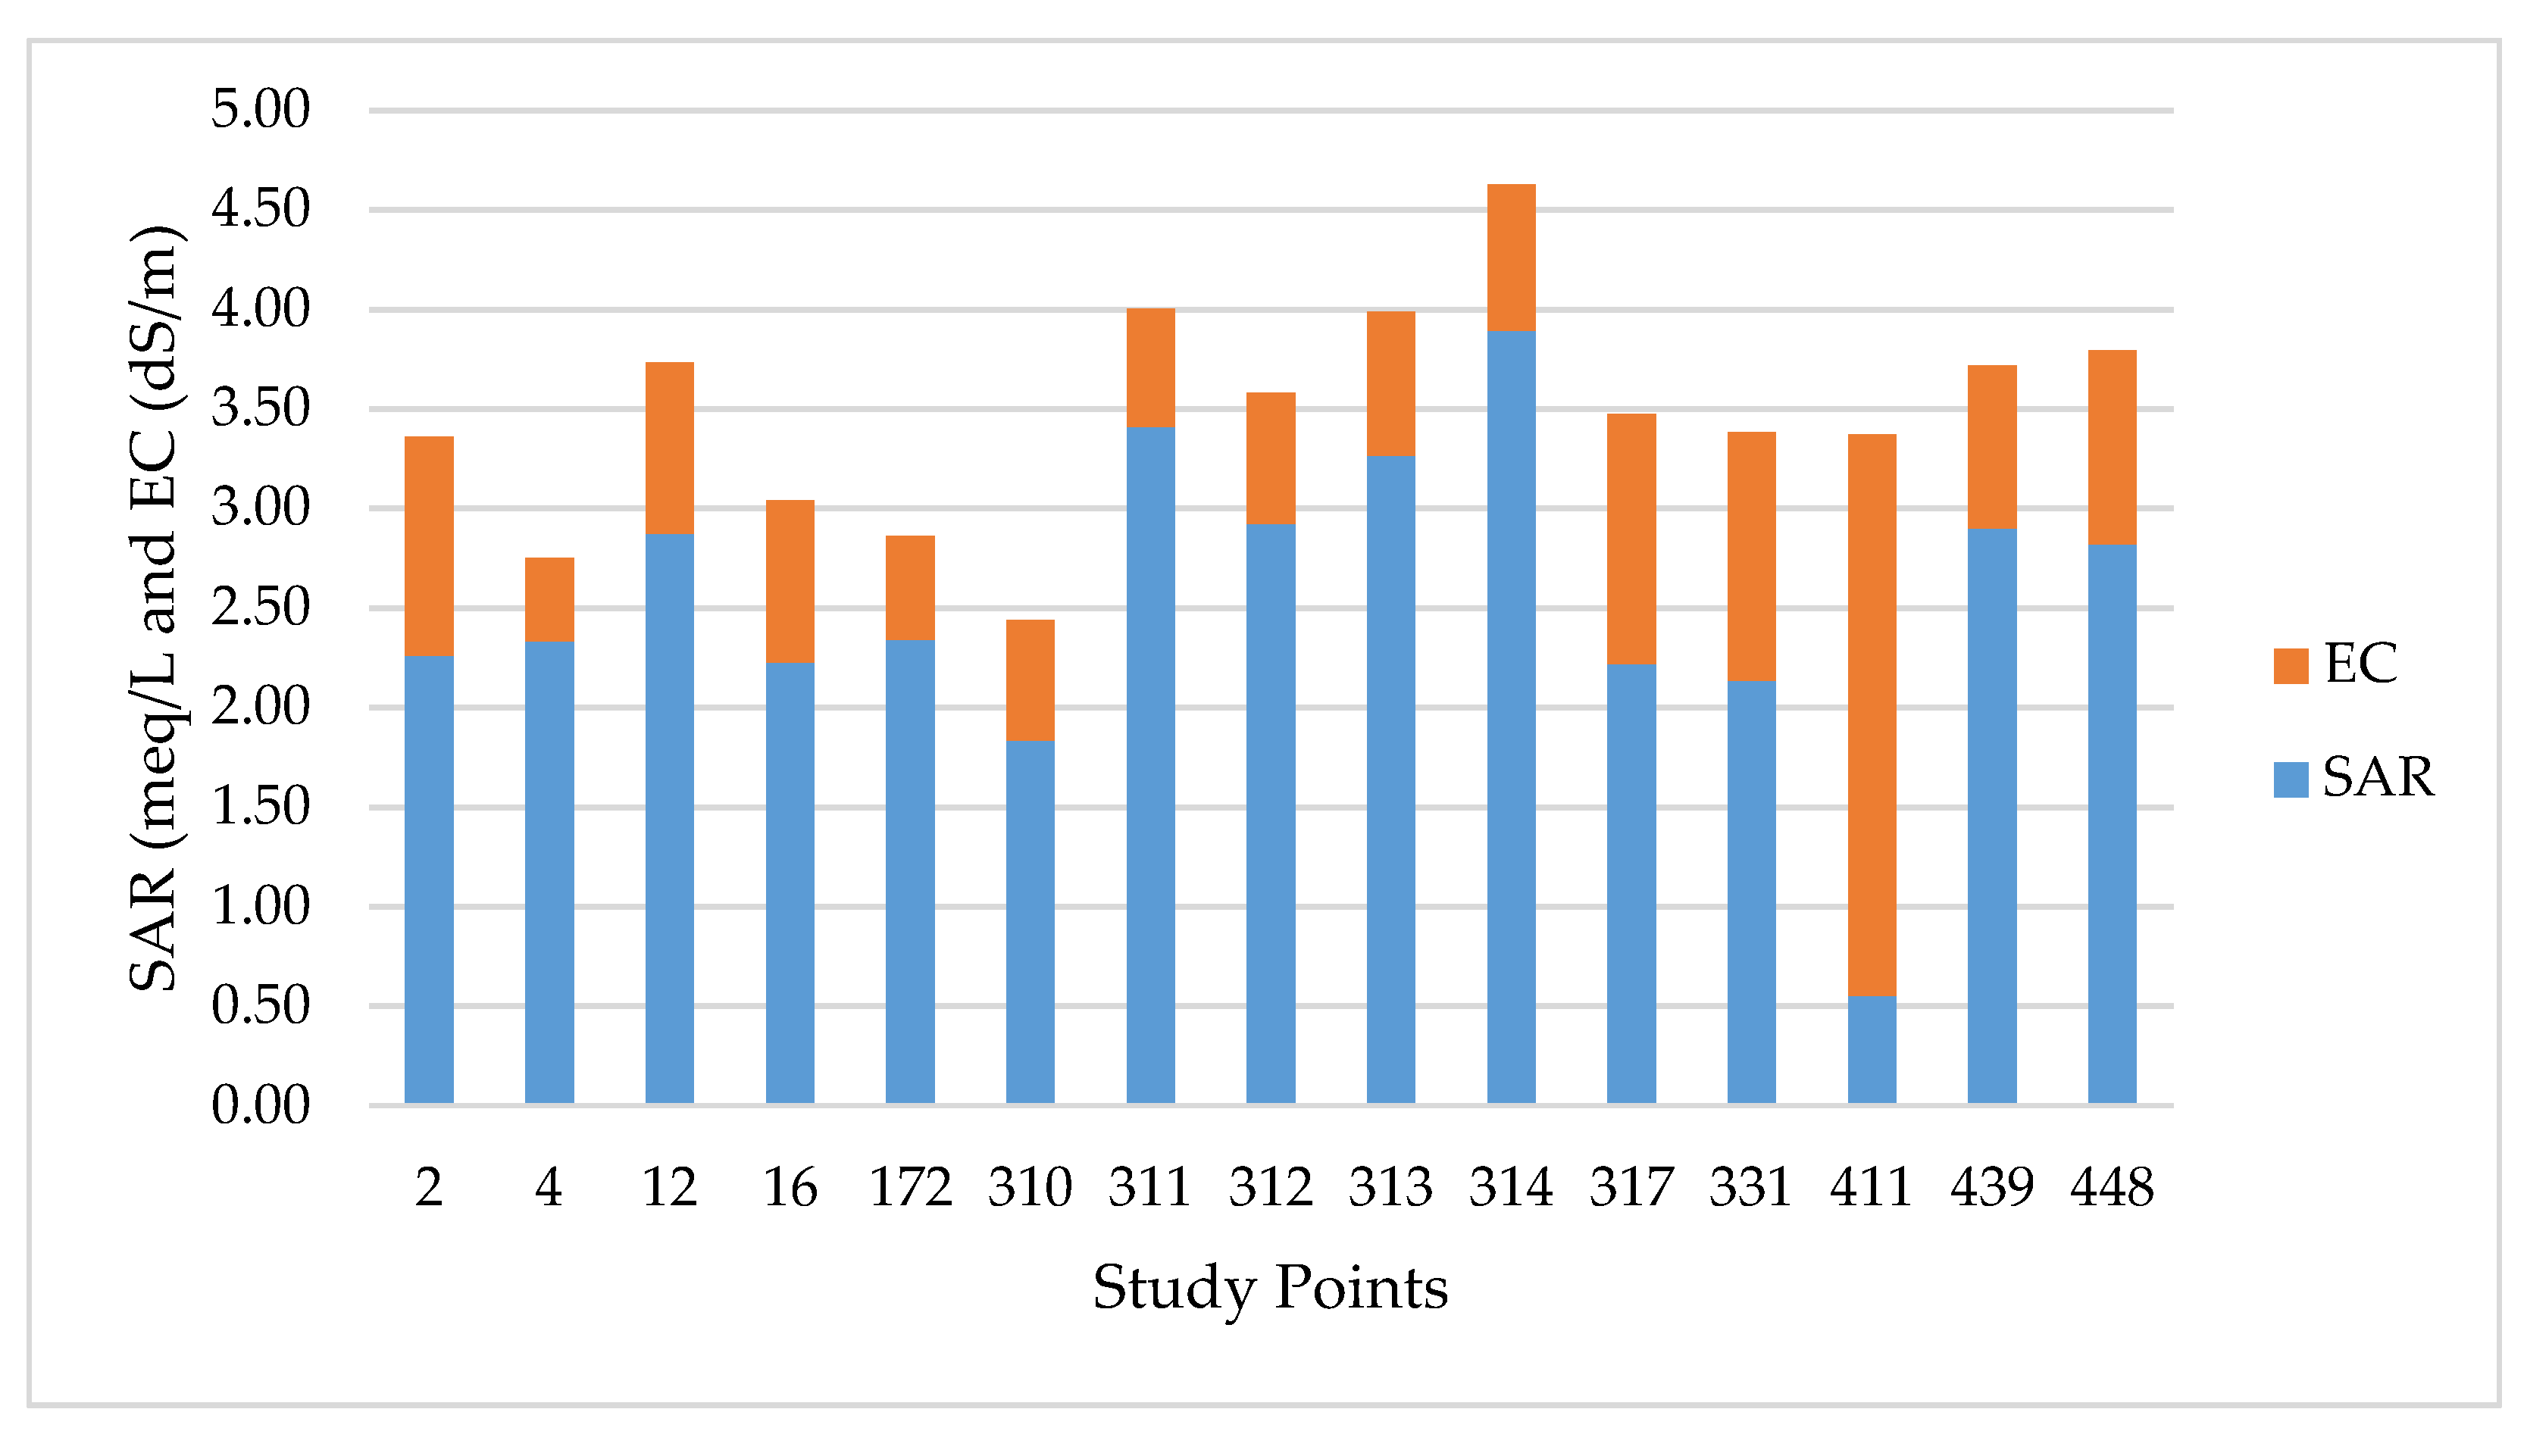
Infiltration issues were determined using SAR and EC, and as shown in Table 5, water for irrigation can be divided into five levels with three degrees of restriction on use. The current study shows that most of the analyzed water samples fall under the no restriction, while just five wells (e.g., 4, 172, 310, 311, 312 observation points) show slight–moderate restriction for use in irrigation (Figure 7).
4. Conclusions
Using available data and results from additional samples, according to the water quality standards several parameters for areas of groundwater in the Kabul Basin fall outside acceptable ranges for drinking and irrigation. Elevated concentrations of calcium, magnesium, chloride, boron, total iron, and nitrate result in water of poor-to-very-poor quality. Elevated TDS are likely the result of either chemical weathering or pollution from surface activities. Many parameters such as nitrate, dissolved solids, and fluoride are high compared to international drinking water standards. The current study shows that the groundwater of the Kabul Basin is generally very hard due to high calcium and magnesium values. Good correlation was found between some parameters. WQI is closely related to electrical conductivity, total dissolved solid, sulfate, calcium, and chloride concentrations. On the other hand, TDS is correlated very well with total hardness and fluoride. The suitability of groundwater using the WQI suggests that no groundwater of “excellent” quality exists and more than 50% of groundwater is of poor-to-very-poor quality. Groundwater in some areas is generally not suitable for drinking and irrigation because of high contamination from dissolved solids and nitrate.
Author Contributions
Formal analysis, H.A.J., J.S., and D.D.S.; investigation, H.A.J. and J.S.; methodology, H.A.J., J.S., and D.D.S.; resources, H.A.J., J.S., and D.D.S.; writing—review and editing, H.A.J., J.S., and D.D.S. All authors have read and agreed to the published version of the manuscript.
Funding
This research was supported by Civil and Environmental Engineering, School of Engineering and Digital Sciences, the Environment & Resource Efficiency Cluster (EREC), Nazarbayev University, U.S. National Academies of Sciences, Engineering, and Medicine (NAS) USAID Partnerships for Enhanced Engagement in Research (PEER) cycle 5 project Grant Award Number AID-OAA-A-11-00012.
Acknowledgments
Authors acknowledge the Danish committee for aid to Afghan refugees (DACAAR) for providing the valuable data and administrative support from the office of Nazarbayev University Research and Innovation System, Kazakhstan, regarding release of funding under the umbrella of NAS USAID PEER cycle 5 project Grant Award Number AID-OAA-A-11-00012. Authors also acknowledge the anonymous reviewers whose valuable suggestions helped us to improve the quality of this paper.
Conflicts of Interest
The authors declare no conflict of interest.
References
- Bruckmann, J.; Clauser, C. Ensemble-Based Stochastic Permeability and Flow Simulation of a Sparsely Sampled Hard-rock Aquifer Supported by High Performance Computing. Hydrogeol. J. 2020. [Google Scholar] [CrossRef]
- Danapour, M.; Hojberg, A.; Jensen, K.; Atisen, S. Assessment of Regional Inter-basin Groundwater Flow Using Both Simlpe and Highly Parametrized Optimization Schemes. Hydrogeol. J. 2019, 27, 1929–1947. [Google Scholar] [CrossRef] [Green Version]
- Maples, S.; Fogg, G.; Maxwell, R. Modelling Managed Aquifer Recharge Processes in a Highly Heterogeneous, Semi-confined Aquifer System. Hydrogeol. J. 2019, 27, 2869–2888. [Google Scholar] [CrossRef] [Green Version]
- Batabyal, A.K.; Chakraborty, S. Hydrogeochemistry and Water Quality Index in the Assessment of Groundwater Quality for Drinking Uses. Water Environ. Res. 2016, 607–617. [Google Scholar] [CrossRef]
- Lafta, J.G. Analysis of Water Quality Using Chemical-Physical-Biological Parameters of the Kinds of Water Used for Drinking in the Baghdad Province Al Adhamiya City. Chem. Mater. Res. 2015, 7, 1–4. [Google Scholar]
- Mehrdad, B.; Thomas, H. Effects of Upscaling Temporal Resolution of Groundwater Flow and Transport of Boundary on the Performance of Nitrate-Transport Models at the Regional Management Scale. Hydrogeol. J. 2020, 28, 1299–1322. [Google Scholar] [CrossRef] [Green Version]
- Beisner, K.; Solder, J.; Tillman, F.; Anderson, J.; Antwwiler, R. Geochemical Characterization of Groundwater Evolution South of Grand Canyon, Arizona (USA). Hydrogeol. J. 2020. [Google Scholar] [CrossRef]
- Apollaro, C.; Fuoco, I.; Brozzo, G.; De Rosa, R. Release and fate of Cr (VI) in the ophiolite aquifers of Italy: The role of Fe (III) as a potential oxidant of Cr (III) supported by reaction path modelling. Sci. Total Environ. 2019, 660, 1459–1471. [Google Scholar] [CrossRef]
- Teresa, C.; Marini, L.; Schott, J.; Mavromatic, V.; Apollaro, C.; Rinder, T.; Rosa, R.D.; Oelkers, E.H. Dissolution rates of actiolite and chlorite from a whole-rock experimental study of metabaslt dissolution from 2 ≤ pH ≥ 12 at 25C. Chem. Geol. 2014, 390, 100–108. [Google Scholar]
- Rao, C.S.; Rao, B.S.; Hariharan, A.V.L.N.S.H.; Bharathi, N.M. Determination of Water Quality Index of Some Areas in Guntur District of Andhra Pradesh. Int. J. Appl. Biol. Pharm. Technol. 2010, 1, 79–86. [Google Scholar]
- Appelo, C.A.J.; Postma, D. Geochemistry, Groundwater and Pollution; CRC Press: Amsterdam, The Netherlands, 2005; ISBN 04-1536-421-3. [Google Scholar]
- Fetter, C.W., Jr. Applied Hydrogeology, 4th ed.; PEARSON Press: London, UK, 2014; ISBN 1-292-02290-6. [Google Scholar]
- Merkel, B.J. Groundwater Geochemistry: A Practical Guide to Modeling of Natural and Contaminated Aquatic System; Darrell, K.N., Ed.; Springer: Berlin/Heidelberg, Germany, 2005; ISBN 3-540-24195-7. [Google Scholar]
- Davidson, G.; Holt, H.; Blainey, J. Geochemical Assessment of the Degree of Isolation of Edge-of-aquifer Groundwater Along a Fringe of the Southern High Plains Aquifer, USA. Hydrogeol. J. 2019, 27, 1817–1825. [Google Scholar] [CrossRef] [Green Version]
- Bäumle, R.; Himmelsbach, T.; Noell, U. Hydrogeology and Geochemistry of a Tectonically Controlled, Deep-Seated and Semi-Fossil Aquifer in the Zambezi Region (Namibia). Hydrogeol. J. 2018, 27, 885–914. [Google Scholar] [CrossRef] [Green Version]
- Frischmann, P. Afghanistan Resource Corridor Development: Water Strategy Final Kabul River Basin Report. World Bank 2012, 1, 49–58. [Google Scholar]
- World Urbanization Prospect (WUP). Kabul Population; UN: New York, NY, USA, 2020. [Google Scholar]
- Safi, M.H. Groundwater Natural Reources and Quality Concerns in Kabul Basin, Afghanistan; DACAAR: Kabul, Afghanistan, 2011. [Google Scholar]
- Thomas, J.M. Conceptual Model of Water Resources in the Kabul Basin, Afghanistan; USGS: Reston, VA, USA, 2010. [Google Scholar]
- Robert, E.; Borshears, M.A. Inventory of Groundwater Resources in the Kabul Basin, Afghanistan; USGS: Reston, VA, USA, 2005. [Google Scholar]
- Zaryab, A.H.; Noori, A.R.; Wegerich, K.K.B. Assessment of Water quality and Quantity Trends in the Kabul Aquifers with an Outline for Future Drinking Water Supplies: Special issue on water management challenges in central Asia and Afghanistan. Cent. Asia J. Water Res. 2017, 3, 3–11. [Google Scholar]
- Thomas, J.M. Groundwater Availability in the Kabul Basin, Afghanistan; ResearchGate: Berlin, Germany, 2018. [Google Scholar]
- ANDWQS. Afghanistan National Drinking Water Quality Standard; Afghan National Standards Authority: Kabul, Afghanistan, 2012. [Google Scholar]
- Department of Agriculture, Environment and Rural Affairs (DAERA). Available online: https://www.daera-ni.gov.uk/ (accessed on 17 October 2016).
- World Health Organization (WHO). Guidelines for Drinking Water Quality; WHO: Geneva, Switzerland, 2011. [Google Scholar]
- Ayers, R.S.; Westcot, D.W. Water Quality for Agriculture; 29 Press: Davis, CA, USA, 1994; ISBN 92-5-102263-1. [Google Scholar]
- Ashwani, K.T.; Prasoon, K.S.; Mukesh, K.M. GIS-Based Evaluation of Water Quality Index of Groundwater Resources in West Bokaro Coalfield, India. Curr. World Environ. 2014, 9, 843–850. [Google Scholar] [CrossRef] [Green Version]
- Jawad Alobaidy, A.H.; Abid, H.S.; Maulood, B.K. Application of Water Quality for Assessment of Dokan Lake Ecosystem, Kurdistan Region, Iraq. Water Resour. Prot. 2010, 792–798. [Google Scholar] [CrossRef] [Green Version]
- Yogendra, K.; Puttaiah, E. Determination of Water Quality Index and Suitability of an Urban Waterbody in Shimoga Town, Karmataka, Sengapta. Dep. PG Stud. Res. Environ. Sci. 2008, 342, 346. [Google Scholar]
- Etim, E.; Odoh, R.; Itodo, A.; Umoh, S.D.; Lawal, U. Water Quality Index for the Assessment of Water Quality from Different Sources in the Niger Delta Region of Nigeria. Front. Sci. 2013, 3, 89–95. [Google Scholar] [CrossRef]
- Patil, P.N.; Sawant, D.V.; Deshmuck, R.N. Physical-chemical Parameters for Testing of Water—A Riview. Int. J. Environ. Sci. 2012, 3, 1196–1207. [Google Scholar]
- Wurts, W.A. Understanding of Water Quality; ResearchGate: Berlin, Germany, 2016. [Google Scholar]
- Manitoba. Drinking Water Turbidity: Turbidity in Manitoba Water Supply; American Journal of Applied Chemistry: Dacca, Bangladesh, 2011. [Google Scholar]
- Gregory, M.H.; Michael, L.M. Turbidity as an Indicator of Water Quality in Diverse Watersheds of the Upper Pecos River Basin. Groundw. Qual. Bur. 2010, 273–284. [Google Scholar] [CrossRef]
- Indian Standard for Drinking Water-Specification. India Water Portal. Available online: http://www.indiawaterportal.org/articles/indian-standard-drinking-water-bis-specifications-10500 (accessed on 12 May 2012).
- Asuero, A.; Sayago, A.; Gonzlez, A. The Correlation Coefficients: An Overview. Crit. Rev. Anal. Chem. 2006, 36, 41–59. [Google Scholar] [CrossRef]
- Ahmad, I.K.; Salih, N.M.; Nzar, Y.H. Determination of Water Quality Index (WQI) for Qalyasan Stream in Sulaimani City/Kurdestan Region of Iraq. Int. J. Plant Anim. Environ. Sci. 2012, 2, 148–157. [Google Scholar]
Figure 1.
Kabul Basin and the observation points.

Figure 2.
Geological setting of study area. This map is created based on the geological map of the whole of Afghanistan, which was prepared by the US Geological Survey (USGS).
Figure 2.
Geological setting of study area. This map is created based on the geological map of the whole of Afghanistan, which was prepared by the US Geological Survey (USGS).

Figure 3.
A comparison of total dissolved solids, total hardness, pH, and turbidity values in all studied points. Note: The TDS and TH unites are mg/L, turbidity is measured in NTU and pH is dimensionless.
Figure 3.
A comparison of total dissolved solids, total hardness, pH, and turbidity values in all studied points. Note: The TDS and TH unites are mg/L, turbidity is measured in NTU and pH is dimensionless.

Figure 4.
The Piper diagram of groundwater type in the Kabul Basin.

Figure 5.
The population growth in Kabul from 2008 to 2015, projected by JICA [1].
Figure 5.
The population growth in Kabul from 2008 to 2015, projected by JICA [1].

Figure 6.
Correlation between some studied parameters of water samples: (a) correlation between EC and TDS; (b) between EC and WQI; (c) between TDS and Boron; (d) between TDS and Floride; (e) between WQI and Calcium and (f) correlation between WQI and Sulfate.
Figure 6.
Correlation between some studied parameters of water samples: (a) correlation between EC and TDS; (b) between EC and WQI; (c) between TDS and Boron; (d) between TDS and Floride; (e) between WQI and Calcium and (f) correlation between WQI and Sulfate.

Figure 7.
Infiltration rate issues using SAR and EC.


| System | Age | Lithology | Thickness Range |
|---|---|---|---|
| Quaternary | Recent | Clay, sand, gravel, pebble, and conglomerate | 600 m in total |
| Upper Tertiary | Neogene | Gray conglomerate, grit, limestone, marl | |
| Crystalline rocks | / | gneisses, granitic-gneisses, amphibolite, mica, shiest, quartzite, and marbles |
Table 2.
Methods utilized in laboratory analysis of water samples.
| Measurement | Device/Method | HACH Method | Reference Method |
|---|---|---|---|
| pH | Electrode | 8156 | EPA 150.1, 150.2; SM 4500-H + B |
| EC | Electrode | 8160 | SM 2510 B |
| TDS | Electrode | 8277 | SM 2540 C |
| Total hardness | Digital Titration | 8213 | SM 2340 B or C |
| Turbidity | Nephelometric | 8195 | EPA 180.1 |
| Sulfate | Turbidimetry | 8051 | ASTM D516-90,02 |
| Calcium | Titration | 8222 | SM 3500-Ca B or D |
| Magnesium | Colorimetry, Calmagite | 8030 | EPA 130.1 |
| Sodium | Electrode | 8322 | ASTM D2791-07 |
| Chloride | Digital Titration | 8207 | SM 4500-Cl B |
| Fluoride | Colorimetry, SPADNS, TNTplus | TNT878 | SM 4500-F B/D |
| Boron | Colorimetry, Carmine | 8015 | SM 4500-B |
| Total Iron | Colorimetry, 1,10-Phenanthroline | 8008 | 40 CFR 136 |
| Phosphate, Ortho | Colorimetry, Molybdate | 8048 | EPA 365.1/365.2 |
| Nitrate | Colorimetry, Dimethyl phenol | TNT 835 (10206) | 40CFR 141/136 |
Table 3.
Calculation of relative weights of physicochemical parameters based on [23].
Table 3.
Calculation of relative weights of physicochemical parameters based on [23].
| Parameters | Afghan/WHO Standard | Relative Weight ( | |
|---|---|---|---|
| (…) | (mg/L) | (…) | (mg/L) |
| pH | 6.5–8.5 | 4 | 0.108 |
| TDS | 1000 | 4 | 0.108 |
| TH | 500 | 3 | 0.054 |
| Turbidity | 5NTU | 3 | 0.081 |
| Sulfate | 250 | 5 | 0.108 |
| Calcium | 75 | 2 | 0.054 |
| Sodium | 200 | 4 | 0.108 |
| Magnesium | 30 | 2 | 0.054 |
| Chloride | 250 | 3 | 0.081 |
| Fluoride | 1.5 | 4 | 0.108 |
| Boron | 2.4 | 3 | 0.081 |
| Total Iron | 0.3 | 4 | 0.108 |
| Nitrate | 50 | 2 | 0.054 |
| Total | 39 | 1.000 | |
| WQI | Ranges | Water Type |
| 0–25 | Excellent Water | |
| 26–50 | Good Water | |
| 51–75 | Poor Water | |
| 76–100 | Very Poor Water | |
| >100 | Unsuitable for drinking |
Table 5.
Degree of restriction on use based on evaluation of SAR and EC [26].
Table 5.
Degree of restriction on use based on evaluation of SAR and EC [26].
| Infiltration Rate of Water into the Soil, Evaluation Using SAR and EC Together | Degree of Restriction on Use | ||||
|---|---|---|---|---|---|
| None | Slight–Moderate | Severe | |||
| SAR = | 0–3 | EC = | >0.7 | 0.7–0.2 | <0.2 |
| 3.0–6.0 | >1.2 | 1.2–0.3 | <0.3 | ||
| 6.0–12 | >1.9 | 1.9–0.5 | <0.5 | ||
| 12.0–20 | >2.9 | 2.9–1.3 | <1.3 | ||
| 20–40 | >5.0 | 5–2.9 | <2.9 | ||
Table 6.
Total hardness of sampled water, the percentage, and groundwater type based on hardness value.
Table 6.
Total hardness of sampled water, the percentage, and groundwater type based on hardness value.
| Point Name | Hardness of Water Samples | Hardness Rate | Percentage | |
|---|---|---|---|---|
| Very Hard | Hard | |||
| (mg/L) | … | % | % | |
| 2 | 376 | Very Hard | 86.7 | 13.3 |
| 4 | 152 | Hard | ||
| 12 | 302 | Very Hard | ||
| 16 | 259 | Very Hard | ||
| 172 | 160 | Hard | ||
| 310 | 252 | Very Hard | ||
| 311 | 223 | Very Hard | ||
| 312 | 242 | Very Hard | ||
| 313 | 261 | Very Hard | ||
| 314 | 234 | Very Hard | ||
| 317 | 461 | Very Hard | ||
| 331 | 492 | Very Hard | ||
| 411 | 679 | Very Hard | ||
| 439 | 216 | Very Hard | ||
| 448 | 338 | Very Hard | ||
Note: Hardness classification is divided into four ranges: (1) less than 60 mg/L is considered soft, (2) medium-hardness falls between 60 and 120, (3) hard water ranges from 120 to 180 and (4) very hard water is greater than 180 mg/L CaCO3.
Table 7.
The physicochemical parameters values in all observation points.
| Observation Points | pH | EC | T | TDS | Total Hardness (as CaCO3) | Turbidity (NTU) | Sulphates | Calcium | Magnesium | Sodium | Chloride | Fluoride | Boron | Total Iron | Phosphate | Nitrate |
|---|---|---|---|---|---|---|---|---|---|---|---|---|---|---|---|---|
| (…) | (µS/cm) | (°C) | (mg/L) | |||||||||||||
| 2 | 7.59 | 1100 | 17.5 | 757 | 430 | 0.48 | 46 | 35 | 70 | 104 | 100 | 0.52 | 0.67 | 0.05 | 0.27 | 58.40 |
| 4 | 8.01 | 420 | 14.8 | 289 | 190 | 4.41 | 80 | 23 | 23 | 81 | 33 | 0.8l9 | 0.28 | 0.04 | 0.05 | 25.00 |
| 12 | 8.44 | 863 | 19.3 | 594 | 380 | 2.23 | 60 | 22 | 60 | 140 | 57 | 0.53 | 0.51 | 0.07 | 0.13 | 11.16 |
| 16 | 7.7 | 815 | 19.4 | 561 | 390 | 0.35 | 64 | 36 | 41 | 87 | 58 | 0.57 | 0.41 | 0.07 | 0.17 | 40.80 |
| 172 | 7.97 | 523 | 16.4 | 360 | 270 | 24.44 | 18 | 36 | 17 | 78 | 25 | 0.83 | 0.35 | 0.05 | 0.13 | 21.40 |
| 310 | 7.77 | 606 | 19.8 | 417 | 300 | 12.95 | 87 | 48 | 32 | 59 | 29 | 0.68 | 0.4 | 0.05 | 0.09 | 15.30 |
| 311 | 7.75 | 593 | 21.2 | 408 | 290 | 6.85 | 78 | 40 | 30 | 149 | 25 | 0.69 | 0.36 | 0.05 | 0.08 | 20.40 |
| 312 | 7.77 | 657 | 18.3 | 452 | 460 | 2.00 | 106 | 41 | 34 | 121 | 22 | 0.85 | 0.47 | 0.06 | 0.11 | 20.06 |
| 313 | 7.87 | 723 | 16.7 | 497 | 290 | 1.17 | 128 | 40 | 39 | 157 | 32 | 0.89 | 0.28 | 0.06 | 0.02 | 54.00 |
| 314 | 7.72 | 735 | 17.1 | 506 | 350 | 9.15 | 112 | 36 | 35 | 197 | 88 | 0.82 | 0.31 | 0.09 | 0.05 | 60.20 |
| 317 | 8.4 | 1256 | 19.2 | 864 | 390 | 3.92 | 195 | 69 | 70 | 97 | 155 | 0.96 | 0.3 | 0.05 | 0.12 | 63.00 |
| 331 | 8.39 | 1249 | 19.5 | 859 | 420 | 3.05 | 120 | 32 | 100 | 103 | 105 | 0.92 | 1.7 | 0.07 | 0.15 | 55.00 |
| 411 | 8.04 | 2820 | 15.8 | 1940 | 700 | 5.00 | 224 | 140 | 80 | 19 | 145 | 2.02 | 2.84 | 0.09 | 0.58 | 29.52 |
| 439 | 7.78 | 820 | 17.8 | 564 | 390 | 2.41 | 85 | 35.2 | 31 | 120 | 31 | 0.66 | 0.37 | 0.07 | 0.09 | 40.18 |
| 448 | 7.99 | 974 | 15.7 | 670 | 520 | 1.90 | 40 | 53 | 50 | 131 | 82 | 0.54 | 1.21 | 0.02 | 0.19 | 12.18 |
| Parameters | Standards | Current Samples | ||||
|---|---|---|---|---|---|---|
| Afghan | WHO | Indian | Max | Min | Percent above WHO Standard | |
| pH | 6.5–8.5 | 6.5–8.5 | 6.5–8.5 | 8.44 | 7.59 | 0 |
| TDS | 1000 | 259–500 | 500–2000 | 1940 | 289 | 61.5 |
| TH | 500 | 200 | 300–600 | 679 | 152 | 15 |
| Turbidity | 5NTU | 5–25 | 10–25 | 24.44 | 0.35 | 30.7 |
| Sulfate | 250 | 200–400 | 200–400 | 224 | 18 | 0 |
| Calcium | 75 | 75–200 | 75–200 | 140 | 22 | 7.7 |
| Magnesium | 30 | 30–150 | 30–100 | 100 | 17 | 92.3 |
| Sodium | 200 | 200 | 200 | 197 | 19 | 0 |
| Chloride | 250–1000 | 200–600 | 250–1000 | 155 | 22 | 0 |
| Fluoride | <1.5 | / | 1–1.5 | 2.02 | 0.52 | 0 |
| Boron | 2.4 | 2.4 | 2.84 | 0.28 | 7.6 | |
| Total Iron | 0.3 | 0.1–1.0 | 0.3–1.0 | 0.09 | 0.02 | 0 |
| Nitrate | 50 | 50 | 45 | 63 | 11.16 | 39 |
Table 9.
The correlation coefficient ranges and interpretation.
| R2 | Interpretation |
|---|---|
| 1–0.9 | Very high correlation |
| 0.89–0.70 | High correlation |
| 0.69–0.50 | Moderate correlation |
| 0.49–0.30 | Low correlation |
| 0.29–0.00 | Little if any correlation |
Table 10.
Types of water and percentage of water condition in study area.
| Observation Points | WQI | Water Type | Percentage | ||||
|---|---|---|---|---|---|---|---|
| Excellent | Good | Poor | Very Poor | U.F. Drinking | |||
| 2 | 52.36 | Poor water | 0% | 40% | 40% | 13.33% | 6.66% |
| 4 | 41.40 | Good water | |||||
| 12 | 50.59 | Poor water | |||||
| 16 | 42.91 | Good water | |||||
| 172 | 71.89 | Poor water | |||||
| 310 | 57.88 | Poor water | |||||
| 311 | 46.68 | Good water | |||||
| 312 | 45.03 | Good water | |||||
| 313 | 48.47 | Good water | |||||
| 314 | 62.53 | Poor water | |||||
| 317 | 77.52 | Very Poor water | |||||
| 331 | 78.47 | Very Poor water | |||||
| 411 | 113.51 | Unsuitable for drinking | |||||
| 439 | 45.47 | Good water | |||||
| 448 | 50.27 | Poor water | |||||
Table 11.
Comparison of measured parameters with the usual range of them in irrigation water used from [6,26].
| Parameters | Unit | Degree of Restriction on Use | Study Points | |||||||||||||||||
|---|---|---|---|---|---|---|---|---|---|---|---|---|---|---|---|---|---|---|---|---|
| None | Slight–Moderate | Severe | 2 | 4 | 12 | 16 | 172 | 310 | 311 | 312 | 313 | 314 | 317 | 331 | 411 | 439 | 448 | |||
| EC | dS/m | <0.7 | 0.7-3 | >3 | 1.1 | 0.42 | 0.86 | 0.81 | 0.52 | 0.6 | 0.59 | 0.65 | 0.72 | 0.73 | 1.25 | 1.24 | 2.82 | 0.82 | 0.97 | |
| TDS | mg/L | <450 | 450–2000 | >2000 | 757 | 289 | 594 | 561 | 360 | 417 | 408 | 452 | 497 | 506 | 864 | 859 | 1940 | 564 | 670 | |
| Ca2+ | meq/L | 0–20 | 1.75 | 1.15 | 1.10 | 1.80 | 1.80 | 2.40 | 2.00 | 2.05 | 2.00 | 1.80 | 3.45 | 1.60 | 7.00 | 1.76 | 2.65 | |||
| Mg2+ | meq/L | 0–5 | 3.5 | 1.1 | 3.0 | 2.0 | 0.8 | 1.6 | 1.5 | 1.7 | 1.9 | 1.7 | 3.5 | 5.0 | 4.0 | 1.5 | 2.5 | |||
| Na+ | meq/L | <3 | 3–9 | >9 | 4.5 | 3.5 | 6.1 | 3.8 | 3.4 | 2.6 | 6.5 | 5.3 | 6.8 | 8.6 | 4.2 | 4.5 | 0.8 | 5.2 | 5.7 | |
| CO3−2 | meq/L | 0–0.1 | 0.67 | 0.33 | 1.33 | 0.67 | 0.67 | 0.33 | 1.00 | 0.67 | 1.00 | 0.67 | 0.33 | 0.00 | 1.00 | 0.67 | 1.33 | |||
| HCO3− | meq/L | <1.5 | 1.5–8.5 | >8.5 | 6.56 | 3.20 | 7.70 | 4.59 | 4.43 | 4.34 | 7.21 | 6.23 | 6.39 | 6.64 | 2.79 | 7.21 | 4.02 | 5.41 | 7.70 | |
| Cl− | meq/L | <4 | 4.0–10 | >10 | 2.82 | 0.93 | 1.61 | 1.64 | 0.71 | 0.82 | 0.71 | 0.62 | 0.90 | 2.48 | 4.37 | 2.96 | 4.09 | 0.87 | 2.31 | |
| SO42− | meq/L | 0.2 | 0.96 | 1.67 | 1.25 | 1.33 | 0.38 | 1.81 | 1.63 | 2.21 | 2.67 | 2.33 | 4.06 | 2.50 | 4.67 | 1.77 | 0.83 | |||
| NO3− N | mg/L | <5 | 5.0–30 | >30 | 58.4 | 25 | 11.2 | 40.8 | 21.4 | 15.3 | 20.4 | 20.1 | 54 | 60.2 | 63 | 55 | 29.5 | 40.2 | 12.2 | |
| PO4-P | mg/L | 0–2 | 0.27 | 0.05 | 0.13 | 0.17 | 0.13 | 0.09 | 0.08 | 0.11 | 0.02 | 0.05 | 0.12 | 0.15 | 0.58 | 0.09 | 0.19 | |||
| B | mg/L | <0.7 | 0.7–3 | >3.0 | 0.67 | 0.28 | 0.51 | 0.41 | 0.35 | 0.4 | 0.36 | 0.47 | 0.28 | 0.31 | 0.3 | 1.7 | 2.84 | 0.37 | 1.21 | |
| pH | 6.5–8.4 | 7.59 | 8.01 | 8.44 | 7.7 | 7.97 | 7.77 | 7.75 | 7.77 | 7.87 | 7.72 | 8.4 | 8.39 | 8.04 | 7.78 | 7.99 | ||||
| Legend | Non-Classified | No Restriction on Use | Slight–Moderate Restriction on Use | Severe Restriction on Use | ||||||||||||||||
Publisher’s Note: MDPI stays neutral with regard to jurisdictional claims in published maps and institutional affiliations. |
© 2020 by the authors. Licensee MDPI, Basel, Switzerland. This article is an open access article distributed under the terms and conditions of the Creative Commons Attribution (CC BY) license (http://creativecommons.org/licenses/by/4.0/).
Share and Cite
MDPI and ACS Style
Jawadi, H.A.; Sagin, J.; Snow, D.D. A Detailed Assessment of Groundwater Quality in the Kabul Basin, Afghanistan, and Suitability for Future Development. Water 2020, 12, 2890. https://doi.org/10.3390/w12102890
AMA Style
Jawadi HA, Sagin J, Snow DD. A Detailed Assessment of Groundwater Quality in the Kabul Basin, Afghanistan, and Suitability for Future Development. Water. 2020; 12(10):2890. https://doi.org/10.3390/w12102890
Chicago/Turabian StyleJawadi, Hussain Ali, Jay Sagin, and Daniel D. Snow. 2020. "A Detailed Assessment of Groundwater Quality in the Kabul Basin, Afghanistan, and Suitability for Future Development" Water 12, no. 10: 2890. https://doi.org/10.3390/w12102890
Note that from the first issue of 2016, this journal uses article numbers instead of page numbers. See further details here.