Impact of Climate Change on the Frequency of Dynamic Breakup Events and on the Risk of Ice-Jam Floods in Quebec, Canada

Department of Civil and Water Engineering, Université Laval, Quebec City, QC G1V 0A6, Canada
*
Author to whom correspondence should be addressed.
Water 2020, 12(10), 2891; https://doi.org/10.3390/w12102891
Submission received: 20 August 2020
/
Revised: 1 October 2020
/
Accepted: 13 October 2020
/
Published: 16 October 2020
(This article belongs to the Special Issue Hydrology of Rivers and Lakes under Climate Change)
Abstract
:In cold regions, every year, river-ice jams generate sudden, surprising, intense flooding that challenges the capacity of public security services. This type of flood is commonly unpredictable and often appears chaotic because its occurrence depends on multiple, interacting weather, hydrological, ice and morphological parameters. This paper presents the findings of a research project assessing how climate change impacts dynamic river-ice breakup and associated floods along seven rivers of the province of Quebec, Canada. A combination of empirical river-ice breakup models, state-of-the-art hydrological simulations and standardized climate projections was used to estimate the historical (1972–2000) and future (2042–2070) frequencies of dynamic breakup events. Ice jam flood damage reimbursement data were used to predict changes to financial risk associated with dynamic breakup events. Results show that, overall, ice-jam floods will generate more damage in the future, which justifies watershed-based flood adaptation plans that take into account cold regions hydrological processes. The success of the methodology also sets the table for a comparable project that would include more rivers from different regions of Northeastern America.
1. Introduction
Each winter and spring, river ice jams generate flooding and cause significant damage in Canada and in other cold countries of the world [1]. These ice jams are mostly associated with dynamic river-ice breakup events, characterized by the rupture and mobilization of a resistant ice cover by a rapidly rising discharge (this is opposed to thermal river ice breakup scenarios that occur when the ice cover degrades and melts in place for several days to weeks before its disintegration) [2]. The occurrence of a dynamic breakup event in a specific watershed, and the intensity of resulting ice jams, forming when a section of mobilized ice cover (the ice run) encounters a downstream obstacle (e.g., a thick ice cover or ice accumulation, bridge piers), a congestion point (e.g., an island or a narrow), or an energy dissipation location (e.g., a channel widening or a slope attenuation) [3], depend on multiple hydrometeorological parameters, e.g., [4]. Simply stated, the combination of a competent ice cover subject to a significant increase in runoff (caused by high snowmelt rates or an intense rain event) is the normal scenario leading to an ice jam flood.
Ice jam floods tend to occur very fast compared with open water floods, with water levels rising by more than a meter in less than an hour, e.g., [5] and with water levels reaching elevations that are several meters above the open water rating curve, e.g., [2]. Moreover, resulting high water levels can persist for several days, and if the ice jam is the result of a mid-winter breakup event (i.e., usually a rain on snow event), the flooded area can freeze after the return of cold weather, which significantly complicates post-event recovery. As a result, there is a significant interest in being able to predict ice jams. This need has led to the development of several river ice models, e.g., [6,7], some of which could be used to design (and to confirm the financial benefit of [8]) flood control measures [9,10].
If ice jams and their impacts can be predicted with some degree of accuracy in the short term, public safety services, hydropower agencies, insurance companies and transportation infrastructure managers may also wonder about long term projections. More specifically, stakeholders could have an interest in being informed about the impact of a changing climate on the frequency and severity of ice jam floods, and therefore on their future activities and investments. The media covering ice jam flood events often ask what role did climate change play. River ice experts consider this to be a good question, in part because there is not much literature on the topic, e.g., [4,11,12].
In the province of Quebec, Canada, where ice jam floods are common [1], observations made by the authors since 2010 in watersheds located both on the north and south side of the St. Lawrence River suggest that winter and spring meteorological conditions are becoming more unstable, both in terms of amplitude and frequency. Recent weather is conducive to more frequent (1) mid-winter, partial breakup events [13] (some mid-winter ice jams remain in place until spring breakup) followed by significant frazil ice production (e.g., January 2010 and 2018, February 2013, December 2018) and (2) spring breakup ice jams (severe March 2012 air temperatures anomaly, important rainfall in April 2014, 2016, and 2019). It seems that the combination of altered river-ice breakup driving or resisting factors and winters that would, overall, remain cold enough to generate an ice cover on rivers located north of Montreal, Quebec, would produce more frequent ice-jam floods and generate more damage in the future. This hypothesis is based on observations, judgement and the literature [11,12], and it led to the study reported here.
The objective of this paper to quantify the impact of climate change on ice jam floods in Quebec. Since provincial stakeholders and authorities have an interest in comparing the frequency and financial risk of historical and future dynamic river-ice breakup events along rivers that are prone to severe ice jams, they requested and supported this research.
2. Background
It may be perceived that global warming will eventually prevent river-ice formation and therefore progressively eliminate the risk associated with ice jams on an increasing number of northern rivers. However, in addition to higher rising average winter air temperatures, climate change also alters precipitation patterns and, more generally, increases weather variability [14]. It was anticipated by river ice experts that ice conditions would not simply become more benign as cold regions warm up, e.g., [15]. An increase (or a decrease) in the occurrence of ice-jam floods would, in part, depend on whether hydrometeorological fluctuations driving breakup can dominate (or not) over ice-weakening caused by an average rise in winter air temperatures.
Trends and projections of different meteorological and river-ice parameters that affect the occurrence of ice-jam floods in Canada have been reviewed [4,12]. It seems that rising winter and spring temperature trends (1948–2016) are weaker in some areas of Eastern Canada compared with the national average [11], and a similar interpretation can be made about the evolution (1948–2012) of average winter and spring precipitation [16]. Beyond the changing duration of the ice season and maximum thickness of ice covers on lakes and rivers, as reported by several authors, e.g., [13,17], the effect of climate change on the frequency and intensity of ice jams still remains largely anecdotal.
Different methodologies can be used to estimate how the changing climate will affect the frequency and intensity of ice-jam floods in Quebec over the 21st century. Three approaches proposed in the literature [4] are likely to provide tangible quantitative results. Interestingly, the simplest approach, which is the statistical analysis of the trend of historical ice-induced maximum water levels, has not yet been widely applied in Canada (two examples for the Athabasca River and for the Yukon River are presented in [4]). This is probably because, at least in part, there are gaps in many historical hydrometric records across Canada [18], especially during high water events. Hopefully, the pioneering work that consists in extracting meaningful information from 196 hydrometric station historical winter records to create the Canadian River Ice Database (CRID) [19] will facilitate the application of this first approach in Quebec, as well as in other parts of Canada.
Another approach proposed in [4] is to compare the breakup regime of two rivers of comparable size and profile, one in the region of interest, and the other in an area where the current climate is representative of the future climate in the area of interest. This approach has apparently not been applied yet, but there are already some insights about its potential: It was suggested that meteorological patterns in southern Quebec would eventually compare to what currently prevails in Pennsylvania and New Jersey [20]. The United States (US) Army Corps of Engineers Ice Jam database [21] reveals that the number of ice jams in the Northeastern US follows a declining trend in recent decades. Observations from the Northeastern US [22] also propose that the short duration and low intensity of cold periods combined with dominant above-freezing temperatures and more frequent rain events are preventing the formation of a complete ice cover at an increasing number of locations and, as a consequence, breakup scenarios are becoming more thermal. However, intense ice jam events are still happening in watersheds located just south of Quebec, especially during the mid-winter period [23,24]. In addition, and although the climate transposition may not be as representative, it was found, using empirical thresholds, that mid-winter and spring breakup ice jams in Midwest US were becoming less frequent, but potentially more intense [25].
A third approach, applied in this paper, involves using different types of river-ice models to simulate historical (for calibration and testing) and future breakup or ice-jam events. This approach depends on the availability of reliable meteorological data, hydrological data, and ice-related data (e.g., water levels) or observations (e.g., confirmed ice-jam events). It was applied on three rivers of Midwest US [25], but only for hindcasting. In recent years, the University of Saskatchewan has produced key papers relying on this approach. The MESH hydrological model [26] and the RIVICE numerical river-ice model [27] were used to simulate water levels associated with future ice jams on the Athabasca River at Fort McMurray, Alberta, Canada [28]. This approached was applied to ensembles of ice-jam water levels to generate the future 100-year return period flood delineation for Fort McMurray [29]. The results suggest that ice-jam floods will become less frequent at Fort McMurray during the period of 2041–2070 compared with a baseline period of 1971–2000. Interestingly, it had been mentioned [30] that extreme events could still happen at that location, which was indeed the case during the spring of 2020.
A wide range of hydrological and river-ice jam (or river-ice breakup) models can be used through this approach. In addition to MESH, other hydrological models may include CHM, e.g., [31]; GEM Hydro, e.g., [32]; Raven, e.g., [33]; or HYDROTEL, e.g., [34]. In terms of river-ice models, new versions of HEC-RAS [35] are now adapted to run a sequence of multiple ice-jam scenarios efficiently (e.g., for ice-jam flood mapping, e.g., [36]). River-ice breakup and river ice jam models have been listed in other publications, e.g., [6,7,29,37]. In terms of historical ice jam data, the ministère de la Sécurité publique (Ministry of Public Security, MSP) of the Quebec Government maintains its own ice-jam database, the Government of Canada is working on developing a federal ice-jam database [38], and, as stated above, ice-jam data can be extracted from the CRID recently released by Environment and Climate Change Canada [19].
Evaluating the risk of a hazard involves combining its probability and consequences. The level of consequence is generally proportional to the hazard intensity. A common approach to quantify the flood risk is to multiply a site-specific or synthetic stage-damage curve, e.g., [39] by a local stage-frequency curve. Even if they occur regularly, generate significant damage, and depend on evolving weather patterns, to the authors’ knowledge, the risk of ice jams floods in a changing climate has not yet been estimated in any area of North America.
3. Methodology
In order to estimate how the frequency of damageable breakup events will evolve in the future on rivers across the Province of Quebec, the methodology adopted in this study involves inputting climate change meteorological data into hydrological models and then feeding the resulting river discharge into empirical breakup timing and intensity models. This section presents the details of the approach, including how the authors evaluated the financial risk of future ice-jam floods.
3.1. Historical Data and Breakup Models
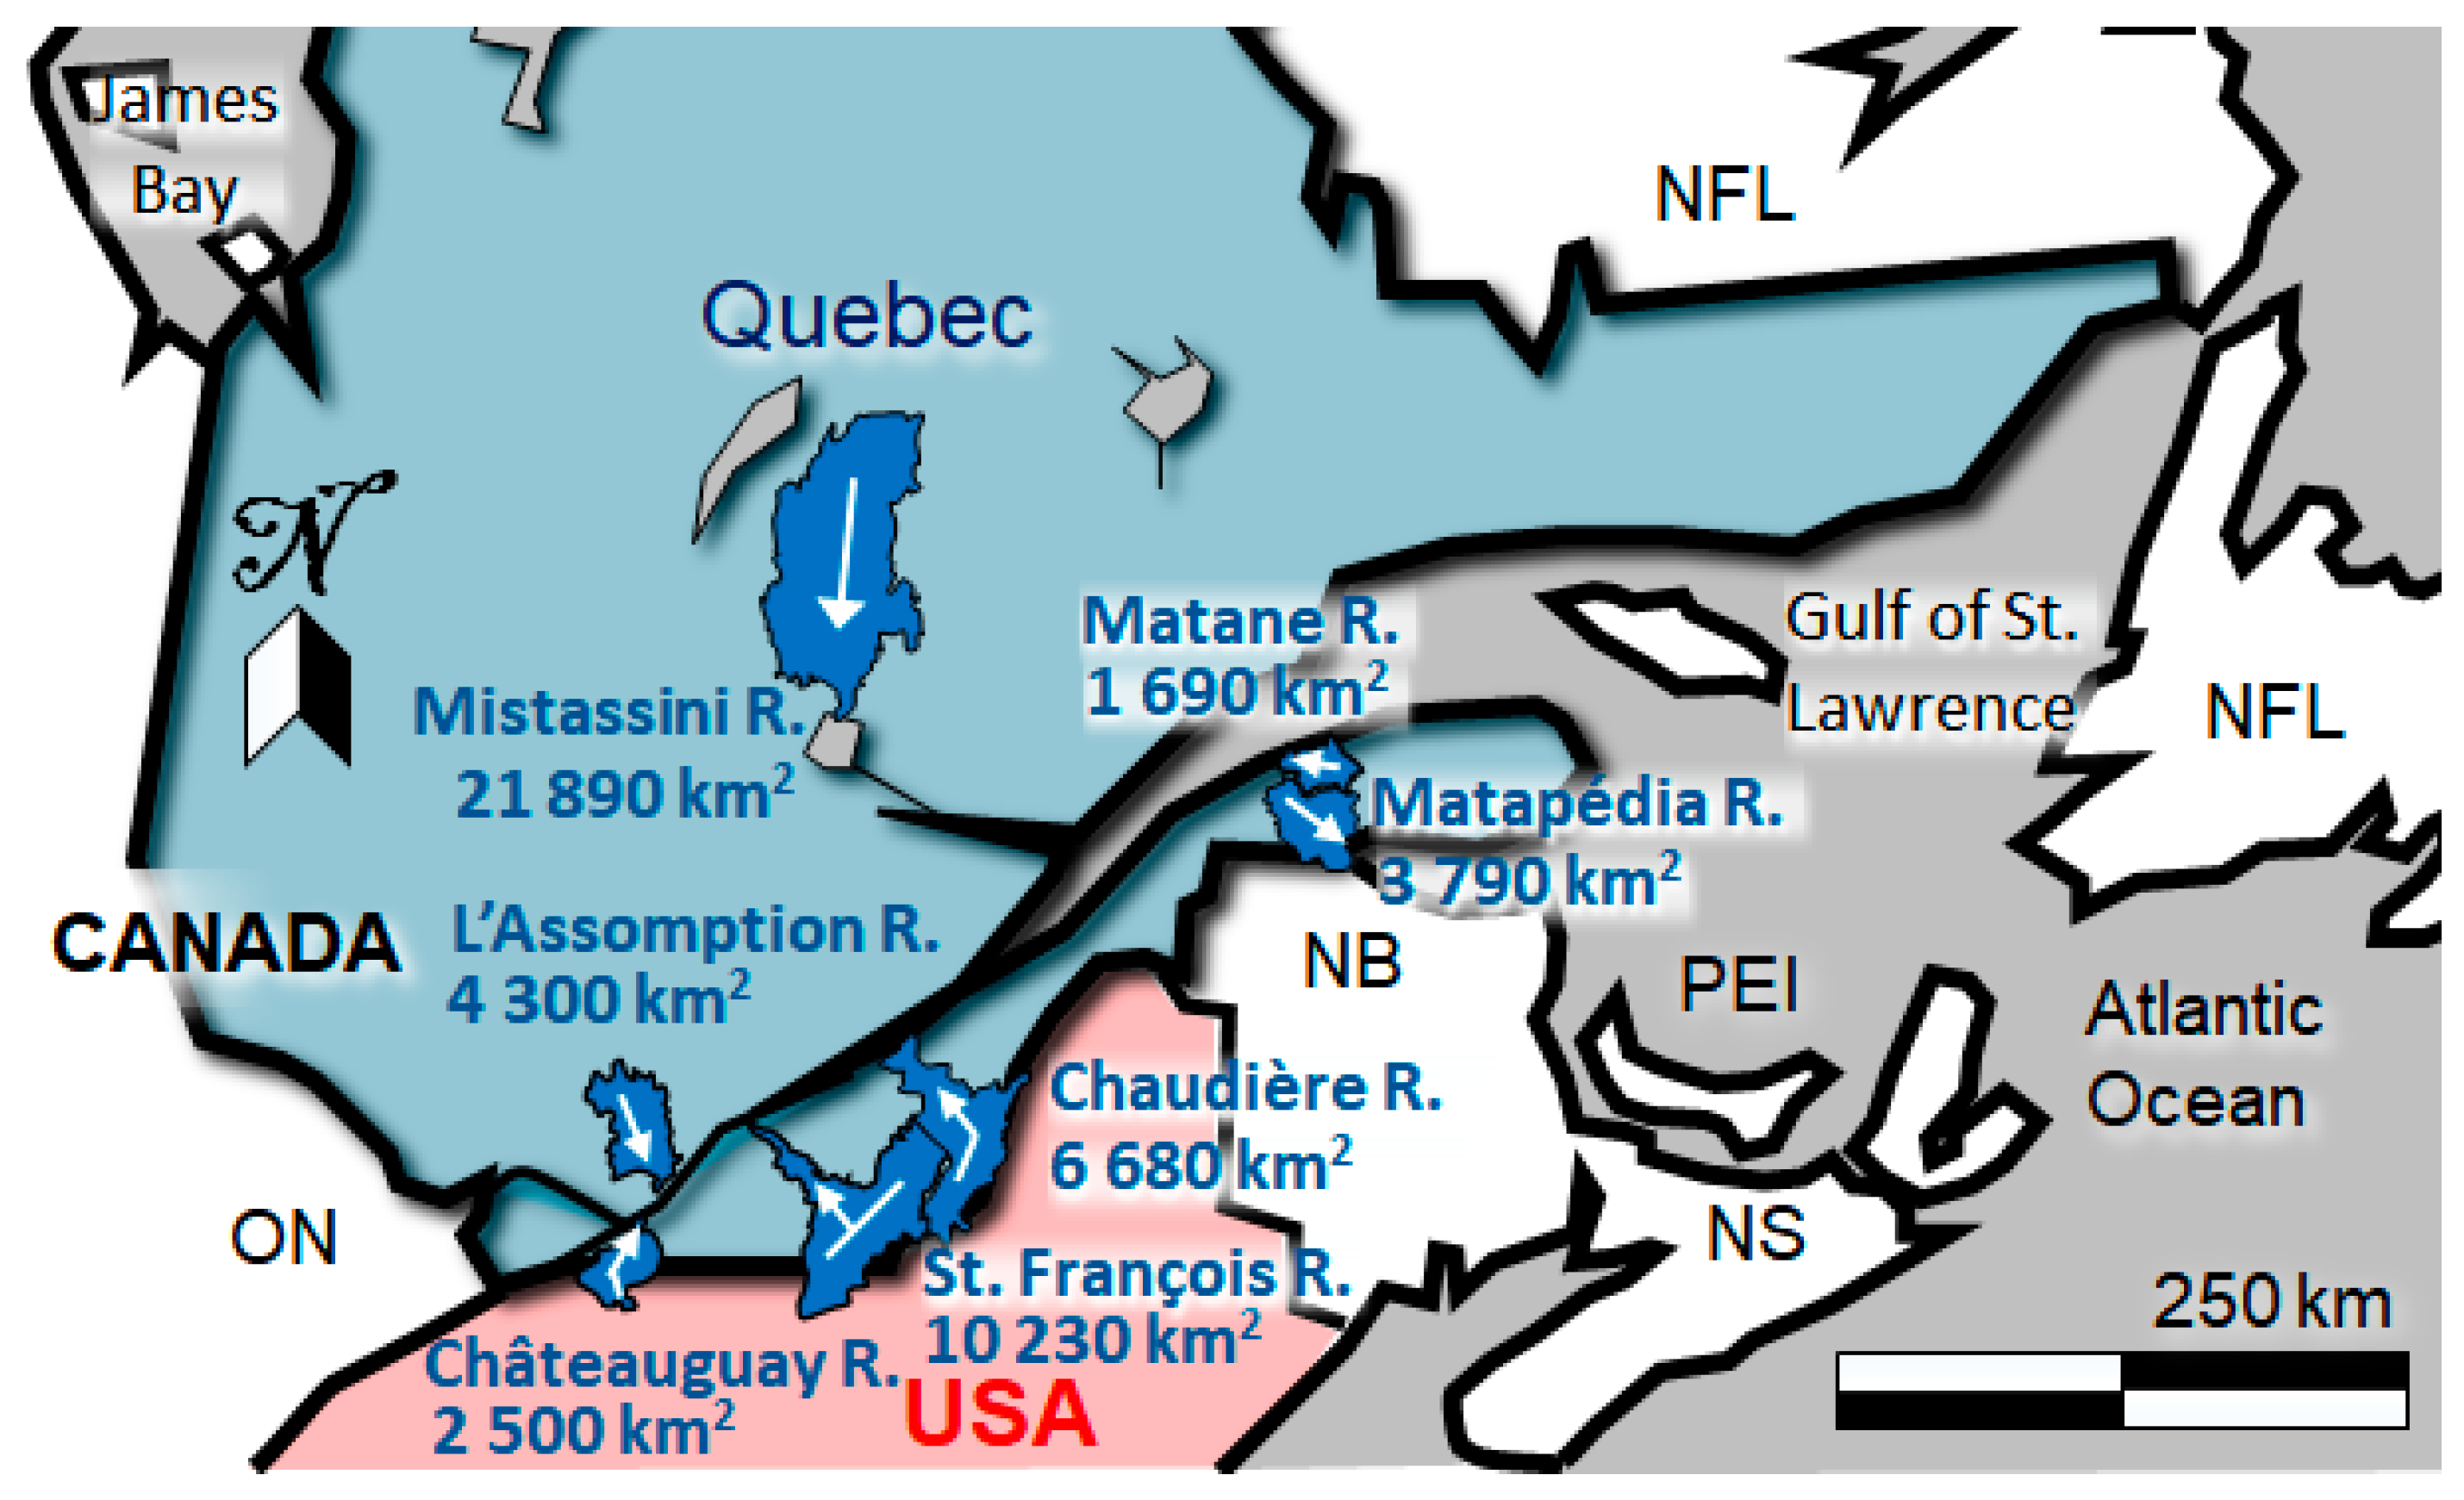
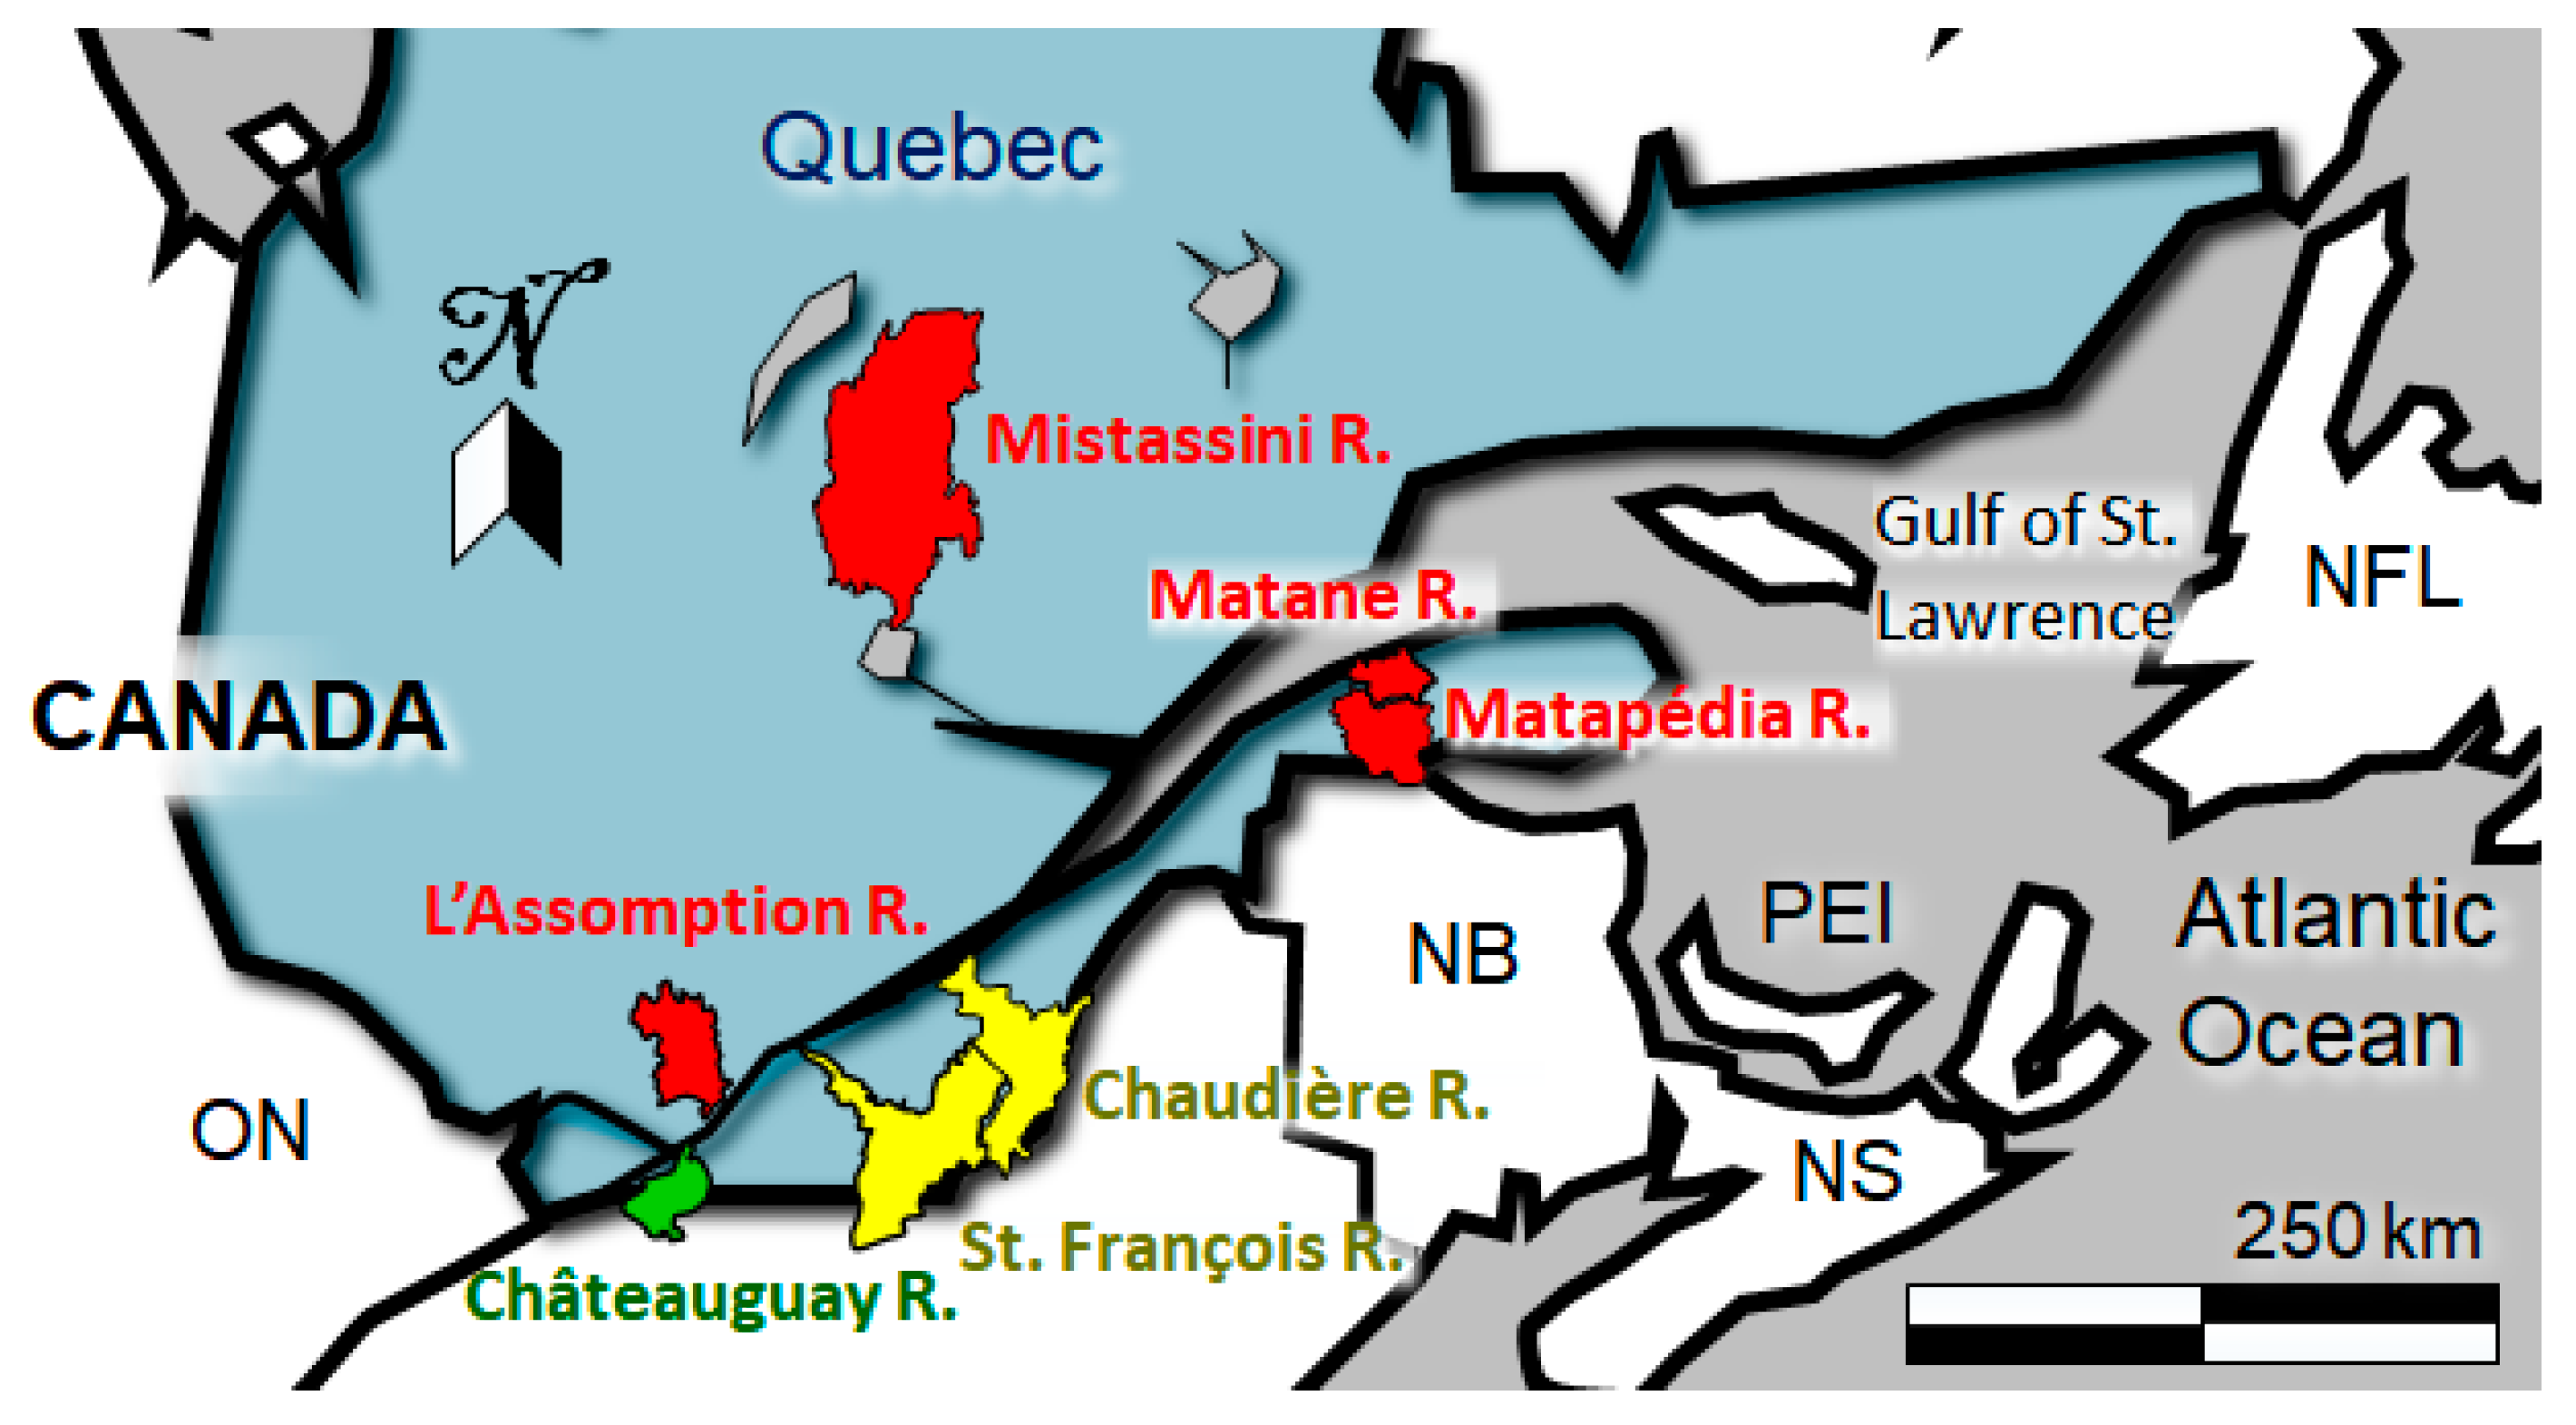
Seven unregulated or weakly regulated (natural hydrological regime with no seasonal storage) rivers from different areas of Quebec were selected for the study (Figure 1, Table 1) based on their known ice jamming activity as well as on the existence of flood studies that would contribute to a better understanding of river-specific ice processes. Other sources of information, including the MSP ice-jam database, watershed organizations database, municipal archives, newspapers, reports from the private sector as well as recent observations made by the Laval University research group were used to confirm the date and location of historical breakup ice-jam events along the rivers. The extent of this information helped define the number of municipalities included in the study (Table 1).
The structure of each ice breakup model is the same that was presented for the Montmorency River [23]. The model uses degree-days (DD) as a breakup resisting indicator and the estimated discharge (Q) as a breakup driving indicator. Daily-averaged air temperature data available from nearby Federal meteorological stations (Table 1) were used to determine the cumulated degree-days of freezing (CDDF for winter ice jams) or cumulated degree-days of thaw above −5 °C (CDDT-5 for spring ice jams). The −5 °C correction is introduced as a mean to take other heat fluxes into account, most importantly spring short wave radiation, in the approximate degree-days derived heat budget [40]. Daily-averaged Q data were obtained from Provincial hydrometric archives (Table 1), and maximum daily-average flows associated with runoff events were multiplied by a station-specific peak flow factor (Table 1) that was calculated based on recently published (generally post-1996) 15-min data.
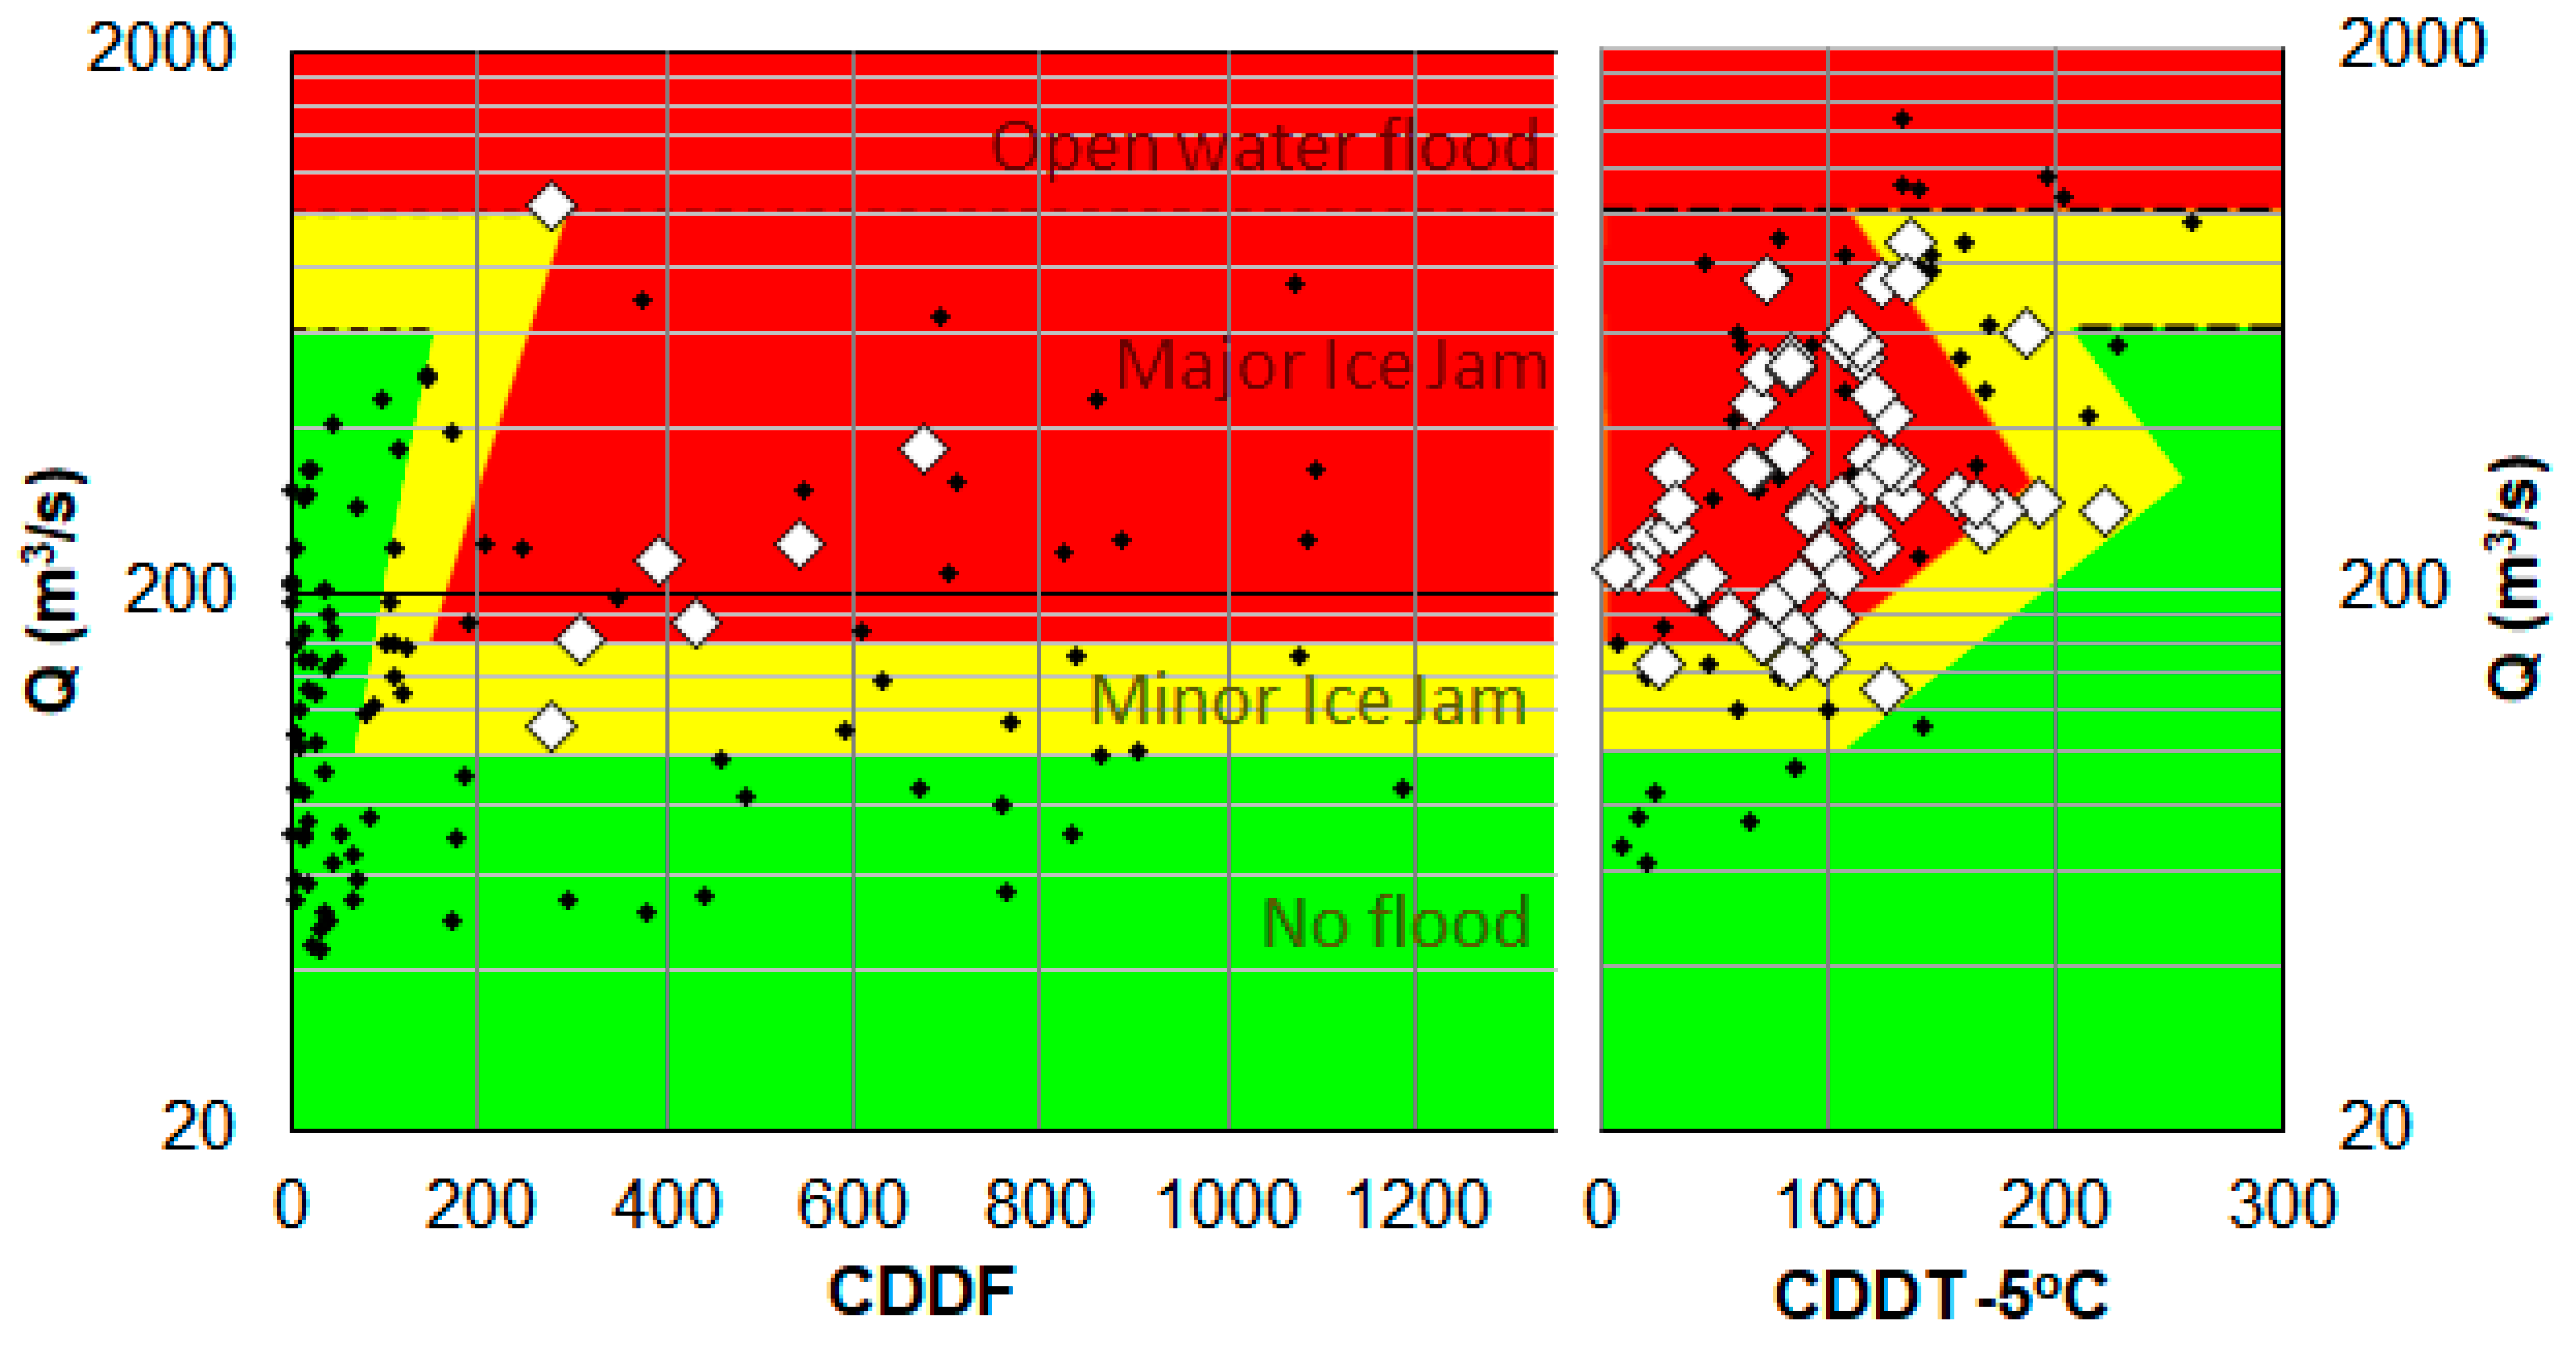
Figure 2 presents an example of the model. The different model thresholds for ice-cover mobilization (the first sustained ice movement with possible minor ice jamming, from green to yellow) and severe ice jamming (entering the red zone) were adjusted for each river using (1) river ice theory as well as (2) confirmed ice-jam events (generally post-1980, but also as far back as 1947, shown as white diamonds in Figure 2) or ice mobilization and wash (final evacuation of ice and return to open water conditions) observations associated with date-specific hydrometeorological data. Observations of ice formation processes and the earliest historical ice jams were used to determine the number of CDDF required to cool the water and to produce enough ice that would generate an ice jam if a runoff event was to occur subsequently. These models are currently used operationally to predict winter and spring floods in Quebec. In most models there is an overlap between the ice-jam flood zone and the open-water flood zone (upper portion of the graph) because ice evacuation from the river may occur at a discharge that is above the open-water flood threshold. This happens in river segments where the ice cover is the most resistant.
Once each river-specific model was calibrated using the available information, historical hydrometeorological data sets were used to identify any runoff event that could have caused a winter or spring dynamic breakup event (e.g., black dots in Figure 2). The historical period was defined as the 1972 to 2000 period for most rivers (the hydrological data for St. François River and Matane River included too many gaps during the 1970s and the historical period was shifted to 1982–2010) to match the reference period of future climate scenarios (Section 3.2). Constant values (for horizontal thresholds, Table 2) or linear equations (for rising thresholds) were used to automatically identify runoff events that would fall above the ice cover mobilization threshold (from green to yellow), which would indicate a dynamic breakup event. However, each runoff event was subsequently manually scanned and some runoff events were discarded from the breakup-event category for the following reasons, which are all based on the best available knowledge about breakup processes (this step in the methodology is critical and represents the bulk of the analytical effort):
- When a (partial or complete) breakup event was closely (in terms of CDDF or CDDT-5) followed by an equal or lower second runoff event, this second peak was discarded as it would not generate additional ice movements that could cause flooding.
- When there was insufficient ice produced (less than 100 to 200 CDDF, depending on the river) since the last partial or complete winter breakup event to generate any significant ice jam.
- When there was enough melting (generally more than 50 CDDT-5) after a partial spring breakup event to considerably reduce the probability of a significant ice jam.
In turn, some rising discharge events entering the yellow zone, but with a peak located in the green zone, were manually added to the data set and considered as potential dynamic breakup events. For the remaining ambiguous situations, additional judgment was used, including considering the current winter severity, watershed orientation, snowfalls, and spatial breakup patterns specific to each river system. In the end, all remaining (probable and confirmed) dynamic breakup events were used to calculate the average annual dynamic breakup frequency over 29 consecutive winters (Table 2). It is of interest to note that the three highest frequencies (from 2.6 to 3.3) were obtained on rivers located in the south-eastern (warmest) portion of Quebec. This area is regularly affected by warm and humid systems from the Atlantic Ocean and therefore, as reported in the Northeastern US [23,24], mid-winter ice jams are common.
3.2. Future Climate
The next step was to apply the same methodology to future winters. This means that both future air temperatures and future flow conditions would be needed. Weather conditions associated with tens of future climate scenarios (2042–2070) were available for the province of Quebec. A common distinction between the different scenarios is the RCP (Representative Concentration Pathway), which represents carbon emission concentration that affects atmospheric processes [14], whereas another difference is the model that simulates the Earth climate. Nine scenarios were selected (Table 3), in collaboration with Ouranos experts, based on a broad spectrum of possible climate warming intensities to account for future climate uncertainty [41]. Another selection criterion was the availability of associated hydrological simulations for the watersheds included in this project. These hypothetical future discharge products were prepared by the Quebec Government using HYDROTEL (the same model that is used daily to forecast flows for several hydrometric stations in the province).
In this study, the version of each retained future climate scenario was simulating a bias correction compared with an observed climate reference 70 years earlier (this technique is called quantile mapping, as opposed to a statistical perturbation [42]). Therefore, as an example, a simulated runoff event on 27 January 2056 would correspond to the runoff event of 27 January 1986, but with a different shape, peak flow (vertical position), and corresponding CDDF (horizontal position). This example is illustrated in Figure 3.
To make sure that HYDROTEL was providing realistic future flow outputs and therefore to reduce any bias-induced hydrology computation, measured (estimated) historical conditions were compared with simulated historical conditions. The superposition of both flow data sets was interpreted visually, and dynamic breakup statistics were compared. This analysis revealed that HYDROTEL performed well for 2 rivers (Châteauguay and Chaudière, for which simulated and measured historical flows were similar), but for the remaining 5 rivers, the historical hydrological simulations had some discrepancies from observed flows. Therefore, to quantify the impact of climate change for those 5 rivers, rather than comparing simulated future flows with observed historical flows, to account for modelling bias, simulated future flows were compared with simulated historical flows.
The next step consisted of inserting future CDDF, CDDT-5 and Q data sets from each climate-change scenario (Table 3) into the corresponding breakup model and to automatically (using identical thresholds) and manually identify runoff events that would cause dynamic breakup events in the future. Table 4 presents the number of simulated runoff events that were analyzed for each river for all 9 climate scenarios as well as the final number of runoff events that were considered to generate dynamic breakup events. Once this analysis was completed in a consistent manner, results were compiled to illustrate the impact of climate change on dynamic breakup events, and by continuity, on future ice-jam floods (refer to Section 4).
To account for the bias induced by the hydrological model for 5 of the 7 rivers, a bias-correction factor (dynamic breakup frequency based on measured historical Q divided by dynamic breakup frequency based on simulated historical Q) was applied to the future frequency results. For example, simulated historical Q values for the St. François River produced a dynamic breakup frequency of 1.4 events per year (as compared with 2.6 events per year obtained using measured historical flows, Table 2). The authors therefore applied a correction factor of 1.86 (2.6/1.4) to the results associated with simulate future conditions for that river.
3.3. From Ice-Jam Flood Frequency to Ice-Jam Flood Risk
A second objective of this project was to estimate the risk of historical and future ice-jam floods. The risk, in terms of Annual Average Damage (AAD, in Canadian Dollars (CAD)/year), is obtained by multiply the probability (or frequency, as presented in Table 2 for the historical period) by the cost (or damage) of ice jam floods. The MSP provided damaged reimbursement data by the Government of Quebec following flooding events in riverside communities included in the study (Table 1) for the period of 1991 to 2014. A total of 100 distinct (watershed cumulated) reimbursements were linked to specific winter and spring breakup events (mostly confirmed ice jams). Reimbursements were converted to 2017 CAD.
An event-by-event investigation was performed to evaluate the relationship between breakup intensity (yellow or red zones in Figure 2), or maximum estimated discharge (Q) associated with a dynamic breakup event, and the reported Government reimbursement. In some cases, as the complexity of ice jam flooding processes would suggest, no trend was found and a unique, event-averaged damage cost was identified, independently of the maximum Q. However, in some cases, a logical tendency between breakup intensity and reimbursed damage could be identified (Table 5) among the few data points (average of 14 events associated with confirmed damage per watershed). For the Mistassini River, due to a limited number of events with reported damage (4), 3 different relationships were established.
In order to obtain realistic results, it was important to account for weak ice-jam events or for false alarms (known as false positives) that would result from a dynamic breakup model that is conservative. A potential ice jam damage value was calculated for each river by applying the equations and values presented in Table 5 to all dynamic breakup events for the same period of 1991 to 2014, regardless if damage had been reported or not. Then, the total confirmed damage cost reported by the Government for each river was divided by this potential damage cost, yielding a river-specific AAD ratio (last column of Table 5). This ratio was applied to both historical (1972–2000) and future dynamic breakup events (2042–2070).
A recent investigation conducted by the same research team for St-Raymond de Portneuf revealed that the reimbursement offered by the MSP represented 30% of the total direct and indirect costs of ice-jam flooding events. The AAD was therefore multiplied by 3 for all the rivers to account for damage that are not included in the Government reimbursement program. Results for the historical period are presented in Table 6.
4. Results
4.1. Evolution in the Winter Distribution of Dynamic Breakup Events
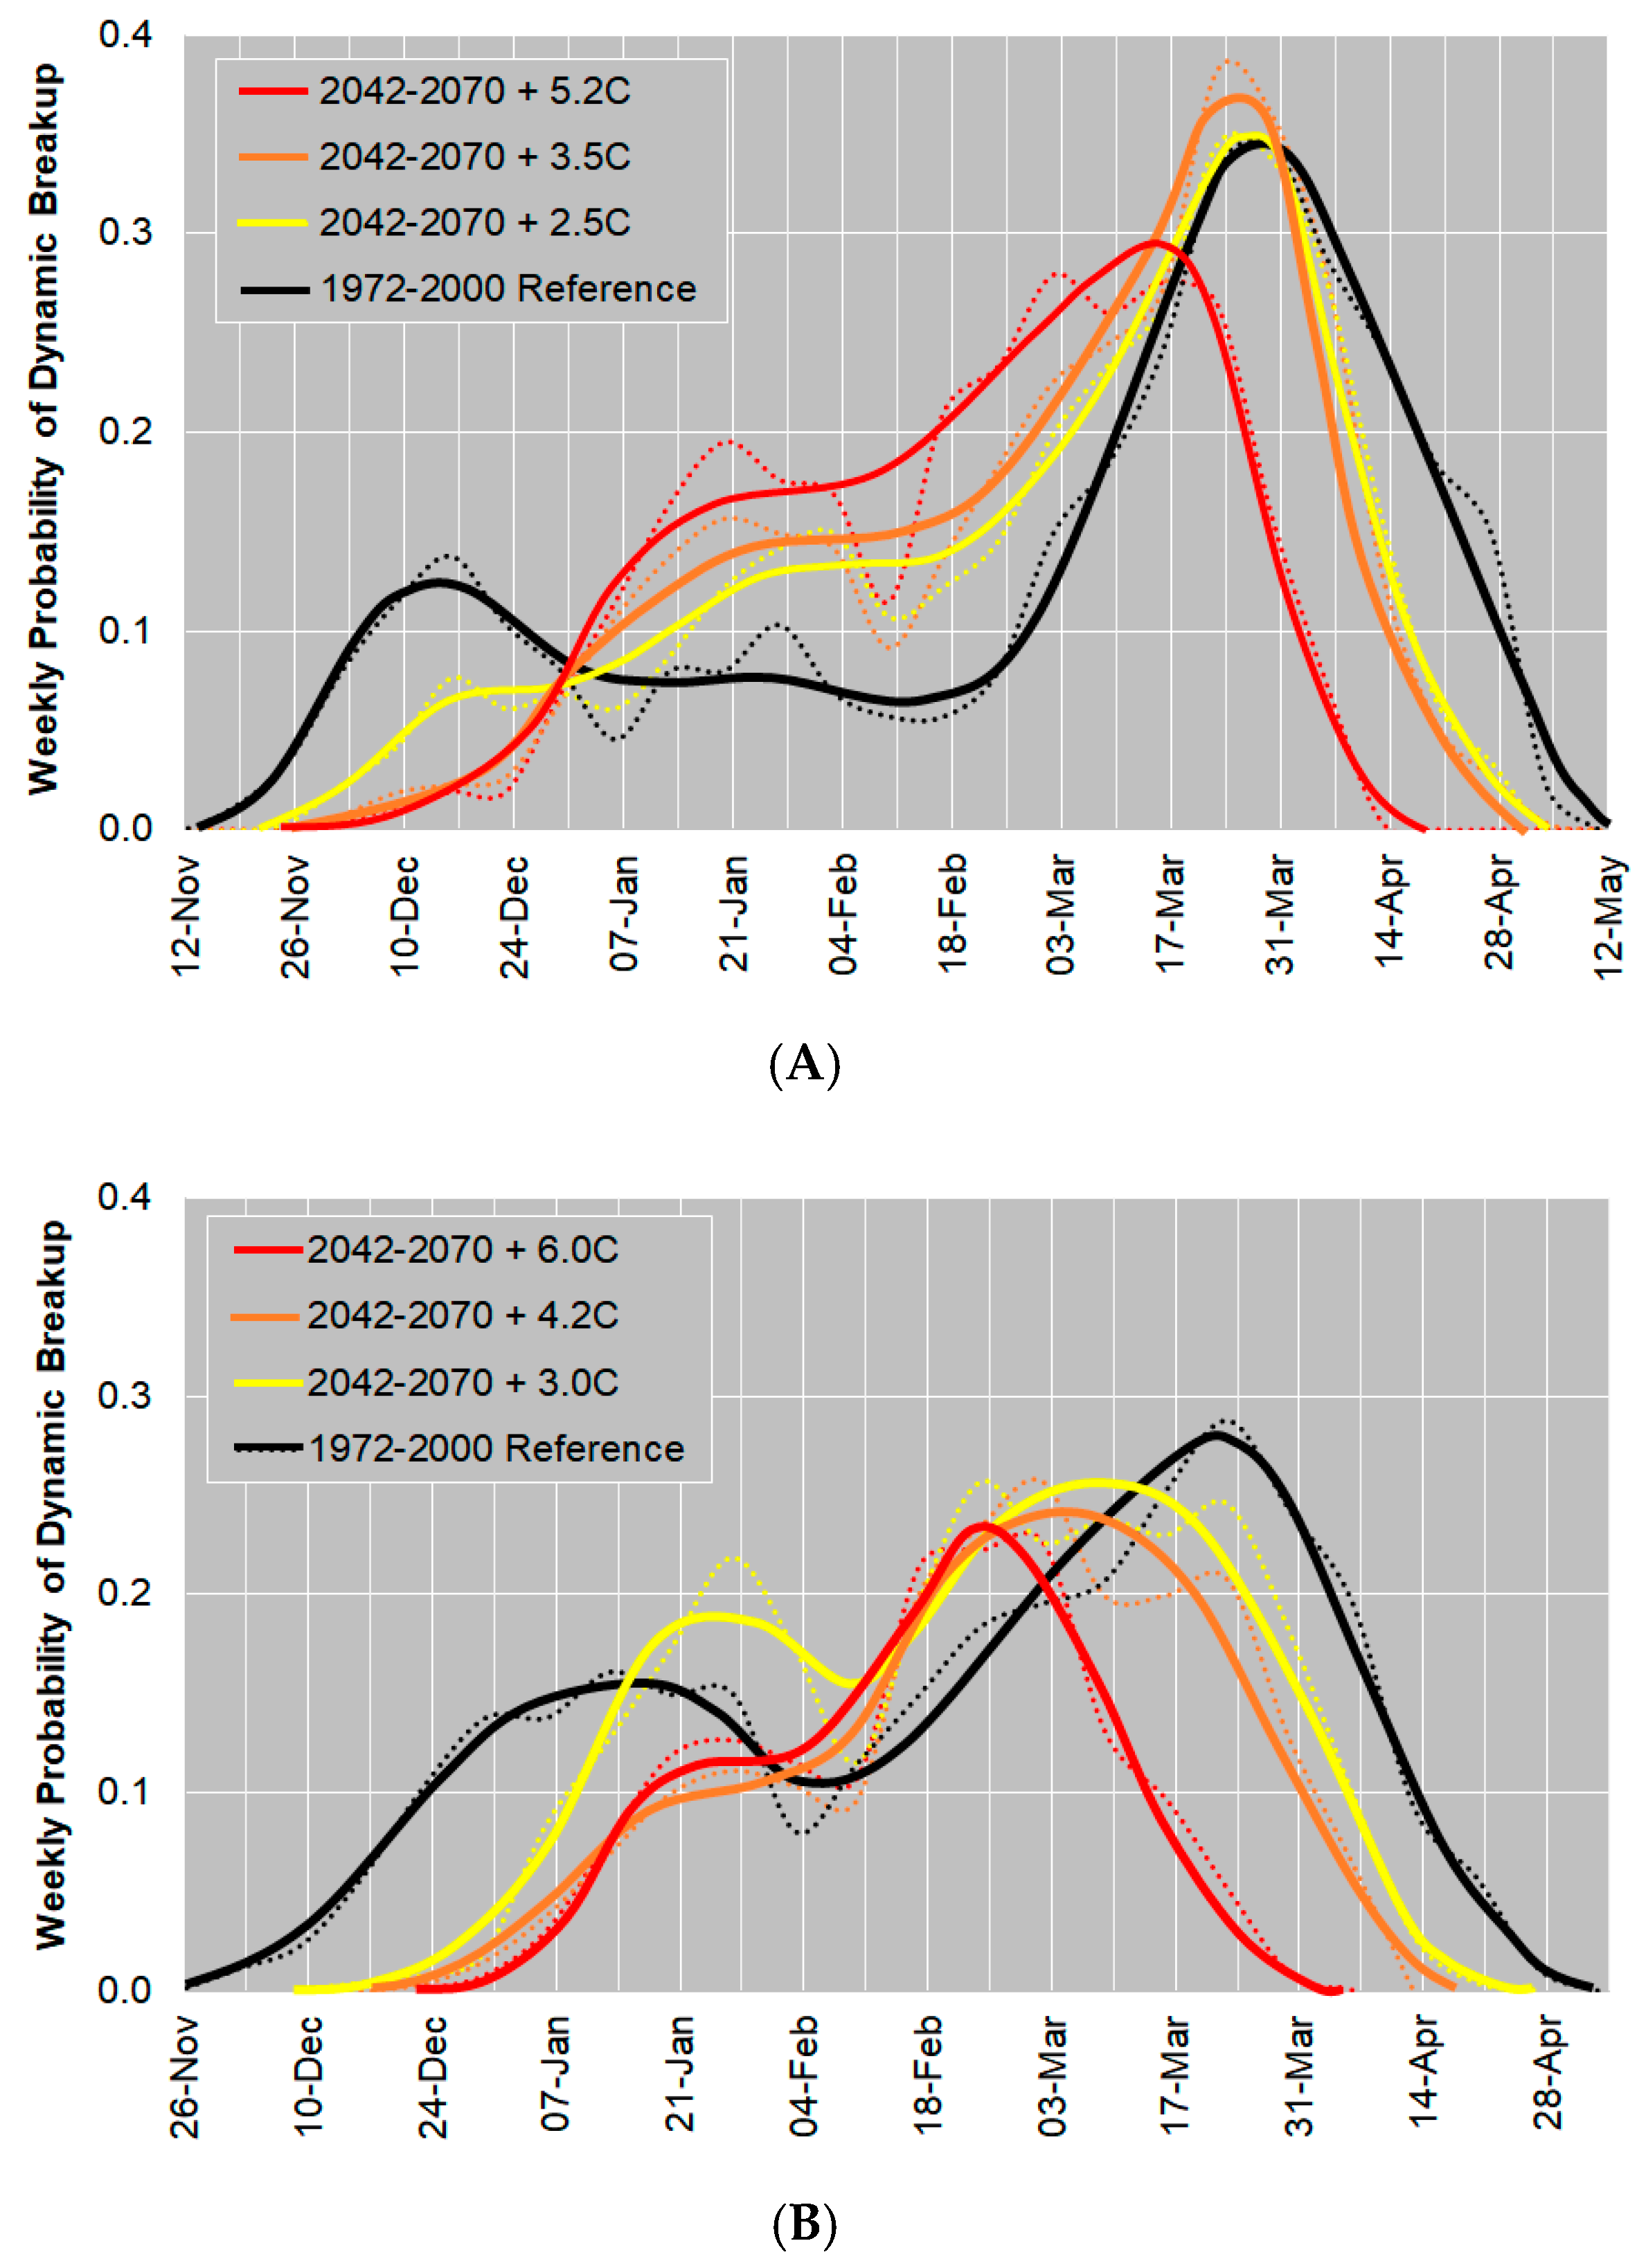
The hydrological model for the Chaudière and Châteauguay Rivers were reliable enough (as mentioned in Section 3.2) to investigate how the weekly distribution of dynamic breakup events over a winter would evolve from the 1972–2000 period to the 2042–2070 period. Figure 4A shows that the duration of the period associated with a non-zero probability of dynamic breakup on the Chaudière River would be reduced by about 1 to 3 weeks at freeze-up and by 1 to 4 weeks in the spring, depending on the intensity of climate change over a 70-year period. More importantly, smoothened model results suggest that the dynamic breakup probability peak of early-December would tend to merge with a higher mid-winter breakup probability and the end-of-March breakup probability peak would occur in mid-March during the 2042–2070 period. Finally, the area under each curve would remain fairly stable, with an average of three dynamic breakup events every winter.
Results for the Châteauguay River are somewhat comparable (Figure 4B), but there is no substantial rise in the probability of mid-winter breakup events in future scenarios. As a result, the area under the curve evolves from about three dynamic breakup events per winter under 1972–2000 hydrometeorological conditions down to only 1.5 dynamic breakup events per winter for a warming of 6.0 °C.
As expected, the results show a reduction in the duration of the period during which dynamic breakup events could occur for all seven rivers as climate becomes warmer. After considering simulated historical conditions for five rivers to account for the bias introduced by hydrological models, results indicated that mid-winter breakup events become more likely for all seven rivers. In turn, the likelihood of dynamic breakup events during the spring tended to increase for only three rivers in future scenarios compared with historical conditions (Mistassini, Matane and Matapédia Rivers). In other cases, the likelihood of dynamic breakup events during the months of January and February tended to merge with the March or April peak probability (as depicted in Figure 4).
4.2. Evolution in the Probability and Risk of Dynamic Breakup Events
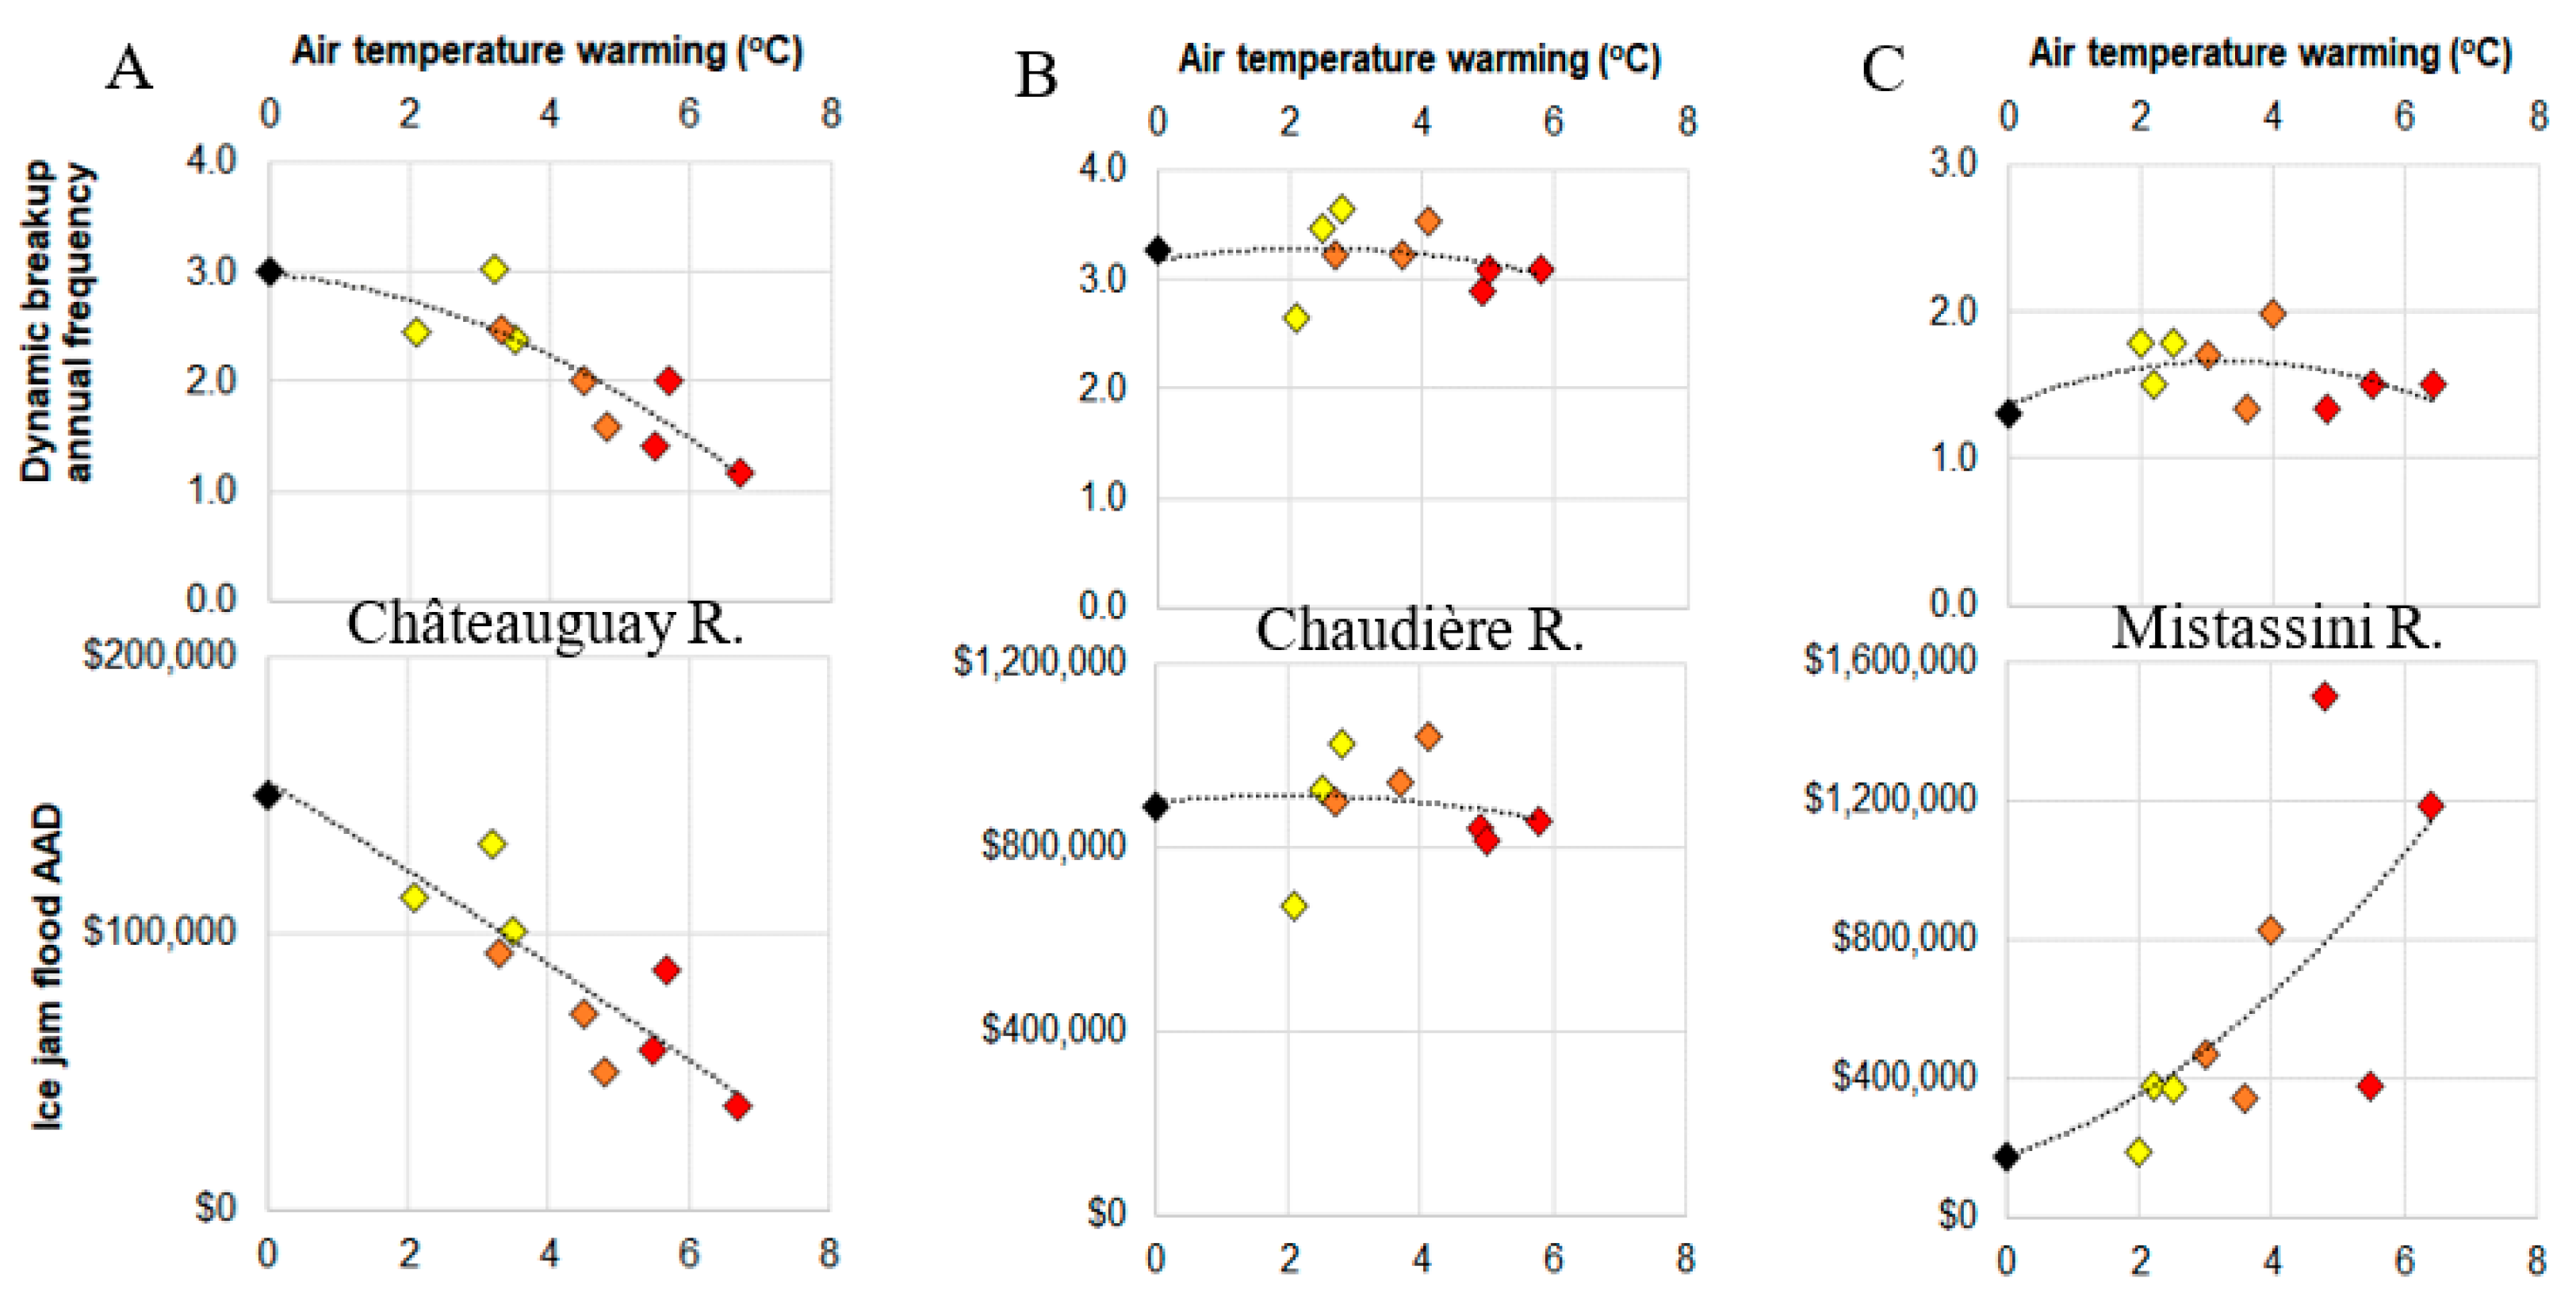
Regardless of when dynamic breakup events and ice-jam floods may occur during the winter period, most stakeholders are interested in knowing how the annual frequency and risk (AAD) of those events will evolve in the future. Figure 5 presents three different types of results obtained from the analysis of all climate scenarios. On the left (Figure 5A), future air temperatures warming in the Châteauguay watershed are seen to generate a reduction in the probability of dynamic breakup events and a corresponding reduction in the ice-jam floods AAD (for a constant exposure and vulnerability to floods). This reduction is mostly caused by winters becoming too mild and winter precipitation mostly falling in the form of rain, a behavior that may be compared with prevails in some watersheds located in the Northeastern United States [22,23,24].
The Chaudière River (Figure 5B), located in a slightly cooler area than the Châteauguay River, is affected by two opposing processes: rain-on-snow events become more frequent, which promotes dynamic breakup events, but the ice cover may occasionally remain too weak (thin or partial) to offer significant breakup resistance. Finally, the Mistassini River (Figure 5C), located in a colder area (Figure 1), would be affected by a slight rise in the frequency of dynamic breakup events. However, these events would be associated with much higher discharges in the presence of ice, and as a result, the AAD (calculated based on an average of the three values or equations presented in Table 5) of ice-jam floods tends to rise significantly under warmer winter and spring conditions.
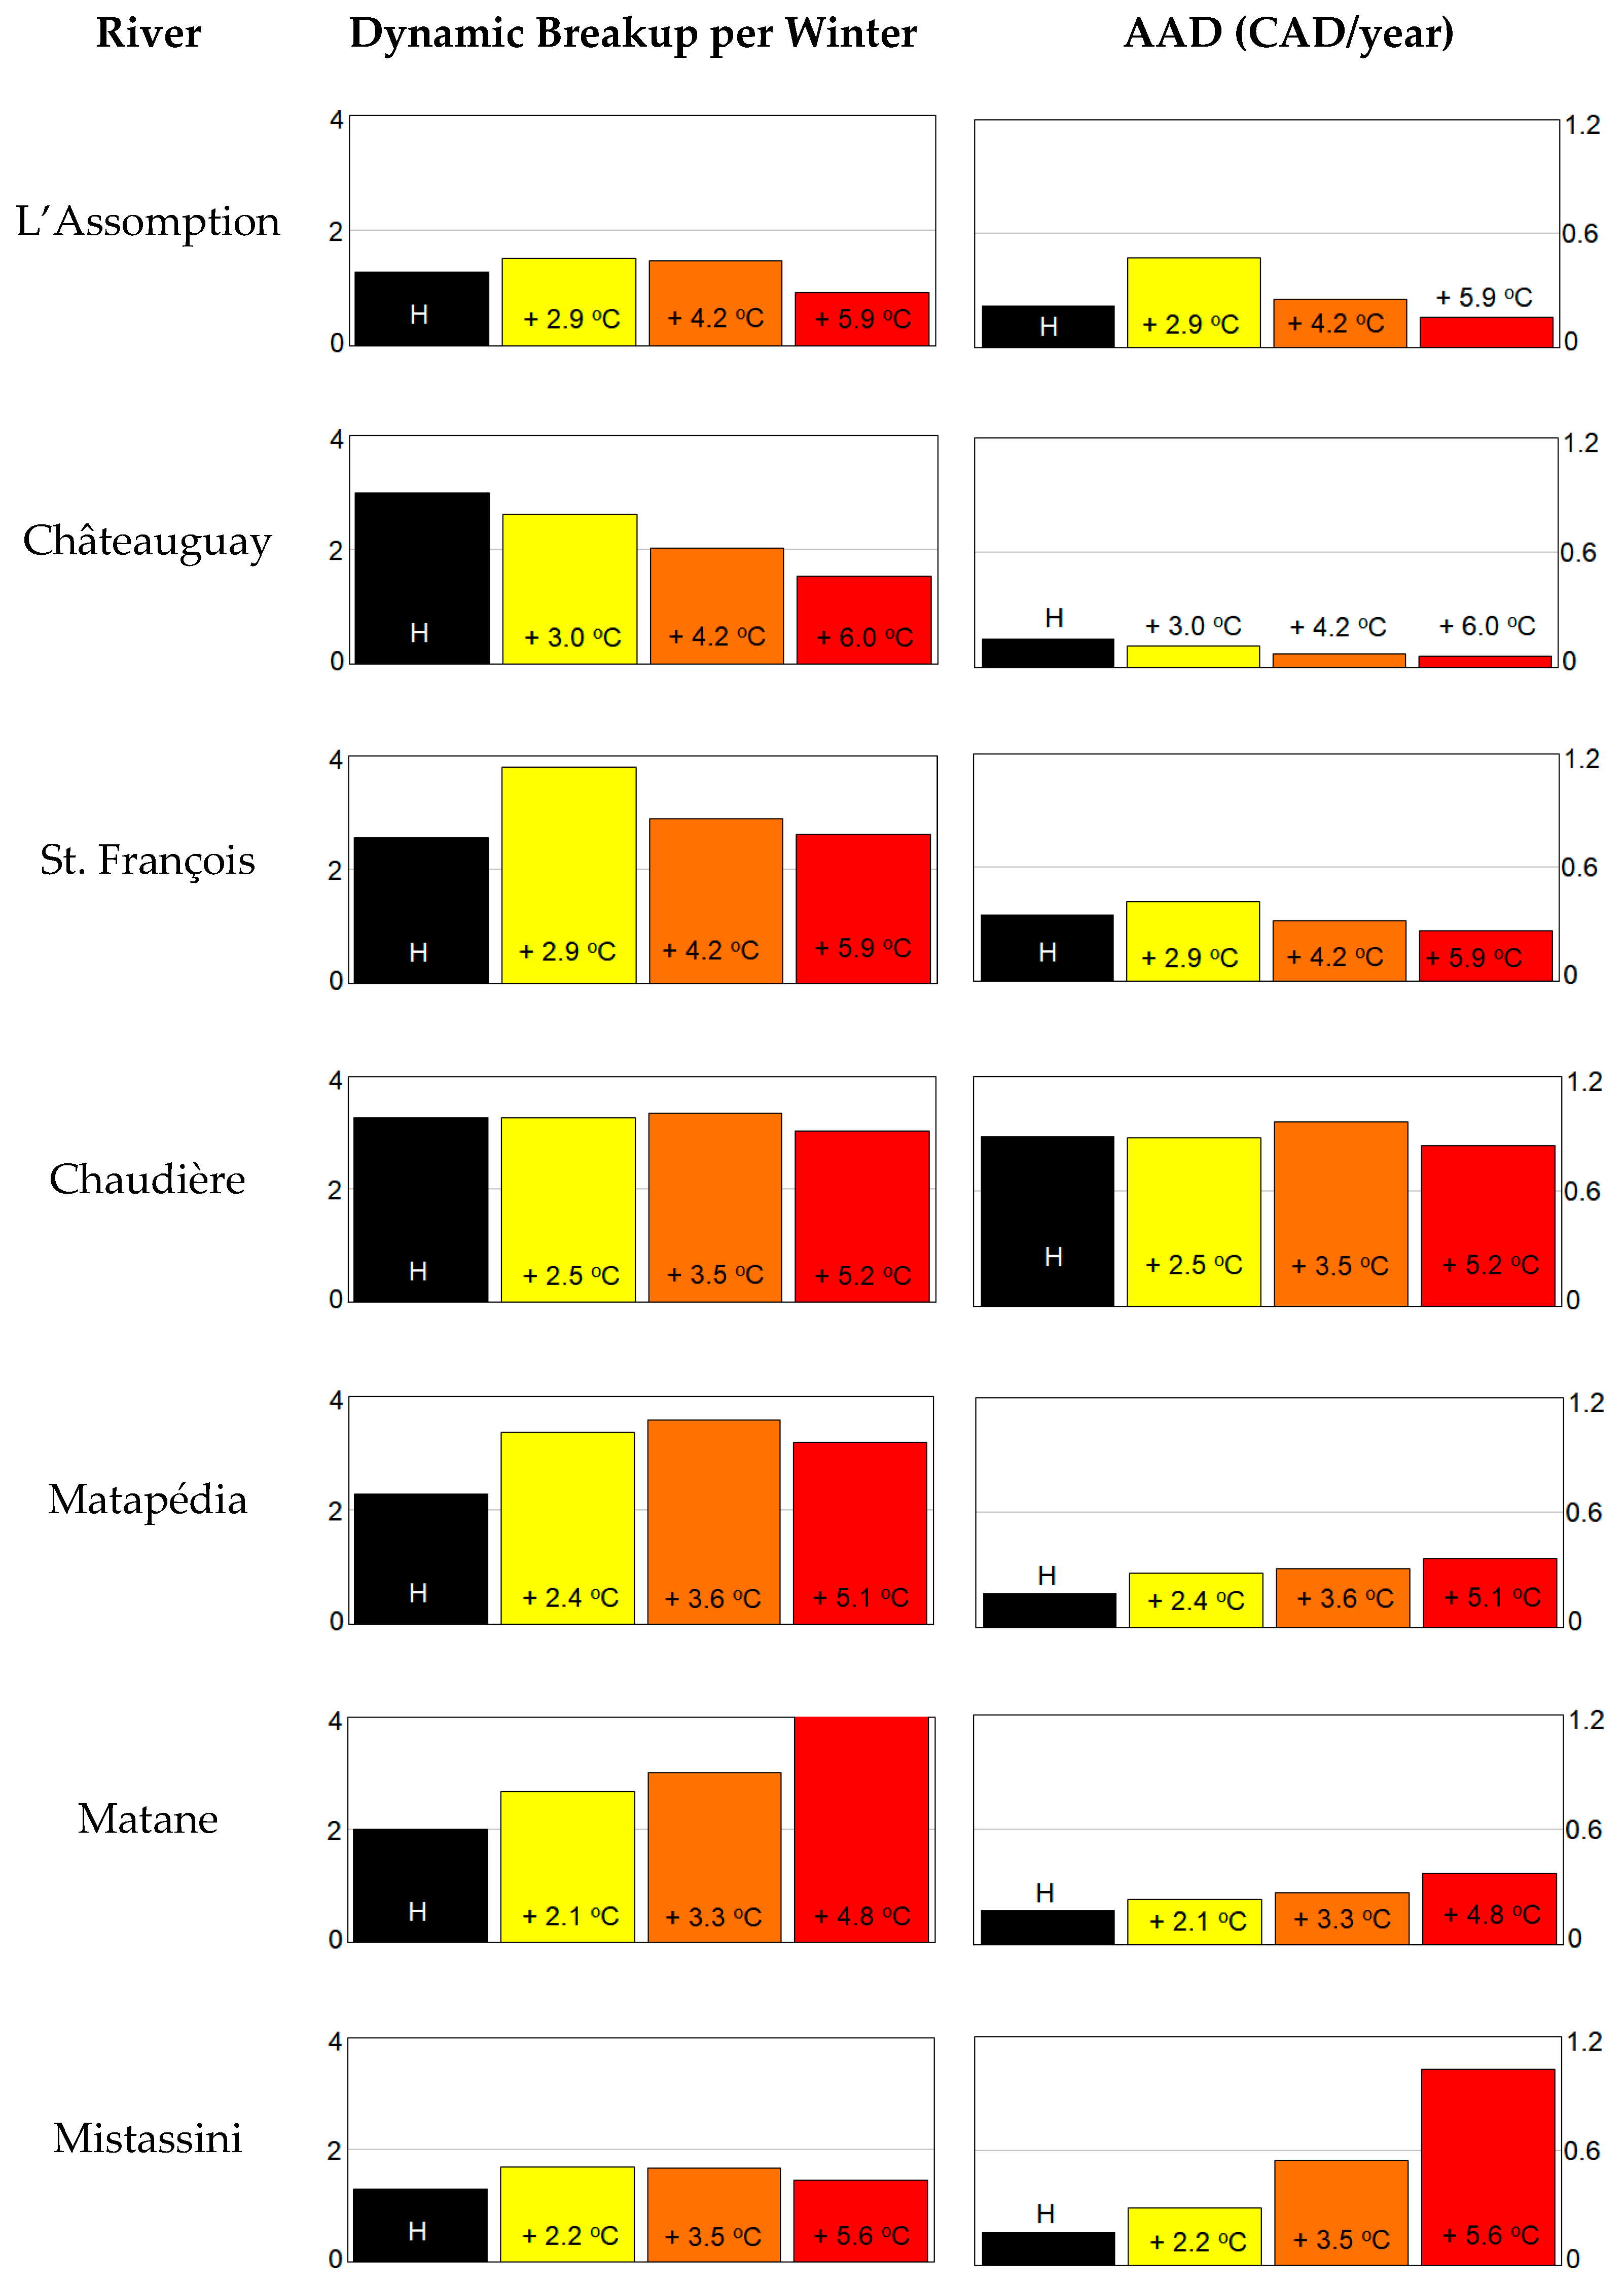
Figure 6 presents the summary of historical (black) and future (colored) frequencies of dynamic breakup events as well as risk associated with ice-jam floods (AAD). The future intensity of warming is the average of three scenarios, as presented in Table 3. Overall, for these 7 ice-jam-prone rivers, the cost of future ice-jam floods would rise by about +30% over 70 years, going from CAD 2.2M to CAD 2.9M (2017 CAD). However, results vary from −45% (Châteauguay R.) to +250% (Mistassini R.).
Figure 7 presents the same AAD results expressed from a geographic perspective. It shows that the Châteauguay River, located in the area of the Province of Quebec where winters are known to be the mildest, could see a decline (green) in the risk of ice-jam floods in the future. Two north-flowing rivers located in central Quebec (St. François and Chaudière) would see a stable (yellow) ice jam flood risk under different climate scenarios. Finally, four rivers located in colder areas could experience a rise (red) in ice-jam-flood annual average damage (AAD) as winter and spring temperatures rise.
5. Discussion
5.1. Meaning of the Results
Results indicate that the Châteauguay River watershed could see less than 400 cumulated degree-days of freezing (CDDF) during future (2042–2070) winters, a reality that currently prevails south of the border in the Northeastern US, in Southern Ontario as well as in some areas of the Atlantic Provinces, where most ice jams tend to occur during the months of January and February. Not only does this compare with the distributed probability results presented in Figure 4B, but it also suggests that any area where future winters will bring less than 400 CDDF could also see a significant attenuation in the risk of ice-jam floods. That being said, the probability of damageable ice jams will remain, but the current interest in forecasting anomalous winter rain events that trigger a dynamic breakup should shift towards an interest to forecast anomalous cold spells that would produce enough ice for a possible, subsequent dynamic breakup to occur.
The St. François and Chaudière Rivers could see a stable risk of ice jam floods in the future, but, this will be the result of two opposing factors: the number of winter runoff events (and therefore breakup events) will increase, but so will the ratio of thermal vs. dynamic breakup events. One question will remain, and the current methodology cannot easily answer this: Will future ice jams, formed by multiple partial breakup events, be simply longer (affect more areas), or also thicker (generate more significant flooding at specific locations)? Monitoring river ice conditions during winters characterized by a single (representative of past climate) or by multiple (representative of future climate) dynamic breakup events may offer a first answer.
Finally, the L’Assomption, Matapédia, Matane and Mistassini Rivers would see a rise in the risk of ice jam floods (Figure 7) associated with more frequent rain-on-snow events generating breakup events in the presence of an ice cover that would remain thick enough to offer substantial resistance. Within this group, the L’Assomption River would behave differently from the others (Figure 6): a mild rise in air temperatures (about 3.0 °C) would generate a significant rise in ice-jam-flood AAD, but if (or as) temperatures rise further, a decline in AAD would eventually be observed. This behavior is also visible on the Matapédia River results, but only for (or after a) more intense warming (5 °C). These results support the statement that extrapolating historical ice-jam flood trends into the future could result in inaccurate projections [4], at least in areas where a transition to winters with less than 400 CDDF is foreseen. Interestingly, a similar trend was hypothesized by other researchers [43] to describe how ice-jam floods may evolve in the future on the Saint John River at Perth-Andover, New-Brunswick (NB), a province located just south of the Matapédia River (Figure 7).
This interpretation illustrates that the results presented in Figure 6 would not only represent different possible scenarios for a fixed future period (2042–2070), they could also represent the temporal evolution of the ice-jam flood risk for those rivers, as future air temperatures continue to rise, with associated changes in precipitation and other weather parameters. Clearly, the province of Quebec could learn from what is currently happening in warmer areas and the second approach described in the background section of this paper should be explored in future studies.
5.2. Relative Success of the Methodology
This study demonstrates that it is possible to obtain an estimated trend of the probability of future ice-jam floods without the need to work with measured or simulated water levels, or physical ice jams parameters. It further shows that an estimate of the financial risk associated with historical and future dynamic breakup events can be obtained without the need to establish community-specific stage-damage curves. Undoubtedly, at a community scale, more physically-based approaches that depend on measured water levels, building elevations and building values, if relying on reasonable assumptions, may not only help to determine the future risk of ice-jam floods, but they can also support the development of climate change-adapted flood hazard maps, e.g., [29] and flood-risk maps.
The case-by-case analysis of thousands of winter and spring, historical and future runoff events using river-specific empirical breakup intensity models for different watersheds across the province of Quebec has produced logical outcomes that should be taken seriously by stakeholders, at least to develop a long-term flood mitigation plan where a rising risk of ice jam flooding is foreseen. Not only do the results compare with what was originally hypothesized (as expressed in the introduction), but they are also consistent for an increasing climate warming: Figure 6 shows no case where a decline in the frequency or risk would be followed by a rise, nor does it show significant scatter (despite relying on the average of only three climate scenarios per intensity category). The strength of the approach presented by the authors mostly rests on the intimate knowledge of each river, on a profound understanding of river ice processes, on the careful analysis of hydrometeorological conditions leading to runoff events (17,955 measured and simulated events) and flood damages (100 events recorded in the MSP database) as well as on the reliability and simplicity of each river’s tailor-made empirical breakup intensity model. Some of those models are probably more conservative than others, but the methodology explains how the impact of a conservative model on the estimation of the current and future ice jam flood risk was attenuated using river-specific Government flood damage reimbursement data.
5.3. Transferability of the Results
To the knowledge of the authors, this study is the first of its kind: 1. to quantify the probability and risk of historical and future ice-jam flooding in North America and 2. to use empirical dynamic breakup models to obtain this type of result. Although the climate and geography of the province of Quebec are relatively spatially consistent and that several regions have been included in the study, it appears somewhat premature to extrapolate or interpolate the results to other watersheds, even to neighboring rivers of comparable characteristics. The authors need to stress that the spatial and temporal breakup regime of each watershed is unique and cannot be simply transferred east, west, south or north. Other parameters—such as watershed gradient, shape and orientation, as well as channel morphology sequences (including the presence of rapids and lakes or small reservoirs)—can play a dominant role in river ice processes and therefore substantially influence future river ice breakup scenarios. The authors believe that regional tendencies could be confirmed if additional rivers, spread across different areas of the Province, were included in a similar study.
If this approach was used elsewhere or if it was applied to other rivers in Quebec in order to open the door to the development of long-term regional flood mitigation strategies, the authors would recommend that a special attention should be given to a number of factors that are presented below.
5.3.1. Hydrology
Calibrating and adapting hydrological models specifically for winter conditions would represent the most important step to confirm the reliability of the approach. Indeed, the shape and amplitude of historical runoff event simulations differed from hydrological measurements (Government-approved estimated discharges) for five rivers out of the seven included in the study. It is now clear that reproducing a data set from a statistical point of view does not mean that runoff events are accurately simulated. An examination of previous research discussions [30,44] suggests that hydrological models specifically calibrated for the breakup period would represent at step forward for future climate change-related work on river-ice breakup [29]. For example, the release of water stored in the form of ice and hydraulic backwater under the ice cover should be taken into account. These models should also consider watershed-specific spatial breakup patterns, and a sub-daily time step should be adopted (which would enable researchers to stop relying on a station-specific, average peak flow factor). Moreover, agencies could improve winter flow measurements and discharge estimation programs, especially during the breakup period [45], and therefore allow for a more accurate calibration of both hydrological and ice models.
Beyond making the results of similar studies more representative of future conditions, another benefit of these improvements would be to provide more reliable breakup timing and ice jam flooding forecasts for emergency management purposes.
5.3.2. Weather
In the spring, in addition to air temperature, other factors such as recent snow, cloud coverage, and wind conditions play a major role in the weakening of some ice covers, e.g., [4]. Eventually, a more sophisticated ice-cover resistance indicator could be adopted. Moreover, for larger basins or where the north-south temperature gradient is important, it would be of interest to include the data from multiple meteorological stations for the calibration of an empirical river-ice breakup model in order to better represent spatial breakup patterns.
In some regions of Canada, a thin snowpack may promote thermal breakup events. However, in most regions of Quebec, the amount of snow on the ground is rarely a limiting factor to the occurrence of large ice jams and most ice-jam floods are caused, at least in part, by rain storms that affect large areas, or entire watersheds. Even if future snowpack conditions would promote thermal breakup scenarios, it is assumed that hydrological models would manage to simulate reduced snowmelt runoff rates accurately.
5.3.3. Ice Processes
Each empirical model was calibrated using confirmed historical ice jams that would or would not have caused flooding. The different thresholds are, of course, a simplification of reality [7] and other threshold types and shapes could be explored, e.g., [46].
To the authors’ experience, the threshold for the first sustained ice movement in rapids (and there are rapids in all the studied rivers) is relatively independent of freeze-up discharge or snow conditions. This is explained by the fact that breakup begins in steep reaches when the suspended ice cover [47] lying on emerging rocks and banks begins to float, and is therefore expressed by a breakup onset threshold that is independent of CDDF on breakup models (Figure 2). In turn, freeze-up conditions, in terms of discharge, e.g., [48] or snowfall, e.g., [49], in low-gradient river reaches have an impact on the initial ice-cover resistance and therefore on the potential intensity of subsequent breakup ice-jam events. This would mean that breakup intensity thresholds would need to vary depending on hydrometeorological conditions at freeze-up, which is not trivial to include in an empirical ice model expressed in 2D environment. More sophisticated ice-cover thickening—e.g., [50] and weakening, e.g., [51]—equations could also be used, but this would also make the empirical approach more laborious to apply.
The authors assumed that the simplicity of each model combined with their calibration using several confirmed historical events would include a diversity of possible ice-jam flooding scenarios. Indeed, the authors’ perception is that ice processes are more predictable at a macro-scale (several tens of river kilometers) using simple empirical models than at a micro-scale using deterministic hydrodynamic models. Although increased computation power facilitates numerical Newtonian river-ice-jam simulations, ice observations and knowledge development remain the most important aspect of river-ice research.
5.3.4. Morphology
A more meticulous analysis about river breakup spatial patterns for each watershed should confirm the direct or indirect role of channel morphology in explaining the location and intensity of future ice jams. As a first constructive step, there was a recent attempt to link specific channel geometry indicators (that are interestingly climate change resilient) to the likelihood of ice-jam floods along different rivers of Quebec [52]. Ice jams may also form against defined ice obstacles that are indirectly dependent or partially related to the channel configuration such as freeze-up consolidations and hanging dams [53] or previous mid-winter ice jams [43].
As mentioned in the methodology section, the approach assumes that the channel characteristics of each river would remain constant in a future climate, and therefore that ice cover mobilization and major ice jam thresholds would remain essentially unchanged. However, the combination of altered hydrological and ice regimes in a warmer climate would probably impact sediment transport and channel stability, e.g., [54], therefore impacting breakup processes. It was already mentioned that climate change could alter site-specific empiricism [11]. Given this limitation, a parametric analysis could be added to reveal if a model provides results that are morphologically sensitive or morphologically robust.
5.3.5. Watershed Evolution
Several factors such as land use changes, forest fires, channels stabilization interventions and hydraulic structures development can affect water levels along a river. Moreover, different types of ice-adapted flood mitigation techniques, e.g., [9,10,55], can reduce the probability or the exposure to floods. This would mean that river ice breakup models would need to be recalibrated to take those changes into account, but most importantly, the results of this type of study should convince stakeholders to take action now in order to reduce future flood risks.
6. Summary
This study has investigated the impact of climate change on the frequency of dynamic breakup events and on the financial risk of ice jam floods for seven rivers located in Quebec, Canada. The methodology involved calibrating river-specific dynamic breakup models using confirmed ice-jam events as well as other relevant ice observations such as ice-cover mobilization thresholds. Results show that the frequency and the risk of ice-jam floods will evolve differently throughout the Province during the period 2042–2070 compared with the reference period of 1972–2000. Generally, the risk, expressed in terms of average annual damage for multiple communities located along each river, will increase by an average of 30% in the future, mostly because of increasingly frequent mid-winter dynamic breakup events during winters that will remain cold enough to produce a thick ice cover. It is of interest to compare those results with the current breakup regime of rivers located in the Northeastern United States, Southern Ontario, and Atlantic Provinces. Future dynamic breakup conditions in Quebec may correspond to what already prevails in these regions.
Several recommendations have been suggested to improve the research methodology. The main recommendation is to validate the performance of hydrological models for runoff events taking place during winter and at spring breakup. It has also been stressed that the increased research and development effort in numerical Newtonian and statistical ice-jam simulations should be matched by an equal effort in field work to develop experience and judgement about breakup process at specific sites or along specific rivers. The results provided in this study are consistent with what was initially expected, and they can already prompt actions for long-term planning in response to future ice jam floods.
Author Contributions
This study was initiated by B.M. and B.T. in 2015. B.M. was the research director, B.T. was the scientific and technical lead and G.P. contributed to most of the future (2042–2070) data analysis. The manuscript, including figures and tables, was prepared by B.T., B.M. and G.P. provided review and editing. All authors have read and agreed to the published version of the manuscript.
Funding
This research was funded by OURANOS (https://www.ouranos.ca/).
Acknowledgments
This paper is part of a CGU-HS CRIPE (Canadian Geophysical Union—Hydrology Section, Committee on River Ice Processes and the Environment) effort to investigate the impact of climate change on ice processes in Canada as well as at the international level. The authors would like to acknowledge the technical support provided by Ouranos (Nathalie Bleau, Marco Braun) between 2016 and 2018 and the crucial collaboration of the MELCC-DEH (Richard Turcotte, Thomas-Charles Fortier-Filion, Charles Malenfant) who provided hydrological simulations outputs. This work was also supported by the MSP (Pascal Marceau, Serge Légaré), who maintains a valuable historical ice-jam data base for the Province of Quebec. Marcel Laganière, an independent reviewer retired from MELCC-DEH, also provided useful comments during the final stage of the project. Finally, Brian C. Burrell completed a constructive review of the manuscript.
Conflicts of Interest
The authors declare no conflict of interest.
References
- Gerard, R.L.; Davar, K.S. Introduction. In River Ice Jams; Beltaos, S., Ed.; Water Resources Publications, LLC: Highlands Ranch, CO, USA, 1995; Chapter 1. [Google Scholar]
- Beltaos, S. Overview of the Breakup Process. In River Ice Breakup; Beltaos, S., Ed.; Water Resources Publications, LLC: Highlands Ranch, CO, USA, 2008; Chapter 3. [Google Scholar]
- Beltaos, S. Ice Jams. In River Ice Breakup; Beltaos, S., Ed.; Water Resources Publications, LLC: Highlands Ranch, CO, USA, 2008; Chapter 7. [Google Scholar]
- Turcotte, B.; Burrell, B.; Beltaos, S. The Impact of Climate Change on Breakup Ice Jams in Canada: State of Knowledge and Research Approaches. In Proceedings of the 20th CGU HS CRIPE Workshop on the Hydraulics of Ice Covered Rivers, Ottawa, ON, Canada, 10–12 July 2019. [Google Scholar]
- She, Y.T.; Andrishak, R.; Hicks, F.; Morse, B.; Stander, E.; Krath, C.; Keller, D.; Abarca, N.; Nolin, S.; Tanekou, F.N.; et al. Athabasca River ice jam formation and release events in 2006 and 2007. Cold Reg. Sci. Technol. 2009, 55, 249–261. [Google Scholar] [CrossRef]
- White, K.D. Breakup Ice Jam Forecasting. In River Ice Breakup; Beltaos, S., Ed.; Water Resources Publications, LLC: Highlands Ranch, CO, USA, 2008; Chapter 10. [Google Scholar]
- Turcotte, B.; Morse, B. River-ice breakup forecast and annual risk distribution in a climate change perspective. In Proceedings of the 18th CGU-HS CRIPE Workshop on the Hydraulics of Ice Covered Rivers, Quebec City, QC, Canada, 18–20 August 2015. [Google Scholar]
- Carr, M.; Vuyovich, C.M.; Tuthill, A.M. Benefit Analysis of Ice Control Structures in Oil City, Pennsylvania. ASCE J. Cold Reg. Eng. 2017, 31, 05016003. [Google Scholar] [CrossRef]
- Tuthill, A.M. River Ice Control. In River Ice Breakup; Beltaos, S., Ed.; Water Resources Publications, LLC: Highlands Ranch, CO, USA, 2008; Chapter 13. [Google Scholar]
- Burrell, B.C. Mitigation. In River Ice Jams; Beltaos, S., Ed.; Water Resources Publications, LLC: Highlands Ranch, CO, USA, 1995; Chapter 7. [Google Scholar]
- Beltaos, S.; Burrell, B.C. Climatic Aspects. In River-Ice Breakup; Beltaos, S., Ed.; Water Resources Publications, LLC: Highlands Ranch, CO, USA, 2008; Chapter 12. [Google Scholar]
- Beltaos, S.; Prowse, T.D. River-ice hydrology in a shrinking cryosphere. Hydrol. Process. 2009, 23, 122–144. [Google Scholar] [CrossRef]
- Milburn, D. The Ice Cycle of Canadian Rivers. In River-Ice Breakup; Beltaos, S., Ed.; Water Resources Publications, LLC: Highlands Ranch, CO, USA, 2008; Chapter 2. [Google Scholar]
- Bush, E.; Lemmen, D.S. (Eds.) Canada’s Changing Climate Report; Government of Canada: Ottawa, ON, Canada, 2019; p. 444. [Google Scholar]
- Beltaos, S.; Burrell, B.C. Climatic change and river-ice breakup. Can. J. Civ. Eng. 2003, 30, 145–155. [Google Scholar] [CrossRef]
- Vincent, L.A.; Zhang, X.; Brown, R.D.; Feng, Y.; Mekis, E.; Milewska, E.J.; Wan, H.; Wang, X.L. Observed Trends in Canada’s Climate and Influence of Low-Frequency Variability Modes. J. Clim. 2015, 28, 4545–4560. [Google Scholar] [CrossRef]
- Magnuson, J.J.; Robertson, D.M.; Wynne, R.H.; Benson, B.J.; Livingstone, D.M.; Arai, T.; Assel, R.A.; Barry, R.D.; Card, V.; Kuusisto, E.; et al. Ice cover phenologies of lakes and rivers in the Northern Hemisphere and climate warming. Science 2000, 289, 1743–1746. [Google Scholar] [CrossRef] [PubMed] [Green Version]
- Hamilton, S. Winter Hydrometry: Real-time data issues. In Proceedings of the 12th CGU-HS CRIPE Workshop on the Hydraulics of Ice Covered Rivers, Edmonton, AB, Canada, 19–20 June 2003. [Google Scholar]
- De Rham, L.; Dibike, Y.; Beltaos, S.; Peters, D.; Bonsal, B.; Prowse, T.D. A Canadian River Ice Database from National Hydrometric Program Archives. Earth Syst. Sci. Data Discuss 2020. [Google Scholar] [CrossRef]
- Anctil, F.; Parent, A.-C. Pour des mesures de conservation et d’utilisation efficace de l’eau adaptables aux changements climatiques pour le bassin versant du Fleuve Saint-Laurent. In Plan D’action sur Les Changements Climatiques 2006–2012; Université Laval: Quebec City, QC, Canada, 2012; p. 191. (In French) [Google Scholar]
- Carr, M.L.; Gaughan, S.P.; George, C.R.; Mason, J.G. CREEL’s Ice Jam Database: Improvements and Updates. In Proceedings of the 18th CGU-HS CRIPE Workshop on the Hydraulics of Ice Covered Rivers, Quebec City, QC, Canada, 18–20 August 2015. [Google Scholar]
- Daly, S.F.; Retired, U.S. Army Corps of Engineers, Cold Regions Research and Engineering Laboratory, Hanover, NH, USA. Personal communication, 2020.
- Garver, J.I. Ice Jam flooding on the lower Mohawk River and the 2018 mid-winter ice jam event. In Proceedings of the 2018 Mohawk Watershed Symposium, Union College, NY, USA, 23 March 2018; Volume 10, pp. 13–18. [Google Scholar]
- Garver, J.I. The 2019 mid-winter ice jam event on the lower Mohawk River, New York. In Proceedings of the 2019 Mohawk Watershed Symposium, Union College, NY, USA, 22 March 2019; Volume 11, pp. 12–17. [Google Scholar]
- Carr, M.L.; Vuyovich, C.M. Investigating the effects of long-term hydro-climatic trends on Midwest ice-jam events. Cold Reg. Sci. Technol. 2014, 106–107, 66–81. [Google Scholar] [CrossRef]
- Pietroniro, A.; Fortin, V.; Kouwen, N.; Neal, C.; Turcotte, R.; Davison, B.; Verseghy, D.; Soulis, E.D.; Caldwell, R.; Evora, N.; et al. Development of the MESH modelling system for hydrological ensemble forecasting of the Laurentian Great Lakes at the regional scale, Hydrol. Earth Syst. Sci. 2007, 11, 1279–1294. [Google Scholar] [CrossRef] [Green Version]
- Lindenschmidt, K.-E. RIVICE—A Non-Proprietary, Open-Source, One-Dimensional River-Ice Model. Water 2017, 9, 314. [Google Scholar] [CrossRef]
- Das, A.; Rokaya, P.; Lindenschmidt, K.-E. Assessing the impact of climate change on ice jams long the Athabasca River at Fort McMurray, Alberta, Canada. In Proceedings of the 19th CGU-HS CRIPE Workshop on the Hydraulics of Ice Covered Rivers, Whitehorse, YT, Canada, 9–12 July 2017. [Google Scholar]
- Das, A.; Rokaya, P.; Lindenschmidt, K.-L. Ice-Jam Flood Risk Assessment and Hazard Mapping under Future Climate. J. Water Resour. Plann. Manag. 2020, 146, 40220029. [Google Scholar] [CrossRef]
- Rokaya, P.; Morales-Marín, L.; Bonsal, B.; Wheater, H.; Lindenschmidt, K.-L. Climatic effects on ice phenology and ice-jam flooding of the Athabasca River in western Canada. Hydrol. Sci. J. 2019, 64, 1265–1278. [Google Scholar] [CrossRef]
- Marsh, C.B.; Pomeroy, J.W.; Wheater, H.S. The Canadian Hydrological Model (CHM) v1.0: A multi-scale, multi-extent, variable-complexity hydrological model—Design and overview. Geosci. Model Dev. 2020, 13, 225–247. [Google Scholar] [CrossRef] [Green Version]
- Gaborit, É.; Fortin, V.; Xu, X.; Seglenieks, F.; Tolson, B.; Fry, L.M.; Hunter, T.; Anctil, F.; Gronewold, A.D. A hydrological prediction system based on the SVS land-surface scheme: Efficient calibration of GEM-Hydro for streamflow simulation over the Lake Ontario basin. Hydrol. Earth Syst. Sci. 2017, 21, 4825–4839. [Google Scholar] [CrossRef] [Green Version]
- Craig, J.R.; Brown, G.; Chlumsky, R.; Jenkinson, R.W.; Jost, G.; Lee, K.; Mai, J.; Serrere, M.; Sgro, N.; Shafii, M.; et al. Flexible watershed simulation with the Raven hydrological modelling framework. Environ. Model. Softw. 2020, 129, 104728. [Google Scholar] [CrossRef]
- Fortin, J.P.; Turcotte, R.; Massicotte, S.; Moussa, R.; Fitzback, J.; Villeneuve, J.P. A Distributed watershed model compatible with remote sensing and GIS data. Part 1: Description of the model. J. Hydrol. Eng. Am. Soc. Civ. Eng. 2001, 6, 91–99. [Google Scholar]
- U.S. Army Corps Engineers (USACE). HEC-RAS River Analysis System, Hydraulic Reference Manual; CPD-69; U.S. Army Corps Engineers (USACE): Washington, DC, USA, 2016.
- Aaltonen, J.; Huokuna, M. Flood mapping of river-ice breakup jams in River Kyrönjoki delta. In Proceedings of the 19th CGU-HS CRIPE Workshop on the Hydraulics of Ice Covered Rivers, Whitehorse, YT, Canada, 9–12 July 2017. [Google Scholar]
- Carson, R.; Beltaos, S.; Groeneveld, J.; Healy, D.; She, Y.; Malenchak, J.; Morris, M.; Saucet, J.-P.; Kolerski, T.; Shen, H.T. Comparative testing of numerical models of river ice jams. Can. J. Civ. Eng. 2011, 38, 669–678. [Google Scholar] [CrossRef]
- Tolszczuk-Leclerc, S.; Muise, P.; Gauthier, Y. Proposal for a National Ice Jam Database Model. In Proceedings of the CGU HS Committee on River Ice Processes and the Environment 20th Workshop on the Hydraulics of Ice Covered Rivers, Ottawa, ON, Canada, 14–16 May 2019. [Google Scholar]
- Bonnifait, L. Développement de courbes submersion-dommages pour l’habitat résidentiel québécois. Master’s Thesis, Université du Québec INRS-ÉTÉ, Quebec City, QC, Canada, 2005. [Google Scholar]
- Bilello, M.A. Maximum Thickness and Subsequent Decay of Lake, River and Fast Sea Ice in Canada and Alaska; Report 80-6; U.S. Army, Cold Regions Research and Engineering Laboratory: Hanover, NH, USA, 1980; p. 160. [Google Scholar]
- Centre d’expertise hydrique du Québec (CEHQ). Atlas hydroclimatique du Québec Méridional—Impact des Changements Climatiques sur Les Régimes de Crue, D’étiage et D’hydraulicité à L’horizon 2050; Ministère de l’Environnement et de la Lutte contre les Changements Climatiques: Quebec City, QC, Canada, 2015; p. 81.
- Mpelasoka, F.S.; Chiew, F.H.S. Influence of rainfall scenario construction methods on runoff projections. J. Hydrometeorol. 2009, 10, 1168–1183. [Google Scholar] [CrossRef]
- Beltaos, S.; Burrell, B.C. Hydroclimatic aspects of ice jam flooding near Perth-Andover, New Brunswick. Can. J. Civ. Eng. 2015, 42, 686–695. [Google Scholar] [CrossRef]
- Pomeroy, J.W.; Shook, K.; Fang, X.; Brown, T.; Marsh, C. Development of a Snowmelt Runoff Model for the Lower Smoky River, Centre for Hydrology Report: Report No. 13; Centre for Hydrology, University of Saskatchewan: Saskatoon, SK, Canada, 2013. [Google Scholar]
- Burrell, B.C. Introduction. In River Ice Breakup; Beltaos, S., Ed.; Water Resources Publications, LLC: Highlands Ranch, CO, USA, 2008; Chapter 1. [Google Scholar]
- Nolin, S.; Pelletier, P.; Groux, F. Stress-Resistance Approach to Assess the Ice-Jam Flood Risk. In Proceedings of the 20th CGU HS CRIPE Workshop on the Hydraulics of Ice Covered Rivers, Ottawa, ON, USA, 10–12 July 2019. [Google Scholar]
- Turcotte, B.; Morse, B. A global river ice classification model. J. Hydrol. 2013, 507, 134–148. [Google Scholar] [CrossRef]
- Prowse, T.D. River ice processes. In River Ice Jams; Beltaos, S., Ed.; Water Resources Publications: Highland Ranch, CO, USA, 1995; Chapter 2. [Google Scholar]
- Turcotte, B.; Morse, B.; Anctil, F. Impacts of precipitation on the cryologic regime of stream channels. Hydrol. Process. 2012, 26, 2653–2662. [Google Scholar] [CrossRef]
- Ashton, G.D.; Beltaos, S. Thermal growth of ice cover. In River Ice Formation; Beltaos, S., Ed.; Committee on River Ice Processes and the Environment, Canadian Geophysical Union, Hydrology Section: Edmonton, AB, Canada, 2013; Chapter 8. [Google Scholar]
- Hicks, F.E.; Cui, W.; Ashton, G.D. Heat Transfer and Ice Cover Decay. In River-Ice Breakup; Beltaos, S., Ed.; Water Resources Publications: Highlands Ranch, CO, USA, 2008; Chapter 4. [Google Scholar]
- De Munck, S.; Gauthier, Y.; Bernier, M.; Chokmani, K.; Légaré, S. River predisposition to ice jams: A simplified geospatial model. Nat. Hazards Earth Syst. Sci. 2017, 17, 1033–1047. [Google Scholar] [CrossRef] [Green Version]
- Beltaos, S. Freezeup jamming and formation of ice cover. In River Ice Formation; Beltaos, S., Ed.; Committee on River Ice Processes and the Environment, Canadian Geophysical Union, Hydrology Section: Edmonton, AB, Canada, 2013; Chapter 7. [Google Scholar]
- Turcotte, B.; Morse, B.; Bergeron, N.E.; Roy, A.G. Sediment transport in ice-affected rivers. J. Hydrol. 2011, 409, 561–577. [Google Scholar] [CrossRef]
- Beltaos, S.; Doyle, P.E. Ice jam mitigation using setback dikes: Cold River at Merritt, B.C. J. Cold Reg. Eng. 1996, 10, 190–206. [Google Scholar] [CrossRef]
Figure 1.
Location, watershed area and dominant flow direction of the seven rivers included in the study.
Figure 1.
Location, watershed area and dominant flow direction of the seven rivers included in the study.

Figure 2.
River-ice breakup model for the winter (left) and spring (right) periods for the Chaudière River. White diamonds are confirmed ice-jam events and black dots are peak flows associated with significant runoff events between 1972 and 2000.
Figure 2.
River-ice breakup model for the winter (left) and spring (right) periods for the Chaudière River. White diamonds are confirmed ice-jam events and black dots are peak flows associated with significant runoff events between 1972 and 2000.

Figure 3.
(A) Hydrometeorological data of winter 1985–1986 on the Chaudière River applied to the breakup model, including the reported ice jam of 27 January 1986 and (B) Data from the corresponding simulation of scenario MPI-ESM-LR RCP4.5 for winter 2055–2056.
Figure 3.
(A) Hydrometeorological data of winter 1985–1986 on the Chaudière River applied to the breakup model, including the reported ice jam of 27 January 1986 and (B) Data from the corresponding simulation of scenario MPI-ESM-LR RCP4.5 for winter 2055–2056.

Figure 4.
Weekly probability of dynamic breakup events for the reference period (black, 1972–2000) and for different future (2042–2070) climate scenarios for the (A) Chaudière and (B) Châteauguay Rivers. The dotted lines present the raw data, whereas the thick lines present a smoothened curve, a running average that is adapted for consistent transitions from one scenario to the next.

Figure 5.
Frequency of dynamic breakup events (upper graph) and risk (AAD) associated with ice-jam floods (lower graph) expressed as a function of air temperature warming (historical conditions are presented in black and future climate scenarios in colors) for the (A) Châteauguay River, (B) Chaudière River, and (C) Mistassini River.

Figure 6.
Summary of the frequency of dynamic breakup per year and of the annual risk (AAD) associated with ice jam floods for each studied river. The black data set represents the historical period, and the yellow, orange and red data sets represent different averaged temperature-change intensities.

Figure 7.
Spatial results showing a decline (green), stable conditions (yellow) or a rise (red) in the risk of ice-jam floods along seven rivers (here shown as watersheds) of Quebec.
Figure 7.
Spatial results showing a decline (green), stable conditions (yellow) or a rise (red) in the risk of ice-jam floods along seven rivers (here shown as watersheds) of Quebec.


Table 1.
List of the seven rivers with their respective studied extent, average slope, reference meteorological and hydrometric stations as well as average peak flow factor.
Table 1.
List of the seven rivers with their respective studied extent, average slope, reference meteorological and hydrometric stations as well as average peak flow factor.
| River | River Extent (km) | Average Slope | Upstream and Downstream Municipality | Federal Meteorological Station ID | Provincial Hydrometric Station ID | Peak Flow Factor |
|---|---|---|---|---|---|---|
| L’Assomption | 100 | 0.19% | St. Côme to Joliette | 7014160 | 052219 | 1.10 |
| Châteauguay | 60 | 0.05% | Huntington to Châteauguay | 702S006 | 030905 | 1.15 |
| St. François | 200 | 0.12% | Weedon to Pierreville | 7022160 | 030208 | 1.15 |
| Chaudière | 150 | 0.16% | St. Ludger to St. Lambert | 7028754 | 023429 | 1.25 |
| Matapédia | 70 | 0.19% | Causapscal to Matapédia | 7051200 | 011509 | 1.05 |
| Matane | 30 | 0.12% | St. René de Matane to Matane | 7057395 | 021601 | 1.15 |
| Mistassini | 70 | 0.12% | Notre-Dame-De-Lorette to Dolbeau-Mistassini | 7065960 | 062102 | 1.05 |
Table 2.
Ice cover mobilization threshold, winter and spring runoff events over 29 winters (all runoff events and confirmed ice jams, both data sets presented in Figure 2), probable and confirmed dynamic breakup events (selected runoff events in the yellow and red zones) and average annual breakup frequency for each studied river.
| Rivers | Breakup Threshold | Total Winter and Spring Runoff Events | Selected Breakup Events | Frequency (Breakup Events/Year) |
|---|---|---|---|---|
| L’Assomption | 35 m3/s | 173 | 37 | 1.3 |
| Châteauguay | 80 m3/s | 350 | 87 | 3.0 |
| St. François | 300 m3/s | 568 | 74 | 2.6 |
| Chaudière | 100 m3/s | 338 | 95 | 3.3 |
| Matapédia | 40 m3/s | 143 | 66 | 2.3 |
| Matane | 40 m3/s | 289 | 58 | 2.0 |
| Mistassini | 300 m3/s | 202 | 38 | 1.3 |
Table 3.
Range of average rise in winter and spring air temperatures for each river based on Model-RCP combinations.
Table 3.
Range of average rise in winter and spring air temperatures for each river based on Model-RCP combinations.
| Emission Scenario | Projected Rise in Winter and Spring Air Temperatures | |
|---|---|---|
| Climate Model | Representative Concentration Pathway | |
| MPI-ESM-LR | RCP 4.5 | 2.1–3.0 °C |
| ACCESS1-3 | RCP 4.5 | |
| CMCC-CMS | RCP 4.5 | |
| MPI-ESM-LR | RCP 8.5 | 3.3–4.0 °C |
| BNU-ESM | RCP 8.5 | |
| CMCC-CMS | RCP 8.5 | |
| MIROC5 | RCP 8.5 | 4.8–6.0 °C |
| MIROC-ESM-CHEM | RCP 4.5 | |
| MIROC-ESM-CHEM | RCP 8.5 | |
Table 4.
Future (2042–2070) winter and spring runoff events over 29 winters for 9 climate scenarios, and probable (selected) dynamic breakup events for each studied river.
Table 4.
Future (2042–2070) winter and spring runoff events over 29 winters for 9 climate scenarios, and probable (selected) dynamic breakup events for each studied river.
| River | Total Winter and Spring Runoff Events | Selected Breakup Events |
|---|---|---|
| L’Assomption | 919 | 253 |
| Châteauguay | 2833 | 537 |
| St. François | 2387 | 434 |
| Chaudière | 3011 | 839 |
| Matapédia | 721 | 334 |
| Matane | 852 | 283 |
| Mistassini | 1148 | 356 |
Table 5.
Damage values or equations associated with dynamic breakup events (including one or multiple simultaneous ice jams for a given runoff event) for each studied river. The last column represents the total cost of ice-jam floods for each river for the period of 1991 to 2014 divided by the calculated potential cost (using the previous two columns) of all the dynamic breakup events during the same period.
| Value or Equation of the Damage Associated with a Dynamic Breakup Event (CAD) | Confirmed vs. Potential AAD Ratio | ||
|---|---|---|---|
| River | Yellow Zone | Red Zone | |
| L’Assomption | 5600 | 8875 (Q) − 890,000 | 81% |
| Châteauguay | 26,500 | 265,000 | 28% |
| St. François | 20,000 | 0.26 (Q2) + 73.5 (Q) − 100,000 | 42% |
| Chaudière | 10,000 | 1.97 (Q2) + 1107.1 (Q) − 500,000 | 16% |
| Matapédia | 1010.5 (Q) − 50,000 | 24% | |
| Matane | 190,500 | 47% | |
| Mistassini | 2.2016 (10−20) (Q7.978) | 24% | |
| 0 | 0.721 (Q2) − 770.6 (Q) + 200,000 | 17% | |
| 25,000 | 250,000 | 28% | |
Table 6.
Annual average damage (AAD) associated with ice-jam floods for the historical period (1972–2000 or 1982–2010), based on 1991–2014 MSP data for each studied river. All the values are expressed in 2017 CAD.
Table 6.
Annual average damage (AAD) associated with ice-jam floods for the historical period (1972–2000 or 1982–2010), based on 1991–2014 MSP data for each studied river. All the values are expressed in 2017 CAD.
| River | Historical AAD (CAD/Year) |
|---|---|
| L’Assomption | 220,000 |
| Châteauguay | 150,000 |
| St. François | 350,000 |
| Chaudière | 890,000 |
| Matapédia | 180,000 |
| Matane | 180,000 |
| Mistassini | 180,000 |
| Total (7 rivers) | 2,150,000 |
Publisher’s Note: MDPI stays neutral with regard to jurisdictional claims in published maps and institutional affiliations. |
© 2020 by the authors. Licensee MDPI, Basel, Switzerland. This article is an open access article distributed under the terms and conditions of the Creative Commons Attribution (CC BY) license (http://creativecommons.org/licenses/by/4.0/).
Share and Cite
MDPI and ACS Style
Turcotte, B.; Morse, B.; Pelchat, G. Impact of Climate Change on the Frequency of Dynamic Breakup Events and on the Risk of Ice-Jam Floods in Quebec, Canada. Water 2020, 12, 2891. https://doi.org/10.3390/w12102891
AMA Style
Turcotte B, Morse B, Pelchat G. Impact of Climate Change on the Frequency of Dynamic Breakup Events and on the Risk of Ice-Jam Floods in Quebec, Canada. Water. 2020; 12(10):2891. https://doi.org/10.3390/w12102891
Chicago/Turabian StyleTurcotte, Benoit, Brian Morse, and Gabriel Pelchat. 2020. "Impact of Climate Change on the Frequency of Dynamic Breakup Events and on the Risk of Ice-Jam Floods in Quebec, Canada" Water 12, no. 10: 2891. https://doi.org/10.3390/w12102891
Note that from the first issue of 2016, this journal uses article numbers instead of page numbers. See further details here.