Analyzing the Dependence of Major Tanks in the Headwaters of the Aruvi Aru Catchment on Precipitation. Applying Drought Indices to Meteorological and Hydrological Data


Abstract
:1. Introduction
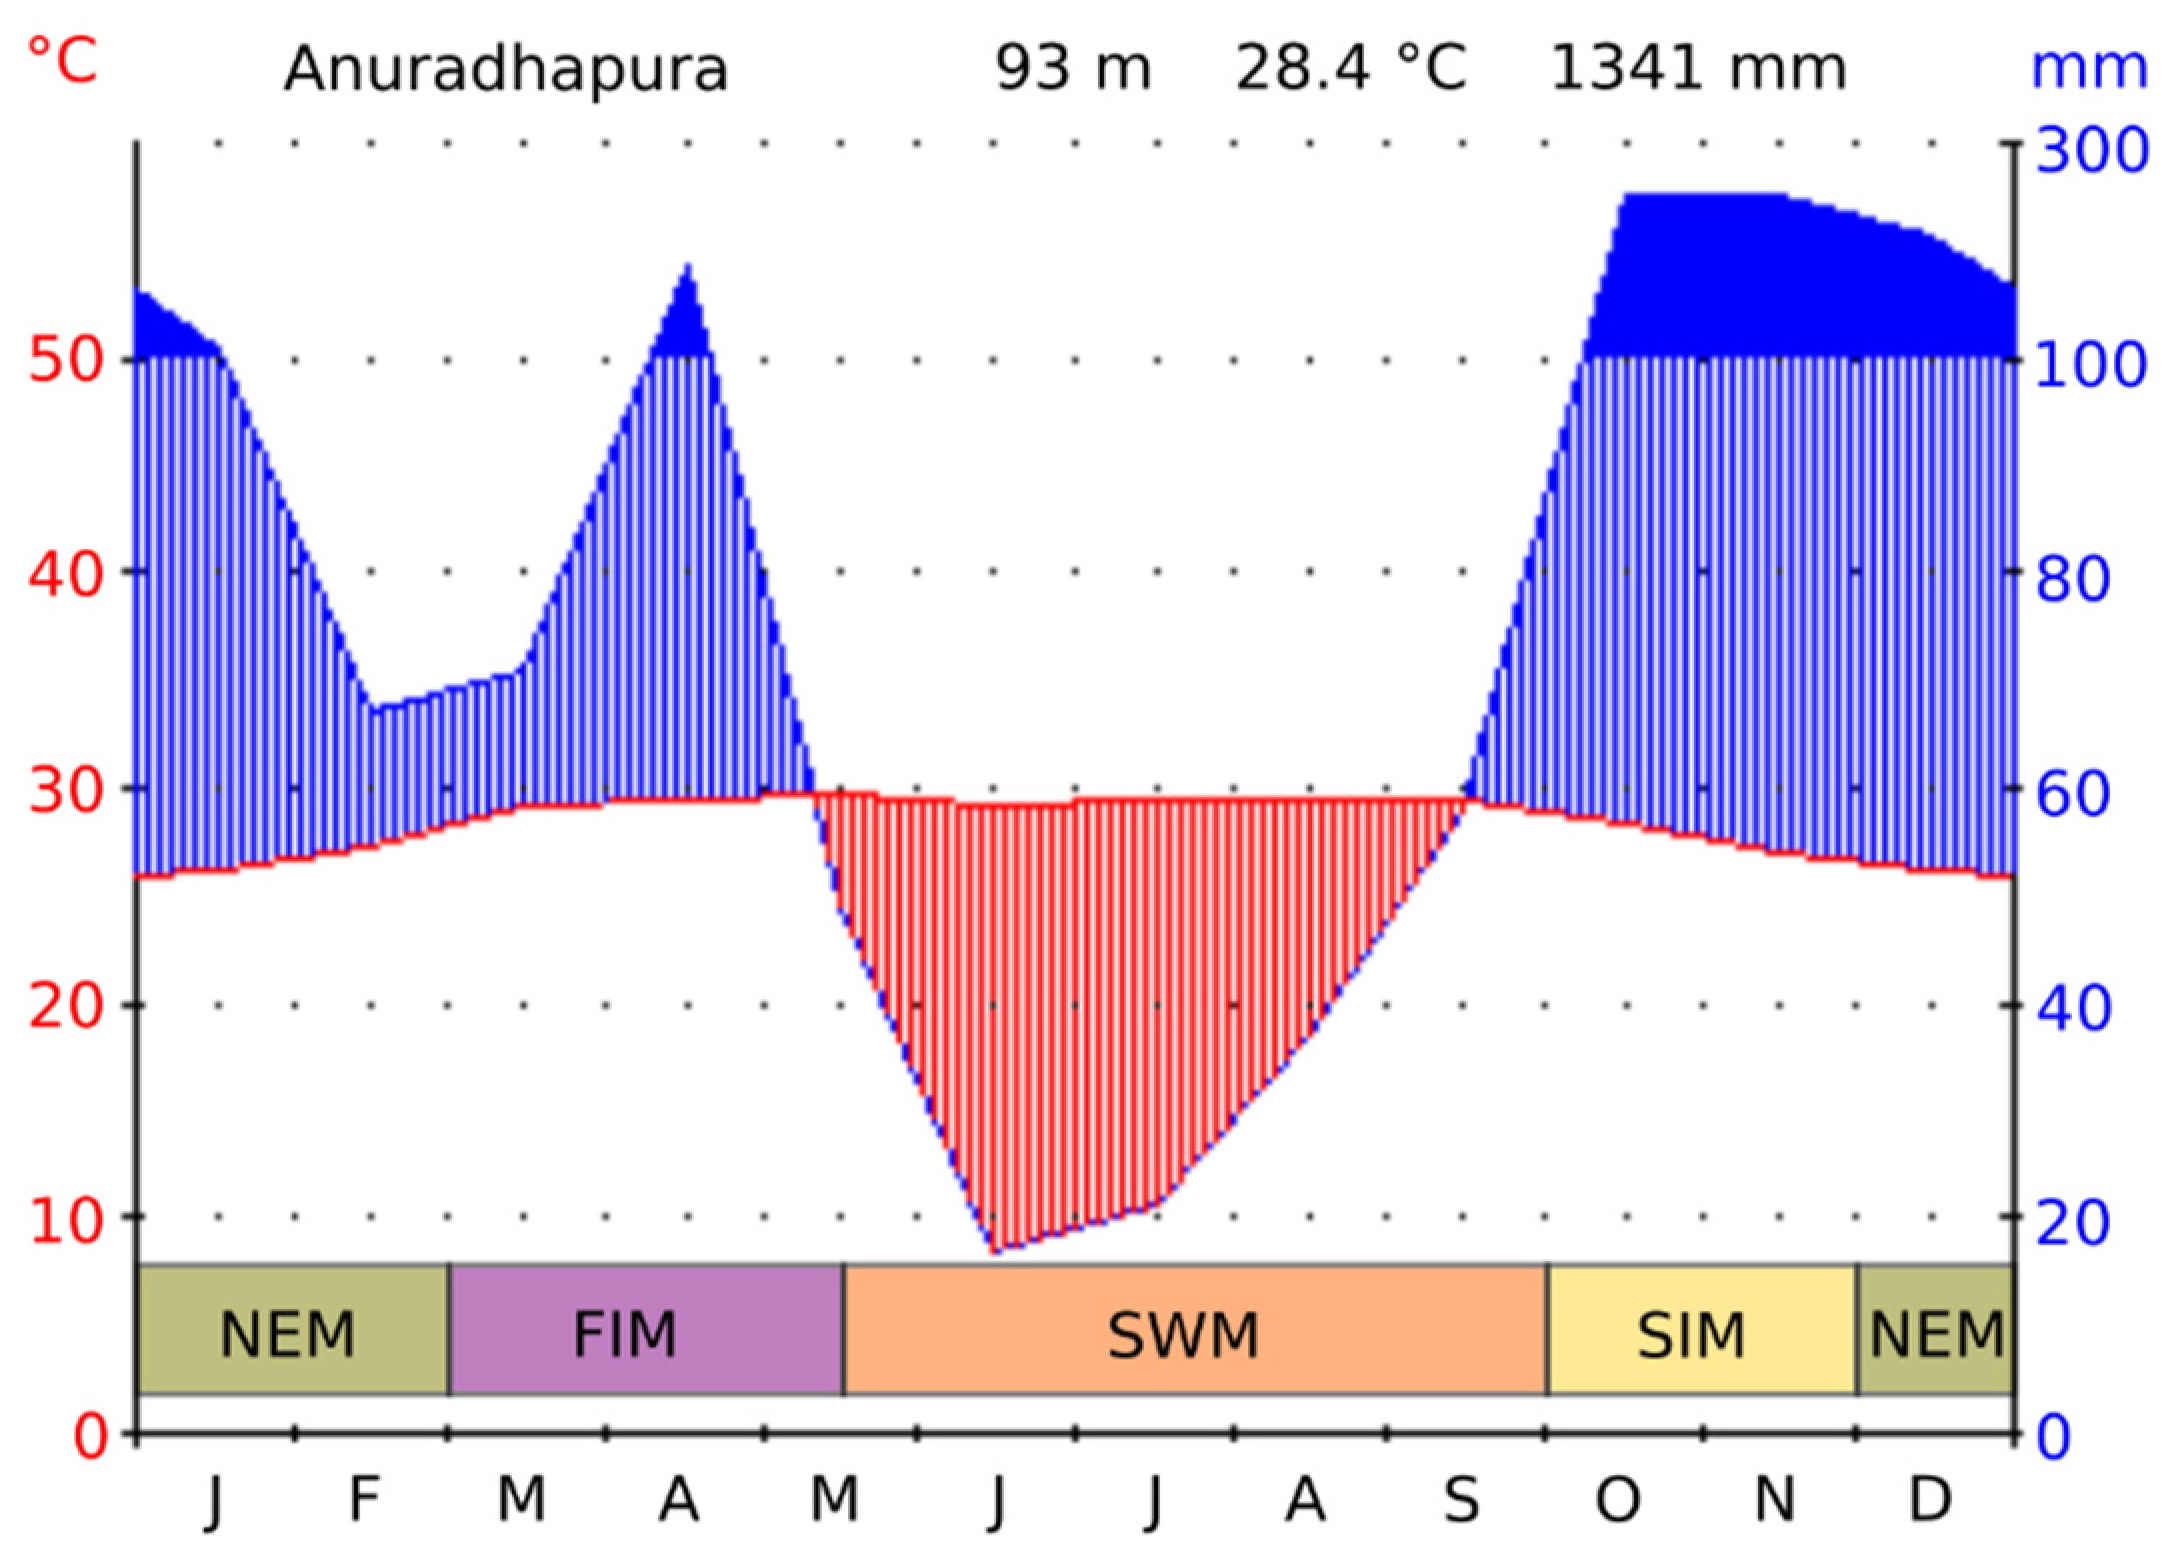
2. Study Area
3. Materials and Methods
- Calculation of the climatic drought index (standardized precipitation index—SPI [24]) to identify droughts and humid periods;
- Calculation of a hydrological drought index from data on the water level of tanks (standardized water-level index—SWLI), to characterize phases of high and low water-level conditions;
- Testing the degree of relation between both indices by applying correlation approaches.
3.1. Data Basis
3.2. Standardized Precipitation Index (SPI)
3.3. Standardized Water-Level Index (SWLI)
3.4. Comparison of Standadized Precipitation Index (SPI) and Standadized Water-Level Index (SWLI) Data
- (a)
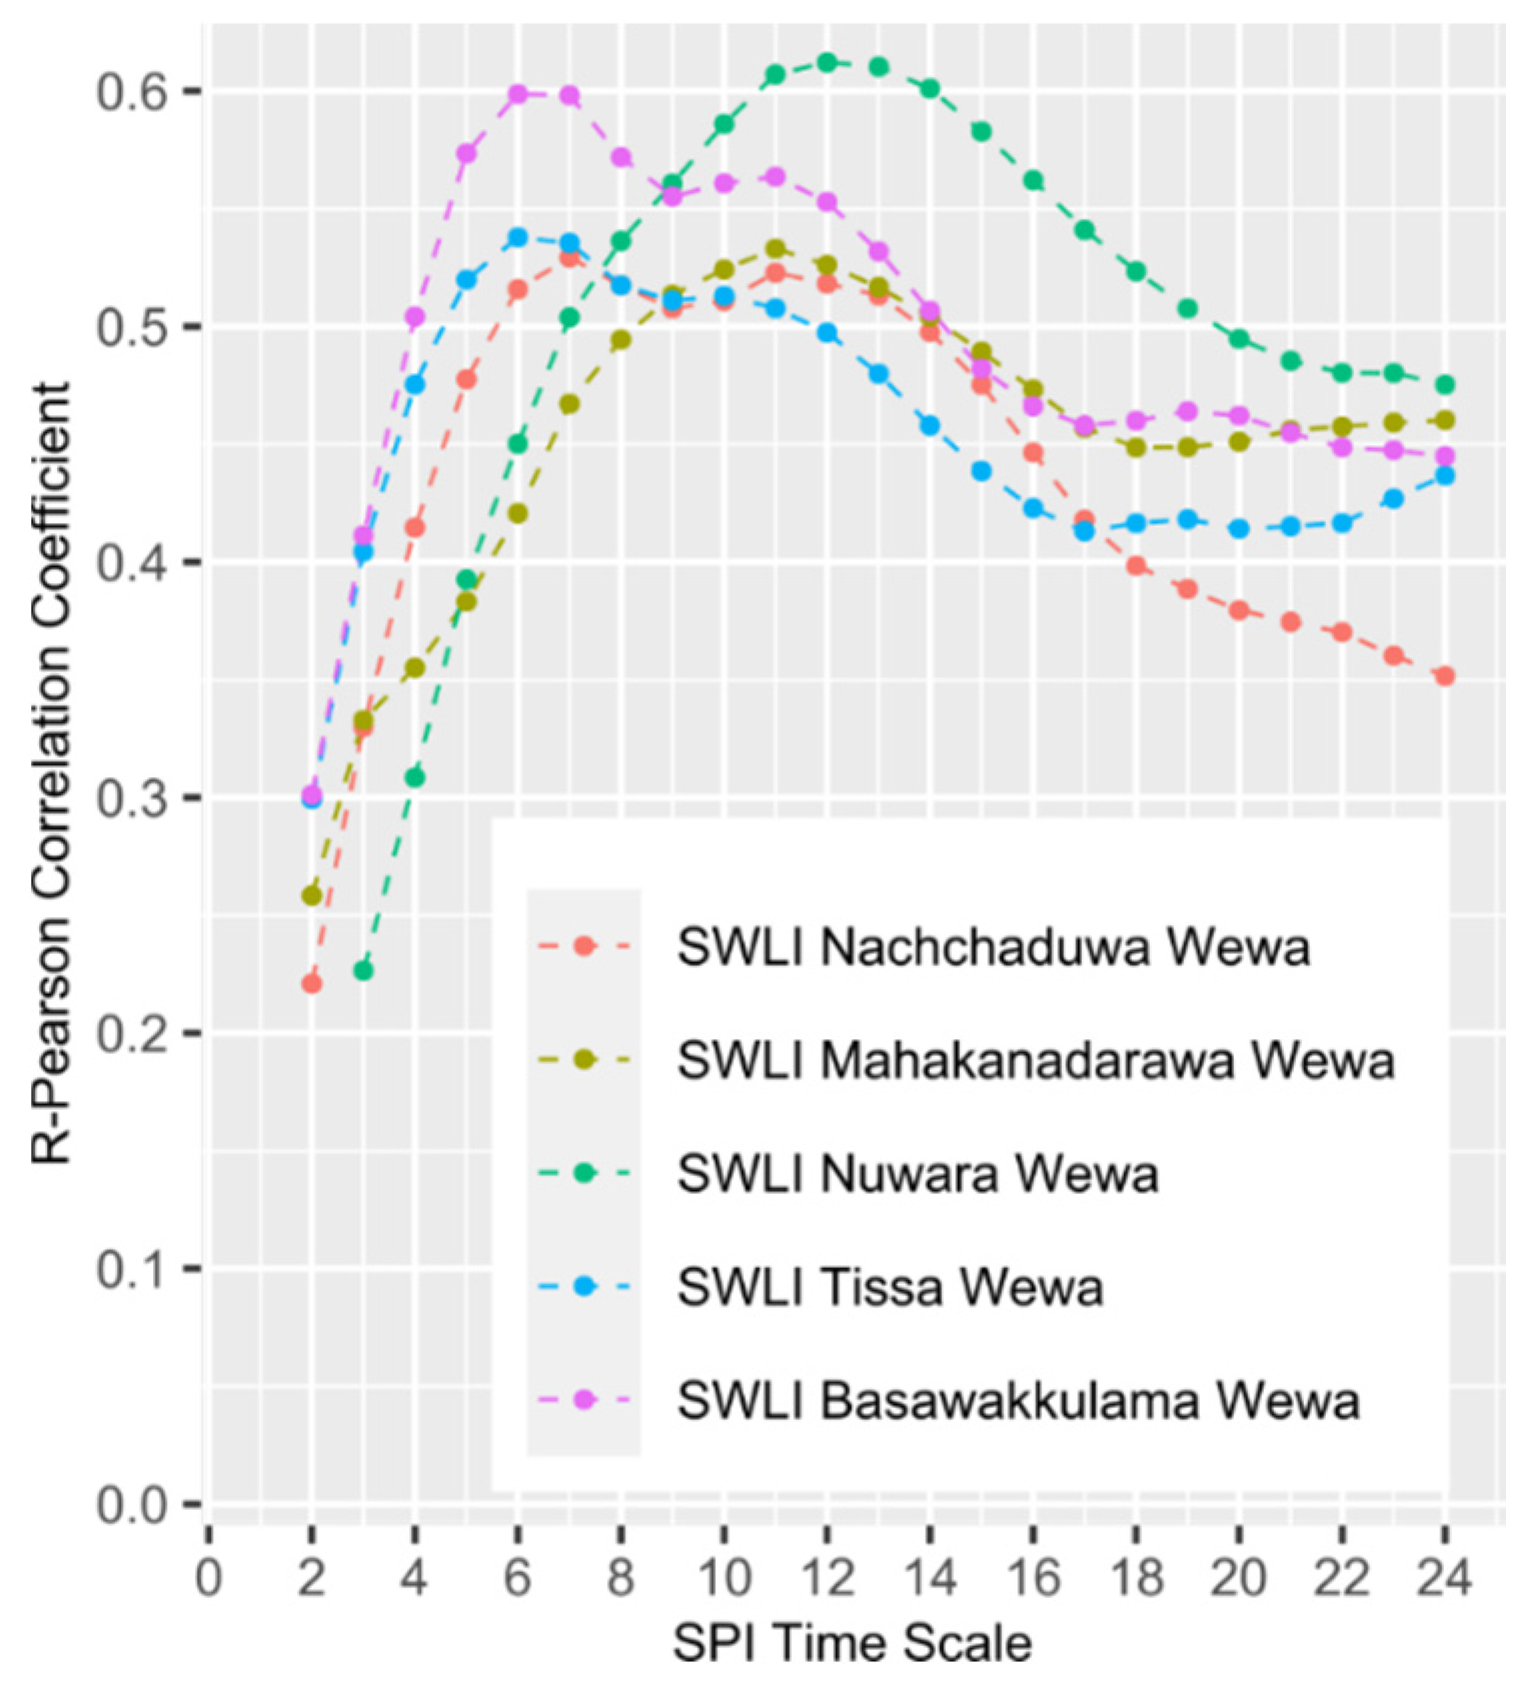
- Correlation of the SPI data as an independent variable at time scales (1–24 months) with SWLI data as a dependent variable at the time scale of 1 month.
- (b)
- For the assessment of seasonal correlation patterns a moving window correlation approach was applied to each tank, correlating the best fitting SPI time scale (determined by applying the correlation approach (a)) with the SWLI. As the methodological approach is precipitation driven, the chosen moving window is season based and splits the year into arid (May–September) and humid (October–April) seasons. The aim of this subdivision is to assess the impact of rainfall seasonality on water-level changes (SWLI). The seasonal moving window correlation was applied to both indices for 44 seasons throughout the whole observation period.
4. Results
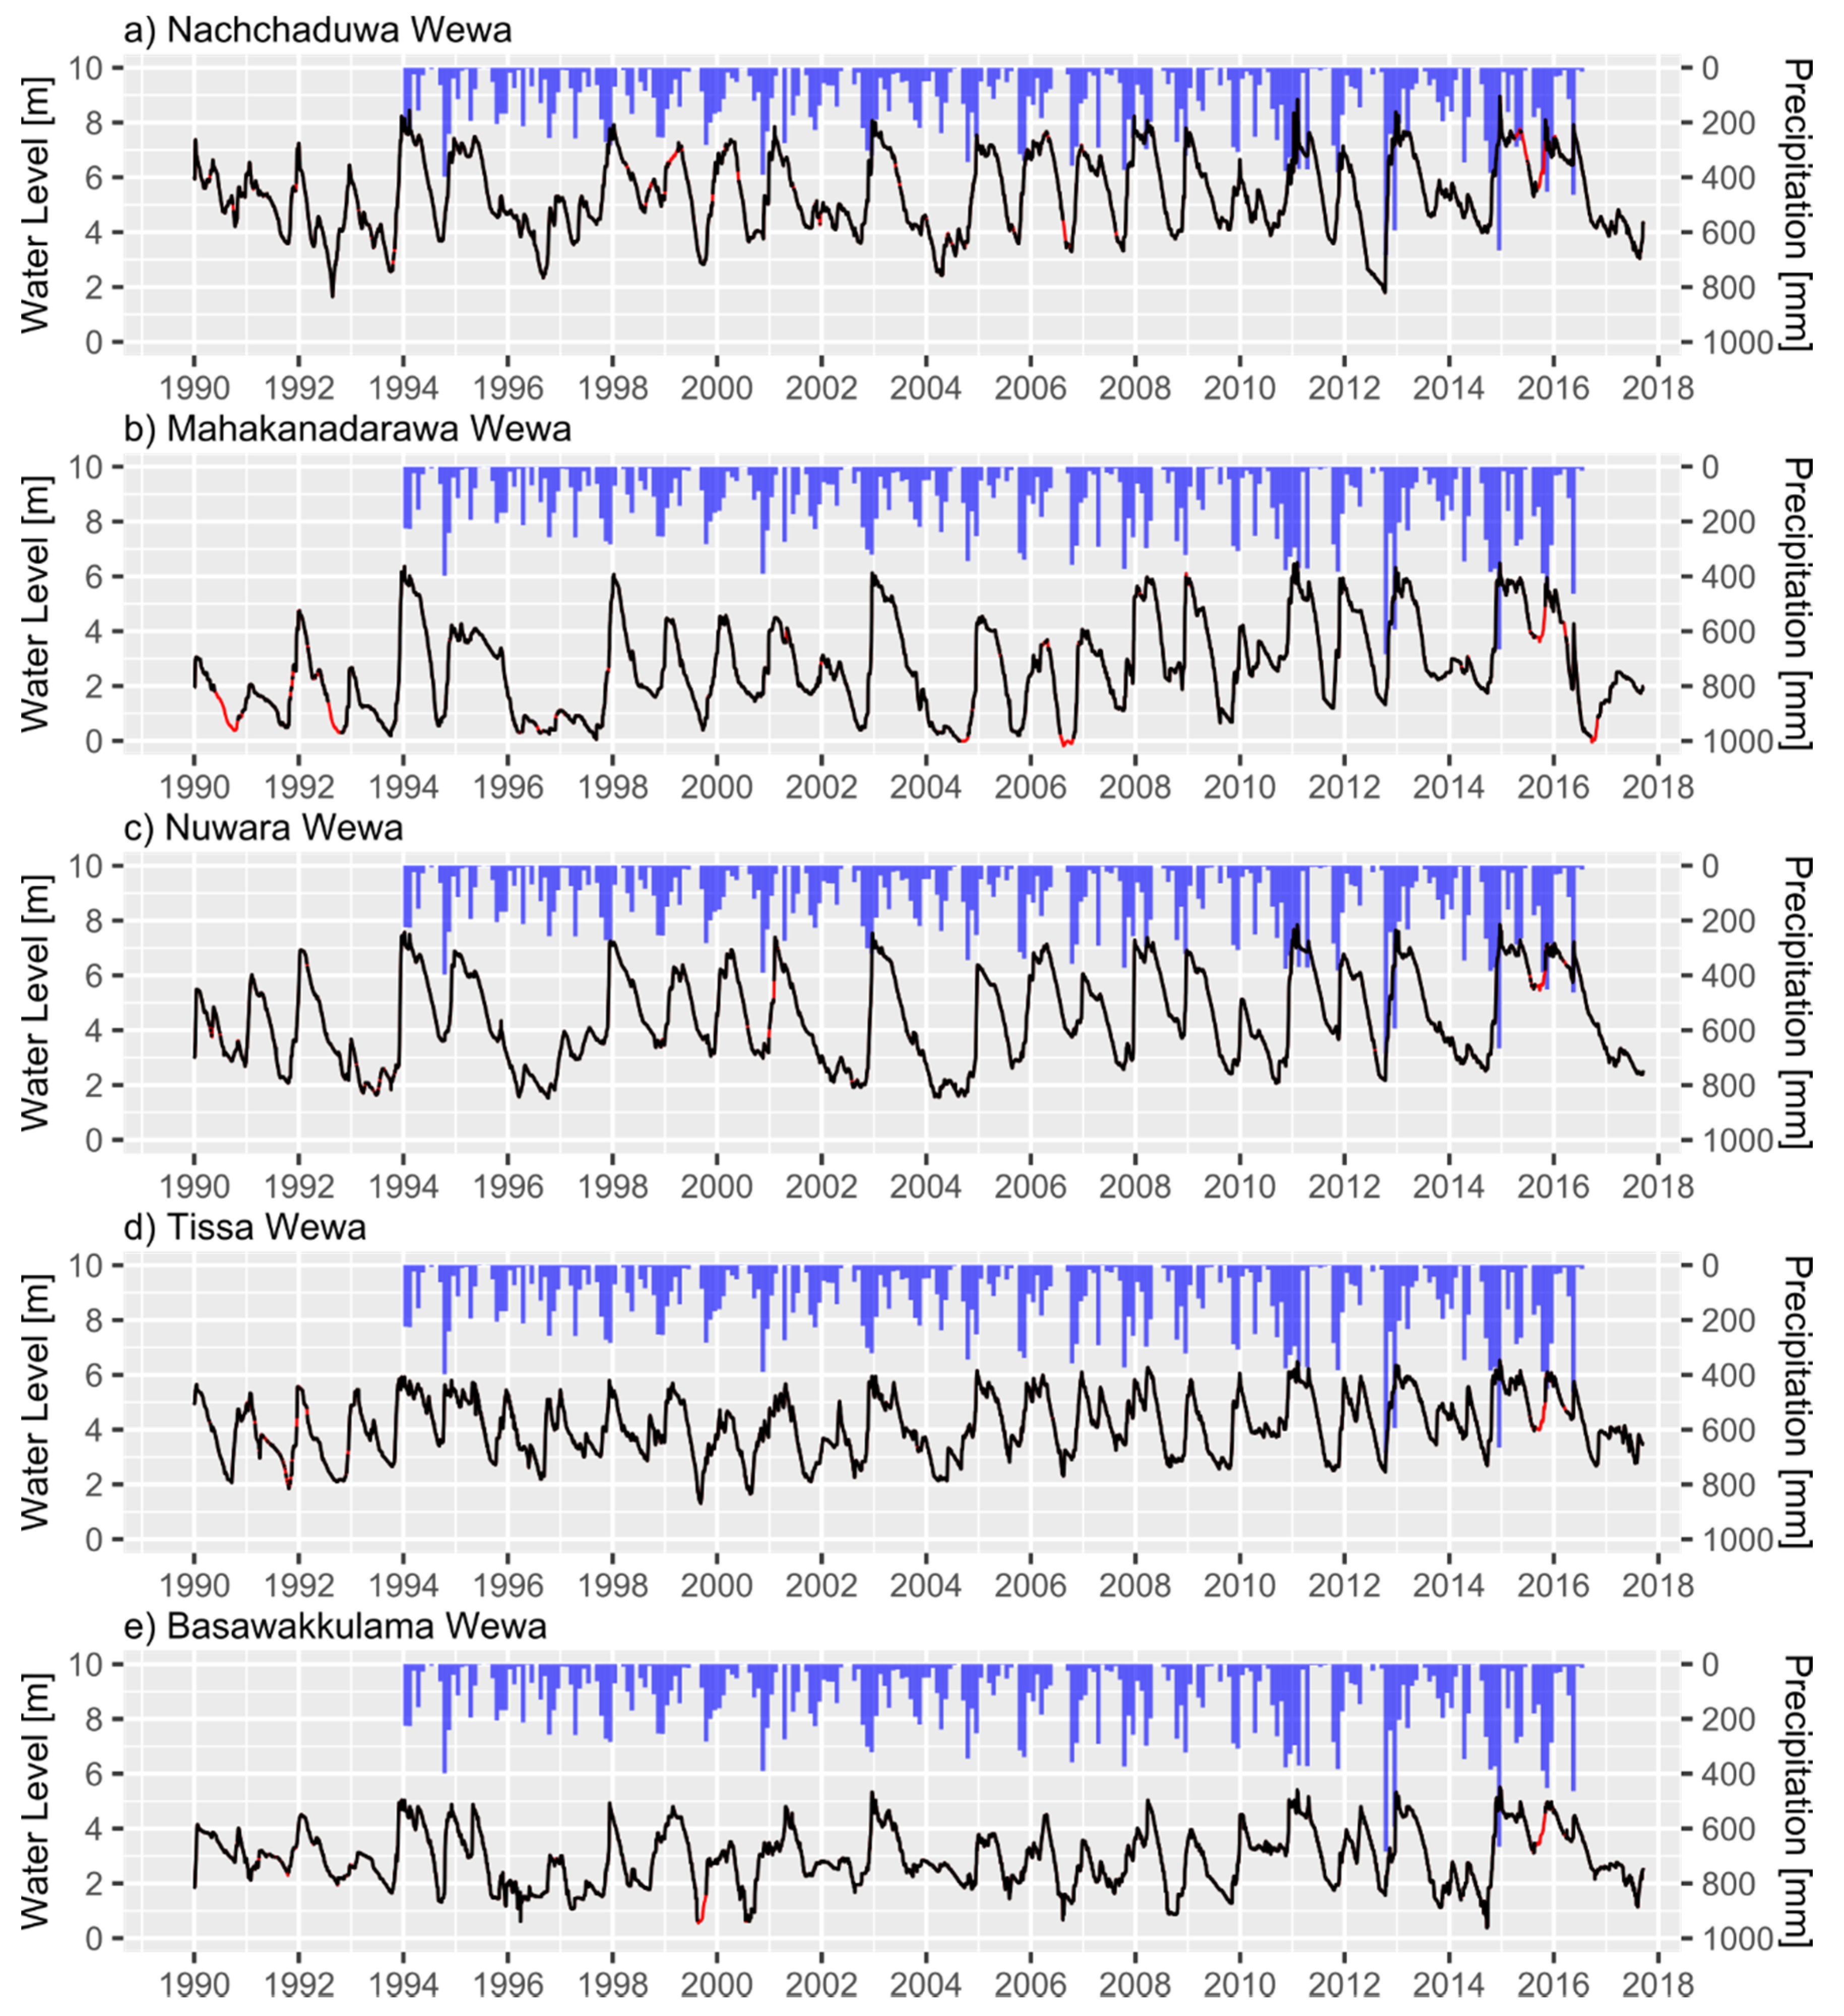
4.1. Water-Level Data for Major Tanks
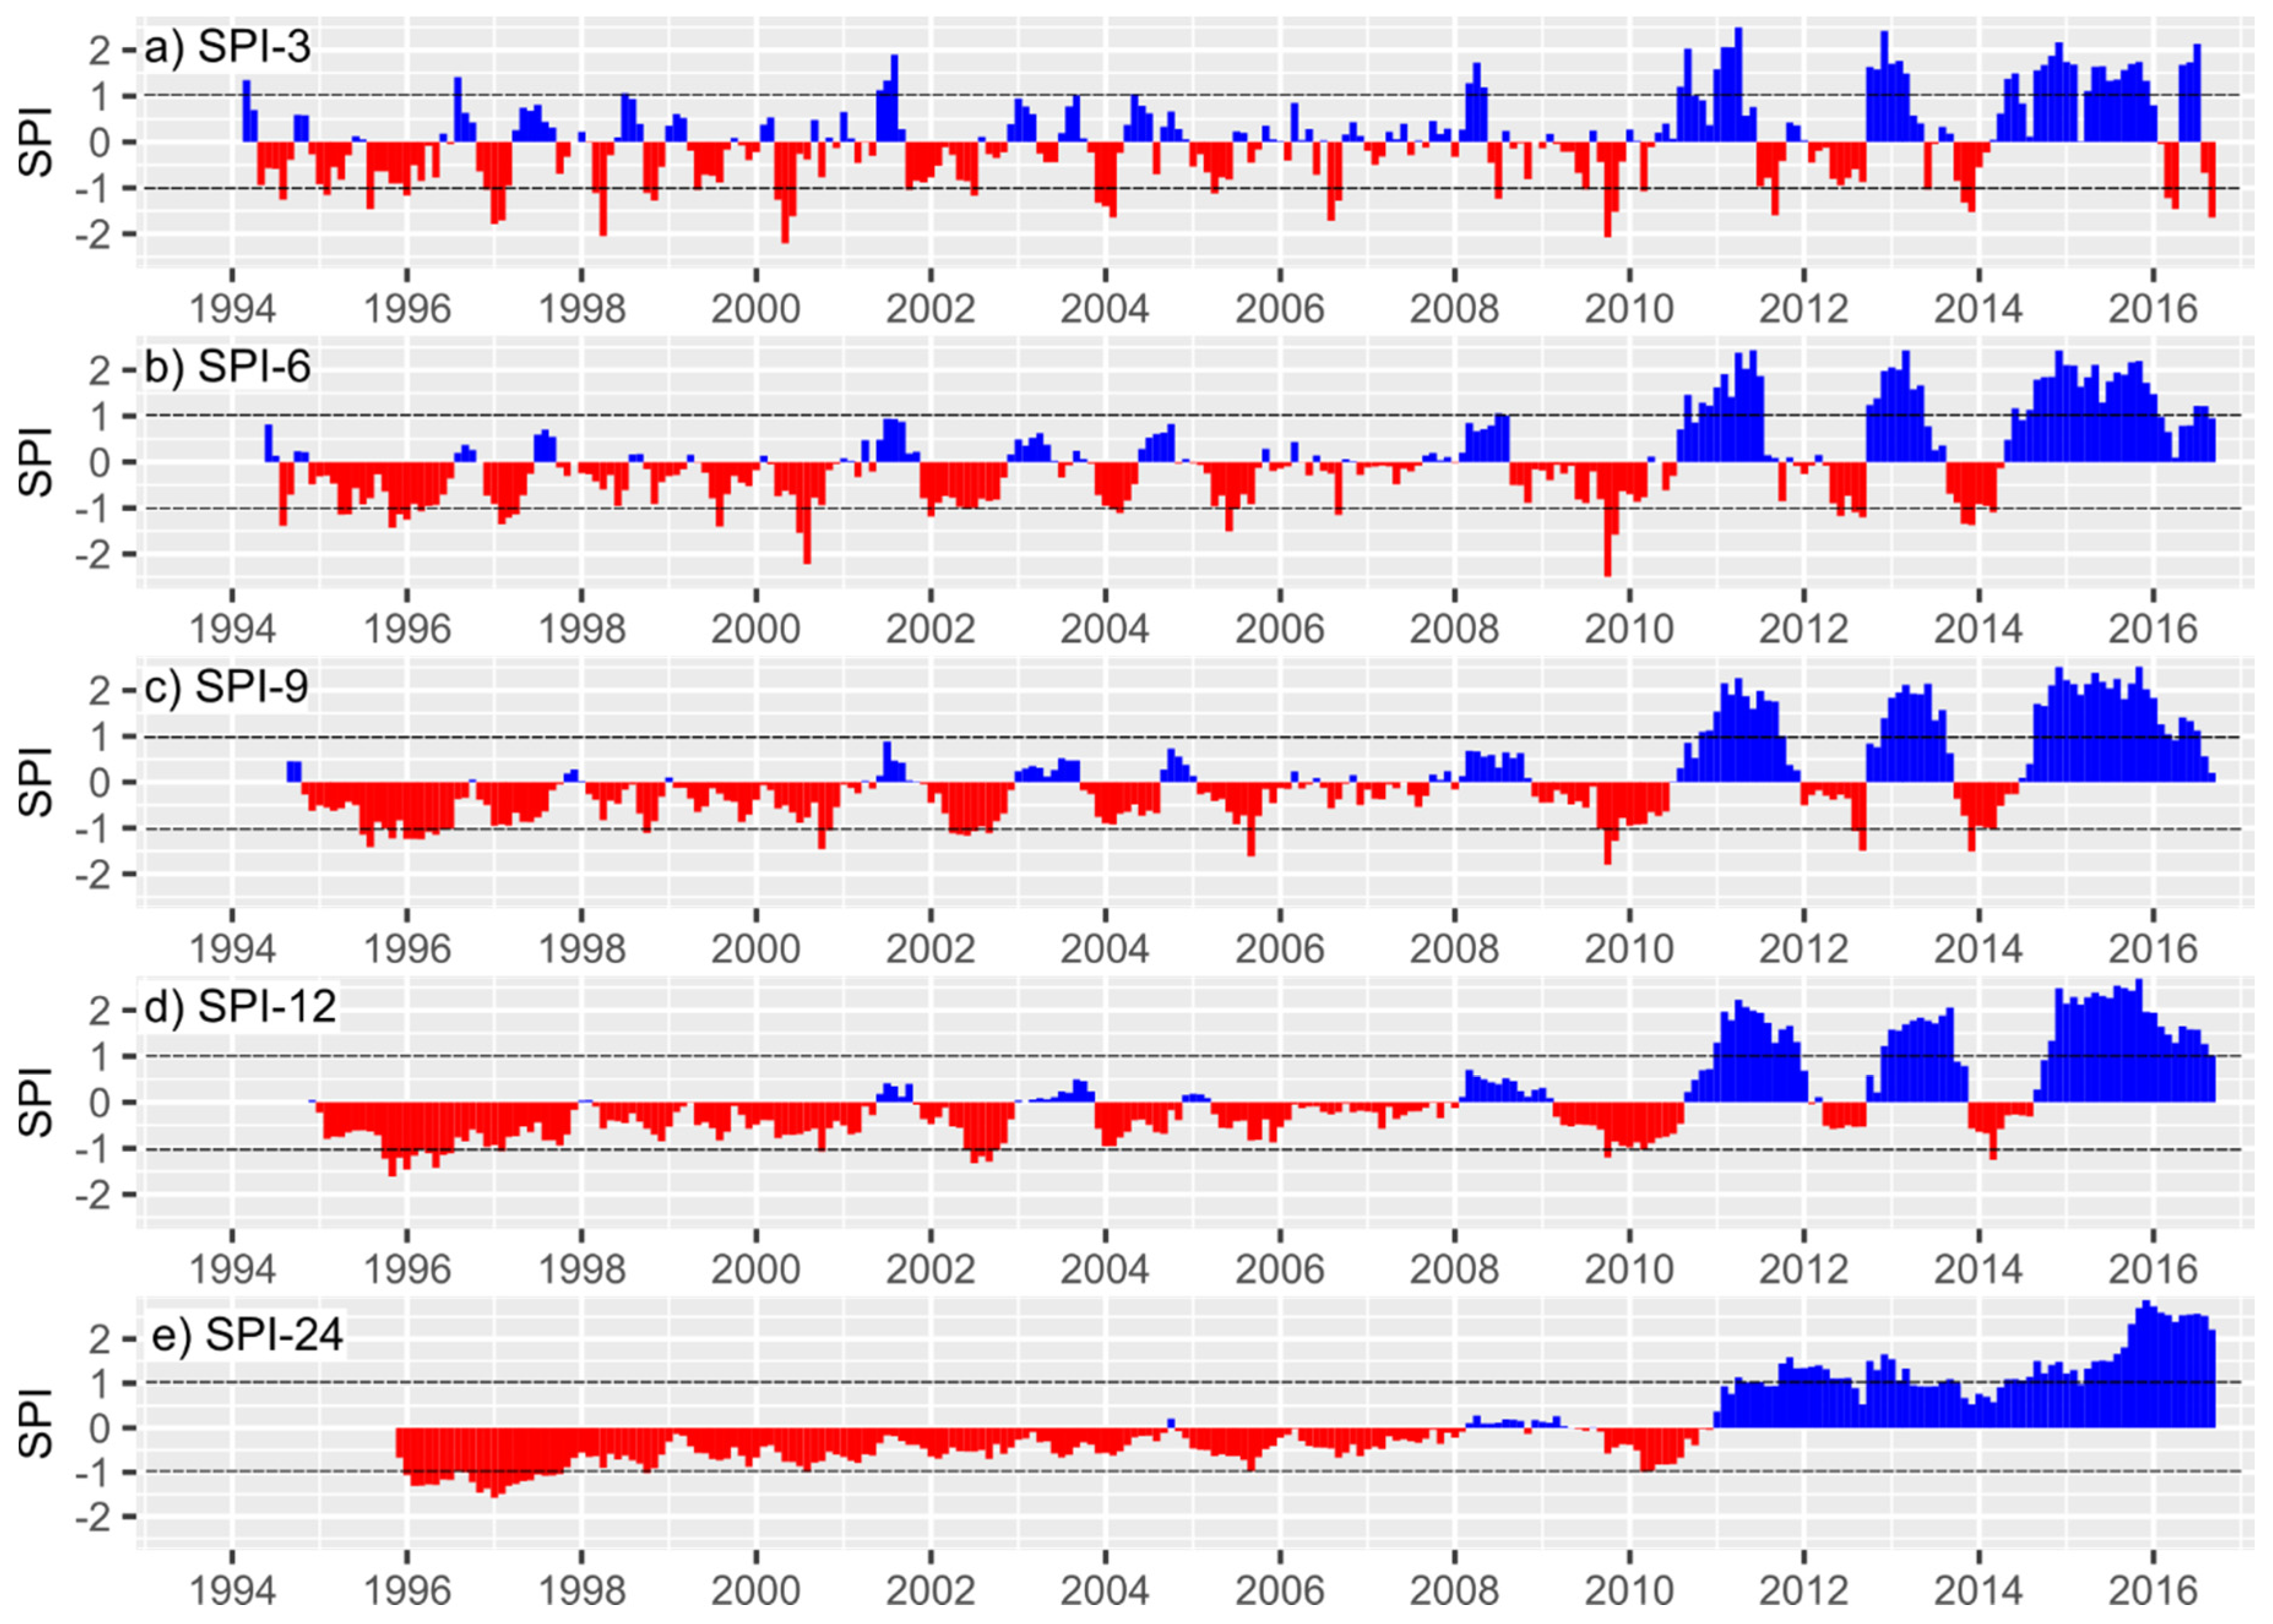
4.2. Standardized Precipitation Index (SPI)
- For SPI-3 (3-month time scale) 78 alternating periods of positive and negative SPI values are observed, with a mean duration of 3.5 months for periods with negative SPI values and 3.4 months for periods with positive SPI values; 46 of the observed 78 periods belong to the category near normal conditions.
- For SPI-6 (6-month time scale) 51 alternating periods of positive and negative SPI values are observed, with a mean duration of 6.3 months for periods with negative SPI values and 4.3 months for periods with positive SPI values; 35 of the observed 51 periods belong to the category near normal conditions.
- For SPI-9 (9-month time scale) 31 alternating periods of positive and negative SPI values are observed, with a mean duration of 10.9 months for periods with negative SPI values and 6.3 months for periods with positive SPI values; 20 of the observed 31 periods belong to the category near normal conditions.
- For SPI-12 (12-month time scale) 19 alternating periods of positive and negative SPI values are observed, with a mean duration of 18.8 months for periods with negative SPI values and 9.3 months for periods with positive SPI values; 11 of the observed 19 periods belong to the category near normal conditions.
- For SPI-24 (24-month time scale) ten alternating periods of positive and negative SPI values are observed, with a mean duration of 33 months for periods with negative SPI values and 17 months for periods with positive SPI values; eight of the observed ten periods belong to the category near normal conditions.
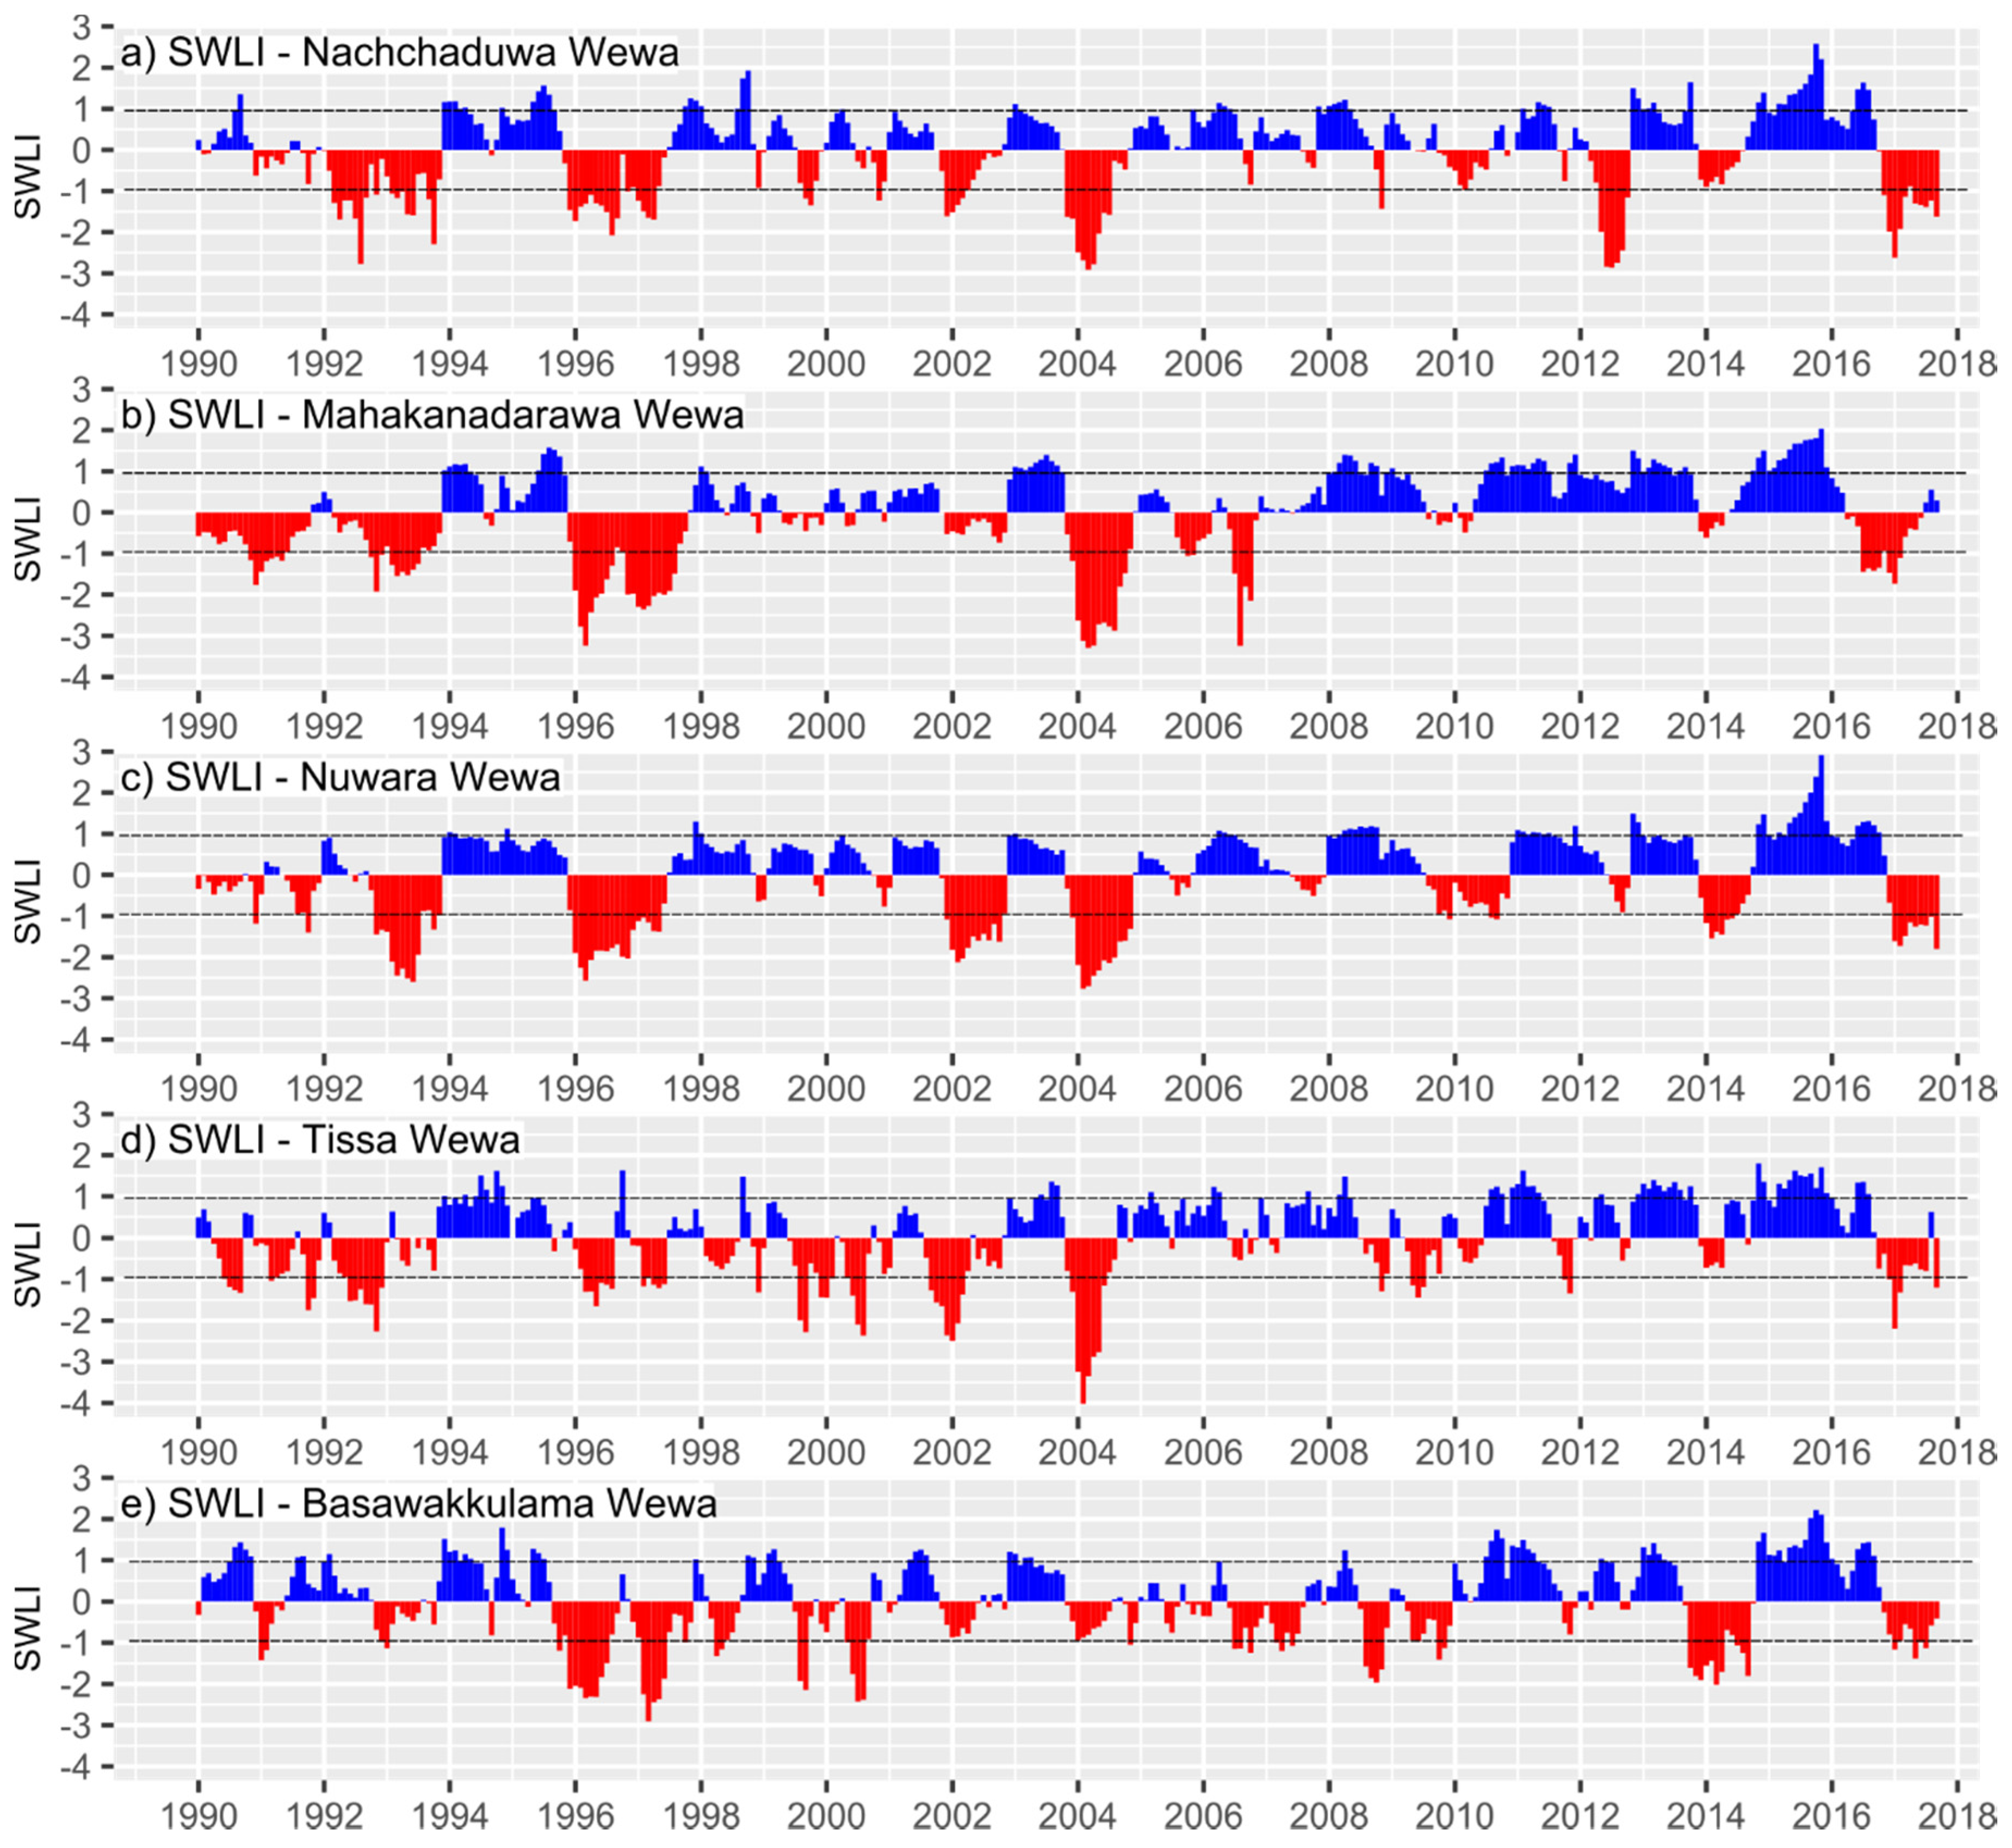
4.3. Standardized Water-Level Index (SWLI)
- (a)
- Between 1990 and 1994, periods characterized by low water levels predominate; the only exception is the water level of Basawakkulama tank.
- (b)
- Between late 1995 and 1997 extreme low water levels occurred at Nachchaduwa, Mahakanadarawa and Nuwara Wewa. The water level of Basawakkulama Wewa was also extremely low during this period, although from September to October 1996 near normal water levels could be observed.
- (c)
- The most extreme low water-level period was observed in 2004, affecting all major tanks included in the investigation except Basawakkulama Wewa.
- (d)
- At the turn of the year 2016-17 another low water-level period could be observed at all tanks.
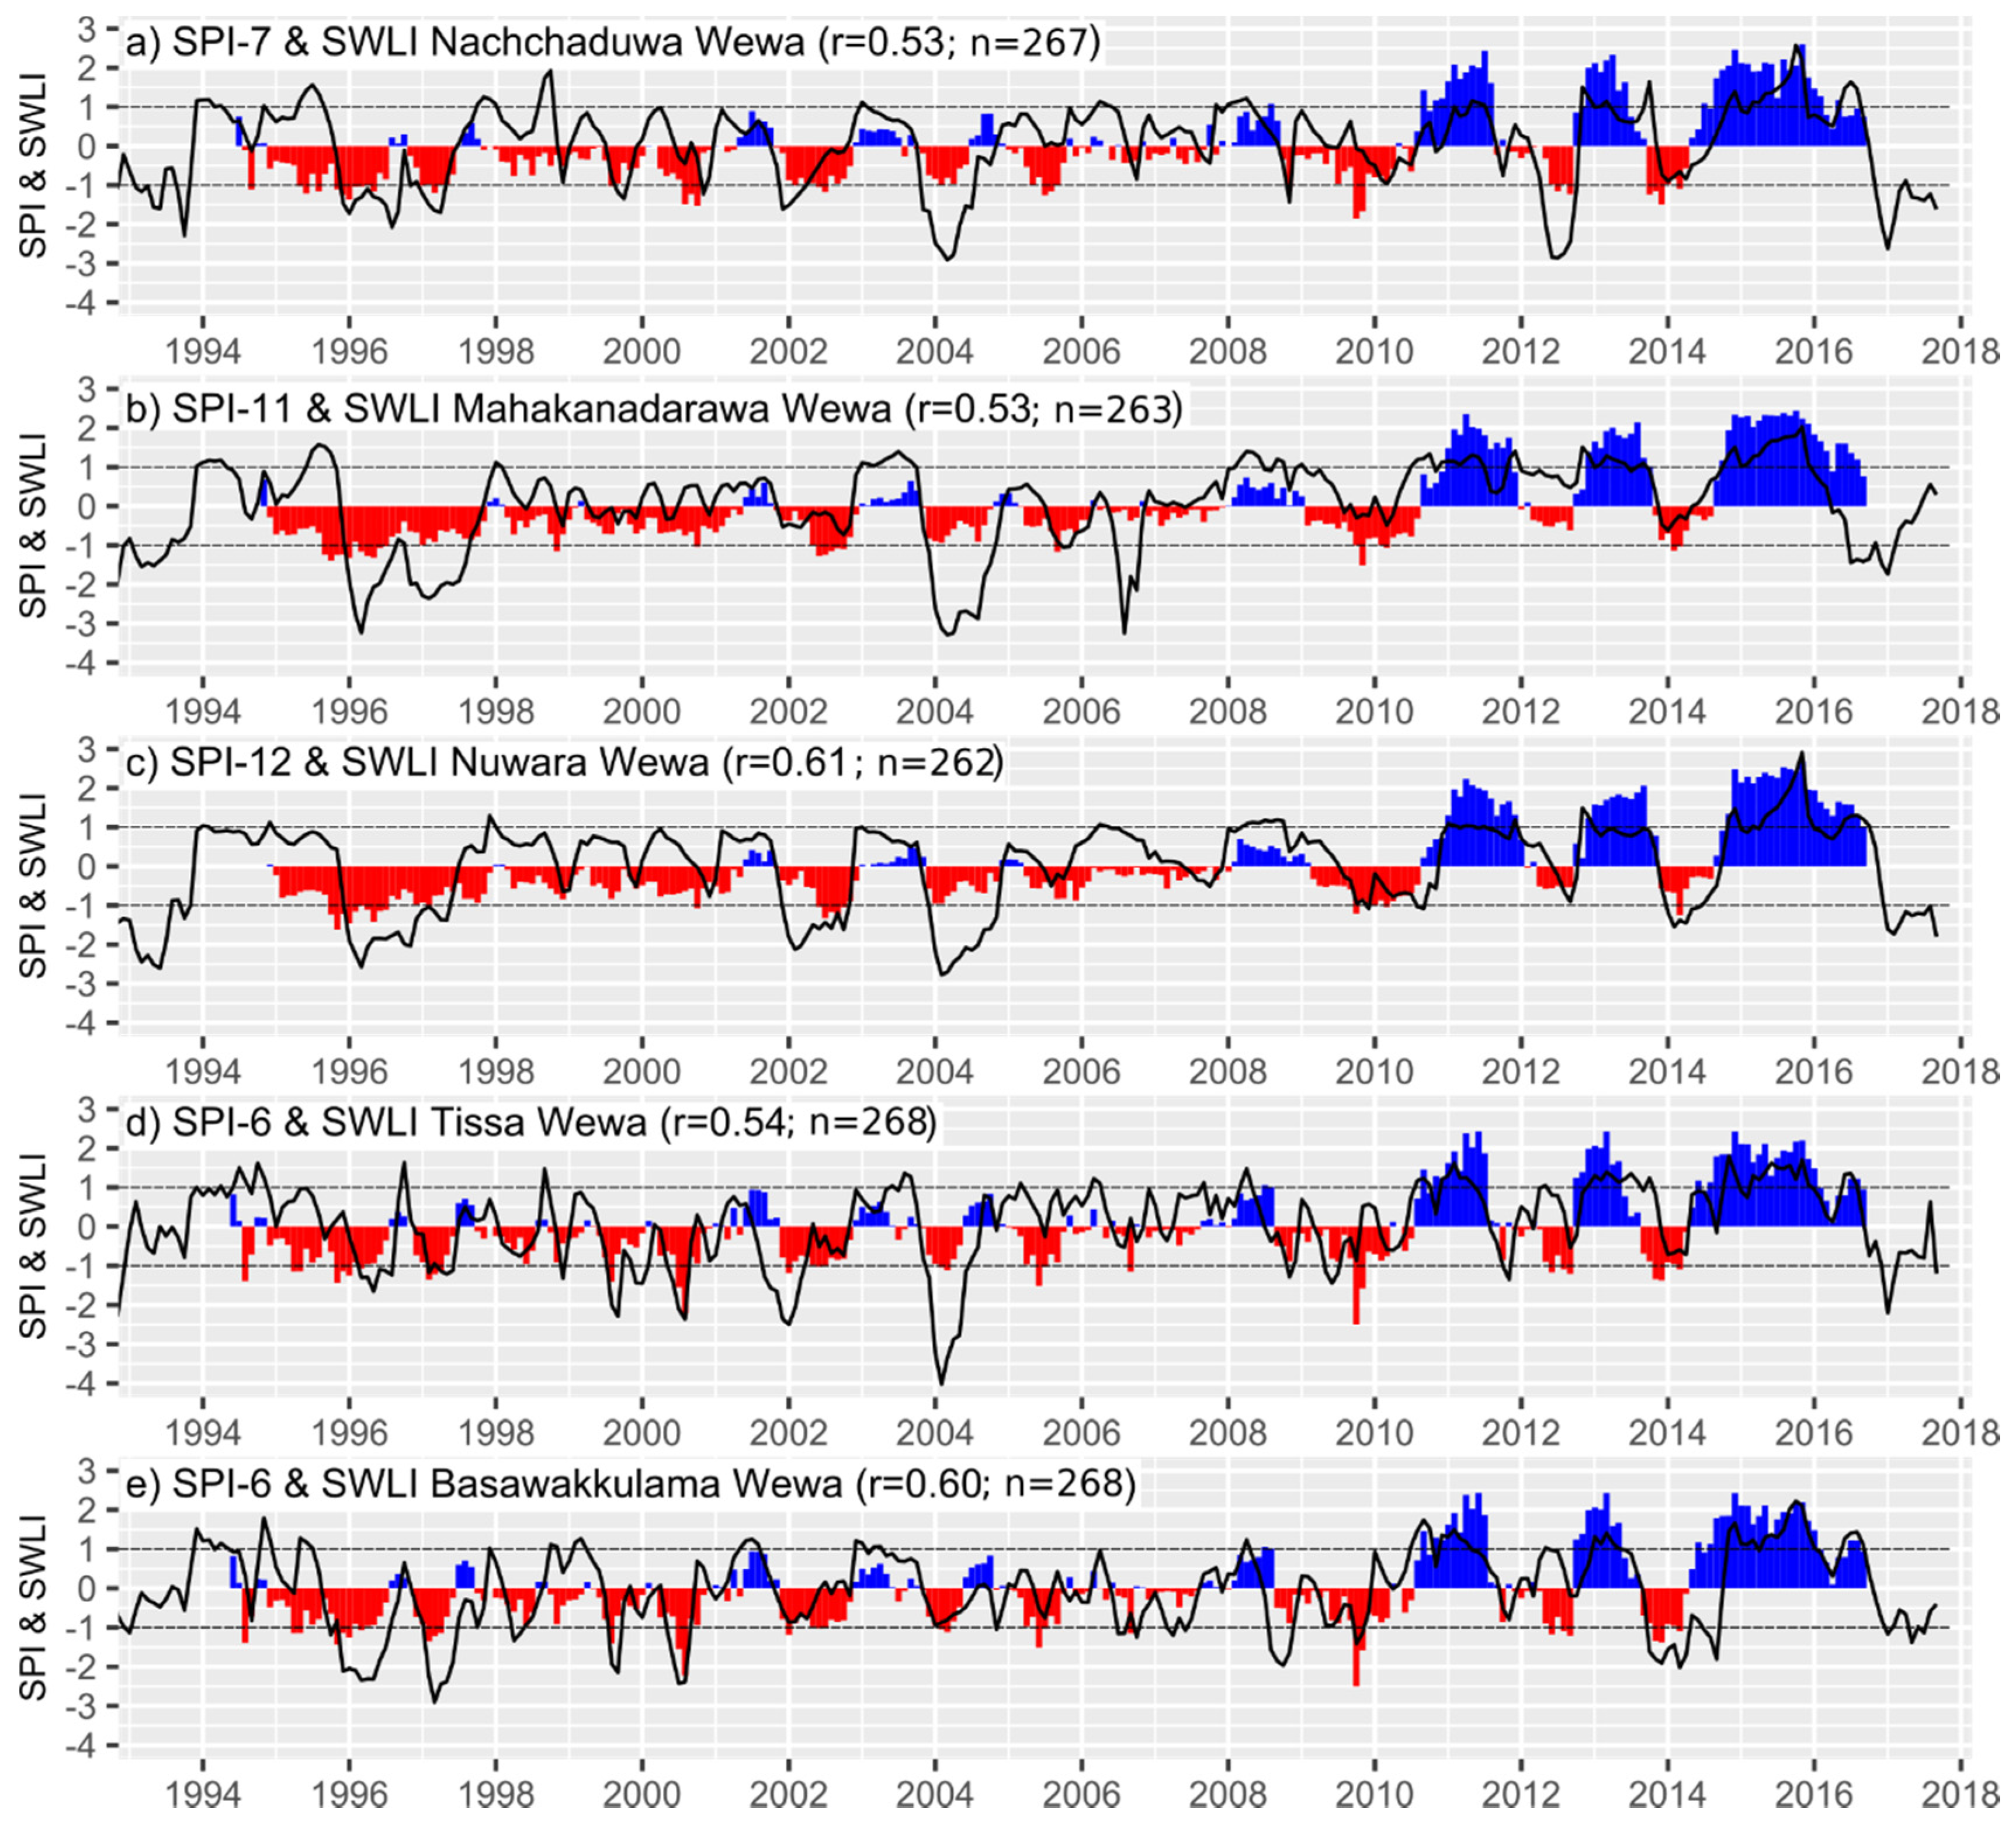
4.4. Relation between SPI and SWLI
5. Discussion
5.1. Methodological Approach and Input Data for SPI and SWLI
5.2. Dependence of Water Level on Precipitation
6. Conclusions
Supplementary Materials
Author Contributions
Funding
Acknowledgments
Conflicts of Interest
References
- Mahatantila, K.; Chandrajith, R.; Jayasena, H.A.H.; Ranawana, K.B. Spatial and temporal changes of hydrogeochemistry in ancient tank cascade systems in Sri Lanka: evidence for a constructed wetland. Water Environ. J. 2008, 22, 17–24. [Google Scholar] [CrossRef]
- Jayatilaka, C.J.; Sakthivadivel, R.; Shinogi, Y.; Makin, I.W.; Witharana, P. A simple water balance modelling approach for determining water availability in an irrigation tank cascade system. J. Hydrol. 2003, 273, 81–102. [Google Scholar] [CrossRef]
- Murray, F. Potential for Aquaculture in Community-Managed Irrigation Systems of the Dry-Zone, Sri Lanka: Impacts on Livelihoods of the Poor. Ph.D. Thesis, University of Stirling, Stirling, UK, 2004. [Google Scholar]
- Bebermeier, W.; Meister, J.; Withanachchi, C.R.; Middelhaufe, I.; Schütt, B. Tank cascade systems as a sustainable measure of watershed management in South Asia. Water 2017, 9, 231. [Google Scholar] [CrossRef] [Green Version]
- Abeywardana, N.; Schütt, B.; Wagalawatta, T.; Bebermeier, W. Indigenous agricultural systems in the dry zone of Sri Lanka: Management transformation assessment and sustainability. Sustainability 2019, 11, 910. [Google Scholar] [CrossRef] [Green Version]
- Zubair, L. Modernisation of Sri Lanka’s traditional irrigation systems and sustainability. Sci. Technol. Soc. 2005, 10, 161–195. [Google Scholar] [CrossRef]
- Survey Department of Sri Lanka. The National Atlas of Sri Lanka, 2nd ed.; Survey Department of Sri Lanka: Colombo, Sri Lanka, 2007; p. 243.
- Vanacker, V.; Von Blanckenburg, F.; Hewawasam, T.; Kubik, P.W. Constraining landscape development of the Sri Lankan escarpment with cosmogenic nuclides in river sediment. Earth Planet. Sci. Lett. 2007, 253, 402–414. [Google Scholar] [CrossRef]
- Muthuwatta, L.; Chemin, Y. Vegetation growth zonation of Sri Lanka for improved water resources planning. Agric. Water Manag. 2003, 58, 123–143. [Google Scholar] [CrossRef]
- Moorman, F.; Panabokke, C. Soils of Ceylon. A new approach to the identification and classification of the soils of Ceylon. Trop. Agric. 1961, 117, 5–65. [Google Scholar]
- Schütt, B.; Bebermeier, W.; Meister, J.; Withanachchi, C.R. Characterisation of the Rota Wewa Tank Cascade System in the Vicinity of Anuradhapura, Sri Lanka. DIE ERDE J. Geogr. Soc. Berl. 2013, 144, 51–68. [Google Scholar] [CrossRef]
- Kottek, M.; Grieser, J.; Beck, C.; Rudolf, B.; Rubel, F. World Map of the Köppen-Geiger climate classification updated. Meteorol. Z. 2006, 15, 259–263. [Google Scholar] [CrossRef]
- Domroes, M.; Ranatunge, E. A statistical approach towards a regionalization of daily rainfall in Sri Lanka. Int. J. Clim. 1993, 13, 741–754. [Google Scholar] [CrossRef]
- Panabokke, C.R.; Sakthivadivel, R.; Weerasinghe, A.D. Evolution, Present Status and Issues Concerning Small Tank Systems in Sri Lanka; International Water Management Institute (IWMI): Colombo, Sri Lanka, 2002; p. 72. [Google Scholar]
- Sakthivadivel, R.; Fernando, N.; Panabokke, C.R.; Wijayaratna, C.M. Nature of Small Tank Cascade Systems and a Framework for Rehabilitation of Tanks within Them; International Irrigation Management Institute (IIMI): Colombo, Sri Lanka, 1996; p. 54. [Google Scholar]
- Jayamaha, G.S. An analysis of droughts in Sri Lanka. Proc. Indian Natl. Sci. Acad. 1975, 42, 133–148. [Google Scholar]
- Lyon, B.; Zubair, L.; Ralapanawe, V.; Yahiya, Z. Finescale evaluation of drought in a tropical setting: Case study in Sri Lanka. J. Appl. Meteorol. Clim. 2009, 48, 77–88. [Google Scholar] [CrossRef]
- Sheffield, J.; Wood, E.F. Characteristics of global and regional drought, 1950–2000: Analysis of soil moisture data from off-line simulation of the terrestrial hydrologic cycle. J. Geophys. Res. Space Phys. 2007, 112, 1–21. [Google Scholar] [CrossRef]
- Basnayake, B.K. Droughts in the Dry Zone of Sri Lanka. In Irrigation and Water Resources; Postgraduate Institute of Agriculture, University of Peradeniya: Peradeniya, Sri Lanka, 1990; pp. 18–39. [Google Scholar]
- Thierer, T.; Klima. Version 0.9. 1999. Available online: http://www.tobias-thierer.de/download.html (accessed on 23 July 2020).
- Hewavisenthi, A.C.D.S. Management of the Mahaweli, A River in Sri Lanka. Water Int. 1997, 22, 98–107. [Google Scholar] [CrossRef]
- Sakthivadivel, R.; Fernando, N.; Brewer, J.D. Rehabilitation Planning for Small Tanks in Cascades: A Methodology Based on Rapid Assessment; International Irrigation Management Institute (IIMI): Colombo, Sri Lanka, 1997; p. 32. [Google Scholar]
- Lorenzo-Lacruz, J.; Vicente-Serrano, S.M.; López-Moreno, J.I.; Beguería, S.; García-Ruiz, J.M.; Cuadrat, J.M. The impact of droughts and water management on various hydrological systems in the headwaters of the Tagus River (central Spain). J. Hydrol. 2010, 386, 13–26. [Google Scholar] [CrossRef] [Green Version]
- McKee, T.B.; Doesken, N.J.; Kleist, J. The relationship of drought frequency and duration to time scales. In Proceedings of the Eighth Conference on Applied Climatology, Anaheim, CA, USA, 17–22 January 1993; American Meteorological Society: Anaheim, CA, USA; pp. 179–184. [Google Scholar]
- R Core Team. R: A Language and Environment for Statistical Computing; R Foundation for Statistical Computing: Vienna, Austria, 2018; Available online: https://www.r-project.org/ (accessed on 23 July 2020).
- Irrigation Department—Sri Lanka. Available online: https://www.irrigation.gov.lk/images/pdf/downloads/Hydro_Annual/2013_14.pdf (accessed on 23 July 2020).
- Irrigation Department—Sri Lanka. Available online: https://www.irrigation.gov.lk/images/pdf/downloads/hydrological%20ann%2014-15.pdf (accessed on 23 July 2020).
- Irrigation Department—Sri Lanka. Available online: https://www.irrigation.gov.lk/images/pdf/downloads/Hydro_Annual/2015-16.pdf (accessed on 23 July 2020).
- Svoboda, M.; Hayes, M.; Wood, D. Standardized Precipitation Index User Guide; World Meteorological Organization (WMO): Geneva, Switzerland, 2012; p. 16. [Google Scholar]
- Mishra, A.K.; Singh, V.P. A review of drought concepts. J. Hydrol. 2010, 391, 202–216. [Google Scholar] [CrossRef]
- Beguería, S.; Vicente-Serrano, S.M. SPEI: Calculation of the Standardized Precipitation-Evapotranspiration Index. R Package Version 1.7. 2017. Available online: https://CRAN.R-project.org/package=SPEI (accessed on 23 July 2020).
- Moritz, S.; Bartz-Beielstein, T. imputeTS: Time Series Missing Value Imputation in R. R J. 2017, 9, 207–218. [Google Scholar] [CrossRef] [Green Version]
- Fernando, D.N. Predicting and Monitoring Drought in the Humid Tropics: A Case Study on Sri Lanka. Ph.D. Thesis, Rutgers, The State University of New Jersey, New Brunswick, NJ, USA, 2010. [Google Scholar]
- Wuensch, K.L.; Evans, J.D. Straightforward statistics for the behavioral sciences. J. Am. Stat. Assoc. 1996, 91, 1750. [Google Scholar] [CrossRef]
- Guttman, N.B. On the sensitivity of sample L-moments to sample size. J. Clim. 1994, 7, 1026–1029. [Google Scholar] [CrossRef]
- Vicente-Serrano, S.M.; López-Moreno, J.I. Hydrological response to different time scales of climatological drought: an evaluation of the Standardized Precipitation Index in a mountainous Mediterranean basin. Hydrol. Earth Syst. Sci. 2005, 9, 523–533. [Google Scholar] [CrossRef] [Green Version]
- Hayes, M.J.; Svoboda, M.D.; Wilhite, D.A.; Vanyarkho, O.V. Monitoring the 1996 Drought Using the Standardized Precipitation Index. Bull. Am. Meteorol. Soc. 1999, 80, 429–438. [Google Scholar] [CrossRef] [Green Version]
- Keyantash, J.; Dracup, J.A. The Quantification of Drought: An evaluation of drought indices. Bull. Am. Meteorol. Soc. 2002, 83, 1167–1180. [Google Scholar] [CrossRef]
- Vicente-Serrano, S.M.; Beguería, S.; López-Moreno, J.I. A multiscalar drought index sensitive to global warming: The standardized precipitation evapotranspiration index. J. Clim. 2010, 23, 1696–1718. [Google Scholar] [CrossRef] [Green Version]
- Maingi, J.K.; Marsh, S.E. Quantifying hydrologic impacts following dam construction along the Tana River, Kenya. J. Arid. Environ. 2002, 50, 53–79. [Google Scholar] [CrossRef]
- Montaseri, M.; Niu, J. A graphical rule for volumetric evaporation loss correction in reservoir capacity-yield-performance planning in Urmia Region, Iran. Water Resour. Manag. 2004, 18, 55–74. [Google Scholar] [CrossRef]
- Syed, T.H.; Famiglietti, J.S.; Rodell, M.; Chen, J.; Wilson, C.R. Analysis of terrestrial water storage changes from GRACE and GLDAS. Water Resour. Res. 2008, 44, 1–15. [Google Scholar] [CrossRef]
- Ekanayake, E.; Perera, K. Analysis of drought severity and duration using copulas in Anuradhapura, Sri Lanka. Br. J. Environ. Clim. Chang. 2014, 4, 312–327. [Google Scholar] [CrossRef]
- The Emergency Events Database (EM-DAT); Centre for Research on the Epidemiology of Disasters (CRED). Available online: www.emdat.be (accessed on 23 July 2020).
- Modarres, R. Streamflow drought time series forecasting. Stoch. Environ. Res. Risk Assess. 2006, 21, 223–233. [Google Scholar] [CrossRef]
- Bhuiyan, C. Various Drought indices for monitoring drought condition in Aravalli Terrain of India. In Proceedings of the XXth ISPRS-International Society for Photogrammetry and Remote Sensing Congress, Istanbul, Turkey, 12–23 July 2004; pp. 1283–1288. [Google Scholar]
- Gusyev, M.A.; Hasegawa, A.; Magome, J.; Kuribayashi, D.; Sawano, H.; Lee, S. Drought assessment in the Pampanga River Basin, Philippines. Part 1: Characterizing a role of dam infrastructure in historical droughts with standardized indices. In Proceedings of the 21st International Congress on Modelling and Simulation (MODISM), Gold Coast, Queensland, Australia, 29 November–4 December 2015; pp. 1586–1592. [Google Scholar] [CrossRef]
- Navarathinam, K.; Gusyev, M.A.; Hasegawa, A.; Magome, J.; Takeuchi, K. Agricultural flood and drought risk reduction by a proposed multi-purpose dam: A case study of the Malwathoya River Basin, Sri Lanka. In Proceedings of the 21st International Congress on Modeling and Simulation (MODISM), Gold Coast, Queensland, Australia, 29 November–4 December 2015; pp. 1600–1606. [Google Scholar] [CrossRef]
- Komuscu, A.U. Using the SPI to Analyze Spatial and Temporal Patterns of Drought in Turkey. Drought Netw. News 1999, 11, 7–13. [Google Scholar]
- Panabokke, C.R. Characterization and Monitoring of the Regolith Aquifer within Four Selected Cascades (Sub-Watersheds) of the Malala Oya Basin [Sri Lanka]; International Water Management Institute (IWMI): Colombo, Sri Lanka, 2007. [Google Scholar]
- Panabokke, C.R. Groundwater Conditions in Sri Lanka. A Geomorphic Perspective; National Science Foundation of Sri Lanka: Colombo, Sri Lanka, 2007; p. 149. [Google Scholar]
- Edirisinghe, E.A.N.V.; Pitawala, H.M.T.G.A.; Dharmagunawardhane, H.A.; Wijayawardane, R.L. Isotopic variations in natural water and groundwater recharge conditions in the Kalaoya Basin, Sri Lanka. Ceylon J. Sci. Phys. Sci. 2014, 18, 9–16. [Google Scholar]
- Bastiaanssen, W.; Chandrapala, L. Water balance variability across Sri Lanka for assessing agricultural and environmental water use. Agric. Water Manag. 2003, 58, 171–192. [Google Scholar] [CrossRef]
- Zoysa, D.S.S.; Weerasinghe, T.K. Study on the Chemical and Biological Status of Malwatu Oya Basin, Anuradhapura in Sri Lanka. Br. J. Environ. Sci. 2016, 4, 1–10. [Google Scholar]
- Chandrathilaka, W.A. Water resources management in Mahaweli & adjoining river basins in Sri Lanka. In Proceedings of the Asia Water Week 2013: Securing Water for All, Manila, Philippines, 11–15 May 2013. [Google Scholar]
- Ray, H.C. History of Ceylon; Ceylon University Press: Colombo, Sri Lanka, 1960. [Google Scholar]
- Siriweera, W.I. History of Sri Lanka: From Earliest Times up to the Sixteenth Century; Dayawansa Jayakody & Company: Colombo, Sri Lanka, 2002; p. 368. [Google Scholar]
- Risberg, J.; Myrdal-Runebjer, E.; Miller, U. Sediment and soil characteristics and an evaluation of their applicability to the irrigation history in Sigiriya, Sri Lanka. J. Nord. Archaeol. Sci. 2002, 13, 27–42. [Google Scholar]
- López-Moreno, J.I.; Beguería, S.; García-Ruiz, J.M. The Management of a Large Mediterranean Reservoir: Storage Regimens of the Yesa Reservoir, Upper Aragon River Basin, Central Spanish Pyrenees. Environ. Manag. 2004, 34, 508–515. [Google Scholar] [CrossRef]


| Nachcha-Duwa Wewa | Mahakana-Darawa Wewa | Nuwara Wewa | Tissa Wewa | Basawak-Kulama Wewa | |
|---|---|---|---|---|---|
| Area at fsl. [ha] *: | 1780 | 1457 | 1198 | 212 | 107 |
| Vol at fsl. [MCM] *: | 55.7 | 44.59 | 44.47 | 4.32 | 2.07 |
| Dead storage Volume [MCM] *: | 0.12 | 4.67 | 1.23 | 0.32 | 0.01 |
| Catchment Area [ha] *: | 62,300 | 32,634 | 8418 | 518 | 932 |
| Command area [ha] *: | 2822 | 2428 | 917 | 365 | 186 |
| Mahaweli inflow *: | yes | no | yes | yes | yes |
| No. of major tanks upstream **: | 2 | 0 | 0 | 0 | 0 |
| No. of medium tanks upstream **: | 8 | 7 | 0 | 0 | 0 |
| No. of minor tanks upstream **: | 248 | 211 | 28 | 1 | 1 |
| No. of micro tanks upstream **: | 26 | 27 | 2 | 0 | 0 |
| Ca. Vol of Tanks upstream [MCM] ***: | 37.83 | 24.00 | 2.50 | 0.02 | 0.03 |
| Tank: | Days with Water-Level Data | Days with No Water-Level Data | NA [%] |
|---|---|---|---|
| Nachchaduwa Wewa | 9752 | 373 | 3.7 |
| Mahakanadarawa Wewa | 9492 | 633 | 6.3 |
| Nuwara Wewa | 9974 | 151 | 1.5 |
| Tissa Wewa | 9964 | 161 | 1.6 |
| Basawakkulama Wewa | 9913 | 212 | 2.1 |
| SPI Values | Category | SWLI Values | Category |
|---|---|---|---|
| ≥2.00 | Extreme humid | ≥2.00 | Extreme high water level |
| 1.50–1.99 | Severe humid | 1.50–1.99 | Severe high water level |
| 1.00–1.49 | Moderate humid | 1.00–1.49 | Moderate high water level |
| 0.99–−0.99 | Near normal | 0.99–−0.99 | Near normal water level |
| −1.00–−1.49 | Moderate drought | −1.00–−1.49 | Moderate low water level |
| −1.50–−1.99 | Severe drought | −1.50–−1.99 | Severe low water level |
| ≤−2.00 | Extreme drought | ≤−2.00 | Extreme low water level |
| Tank: | Turn of the Year | |||||||
|---|---|---|---|---|---|---|---|---|
| Nachchaduwa Wewa | 95/96 | 96/97 | 01/02 | 03/04 | (09/10) | 13/14 | 16/17 | |
| Mahakanadarawa Wewa | 96/97 | (01/02) | 03/04 | (09/10) | 13/14 | (16/17) | ||
| Nuwara Wewa | 92/93 | 95/96 | 96/97 | 01/02 | 03/04 | (09/10) | 13/14 | 16/17 |
| Tissa Wewa | 01/02 | 03/04 | (13/14) | 16/17 | ||||
| Basawakkulama Wewa | (92/93) | 95/96 | 96/97 | 01/02 | 03/04 | 13/14 | 16/17 | |
| SPI | ||||||
| SPI Values | Category | 3-Month | 6-Month | 9-Month | 12-Month | 24-Month |
| ≥2.00 | Extreme humid | 4 | 3 | 3 | 3 | 1 |
| 1.50–1.99 | Severe humid | 2 | 0 | 0 | 0 | 0 |
| 1.00–1.49 | Moderate humid | 5 | 1 | 0 | 0 | 0 |
| 0.99–−0.99 | Near normal | 46 | 35 | 20 | 11 | 8 |
| −1.00–−1.49 | Moderate drought | 12 | 9 | 6 | 4 | 0 |
| −1.50–−1.99 | Severe drought | 6 | 1 | 2 | 1 | 1 |
| ≤−2.00 | Extreme drought | 3 | 2 | 0 | 0 | 0 |
| Number of Periods for: | ||||||
|---|---|---|---|---|---|---|
| SWLI Values | Category of Water Level | Nachcha-Duwa Wewa | Mahakana-Darawa Wewa | Nuwara Wewa | Tissa Wewa | Basawa-Kulama Wewa |
| ≥2.00 | Extreme high | 1 | 1 | 1 | 0 | 1 |
| 1.50–1.99 | Severe high | 3 | 1 | 0 | 4 | 3 |
| 1.00–1.49 | Moderate high | 6 | 5 | 7 | 7 | 10 |
| 0.99–−0.99 | Near normal | 27 | 24 | 16 | 35 | 32 |
| −1.00–−1.49 | Moderate low | 3 | 1 | 3 | 8 | 7 |
| −1.50–−1.99 | Severe low | 1 | 3 | 2 | 2 | 1 |
| ≤−2.00 | Extreme low | 5 | 3 | 4 | 6 | 5 |
Publisher’s Note: MDPI stays neutral with regard to jurisdictional claims in published maps and institutional affiliations. |
© 2020 by the authors. Licensee MDPI, Basel, Switzerland. This article is an open access article distributed under the terms and conditions of the Creative Commons Attribution (CC BY) license (http://creativecommons.org/licenses/by/4.0/).
Share and Cite
Saase, R.; Schütt, B.; Bebermeier, W. Analyzing the Dependence of Major Tanks in the Headwaters of the Aruvi Aru Catchment on Precipitation. Applying Drought Indices to Meteorological and Hydrological Data. Water 2020, 12, 2941. https://doi.org/10.3390/w12102941
Saase R, Schütt B, Bebermeier W. Analyzing the Dependence of Major Tanks in the Headwaters of the Aruvi Aru Catchment on Precipitation. Applying Drought Indices to Meteorological and Hydrological Data. Water. 2020; 12(10):2941. https://doi.org/10.3390/w12102941
Chicago/Turabian StyleSaase, Robin, Brigitta Schütt, and Wiebke Bebermeier. 2020. "Analyzing the Dependence of Major Tanks in the Headwaters of the Aruvi Aru Catchment on Precipitation. Applying Drought Indices to Meteorological and Hydrological Data" Water 12, no. 10: 2941. https://doi.org/10.3390/w12102941